
 Open Access Article
 This Open Access Article is licensed under a
 Creative Commons Attribution 3.0 Unported Licence
Two electrolyte decomposition pathways at nickel-rich cathode surfaces in lithium-ion batteries†
Bernardine L. D.
Rinkel
 a,
J. Padmanabhan
Vivek
bc,
Nuria
Garcia-Araez
bc and
Clare P.
Grey
*ac
a,
J. Padmanabhan
Vivek
bc,
Nuria
Garcia-Araez
bc and
Clare P.
Grey
*ac
aDepartment of Chemistry, University of Cambridge, Cambridge CB2 1EW, UK. E-mail: cpg27@cam.ac.uk
bSchool of Chemistry, University of Southampton, Southampton SO17 1BJ, UK
cThe Faraday Institution, Harwell Campus, Didcot OX11 0RA, UK
First published on 5th July 2022
Abstract
Preventing the decomposition reactions of electrolyte solutions is essential for extending the lifetime of lithium-ion batteries. However, the exact mechanism(s) for electrolyte decomposition at the positive electrode, and particularly the soluble decomposition products that form and initiate further reactions at the negative electrode, are still largely unknown. In this work, a combination of operando gas measurements and solution NMR was used to study decomposition reactions of the electrolyte solution at NMC (LiNixMnyCo1−x−yO2) and LCO (LiCoO2) electrodes. A partially delithiated LFP (LixFePO4) counter electrode was used to selectively identify the products formed through processes at the positive electrodes. Based on the detected soluble and gaseous products, two distinct routes with different onset potentials are proposed for the decomposition of the electrolyte solution at NMC electrodes. At low potentials (<80% state-of-charge, SOC), ethylene carbonate (EC) is dehydrogenated to form vinylene carbonate (VC) at the NMC surface, whereas at high potentials (>80% SOC), 1O2 released from the transition metal oxide chemically oxidises the electrolyte solvent (EC) to form CO2, CO and H2O. The formation of water via this mechanism was confirmed by reacting 17O-labelled 1O2 with EC and characterising the reaction products via1H and 17O NMR spectroscopy. The water that is produced initiates secondary reactions, leading to the formation of the various products identified by NMR spectroscopy. Noticeably fewer decomposition products were detected in NMC/graphite cells compared to NMC/LixFePO4 cells, which is ascribed to the consumption of water (from the reaction of 1O2 and EC) at the graphite electrode, preventing secondary decomposition reactions. The insights on electrolyte decomposition mechanisms at the positive electrode, and the consumption of decomposition products at the negative electrode contribute to understanding the origin of capacity loss in NMC/graphite cells, and are hoped to support the development of strategies to mitigate the degradation of NMC-based cells.
Broader contextThe development of rechargeable batteries with longer lifetimes represents a major challenge in enabling the shift from fossil fuel-powered to electric vehicles. Ni-rich layered positive electrode materials are now universally used in electric vehicle batteries and yet their degradation pathways are still not understood. One major cause of the loss in capacity of these batteries is linked with the decomposition of the electrolyte solution, and the subsequent reactions of these products at the negative electrode, a process referred to as “electrode cross-talk”. In the present work, we characterise the electrolyte decomposition products formed at LiNixMnyCo1−x−yO2 (NMC) positive electrodes using solution NMR spectroscopy and operando gas measurements. We generate 17O-labelled singlet oxygen (1O2) photochemically and use it to investigate proposed electrolyte decomposition pathways. Two main and distinct decomposition mechanisms are identified, each with a different onset voltage, and very different decomposition products. Characterisation of NMC/graphite “full cells” reveals that many of the products formed at the NMC electrode are consumed at the negative electrode, emphasising the importance of studying electrode cross-talk processes to understand the origin of capacity loss in NMC/graphite batteries. |
1 Introduction
The use of Ni-rich layered transition metal oxides (e.g., LiNixMnyCo1−x−yO2, NMC) as positive electrode materials in lithium-ion battery packs is favoured over LiCoO2 due to their higher energy densities, and because cobalt, with its toxicity, cost and mining issues, is largely replaced with nickel.1–3 However, batteries using these Ni-rich NMCs and a graphite negative electrode suffer from rapid capacity fade, limiting the lifetime of the battery.3–5 This is often ascribed to degradation mechanisms at the positive electrode, including reconstruction of the surface layers and concomitant loss of lattice oxygen,4,6,7 electrolyte oxidation,4,8–11 transition metal dissolution and deposition on the negative electrode,12–15 and cracking of the electrode particles,16–18 all leading to an impedance rise and loss of active material at the positive electrode.19–21 However, analysis of electrochemical data (incremental capacity analysis, ICA, differential voltage analysis, DVA, and coulombic efficiency measurements) have clearly shown that the dominant source for the capacity loss in NMC and NCA/graphite cells is due to the loss of active lithium inventory due to parasitic reactions that occur at the graphite electrode.22–27The rate of capacity fade increases proportionally with a higher Ni-content in the positive electrode material,3 suggesting that even though the capacity loss might be directly due to side reactions at the negative electrode, it may be indirectly or in part due to processes at the positive electrode. In particular, electrolyte decomposition products formed at the positive electrode diffuse to the negative electrode where they are reduced and deposited, in a process called “electrode cross-talk”.21,26,28–33 The reduction of those oxidation products at the negative electrode may consume active lithium ions and/or electrons,30–32 and the deposition of those products can limit ion transport to the bulk of the negative electrode,24,26 both of which can make significant contributions to the capacity fade.
Several mechanisms have been proposed for electrolyte decomposition at the positive electrode, each with a different onset potential and resulting in the formation of different products. Electrochemical (or faradaic) oxidation has been reported to occur at potentials greater than ∼5 V vs. Li+/Li, resulting in the formation of CO2 (measured), acetaldehyde, ethylene oxide and various radical species (predicted by density functional theory (DFT) calculations).34–40 Gasteiger and co-workers proposed an alternative route involving the chemical oxidation of the electrolyte solvent by reactive oxygen species. Using emission spectroscopy and on-line electrochemical mass spectrometry (OEMS) measurements, it was revealed that reactive oxygen species (singlet oxygen, 1O2) are released from the transition metal oxide (TMO) lattice at high states of delithiation (state of charge, SOC, >80%) and it was proposed that these species chemically oxidise the electrolyte, producing CO2 and CO gas and water.4,6,8,9 The onset potential for this mechanism is material dependent: ∼4.3 V vs. Li+/Li for NMC811, ∼4.7 V vs. Li+/Li for NMC622 and NMC111,4,8 and it is correlated with surface reconstruction phenomena resulting in the release of lattice oxygen.41 Unfortunately, CO2 and CO are “generic” reaction products, and – without knowledge of the soluble products that form – do not provide a thorough understanding of how the electrolyte solution is decomposed. Recently, Shao-Horn and co-workers proposed a third pathway based on DFT calculations, where EC is dehydrogenated on the surface of the positive electrode.42–44In situ Fourier-transform infrared spectroscopy (FT-IR) revealed the formation of VC, dehydrogenated EC and dehydrogenated oligomers on the surface of NMC811 electrodes at potentials as low as 3.8 V vs. Li+/Li.45 However, it remains unclear what decomposition products form, how they are formed, and which electrolyte decomposition pathways are dominant and most detrimental to the cell lifetime. Furthermore, since it is still not clear what decomposition products (particularly the soluble products) are formed at the positive electrode, it is challenging to investigate cross-talk effects and to fully understand what drives the capacity fade in Ni-rich NMC/graphite cells.
This work reveals not one, but two distinct mechanisms for electrolyte decomposition at NMC electrodes, each with a different onset potential. The soluble electrolyte decomposition products formed at LiNi1/3Mn1/3Co1/3O2 (NMC111), LiNi0.5Mn0.3Co0.2O2 (NMC532), LiNi0.6Mn0.2Co0.2O2 (NMC622), LiNi0.8Mn0.1Co0.1O2 (NMC811), and LiCoO2 (LCO) electrodes are identified for the first time using solution NMR spectroscopy. Partially delithiated LFP (LiFePO4) counter electrodes are used to identify the species formed at NMC electrodes, as LFP neither produces or consumes electrolyte decomposition products.46–51 Complementary operando pressure and OEMS measurements are performed to provide a more complete picture of the various decomposition products that are formed, and the combined NMR and gas results are subsequently used to infer the decomposition reactions that occur. At low potentials (<80% SOC), EC is dehydrogenated to VC, without the release of gaseous decomposition products. At high potentials (i.e., >80% SOC), 1O2 chemically oxidises EC to produce CO2 and CO gas, and H2O. The onset potential for this route thus depends on the material's oxygen evolution potential. The water that is formed through the reaction between EC and 1O2 results in further decomposition of the electrolyte solution and various species that are identified by NMR spectroscopy. The formation of water in this mechanism is confirmed by reacting photochemically-generated 17O-labelled 1O2 with EC and characterising the products via1H and 17O NMR. Finally, the products formed in NMC/graphite cells are compared to those formed at the NMC electrode. Fewer products are observed in the NMC/graphite cells, which is ascribed to the reduction of the water (formed through the reaction between 1O2 and EC) at the graphite electrode.
2 Experimental
2.1 Electrodes and electrolytes
For the NMR measurements, NMC111, NMC532, NMC622, NMC811, and LCO electrodes were prepared by grinding the active material powder (Targray), Super P carbon (Timcal), and Kynar polyvinylidene difluoride (PVDF, Arkerma) in an 8![[thin space (1/6-em)]](https://www.rsc.org/images/entities/char_2009.gif) :1:1 mass ratio with an agate mortar and pestle. Graphite electrodes were prepared by mixing the active material (Targray), Super P carbon and polyvinylidene difluoride (PVDF) in a 92:2:6 ratio. N-Methyl-2-pyrrolidone (NMP, 99.5%, anhydrous, Sigma-Aldrich) was added to form a slurry, which was mixed in an agate mortar and pestle and then blade-coated at a wet film thickness of 300 μm on an aluminium (NMCs and LCO) or copper (graphite) foil current collector. The films were dried at 60 °C until most of the solvent was removed and were subsequently dried at 100 °C for 16 hours. The LCO, NMC111 and graphite electrodes were prepared in an ambient atmosphere, whereas the NMC532, NMC622 and NMC811 electrodes were prepared in an argon-filled glovebox (O2 and H2O < 1 ppm, MBraun), as these Ni-rich active materials react with CO2 and H2O to form undesirable carbonates and hydroxide surface groups.52 Disks of the desired size were cut (active material loading 5–6 mg cm−2 for NMCs and LCO, 4.5 mg cm−2 for graphite) and dried further at 100 °C under vacuum for 24 hours, before being transferred into an argon-filled glovebox (O2 and H2O < 1 ppm; MBraun). Commercially sourced LFP electrodes (LiFePO4, PI-KEM, 12 mg cm−2) were cut to the desired size (n:p ratio ≈ 1.5 for NMC/LFP and LCO/LFP cells) and dried at 100 °C under vacuum for 24 hours, after which they were transferred into an argon-filled glovebox.
:1:1 mass ratio with an agate mortar and pestle. Graphite electrodes were prepared by mixing the active material (Targray), Super P carbon and polyvinylidene difluoride (PVDF) in a 92:2:6 ratio. N-Methyl-2-pyrrolidone (NMP, 99.5%, anhydrous, Sigma-Aldrich) was added to form a slurry, which was mixed in an agate mortar and pestle and then blade-coated at a wet film thickness of 300 μm on an aluminium (NMCs and LCO) or copper (graphite) foil current collector. The films were dried at 60 °C until most of the solvent was removed and were subsequently dried at 100 °C for 16 hours. The LCO, NMC111 and graphite electrodes were prepared in an ambient atmosphere, whereas the NMC532, NMC622 and NMC811 electrodes were prepared in an argon-filled glovebox (O2 and H2O < 1 ppm, MBraun), as these Ni-rich active materials react with CO2 and H2O to form undesirable carbonates and hydroxide surface groups.52 Disks of the desired size were cut (active material loading 5–6 mg cm−2 for NMCs and LCO, 4.5 mg cm−2 for graphite) and dried further at 100 °C under vacuum for 24 hours, before being transferred into an argon-filled glovebox (O2 and H2O < 1 ppm; MBraun). Commercially sourced LFP electrodes (LiFePO4, PI-KEM, 12 mg cm−2) were cut to the desired size (n:p ratio ≈ 1.5 for NMC/LFP and LCO/LFP cells) and dried at 100 °C under vacuum for 24 hours, after which they were transferred into an argon-filled glovebox.
For the operando pressure measurements and on-line electrochemical mass spectrometry (OEMS) measurements, the electrodes were coated on a fine steel mesh (SS316 grade, The Mesh Company) to allow better gas diffusion from both sides of the electrode. NMC electrodes were prepared by mixing the active material powder (Targray), PVDF (PVDF 5130, Solvay), and Super C65 conductive carbon black (Timcal), in 90:5:5 mass ratio, and NMP (Sigma-Aldrich, 99.5%, anhydrous) was added to this to form a slurry. Partially delithiated iron phosphate (Li0.25FePO4; LixFP) counter electrodes used for the OEMS studies were prepared by mixing LiFePO4, FePO4, PVDF and Super C65 carbon in a 22:66:6:6 mass ratio, as described previously.53 FePO4 was produced by chemical delithiation of LiFePO4 following our previous work (see Fig. S1, ESI† for potential profile).54 The NMC electrodes had active material loadings of 3–4 mg cm−2, and an additional OEMS experiment was done with a higher active material loading of 9 mg cm−2. The Li0.25FePO4 had an active material loading of 15 mg cm−2, thus providing a 1.9 higher capacity than the NMC electrode with loading of 3 mg cm−2. The inks were mixed in a planetary mixer (Thinky ARE-250) three times at 2000 rpm for 5 minutes, with 5 minute breaks in between for cooling. The slurry was then blade-coated on a fine steel mesh using an automatic film coater (MTI, MSK-AFA-III) to a wet thickness of 200 μm. Prior to coating, the steel mesh was calendared to remove creases; an aluminium foil was placed under the mesh during doctor-blading. The slurry coated mesh was then transferred to a vacuum oven and dried at 80 °C for 12 hours. The electrodes were punched in discs of 25 mm using a handheld precision punch (Nogami, Japan), then pressed using a hydraulic pellet press (Specac) at 5 tonne pressure. The electrodes were further dried for 48 hours in a Buchi glass vacuum oven (6 hours at 25 °C, 8 hours at 80 °C, 12 hours at 100 °C then 22 hours at 120 °C) then the sealed glass oven was transferred to an argon filled glovebox (MBraun, Germany; O2 and H2O < 1 ppm). In a similar way, Glass Fibre B separator and partially delithiated LFP counter electrodes (where applicable) were also cut to 25 mm discs then dried and transferred to the glovebox. All the Swagelok cell components were dried under vacuum at 80 °C for 12 hours.
For all cells a 1 M LiPF6 in ethylene carbonate (EC) and dimethyl carbonate (DMC) electrolyte (LP30; EC:DMC = 50:50 (v/v), battery grade, Sigma-Aldrich, or anhydrous, Solvionic) was used, unless otherwise specified. To study the contributions of the EC and DMC solvent separately, electrolyte solutions of 1.5 M LiPF6 (99.9%, Solvionic) in EC (battery grade, ≥99%, <10 ppm H2O, Sigma-Aldrich) and 1 M LiPF6 in DMC (battery grade, ≥99%, <10 ppm H2O, Sigma-Aldrich) were prepared. Electrolytes from Soulbrain of 1 M LiPF6 in EC or 1 M LiPF6 in DMC were also employed. The oxidation of methanol (hydrolysis product of DMC) at NMC and LCO electrodes was investigated by preparing a solution of LP30 + 2% methanol (99.8%, anhydrous, Sigma-Aldrich).
2.2 Two-electrode cells
NMC and LCO electrodes were cycled against partially delithiated LFP (LixFePO4, x < 1) or graphite electrodes in a standard coin cell configuration. Cells using partially delithiated LFP as the negative electrode were used to selectively identify the decomposition products formed at the positive electrode (NMC or LCO), as the LFP electrode should not produce or consume electrolyte decomposition products. LFP operates at a potential (∼3.45 V vs. Li+/Li) that is within the electrochemical stability window of the carbonate-based electrolyte55–57 and it does not release reactive species at a high state-of-charge (SOC). Therefore, the electrolyte in the cell should nominally only contain decomposition products originating from the NMC or LCO electrode. Cells using graphite as the negative electrode were prepared to study the electrolyte decomposition products that are formed in a commercial Li-ion battery.The LFP electrodes were delithiated by assembling LFP/Li cells (lithium metal foil; 99%, Aldrich), which were cycled to the flat region in the discharge curve (for cycling protocol see electrochemical methods). After delithiating the LFP electrode, the cells were opened and the partially delithiated LFP electrodes were washed with DMC (3 × 0.3 mL) and dried under dynamic vacuum for 30 min, to remove any electrolyte decomposition products originating from the lithium metal electrode.
The delithiated LFP electrodes were reassembled into NMC/LFP or LCO/LFP cells with an N/P ratio (the capacity ratio of the negative to the positive electrode) of 1.5, based on the practical capacities of the NMCs, LCO and LFP obtained in lithium half cells. The capacity of the LFP electrodes was oversized so that the electrodes would operate in the flat region (at relatively constant potential) of the LFP charge/discharge curves, as this made it easier to control the upper potential reached by the NMC and LCO electrodes. For the NMC/graphite and LCO/graphite cells a lower N/P ratio of ∼1.2 was chosen, to resemble more closely N/P ratios used in commercial cells.
Two-electrode cells were assembled in a standard coin cell configuration: the positive electrode (NMC or LCO) on a stainless-steel current collector, a borosilicate glass fibre separator (Whatmann, GF/B, 0.68 mm thick, 1.0 μm pore size) wetted with 150 μL of electrolyte solution or a polypropylene separator (Celgard 3501) wetted with 100 μL of electrolyte solution, the negative electrode (delithiated LFP or graphite), on a stainless-steel current collector and cone spring were compressed in a 2032-type coin cell casing. The glass fibre separator was used to act as a sponge for the electrolyte, so that the electrolyte could be easily extracted after disassembling the cell. All cell assembly was performed in an argon-filled glovebox.
2.3 Three-electrode cells
To determine the upper potential reached by the NMC and LCO electrodes in the NMC/LFP cells, three-electrode NMC/Li/LFP cells were assembled: A NMC working electrode (WE), partially delithiated LFP counter electrode (CE) and lithium metal reference electrode (RE), were assembled in a Swagelok cell with 200 μL of electrolyte solution.2.4 Electrochemical methods
Electrochemical measurements were performed at 25 °C using a Biologic MPG2 potentiostat/galvanostat instrument running EC-lab software. The LFP electrodes were delithiated by charging the LFP/Li cells to 4.0 Vcell, followed by a 24 hour potential hold to ensure complete delithiation, after which the cells were discharged to 3.6 V to partially (re)lithiate the electrode. Charging and discharging was performed in constant current (CC) mode at a C/5 rate (based on a practical capacity of 127 mA h g−1).The (NMC or LCO)/LFP cells were cycled between 0.2 and 0.73, 0.93, 1.13, 1.33 or 1.53 Vcell, corresponding to an upper potential of 4.1, 4.3, 4.5, 4.7 and 4.9 V vs. Li+/Li for the positive electrode. The (NMC or LCO)/graphite cells were cycled between 2.5 and 4.65 Vcell, corresponding to an upper potential of ca. 4.7 V vs. Li+/Li for the positive electrode. Charging was performed at C/5, either in constant current-constant voltage (CCCV) mode with a current limitation corresponding to 0.02 C or in CC mode with a 2 hour potential hold at the upper voltage limit. Discharging was performed in CC mode at a C/5 rate. Cells charged in CCCV mode were cycled 20 times, whereas cells charged in CC mode were cycled 10 times. Practical capacity values of 160, 167, 175 and 200 mA h g−1 were used for NMC's 111, 532, 622 and 811, respectively, for the C-rate calculations.
NMC/Li/delithiated LFP three-electrode cells were cycled twice between 0.2 and 1.53 Vcell at a C/5 rate in CC mode with a 2 hour potential hold.
2.5 Operando pressure measurements & on-line electrochemical mass spectrometry (OEMS)
Gas evolution for different NMC cathodes (NMC111, NMC622, NMC532 and NMC811) was studied by monitoring the internal pressure changes of a Swagelok-type cell during cycling. A pressure transducer (PA-33X, Keller Druck AG) attached to a standard 1 inch Swagelok cell, was used to monitor the internal pressure of the cell (Fig. 1a). The cell was designed with a small headspace volume (2.55 mL), which provided high sensitivity in the detection of gas formation.58 As in a typical Swagelok cell, a copper current collector was used for the lithium metal counter electrode and a steel current collector was used for the NMC electrode in the NMC/Li cells; an aluminium current collector was used when partially delithiated LFP was used as the counter electrode. The cell was assembled inside an argon-filled glovebox (O2 and H2O < 1 ppm) as follows: a 25 mm lithium foil disc was placed on the copper current collector at the base of the cell then 200 μL of electrolyte solution was added to the centre of the lithium metal disc, then a GF/B separator was placed on top of this and another 200 μL of electrolyte solution was added to the centre of the separator, then the NMC disc electrode was placed on top of this ensuring proper alignment of the electrodes and the separator. The steel current collector was then placed on top of the NMC electrode and the sealed cell was brought outside of the glovebox and further tightened to ensure sealing; it was then transferred to a climatic chamber set to 25 °C. After a 24 hour rest at 3 V (OCV) to allow the temperature and pressure to stabilize, the cell was cycled between 3.0 V and a series of upper cut-off potentials: 4.3, 4.4, 4.5, 4.55, 4.6, 4.65, 4.7, 4.75 and 4.8 V. For each upper cut-off potential, the cell was cycled twice in CC mode: once without and once with a 2 hour potential hold at the top of charge.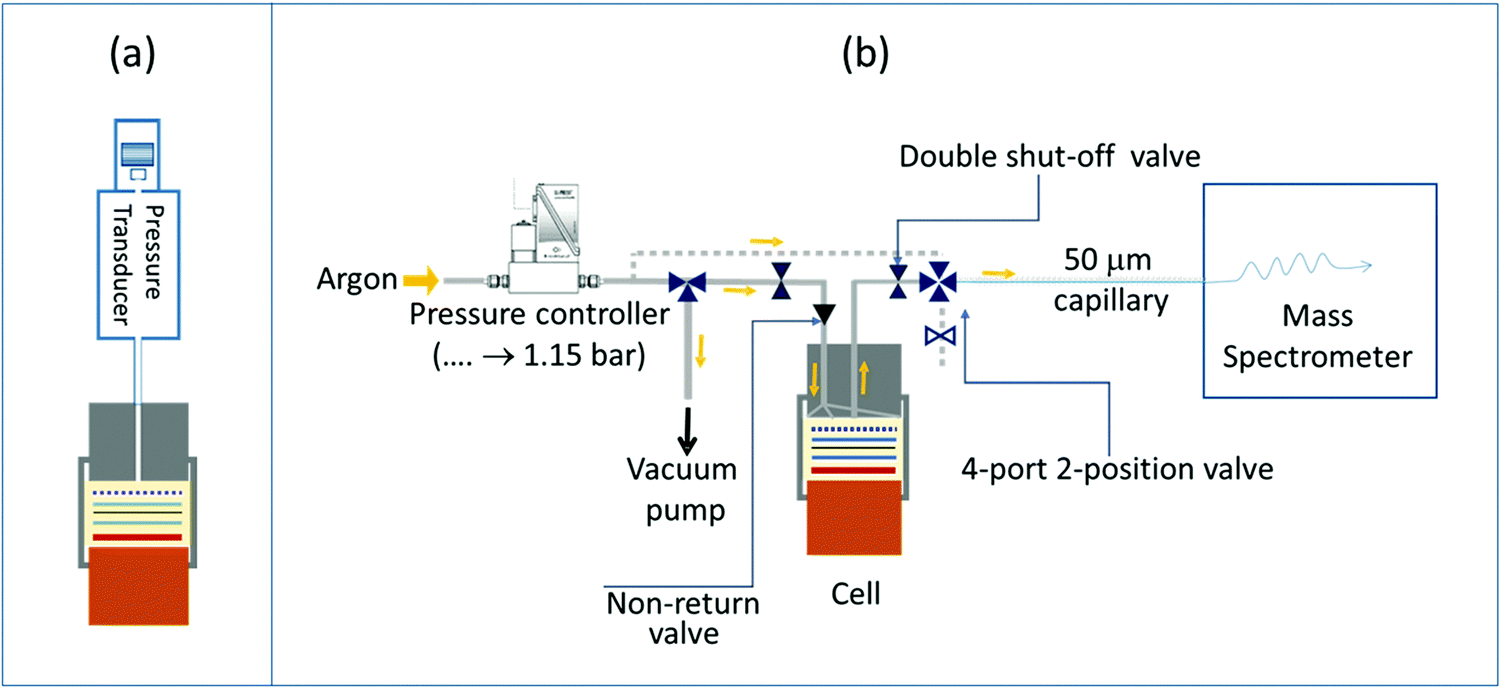 | ||
| Fig. 1 Schematic of the operando pressure cell (a) and the on-line electrochemical mass spectrometry (OEMS) setup (b). | ||
OEMS experiments were performed to determine which gases are produced at high potentials and give rise to the increased internal cell pressure. For these measurements only NMC811 cathodes were employed, as it has previously been shown that the nature of the gases is the same for various NMCs and only the onset potential for gas evolution differs.8 NMC811 was chosen, as the operando pressure measurements showed that this material produced the most gaseous products. After a 4 hour rest at OCV, the cell was charged to 4.3, 4.5 and 4.7 V and held at each potential for 2 hours, before going to the next target potential. Charging was performed in CC mode at a C/5 rate.
The OEMS setup consisted of a quadrupole mass spectrometer (Pfeiffer Thermostar) connected to a specially designed electrochemical cell and a 50 μm capillary of the mass spectrometer was connected to the electrochemical cell via a manual GC sampling valve (Valco, Fig. 1b). A Swagelok-style electrochemical cell with an inlet and outlet drilled through the cathode current collector was used for OEMS studies. The outlet of the electrochemical cell was connected to the mass spectrometer capillary via the GC sampling valve. The inlet of the electrochemical cell was connected to a pressure controller (EL-Press, Bronkhorst) that fed argon to the cells when the pressure inside the electrochemical cells dropped below 1.15 bar. Between the inlet on the electrochemical cell and the pressure controller, a 3-way valve (Swagelok) connecting to a vacuum pump, allowed contaminant-free transfer of the gases from the electrochemical cell to the OEMS gas line. The outlet of the electrochemical cell had a quick disconnect double shut-off valve assembly (Beswick Engineering, USA) connected to the GC sampling valve, and any dead volume of air trapped in between the internal and external valve assembly was purged out by flowing argon through the outlet valve of the GC sampling adapter. The 50 μm-diameter capillary connected to the mass spectrometer and the capillary inlet were heated to 120 °C to prevent solvent condensation. This design of the OEMS system minimises argon gas flow through the electrochemical cell (ca. 9 μL min−1) and, thus, minimises solvent evaporation. The cell headspace volume (including the connection to the mass spectrometer) is ca. 3 mL. For quantification of the gas evolution rates, the setup was calibrated for H2, C2H4, O2, CO and CO2 (m/z values of 2, 26, 32, 28 and 44, respectively) using standard calibration gases of known concentrations (SIP Analytical). Two calibration gas cylinders, one containing H2, C2H4, O2, and CO2 (each 1000 ppm in Ar) and another one containing 1000 ppm CO and H2 in Ar were used separately to avoid overlap of the fragments, following previous work.30 Background effects were corrected by fitting a baseline to the signals recorded during the cell rest period, as detailed in previous studies.10,59
2.6 Singlet oxygen experiments
The chemical reactions between singlet oxygen (1O2) and the electrolyte solvent were studied by generating 1O2 in a carbonate solution and analysing the reaction mixture by solution NMR. To produce 1O2 in an organic carbonate solution, a similar approach was taken to that reported by Freiberg et al.:111O2 was generated in triplet oxygen (3O2) saturated solutions of ethylene carbonate (EC), dimethyl carbonate (DMC) and vinylene carbonate (VC), by photoexcitation of 3O2 to 1O2 using Rose Bengal as a photosensitiser. Irradiating Rose Bengal with light at 525 nm results in the formation of a triplet state of Rose Bengal, which can then transfer energy to 3O2 during a collision between Rose Bengal and 3O2, exciting 3O2 to 1O2.60Rose Bengal salt (disodium salt, >95%, Sigma-Aldrich) was dried at 130 °C under dynamic vacuum for 72 hours. Solutions of 100 μM Rose Bengal in EC (battery grade, ≥99%, <10 ppm H2O, Sigma-Aldrich), DMC (battery grade, ≥99%, <10 ppm H2O, Sigma-Aldrich) and VC (99.9%, Solvionic) were prepared in an argon-filled glovebox. A pre-dried glass vial (7 mL volume) was filled with 3 mL of the Rose Bengal/carbonate solution and a magnetic stir bar was added for convective mixing during irradiation of the solution. The glass vial was fitted with a septum (Suba-Seal), to create an air and moisture tight container, and transferred out of the glovebox. Oxygen gas (>99.9999%, ALPHAGAZ 2, Air Liquide) was bubbled through the solution for 10 minutes to ensure the Rose Bengal/carbonate solution was saturated with oxygen. For experiments using 17O-enriched O2 (70% enriched, CortecNet), the solution was first saturated with “regular” oxygen (99.76% 16O2, 0.2% 18O2 and 0.04% 17O2), before bubbling through the 17O2.
The glass vial containing the Rose Bengal/carbonate solution was placed on a magnetic stirrer between four LEDs and irradiated with light at 525 nm. Each LED had a maximum emission between 520–530 nm and a luminous flux of 120 lumens at a maximum power of 3 W, operating at a voltage between 3.4–4 V and a current of 750 mA. The LEDS are connected in series and are mounted on an aluminium casing that acts as a heat sink for heat generated during the experiment (Fig. S2, ESI†). A current of 400 mA was applied to the LEDs for 2 hours, after which 0.1 mL of the Rose Bengal/carbonate solution was taken for analysis by solution NMR.
2.7 Solution NMR
After cycling the (NMC or LCO)/LFP and (NMC or LCO)/graphite cells, the cells were disassembled in an argon-filled glovebox and the glass fibre separator was soaked in 0.7 mL of DMSO-d6 (Aldrich, 99.9 atom% D, 99% CP) for 5 minutes. The solution was transferred to an airtight NMR tube fitted with a Young's tap. 1H NMR spectra of each batch of DMSO-d6 used for this work were also acquired (Fig. S8, ESI†) to identify which signals arise from impurities in the deuterated solvent.One-dimensional 1H, 19F{1H} and 17O NMR spectra and two-dimensional 1H–1H correlation spectroscopy (COSY) NMR spectra were recorded on a Bruker AVANCE III HD 11.7 T (ω1H = 500 MHz) spectrometer using a BBO probe. 1H spectra were internally referenced to DMSO-d6 at 2.50 ppm (δ1H) and 19F and spectra were internally referenced to LiPF6 at −74.5 ppm (δ19F). The 17O NMR spectra were externally referenced to D2O at 0 ppm.
3 Results
3.1 Analysis of gaseous electrolyte decomposition products in NMC/Li cells by operando pressure measurements and OEMS
Fig. 2 shows the internal cell pressure overlaid with the cell potential as a function of time for NMC111, NMC622, NMC532 and NMC811/Li half-cells with a 1 M LiPF6 in EC:DMC (1:1, v/v; LP30) electrolyte. The cell pressures stay constant during the 24 hour hold at 3 V (vs. Li+/Li) prior to cycling, and then increase and decrease periodically (1.0–1.5 mbar) as the cells were charged and discharged. These cyclic fluctuations in the cell pressure are due to volumetric changes of the positive and negative electrodes during lithiation and delithiation, and are dominated by changes in the lithium metal electrode volume (i.e., the plating and stripping of lithium).58,61 For NMC811 (Fig. 2h), the overall cell pressure increases slowly during the first two cycles between 4.3 and 3.0 V (by about ∼0.2 mbar), but starts to rise noticeably during the 2 hour hold at 4.4 V vs. Li+/Li (0.5 mbar), and keeps increasing as the cell was cycled to higher upper cut-off potentials. For the other NMC compositions, a small increase in cell pressure was seen up to 4.65 V (∼0.2 mbar). However, more pronounced rises in pressure were observed during the 2 hour potential hold for NMC532 at 4.65 V vs. Li+/Li (Fig. 2f), and NMC622 and NMC111 at 4.7 V vs. Li+/Li (Fig. 2g and e). For the final two cycles to 4.3 V, the cell pressures remain constant in all the cells, demonstrating high stability and absence of measurement artefacts (e.g., leaks).
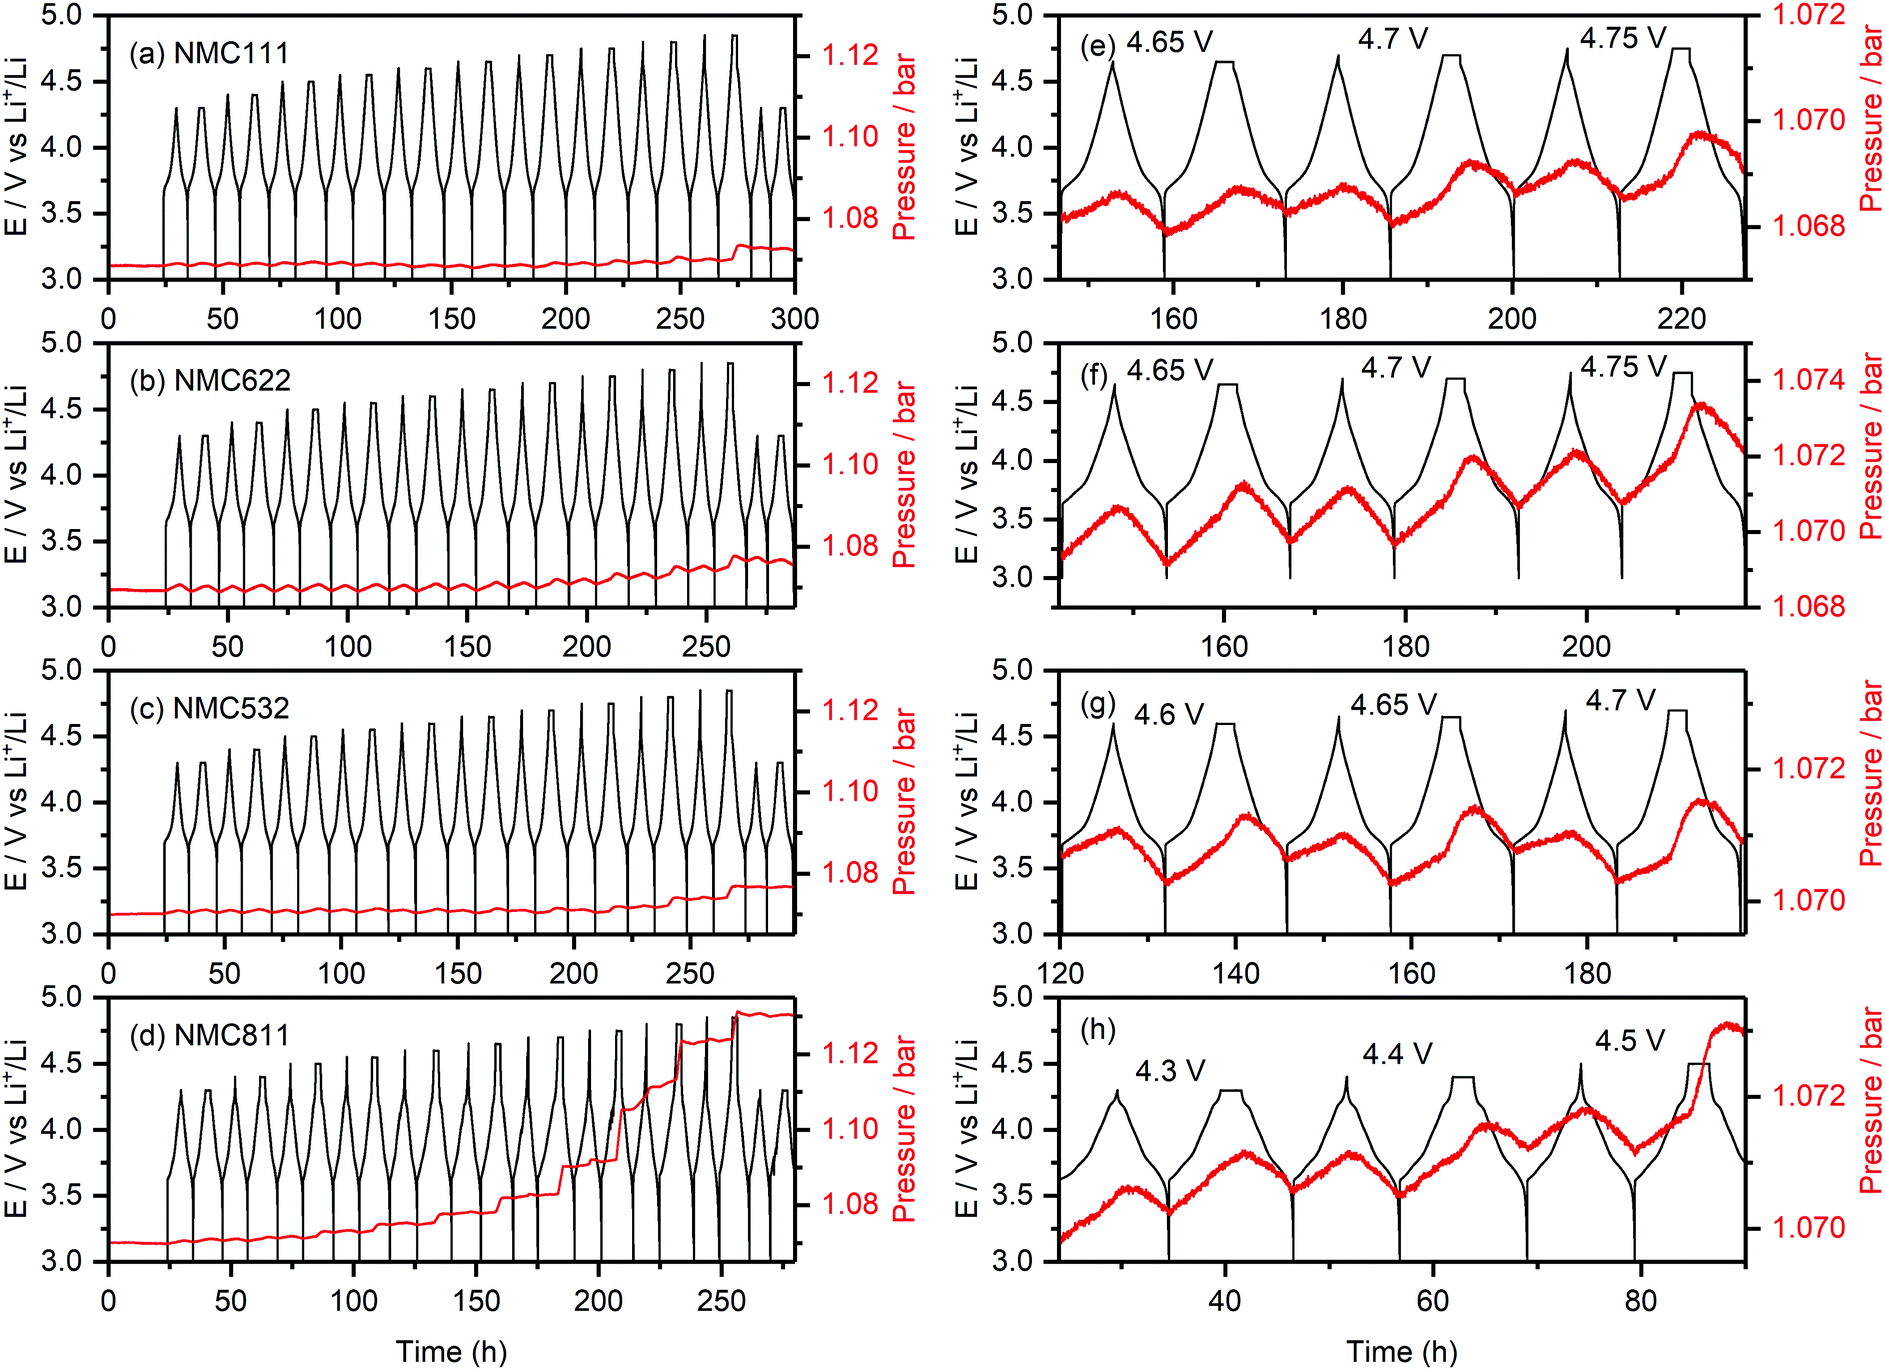 | ||
| Fig. 2 Operando pressure data for (a) NMC111, (b) NMC622, (c) NMC532 and (d) NMC811/Li cells using an LP30 electrolyte. The cells were cycled between 3.0 V and a series of increasing upper cut-off potentials (4.3–4.85 V), after which they were cycled to 4.3 V again; the potential was stepped by 0.1 V every two cycles until 4.5 V, whereafter the step-size was reduced to 0.05 V. For every cut-off potential value, the second cycle included a 2 hour potential hold at the top of charge. The internal cell pressure and potential-time data are shown in red and black, respectively. An expanded view of the data is shown on the right (e–h). The active material mass loading was 3 mg cm−2 for all cells and all measurements were performed at 25 °C. | ||
The pronounced increase in cell pressure at high potentials (4.4 V vs. Li+/Li for NMC811, 4.65 V vs. Li+/Li for NMC532, and 4.7 V vs. Li+/Li for NMC622 and NMC111) is ascribed to the evolution of gaseous decomposition products from electrolyte decomposition at the positive electrode.4,8,10,62 These gas evolution onset potentials are consistent with those previously reported for NMC811 (∼4.3 V vs. Li+/Li), and NMC11 and NMC622 (∼4.6–4.7 V vs. Li+/Li),4,8,10 and correspond to a state-of-charge (SOC) of ∼80% (i.e. the material is 80% delithiated) for each of the NMCs (Table 1).
| Material | Gas evolution onset potential (V vs. Li+/Li) | SOC (%) |
|---|---|---|
| NMC111 | 4.7 | 84 |
| NMC622 | 4.7 | 84 |
| NMC532 | 4.65 | 80 |
| NMC811 | 4.4 | 83 |
| LCO | 4.6 | 83 |
The evolution of gaseous products was predominantly detected during the 2 hour potential hold (in the second cycle at each cut-off potential), showing that the extent of electrolyte decomposition is directly related to the time the cell spends at the top of charge. This is confirmed by NMR analysis of the amount decomposition products formed in NMC811/LFP cells cycled with a CCCV protocol compared to cells cycled in CC mode followed by a 2 hour potential hold (see Fig. S9, ESI† and Fig. 4). The small increase in cell pressure at low voltages (∼0.2 mbar) is attributed to the evolution of gaseous decomposition products from the reduction of the electrolyte solution at the lithium metal negative electrode: immediately when the cell is assembled, the electrolyte solution is reduced at the lithium metal surface, releasing gaseous products and creating the layer of insoluble reduction products on top of the electrode surface known as the solid electrolyte interphase (SEI). While this layer, once formed, self-limits further electrolyte decomposition, the plating and stripping of lithium during cycling may crack the SEI and expose fresh surfaces for continued electrolyte reduction and gas formation. This contribution to the cell pressure is expected to increase proportionally to the amount of lithium extracted from the cathode and, thus, cannot explain the more pronounced increase in cell pressure at higher voltages.
To understand which of the electrolyte components (EC, DMC or LiPF6) is decomposed and gives rise to the increased cell pressure, the operando pressure measurements were repeated for NMC811/Li cells, using DMC-only (1 M LiPF6 in DMC) and EC-only (1.5 M LiPF6 in EC) electrolytes. For pure EC electrolyte solutions, a higher electrolyte salt concentration was required to prevent the solution from solidifying at ambient temperatures. The gas evolution onset potential for the cell using the DMC-only electrolyte was at 4.7 V (Fig. S3, ESI†), indicating that the gaseous products formed at lower potentials do not originate from DMC decomposition. For the cell with the EC-only electrolyte, the gas evolution onset potential (4.4–4.5 V, Fig. S4, ESI†) matches that of the cell using the combined EC/DMC (1:1 v/v) electrolyte (4.4 V), showing that the gaseous products formed at this voltage result from the EC solvent.
:1 ratio) continue to rise. As the cell is charged to 4.7 V, the O2 signal increases initially and plateaus again, while the CO2 and CO signals (4:1 ratio) increase even more steeply. The H2 signal remained constant throughout the experiment, implying that the amount of H2 generation was negligible.
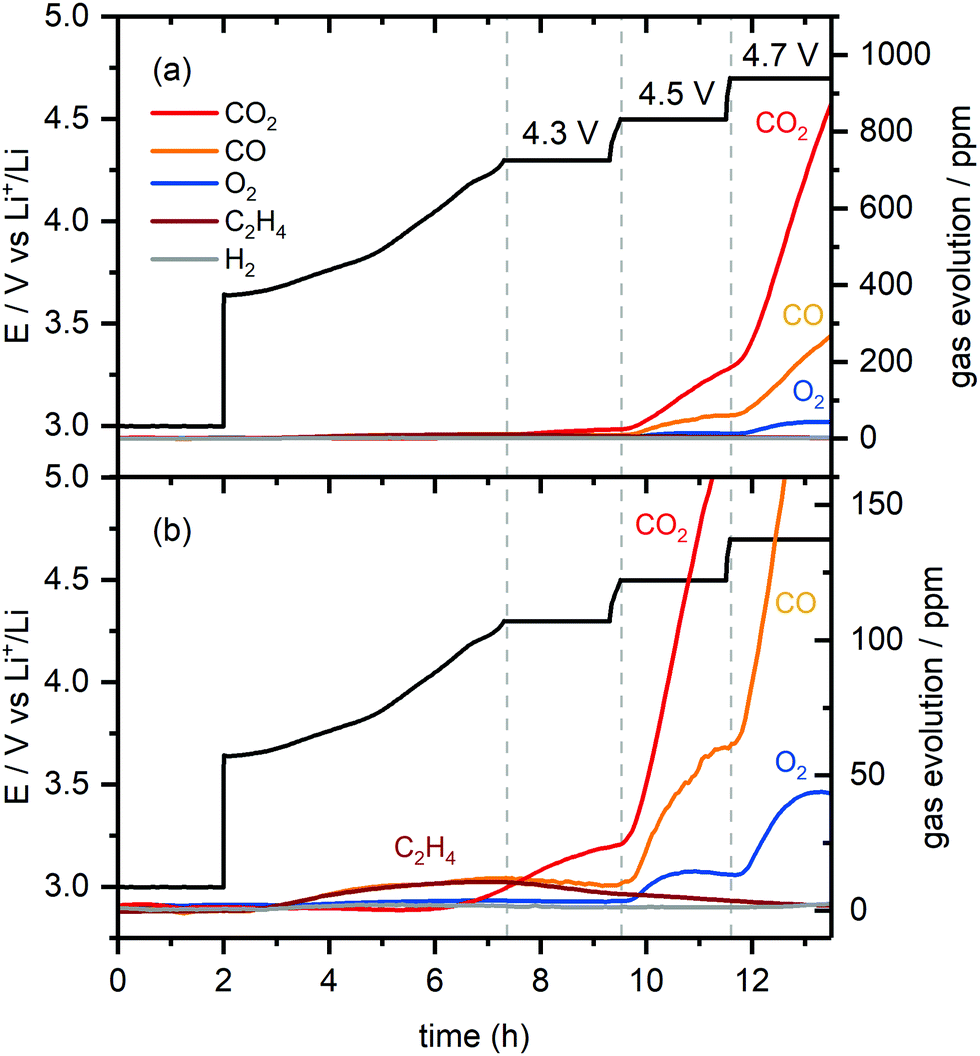 | ||
| Fig. 3 (a) Gas evolution in a NMC811/Li cell charged from 3.0 to 4.7 V (vs. Li+/Li) with a 2 hour potential hold at 4.3, 4.5 and 4.7 V as measured by online-electrochemical mass spectrometry (OEMS). The cell potential-time data is given in black. The gas concentration in the cell head space are given in ppm for CO2 (m/z = 44), CO (m/z = 28), O2 (m/z = 32), C2H4 (m/z = 26) and H2 (m/z = 2). (b) Enlarged view of the gases evolved at low concentrations (between 0–700 ppm). The active material mass loading was 4 mg cm−2 and the measurement was performed at 25 °C. | ||
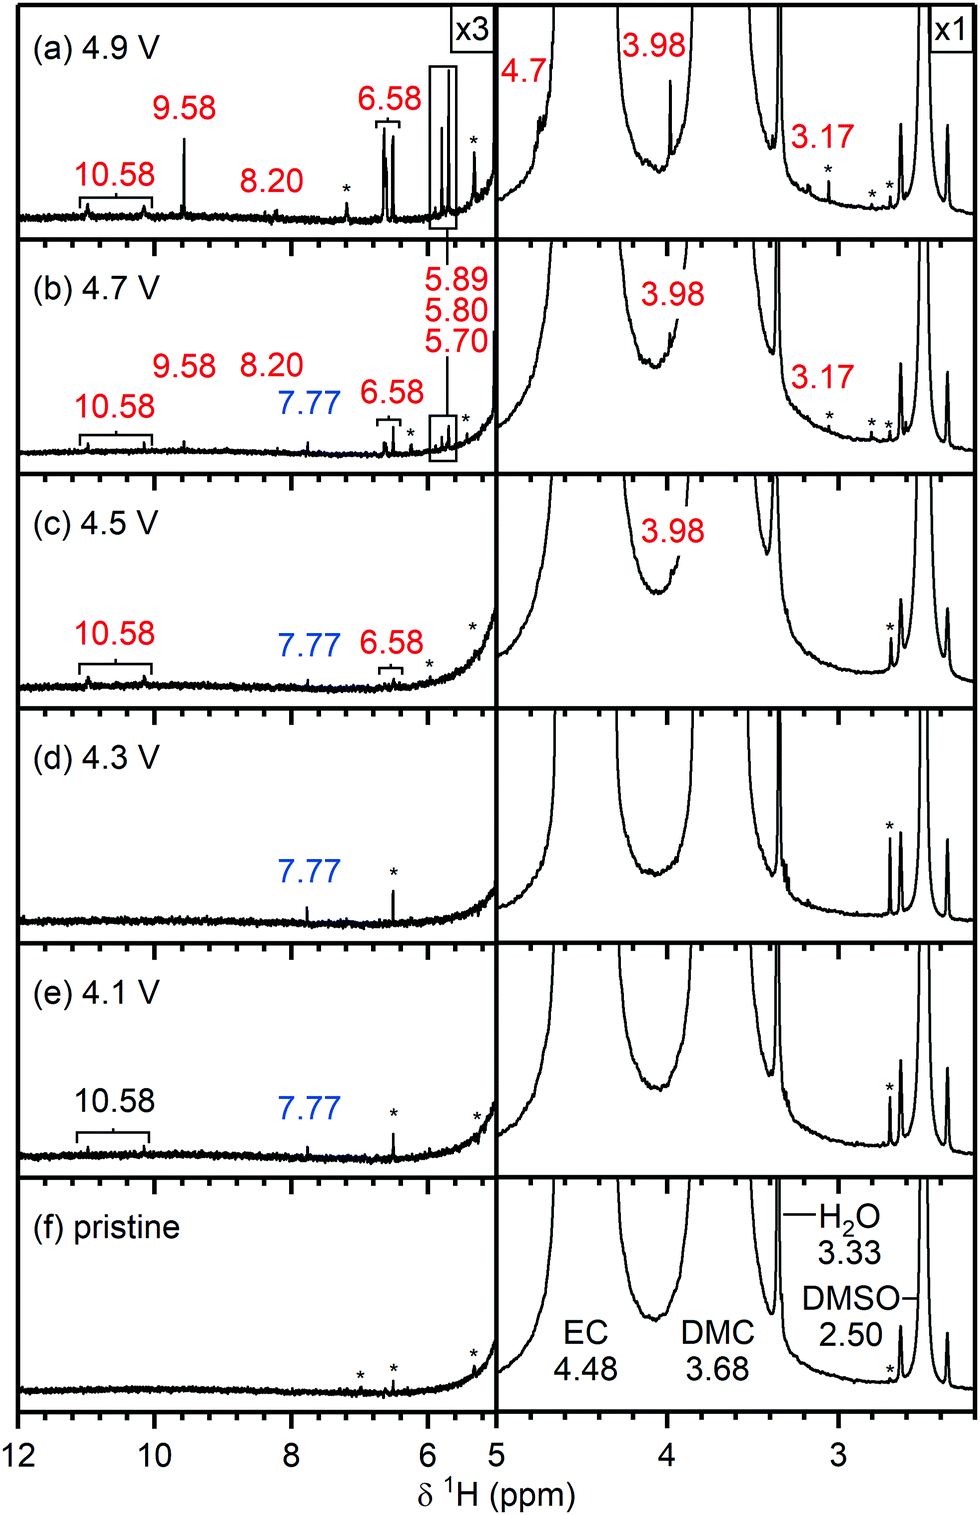 | ||
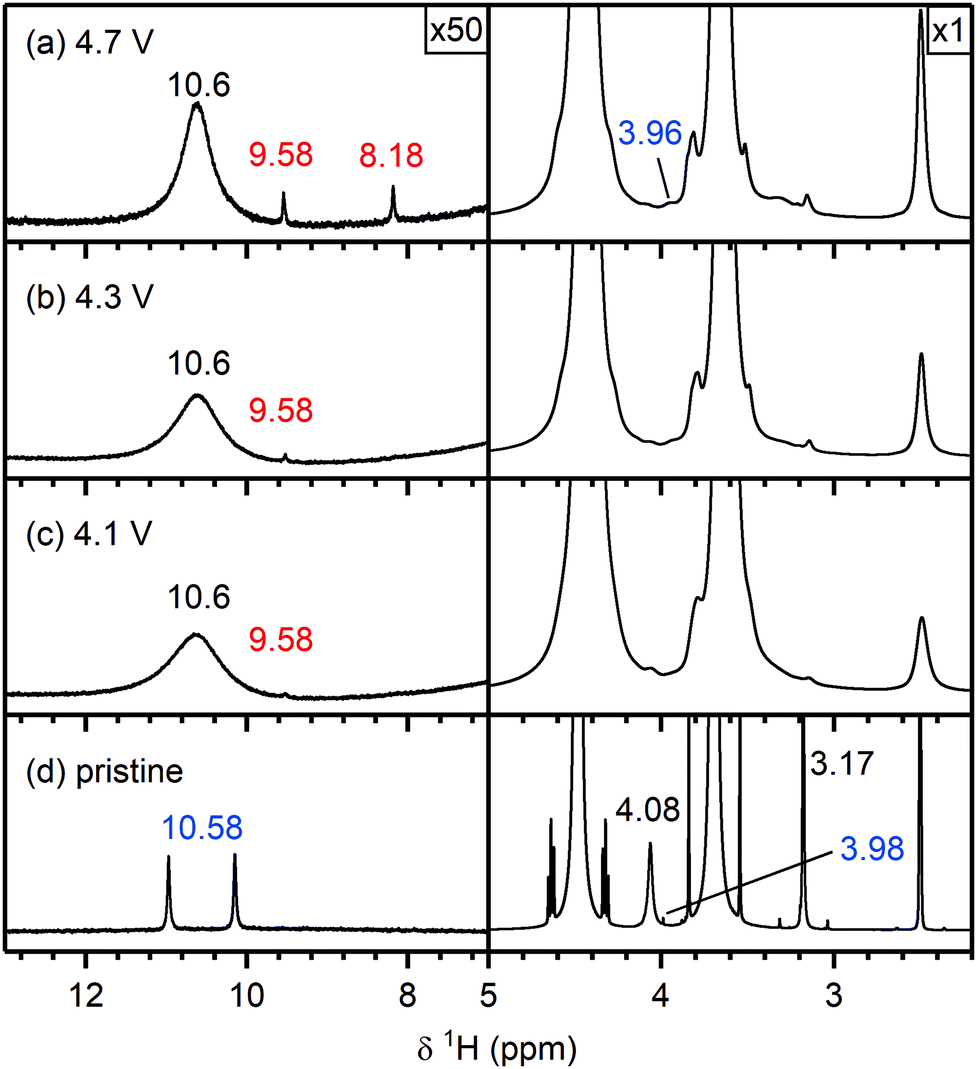
| Fig. 4 1H NMR spectra of electrolyte solutions extracted from NMC811/LFP cells after 10 cycles, where the cell cut-off voltages were chosen so the NMC electrode was cycled between (a) 4.9 V, (b) 4.7 V, (c) 4.5 V, (d) 4.3 V, (e) 4.1 V and 3.0 V vs. Li+/Li, and (f) pristine electrolyte solution. The cells were cycled at rate of C/5 in constant current (CC) mode with a 2 hour potential hold at the top of charge. The region between 5–12 ppm is enlarged 3 times compared to the region between 3–5 ppm. The signals of ethylene carbonate (EC; 4.48 ppm), dimethyl carbonate (DMC; 3.68 ppm) and dimethyl sulfoxide (DMSO; 2.50 ppm) are annotated in black on the bottom spectra. The chemical shifts (in ppm) correspond to signals that appeared below (blue) and above (red) the gas evolution onset potential (4.4 V vs. Li+/Li for NMC811). The cell cycled to 4.1 V (e) contained a weak signal for HF (10.58 ppm, black), as a slightly older electrolyte solution was used in this cell. The asterisks denote impurities in the deuterated DMSO solvent. The NMC active material mass loading was 4–5 mg cm−2. | ||
The formation of C2H4 and CO at low cell potentials, <4.3 V vs. Li+/Li, is ascribed to processes at the lithium metal electrode, as reported previously:10,30,64 the evolution of C2H4 and CO at low potentials, arises from EC and DMC reduction,64–66 while CO2 evolution is ascribed to acid–base reactions between acidic species in the electrolyte solution (e.g., HF) and carbonate species on the surface of the NMC electrode (e.g., Li2CO3), as well as the slow hydrolysis of the organic carbonate electrolyte.10,67,68 At 4.3 V, most (∼75%) of the capacity of the NMC electrode has been reached, and thus, at the lithium counter electrode, most of the lithium has already been plated, which explains why the rate of C2H4 production decreases. To confirm that this C2H4 and CO evolution originates from processes at the lithium metal electrode, the OEMS measurement was repeated using Li0.25FePO4 as a counter electrode. The mass loading of the Li0.25FePO4 electrode was increased to ensure that the potential of the LixFePO4 remains in the constant potential plateau region during cycling. No C2H4 and CO gas were evolved at low cell potentials in this cell (Fig. S5, ESI†), confirming that these gases are formed at the lithium metal electrode.
The small amount of CO2 evolved at the potential hold at 4.3 V suggests that the reaction of 1O2 release that triggers EC decomposition is slow, but not negligible, at this lower potential. Additional experiments were done with cells with higher NMC loadings, which produced the same gaseous products but in a higher concentration, thus confirming that all the gases detected are formed due to the electrode reactions with the electrolyte solution (Fig. S6, ESI†).
3.2 Analysis of soluble electrolyte decomposition products formed at NMC electrodes by solution NMR spectroscopy
To identify any soluble electrolyte decomposition products formed at the positive electrode, NMC electrodes were cycled to below and above the gas evolution onset potential as determined by the operando pressure measurements. As above, partially delithiated Li1−xFePO4 (LFP) was used as the counter electrode to prevent decomposition of the electrolyte solution at the counter electrode. NMC811, NMC622, NMC532 and NMC111/LFP cells were cycled to a cell voltage of 0.73, 0.93, 1.13, 1.33 and 1.53 V, corresponding to 4.1, 4.3, 4.5, 4.7 and 4.9 V vs. Li+/Li as confirmed by using a three-electrode cell (Fig. S7, ESI†). After cycling, the NMC/LFP cells were disassembled, and the glass fibre separators were soaked in deuterated DMSO to extract the electrolyte solution and its soluble decomposition products for analysis by solution NMR.The 1H and 19F NMR signals observed for the NMC811, NMC622, NMC532 and NMC111 cells are similar; the species that are formed are identical, only the signal intensity and the potential at which the signals appear vary for the different NMCs. For the following analysis, the NMR spectra from the NMC811/LFP cells are shown, as these samples had the highest signal intensities of the decomposition products. The 1H and 19F NMR spectra for the NMC622, NMC532, NMC111 and LCO cells are shown in the ESI† (Fig. S14–S21). A list of the species observed in the electrolyte solutions, the potential at which they were observed and their chemical shifts, is given in Table 2 and summarised below.
| Potential at which first observed (vs. Li+/Li) | Species | Nucleus | Chemical shift (ppm) |
|---|---|---|---|
| Pristine electrolyte | Ethylene carbonate (EC) | 1H | 4.48 (s) |
| Dimethyl carbonate (DMC) | 1H | 3.68 (s) | |
| Lithium hexafluorophosphate (LiPF6) | 19F | −74.5 (d, 1JP–F = 710 Hz) | |
| OPF2(OH) | 19F | −83.1 (d, 1JP–F = 955 Hz) | |
| 4.1 V | Vinylene carbonate (VC) | 1H | 7.77 (s) |
| 4.5 V | HF | 1H | 10.58 (d, 1JF–H = 410 Hz) |
| 19F | −171.7 ppm (s) | ||
| Lithium fluoroborate (LiBF4) | 19F | −152.7 (s) | |
| Silicon fluorides (SiFx) | 19F | −138.89(s) | |
| Fluoroethylene carbonate (FEC) | 1H | 6.58 (ddd, 2JF–H = 60.7 Hz; 3JH–H = 4.1, 0.7 Hz); | |
| 4.73 (ddd, 2JF–H = 36.3 Hz; 3JH–H = 11.0, 4.2 Hz); | |||
| 4.64 (ddd, 2JF–H = 21.3 Hz; 3JH–H = 11.0, 0.7 Hz) | |||
| 19F | −126.5 (s) | ||
| 4.7 V | Formaldehyde | 1H | 9.58 (s) |
| Formic acid | 1H | 8.20 (s) | |
Acetal; C![[H with combining low line]](https://www.rsc.org/images/entities/b_i_char_0048_0332.gif) 2(OR)2; methanediol (R = H), methoxymethanol (R1 = OCH3, R2 = H) 2(OR)2; methanediol (R = H), methoxymethanol (R1 = OCH3, R2 = H) |
1H | 5.80 (s) | |
| 5.70 (s) | |||
| Methanol | 1H | 4.10 (q, 3JH–H = 5.5 Hz) | |
| 3.17 (d, 3JH–H = 5.5 Hz) | |||
| OPF2(OCH3) | 1H | 3.98 (s) | |
Pristine electrolyte solution. The 1H NMR spectrum of the pristine electrolyte solution (Fig. 4f) shows two main signals arising from the two co-solvents: ethylene carbonate (EC; 4.48 ppm) and dimethyl carbonate (DMC; 3.68 ppm).69,70 Traces of water were detected by the appearance of a singlet at 3.33 ppm,71 however no hydrofluoric acid (doublet at ∼10.6 ppm)72,73 was observed. The presence of HF in the pristine electrolyte solution depends on the age of the solution and the level of water contamination and may also arise from batch-to-batch variations. The signal at 2.50 ppm is assigned to non-deuterated DMSO impurities in the DMSO-d6 solvent.71 Unfortunately the impurities vary between different batches of deuterated DMSO and thus the signals assigned to DMSO impurities (marked with an asterisk) will differ between the spectra (see Fig. S8, ESI†).
Electrolyte solution from cycled NMC811/LFP cells. After cycling to 4.1 and 4.3 V, the 1H NMR spectra of the electrolyte solutions (Fig. 4e and d) show the presence of vinylene carbonate (VC; 7.77 ppm). A small signal for HF (10.58 ppm) is present in the cell cycled to 4.1 V (Fig. 4e) as a slightly older electrolyte solution was used in this cell. For the cell cycled between 4.5–3.0 V (Fig. 4c), the electrolyte solution now also contains HF (10.58 ppm), fluoroethylene carbonate (FEC; 6.62, 4.73, 4.64 ppm) and the fluorophosphate ester OPF2(OCH3) (3.98 ppm), in addition to VC. For the cells cycled to 4.7 and 4.9 V (Fig. 4a and b), several new signals appear between 10−3 ppm in the 1H NMR spectrum: formaldehyde (9.58 ppm), formic acid (8.20 ppm), acetals (methoxymethanol and methanediol; 5.80 and 5.70 ppm) and methanol (3.17 ppm). The signal for VC has disappeared in the cell cycled between 4.9–3.0 V. While the 1H NMR signals are weak, the total amount of decomposition product formed after 10 cycles between 4.7–3.0 V (Fig. 4b) corresponds to ∼1000 ppm (quantified by NMR integration). The measurements were repeated for cells assembled with a polypropylene separator and the results were similar to those obtained when a glass fibre separator was used (Fig. S12, ESI†).
No signs of transition metal dissolution were seen: no bulk magnetic susceptibility effects (i.e., change in chemical shift) or broadening of the NMR signals was observed, indicating that the concentration of dissolved ions is low. Moreover, the electrolyte solutions were diluted with DMSO, which minimises any potential effects arising from dissolved transition metal ions. Studies with much longer term cycling have revealed BMS effects/shifts and broadening of the main resonances, but a more detailed study is required to correlate this with the concentration and nature of the dissolved paramagnetic (transition) metal ions.
Pristine electrolyte solution. The 19F{1H} spectrum of the pristine electrolyte solution (Fig. 5f) shows a large signal from LiPF6 (−74.5 ppm, d, 1JP–F = 710 Hz) and a minor signal from LiPO2F2/OPF2OH (−83.1 ppm, d, 1JP–F = 955 Hz) impurities.70
 | ||
| Fig. 5 19F NMR spectra of electrolyte solutions extracted from NMC811/LFP cells after 10 cycles, where the cell cut-off voltages were chosen so the NMC electrode was cycled to (a) 4.9 V, (b) 4.7 V, (c) 4.5 V, (d) 4.3 V, (e) 4.1 V and 3.0 V vs. Li+/Li, and (f) pristine electrolyte solution. The cells were cycled at rate of C/5 in constant current (CC) mode with a 2 hour potential hold at the top of charge. The chemical shifts of the electrolyte salt (LiPF6, −74.5 ppm), LiPF6 hydrolysis products commonly found in the pristine electrolyte (PO2F2−, −83.1 ppm) and species that arise from HF impurities in the pristine electrolyte (SiFx,−138.9 ppm and BF4−, −152.7 ppm) are given in black. The chemical shifts in blue and red correspond to signals that appeared below and above the gas evolution onset potential (4.4 V vs. Li+/Li for NMC811), respectively. For (c), a weak signal for FEC appears at −126.5 ppm, (see also Fig. S11, ESI†). The broad features at approximately −130 ppm and −175 and −190 ppm arise from the NMR probe and are not due to additional species. The NMC active material mass loading was 4–5 mg cm−2. | ||
Electrolyte solution from cycled NMC811/LFP cells. The 19F NMR spectra of electrolyte solutions from cells cycled up to 4.3 V (Fig. 5d and e) reveal only small quantities of LiPO2F2, comparable to those found in the pristine electrolyte. The cell cycled between 4.1–3.0 V also contains lithium fluoroborate (LiBF4/BF4−; −152.7 ppm), which results from the attack on the glass separator by the small HF impurity in the electrolyte solution used in this cell. These signals were not observed when a polypropylene separator was used (Fig. S13, ESI†). After cycling between 4.5–3.0 V (Fig. 5c), the electrolyte contains LiBF4/BF4− as well as silicon fluoride species (SiFx, x = 4–6, −138.9 ppm). A small signal for FEC (−126.5 ppm) could also be detected, as seen more clearly in the enlarged version of the 19F NMR spectrum (Fig. S11, ESI†). For the cells cycled to well above the gas evolution onset potential (∼4.4 V for NMC811), the 19F NMR spectra (Fig. 5a and b) reveal increased concentrations of fluorophosphate esters and FEC, and the presence of and HF (−171.7 ppm),72,73 in addition to the boron and silicon fluoride species and that were observed at 4.5 V.
To summarise, for NMC/LFP and LCO/LFP cells cycled to below the positive electrode gas evolution onset potential, the only soluble decomposition product detected in the electrolyte solution is VC. For cells cycled above the evolution potential, a number of species are formed: formaldehyde, formic acid, FEC, acetals, methanol, HF, LiBF4, SiFx and OPF2(OCH3). These species were observed for all NMCs (NMC811, NMC622, NMC532 and NMC11) and LCO, and the potential at which they appeared is correlated to the respective gas evolution onset potentials of each electrode. As the LFP electrode does not decompose the electrolyte solution, the observed species are assumed to have formed through processes occurring at the NMC (and LCO) electrodes.
3.3 Analysis of soluble decomposition products formed in NMC/graphite cells by solution NMR
To understand if the electrolyte decomposition products formed at the NMC electrode (as discussed above) react further or are consumed at the graphite electrode, the electrolytes from cycled NMC811/graphite cells were compared to those of the NMC/LFP cells. For the following analysis, the electrolytes from NMC811-based cells are shown, and again similar results were obtained for the other NMC compositions and LCO (see Fig. S22 and S23, ESI† for the 1H and 19F NMR spectra, respectively). The electrolyte from an LFP/graphite cell was also analysed to identify the electrolyte decomposition products originating from the graphite electrode, so these signals would not be incorrectly assigned to decomposition products from the NMC electrode.The 1H NMR spectra of the electrolytes from cycled NMC811/LFP (Vcell = 1.33 V, VNMC = 4.7 V vs. Li+/Li), NMC811/graphite (Vcell = 4.65 V, VNMC = 4.7 V vs. Li+/Li) and LFP/graphite cells are shown in Fig. 6. The species formed at the NMC811 electrode when cycled to 4.7 V vs. Li+/Li have already been discussed above (in NMC811/LFP cells). On the other hand, the results from graphite/LFP cells show that the major decomposition species formed at the graphite electrode are lithium ethylene dicarbonate (LEDC; 4.30 ppm) and methanol (4.10, 3.18 ppm, Fig. 6c, right). The only two signals observed between 12–5 ppm are assigned to formic acid/formate (tentatively; 8.07 ppm) and a DMSO impurity at 6.53 ppm (Fig. 6c, left). Interestingly, the 1H NMR spectrum of the electrolyte from the NMC811/graphite cell shows fewer signals than that of the NMC811/LFP cell (Fig. 6b): a small signal for formic acid remains and a new signal for lithium formate (8.49 ppm) appears. However, the signals for HF, formaldehyde, VC and acetals are not present in the 1H NMR spectrum of the NMC811/graphite cell. Finally, the 19F NMR spectra of the NMC811/LFP cell (Fig. 7a) shows the presence of PO2F2−, FEC, SiFx, BFx and HF (as discussed above), while no fluorine-containing decomposition products are observed in the electrolyte from both the NMC811/graphite and the LFP/graphite cells (Fig. 7b and c).
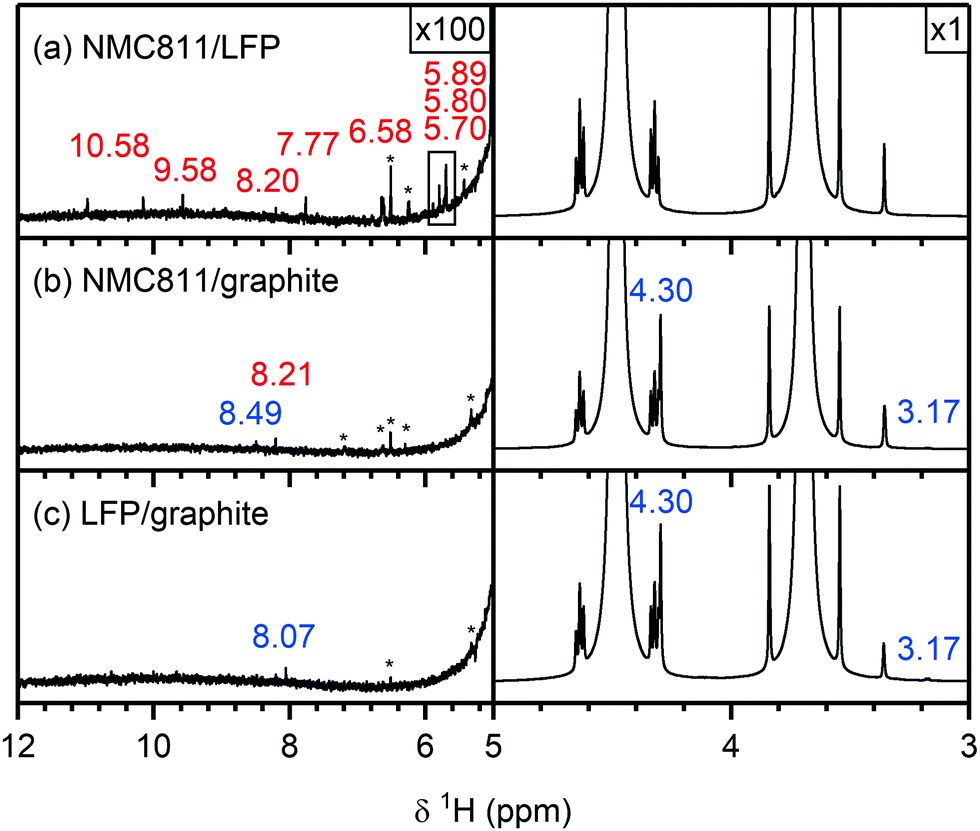 | ||
| Fig. 6 1H NMR spectra of electrolyte solutions extracted from (a) NMC811/LFP, (b) NMC811/graphite and (c) LFP/graphite cells after 10 cycles. The cells were cycled between 1.13–0.2 Vcell, 4.65–2.5 Vcell and 3.45–2 Vcell, respectively, corresponding to upper potential values for NMC and graphite of 4.7 V and 0.05 V vs. Li+/Li, respectively, at rate of C/5 in constant current (CC) mode with a 2 hour potential hold at the top of charge. The region between 5–12 ppm is enlarged 100 times compared to the region between 3–5 ppm. The signals arising from species formed at the NMC and graphite electrode are annotated in red and blue, respectively. The NMC active material mass loading was 4–5 mg cm−2. | ||
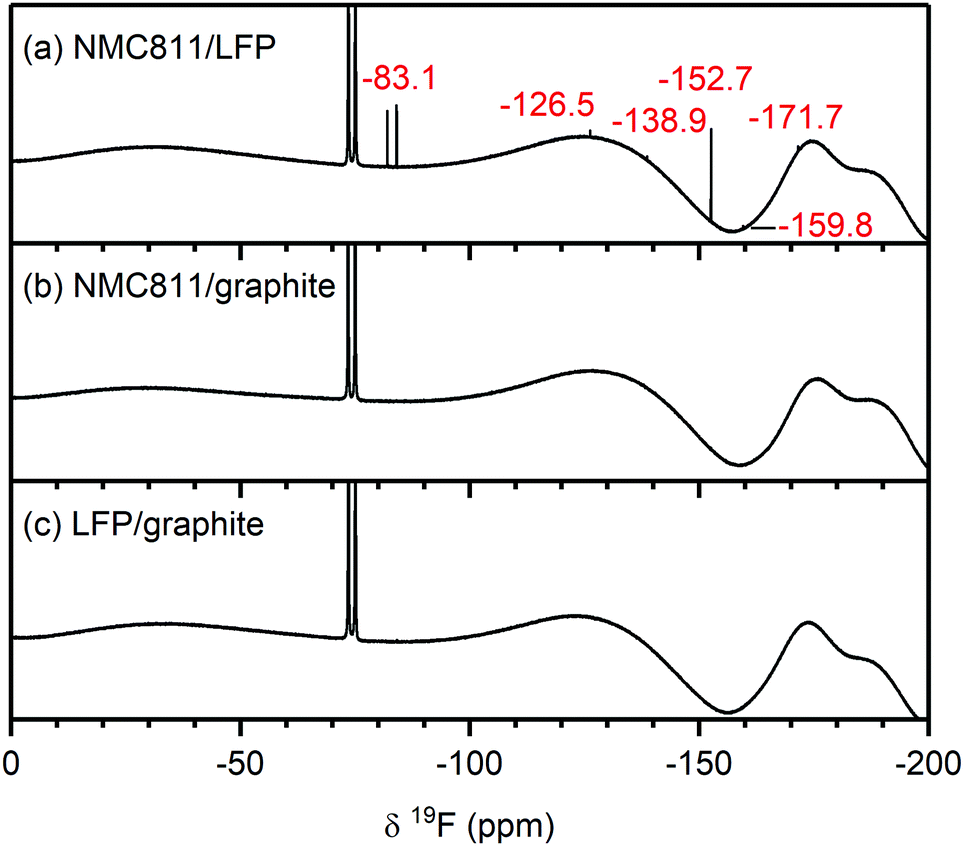 | ||
| Fig. 7 19F NMR spectra of electrolyte solutions extracted from (a) NMC811/LFP, (b) NMC811/graphite and (c) LFP/graphite cells after 10 cycles. The cells were cycled between 1.13–0.2 Vcell, 4.65–2.5 Vcell and 3.45–2 Vcell, respectively, corresponding to a VNMC = 4.7 V and a Vgraphite = 0.05 V vs. Li+/Li, at rate of C/5 in constant current (CC) mode with a 2 hour potential hold at the top of charge. The signals arising from species formed at the NMC and graphite electrode are annotated in red. The broad features at approximately −130 ppm and −175 and −190 ppm arise from the NMR probe and are not due to additional species. The NMC active material mass loading was 4–5 mg cm−2. | ||
3.4 Reaction between singlet oxygen and the electrolyte solvent
To determine whether any of the electrolyte decomposition products identified in the NMC/LFP cells are formed through the reaction of singlet oxygen (1O2) with the carbonate solvent of the electrolyte solution, 1O2 was produced in a carbonate solution and the reaction mixture was analysed by solution NMR. Rose Bengal was used as a photosensitiser to generate 1O2 in triplet oxygen (3O2)-saturated solutions of ethylene carbonate (EC), vinylene carbonate (VC) and dimethyl carbonate (DMC), by irradiating the solution with light at 525 nm. First, to confirm that 1O2 was indeed produced by the photosensitiser, a solution of dimethyl anthracene (DMA) and Rose Bengal in EC was irradiated for 2 hours, and analysis by solution NMR indicated the formation of the endo-peroxide of DMA, confirming that 1O2 was generated (Fig. S24, ESI†).74The 1H NMR spectra of the Rose Bengal/EC solution before and after irradiation for 2 hours are shown in Fig. 8. Before irradiation, signals from EC (4.48 ppm), water (3.33 ppm) and non-deuterated DMSO (2.50 ppm) are detected, as well as DMSO impurities at (1.2–1.1 ppm). A small signal from Rose Bengal is observed at 7.32 ppm (see enlarged spectrum in the ESI,† Fig. S25). After irradiating the solution for 2 hours, the water signal increased by a factor of 3.1 (determined by integration and corrected for volume of solution used for each spectrum) and the Rose Bengal signal shifted to 6.52 ppm. No other additional signals were observed and in particular, no signals for VC (7.77 ppm) or H2O2 (10.27 ppm)75,76 were seen (Fig. 8a and Fig. S25, ESI†). VC and H2O2 have previously been proposed as the reaction products for the chemical oxidation of EC by 1O2.11
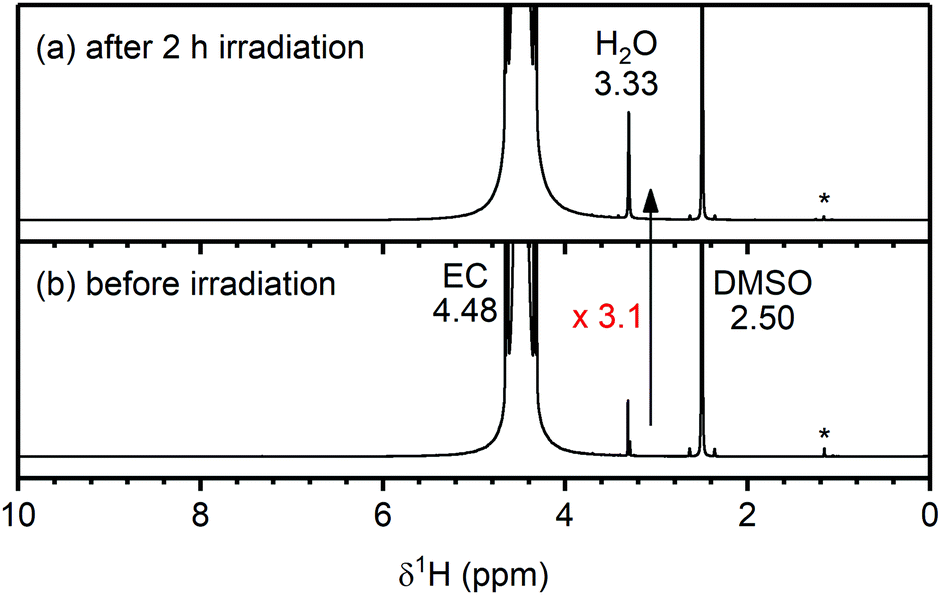 | ||
| Fig. 8 1H NMR spectra of an ethylene carbonate (EC) and Rose Bengal (100 μM) solution (a) after and (b) before 2 hours of irradiation at 525 nm to generate singlet oxygen (1O2). The chemical shifts of EC, H2O and DMSO are annotated in black. An enlarged spectrum is given in Fig. S25 (ESI†). After generation of 1O2 in solution, the H2O signal increased 3.1 times. | ||
To determine whether the water observed after irradiation was produced from a reaction between EC and 1O2 (and did not originate from water adsorbed to glassware, for example), 17O-enriched O2 gas was used to selectively label the reaction products of 1O2, so they could be identified by 17O NMR. If the water originated from a non-enriched source (i.e., adsorbed to glassware), the 17O signal for water should increase by a similar amount as the 1H signal (∼3×), however, if the water originated from a reaction involving 17O-enriched 1O2, the 17O water signal may increase by more than a factor of 3.
The 17O NMR spectra of the Rose Bengal/EC solution before and after irradiation are shown in Fig. 9. Before irradiation, the NMR spectrum shows signals for the carbonyl oxygen of EC (C![[double bond, length as m-dash]](https://www.rsc.org/images/entities/char_e001.gif)
![[O with combining low line]](https://www.rsc.org/images/entities/b_i_char_004f_0332.gif) ; 219 ppm), the –(CO)– oxygens of EC (112 ppm) and DMSO (13 ppm), all originating from unenriched solvent molecules. No water signal could be detected due to the low concentration of water in the electrolyte combined with the low natural abundance of 17O (∼0.04%).77 After irradiation, two weak signals appear at 81 and 0 ppm. The latter is assigned to 17O-labelled water based on a reference sample, and the former is tentatively assigned to dissolved 17O-labelled CO2 (C16O17O).78 As the 17O NMR signal of water increased by at least a factor of 5, it must originate from the 17O-enriched 1O2 (without 17O-enrichment of the 1O2, no new 17O NMR signals appeared; Fig. S26, ESI†). This indicates that the reaction between 1O2 and EC produces water (as its only soluble product). Based on signal integration and taking into account the different levels of 17O-enrichment, ∼100 ppm of water was formed during irradiation, via a mechanism discussed below.
; 219 ppm), the –(CO)– oxygens of EC (112 ppm) and DMSO (13 ppm), all originating from unenriched solvent molecules. No water signal could be detected due to the low concentration of water in the electrolyte combined with the low natural abundance of 17O (∼0.04%).77 After irradiation, two weak signals appear at 81 and 0 ppm. The latter is assigned to 17O-labelled water based on a reference sample, and the former is tentatively assigned to dissolved 17O-labelled CO2 (C16O17O).78 As the 17O NMR signal of water increased by at least a factor of 5, it must originate from the 17O-enriched 1O2 (without 17O-enrichment of the 1O2, no new 17O NMR signals appeared; Fig. S26, ESI†). This indicates that the reaction between 1O2 and EC produces water (as its only soluble product). Based on signal integration and taking into account the different levels of 17O-enrichment, ∼100 ppm of water was formed during irradiation, via a mechanism discussed below.
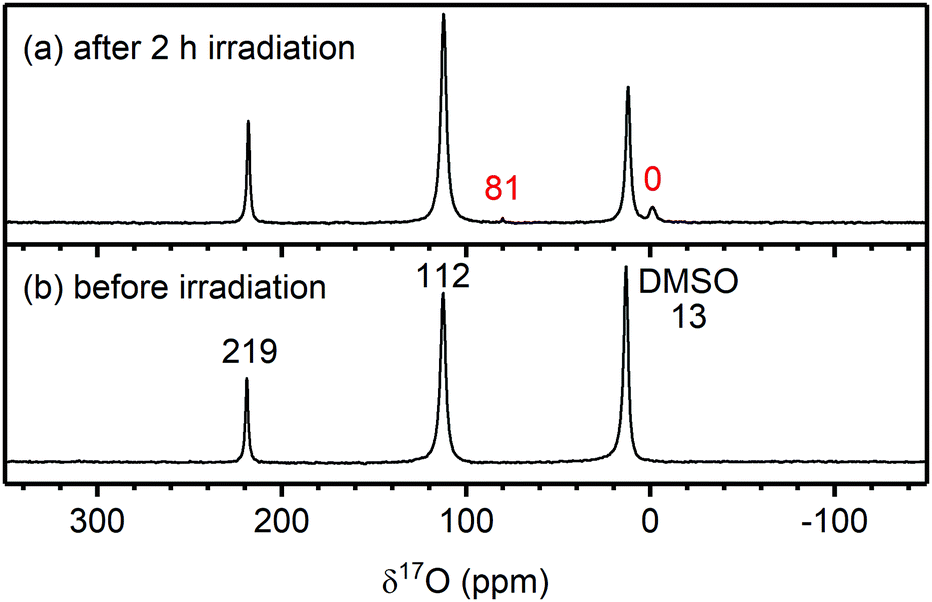 | ||
| Fig. 9 17O NMR spectra of an ethylene carbonate (EC) and Rose Bengal 100 μM solution (a) after and (b) before 2 hours of irradiation at 525 nm to generate 17O-enriched singlet oxygen (1O2). The chemical shifts of EC (219 and 212 ppm) and DMSO (13 ppm) are annotated in black. The chemical shifts in red correspond to the signals for water (0 ppm) and dissolved CO2 (tentatively, 81 ppm), the signals appearing after 1O2 production in solution. | ||
As discussed above, previous work has suggested that the reaction between EC and 1O2 results in the formation of VC and H2O2,11 however, neither species could be detected in the solution by 1H NMR after reacting EC with 1O2 in the present work (Fig. 8a and Fig. S25, ESI†). This implies that either VC does not form or, as previously suggested, VC rapidly reacts with 1O2. To confirm if VC rapidly reacts with 1O2, 1O2 was generated in Rose Bengal/VC solutions and the products were again characterised by solution NMR.
The 1H NMR spectrum of the solution before irradiation shows a signal for VC (7.77 ppm), and minor signals for impurities from VC (Fig. S27b, ESI†). After irradiation, several new signals appear (Fig. S27a, ESI†): two broad signals are tentatively assigned to poly VC (6.34 and 5.38 ppm),79,80 but the main sharp signals that appear at 9.69, 9.11 and 6.46 ppm and are still unassigned. As neither VC or any of the VC + 1O2 reaction products are present in the 1H NMR spectrum of Rose Bengal/EC after irradiation, it is concluded that VC is not a reaction product from the reaction between EC and 1O2. This also indicates that the formation of VC at NMC electrodes (Fig. 4) does not involve 1O2. The absence of a signal for H2O2 cannot be attributed to H2O2 rapidly decomposing to H2O, as the lifetime of H2O2 in EC is long enough for a signal from H2O2 to be observed (Fig. S28, ESI†).
Similar experiments were performed with DMC, however, no additional signals nor an increase in the water signal were observed after irradiation (Fig. S29, ESI†). This suggests that DMC does not react with 1O2, at least under the conditions used here, as has previously been reported.11
3.5 Oxidation of methanol at the positive electrode surface
To establish whether some of the electrolyte decomposition products (formaldehyde and formic acid) identified in the NMC/LFP cells were formed through the oxidation of methanol (formed through DMC hydrolysis, see discussion), NMC/LFP cells were cycled with an electrolyte containing 2 vol% methanol. Even though methanol has only been observed in cells cycled to 4.7 V and higher, NMC811/LFP cells were cycled to cell voltages of 0.73, 0.93 and 1.13 V, corresponding to 4.1, 4.3 and 4.7 V vs. Li+/Li, to determine whether methanol could also be oxidised at lower potentials (below the gas evolution onset potential), and thus if the presence of methanol oxidation products can be used as an indicator for the formation of methanol.Fig. 10 shows the 1H NMR spectra of the pristine electrolyte solution (LP30 + 2 vol% methanol) and the electrolyte solutions extracted from the cycled NMC811/LFP cells. The 1H NMR spectrum of the pristine electrolyte solution (Fig. 10d) shows signals for methanol (4.08 and 3.17 ppm), a small signal tentatively assigned to the fluorophosphate ester OPF2(OCH3) (3.98 ppm) and a doublet attributed to HF (10.58 ppm). After cycling the NMC/LFP cells, the 1H NMR signals have broadened, most likely as a result of an increased transition metal concentration in the electrolyte due to the high HF concentration.14,81–83 For the cells cycled below the gas evolution onset potential (4.1 and 4.3 V), a weak signal assigned to formaldehyde (9.58 ppm) appears (Fig. 10b and c). After cycling between 4.7–3.0 V, the formaldehyde concentration increases and formic acid (8.18 ppm) is observed (Fig. 10a). This indicates that methanol can be oxidised to formaldehyde (at 4.1 V) and formic acid (at 4.7 V) at the transition metal oxide surface.
 | ||
| Fig. 10
1H NMR spectra of electrolyte solutions extracted from NMC811/LFP cells cycled with a 1 M LiPF6 in EC:DMC (1:1 v/v) + 2 vol% methanol electrolyte solution. The cell upper cut-off voltages were chosen so the NMC electrode was cycled between (a) 4.7 V, (b) 4.3 V, (c) 4.1 and 3.0 V vs. Li+/Li, and the cells were cycled 10 times at rate of C/5 in constant current (CC) mode with a 2 hour potential hold at the top of charge. (d) The 1H NMR spectrum of the pristine electrolyte solution. The region between 5–12 ppm is enlarged 50 times compared to the region between 3–5 ppm. The signals of methanol (4.08 and 3.17 ppm) are annotated in black, the signals arising from the reaction of methanol with the electrolyte solution are shown in blue (HF at 10.58 ppm and OPF2(OCH3) at 3.98 ppm). The chemical shifts of the signals that appeared after electrochemical cycling are given in red. | ||
4 Discussion
The results in this work are now used to propose two distinct routes with different onset potentials for electrolyte solution decomposition at the positive electrode. These mechanisms are based on the soluble electrolyte decomposition products identified by solution NMR spectroscopy, the gaseous decomposition products detected by OEMS and a review of the numerous proposed reaction mechanisms in the literature. Based on the identical products that were observed for the various NMC compositions and LCO, it is proposed that these reaction routes will occur for all this class of layered transition metal oxides, but with different onset potentials.The two routes for electrolyte decomposition initiated at the positive electrode are summarised in Fig. 11. In short, at low potentials (i.e., <80% SOC), EC is dehydrogenated to VC, without the formation of gaseous decomposition products. At high potentials (i.e., >80% SOC), 1O2 is released from the positive electrode and chemically oxidises EC to produce H2O, CO2 and CO gas, consistent with work by Gasteiger and co-workers.4,6,8,11 The water that is formed then hydrolyses both the electrolyte salt and solvent, producing the various species identified by NMR.
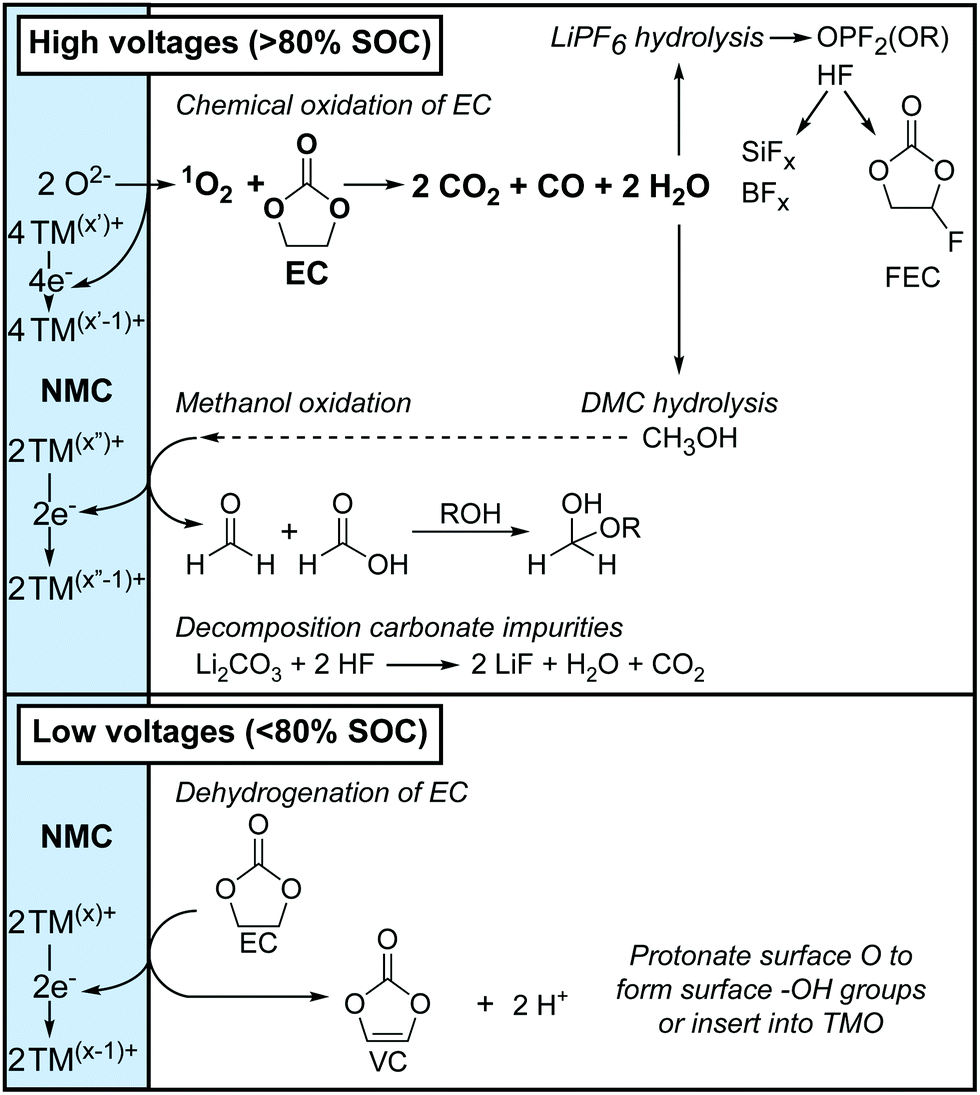 | ||
| Fig. 11 Overview of the electrolyte decomposition reactions that occur at the positive electrode at high potentials (state-of-charge, SOC > 80%) and low potentials (SOC < 80%). The formal oxidation states of the transition metal ions (TM) are indicated with superscripts (x, x′ and x′′) and are illustrative. | ||
4.1 Decomposition of the electrolyte solution at low potentials
For NMC811/LFP cells where the NMC electrodes were cycled between 4.1 and 4.3–3.0 V (i.e. below the gas evolution onset potential at 4.4 V vs. Li+/Li), the only soluble decomposition product in the electrolyte solution detected by solution NMR was VC. The formation of VC at NMC811 electrodes has previously been detected by in situ FT-IR measurement at potentials as low as 3.8 V vs. Li+/Li,45 and VC being proposed to form via a dehydrogenation mechanism at the electrode surface based on density functional theory (DFT) results.42,43 In its simplest form, the dehydrogenation of EC to VC can be written as EC → VC + 2H+ + 2e− (Scheme 1b), which is proposed to be driven by the reduction of transition metal ions at the surface of the positive electrode (Scheme 1a) when this reaction occurs chemically; this coupling lowers the overall ΔG of the reaction so that it occurs at lower potentials than EC dehydrogenation on e.g., Pt electrodes.45 This is supported by the absence of VC formation in cells using Al2O3-coated NMC electrodes, where direct contact and thus the transfer of electrons between the electrolyte solution and the transition metal oxide active material is blocked, as reported by Shao-Horn and co-workers.45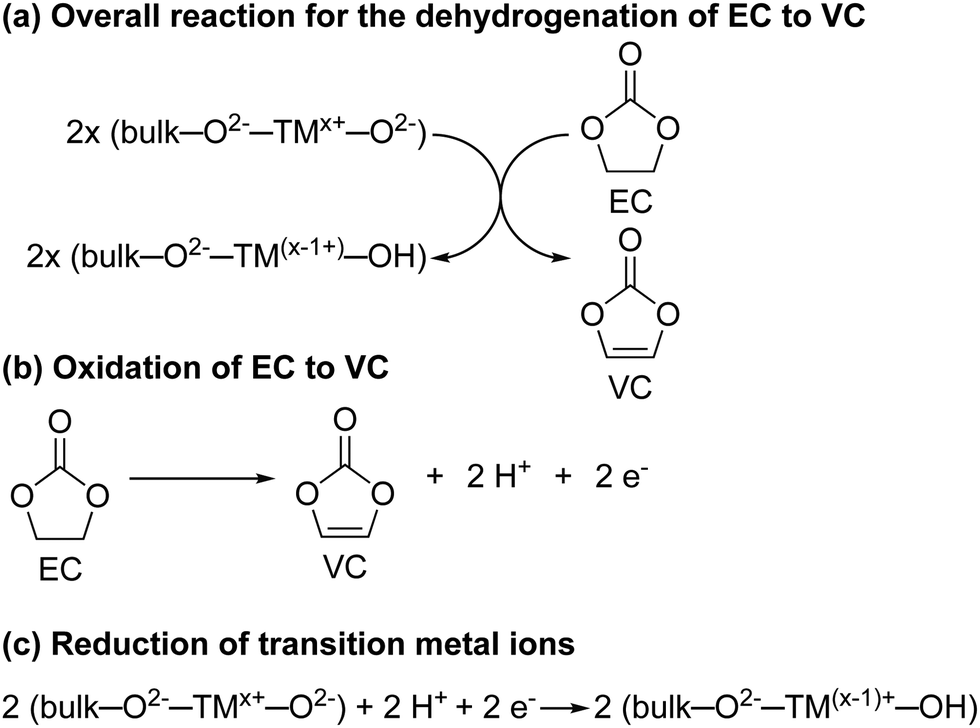 | ||
| Scheme 1 (a) The proposed reaction for the dehydrogenation of ethylene carbonate (EC) to vinylene carbonate (VC) at the surface of the NMC electrode. (b) The electrochemical oxidation of EC to VC. (c) The proposed surface changes at the NMC electrode surface induced by the dehydrogenation of EC to VC. – are used to denote the bond between the transition metal ion (TM) and the oxide/hydroxide groups. The formal oxidation states of the transition metal ions and the oxide/hydroxide group are indicated with superscripts and are illustrative. However, we note that VC is formed at potentials where the formal oxidation state of Ni is only 3+. | ||
Even though this mechanism results in the formation of protons, none were detected in the electrolyte solution (Fig. 4, no broad signal at ∼14–0 ppm for hydrogen bonded protons or HF), nor do they seem to be associated with other decomposition products (no other decomposition products were detected). One explanation for this is the transformation of oxide surface ions to hydroxide ions (Scheme 1c). A similar, but much more extensive, surface transformation of NMC and LiCoO2 materials has been reported upon exposure to water, producing the formation of a transition metal oxy-hydroxide (TMOOH) coating.84–86 Another possible fate for the protons generated in the reaction of EC dehydrogenation to VC, is the intercalation of protons in the NMC structure.87,88 That this reaction appears self-limiting, i.e., less VC is produced than for example the total Ni3+ content of the bulk, suggests that not all O2−–Ni3+–O2− sites promote this reaction (possibly because the first step involves EC coordination to the surface as suggested by DFT studies)42,45 and that the Ni2+ and H+ produced in the reaction help to passivate the surface. Finally, these results also show that the absence of gas evolution does not indicate that no electrolyte breakdown is occurring.
4.2 Decomposition of the electrolyte solution at high potentials
Notably more electrolyte decomposition occurs when the NMC electrodes are polarised to higher potentials. The main gaseous electrolyte decomposition products were determined to be CO2 and CO, which evolved in approximately a 3:1 or 4:1 ratio, and concurrent O2 evolution was also detected. The soluble decomposition products found in cells cycled to above the gas evolution onset potential were identified as HF, LiBF4, SiFx, FEC, OPF2(OR), formaldehyde, formic acid, acetals and methanol, in addition to VC, which was already present at lower potentials.
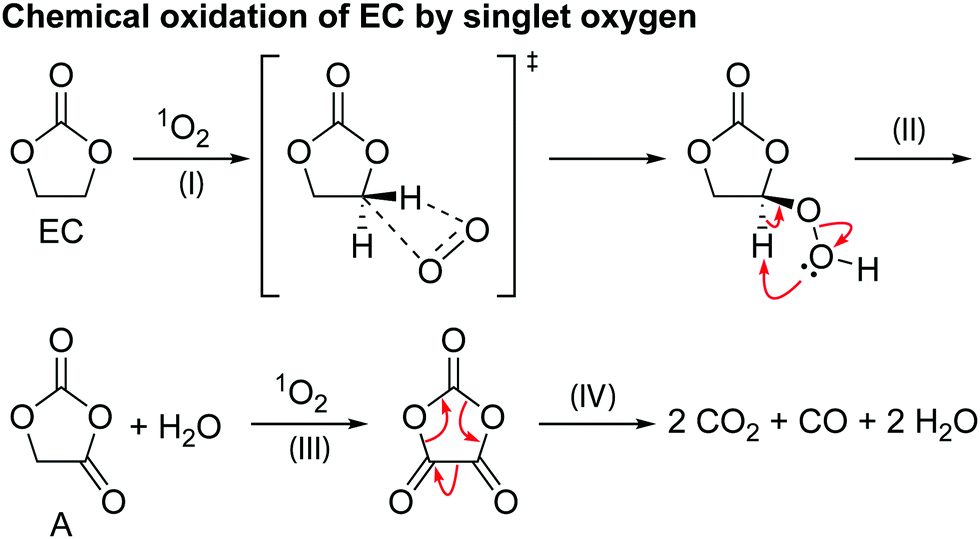 | ||
| Scheme 2 The proposed mechanism for the chemical oxidation of EC by singlet oxygen (1O2). | ||
An additional source of CO2 evolution is the decomposition of carbonate residues (e.g., Li2CO3) present in the NMC active material,4,10,49,89,90via an electrochemical oxidation (2Li2CO3 → 2CO2 + 4e− + 4Li+ + 1O2)91 or via an acid–base reaction (e.g., Li2CO3 + 2HF → 2LiF + H2O + CO2), where the acidic species (e.g., HF) are formed via decomposition reactions of EC triggered by 1O2.10,35 This additional route of CO2 formation would explain the ratio of CO2 and CO detected here, in which more CO2 is evolved than the expected ratio of 2:1 for the reaction of EC with 1O2 (Scheme 2). As will be shown below, the reaction of EC with 1O2 forms H2O, which in turn, induces the decomposition of the LiPF6 salt producing HF.
Alternative proposed routes for EC and DMC oxidation proceed via an electrochemical (faradaic) reaction.35–38,92,93 However, the suggested onset potentials for these mechanisms (∼5.0 V) and the resulting gaseous products (CO2 only) are different from the results obtained in this work, thus an electrochemical oxidation mechanism does not explain the electrolyte decomposition products observed in the NMC/LFP cells.
Scheme 2 shows a proposed reaction mechanism for the reaction between EC and 1O2, based on the known reactions of 1O294 and previously reported mechanisms for the chemical oxidation of EC,4 and is consistent with the species identified in the 1H and 17O NMR spectra. Electrophilic attack of singlet oxygen on the CH2 carbon via a direct insertion mechanism leads to the formation of a hydroperoxyl group via a direct insertion mechanism (step I). The unstable hydroperoxyl group decomposes to form a carbonyl group (intermediate A) and releases water (as detected by NMR, step II). The decomposition of this intermediate A to CO2, CO and formaldehyde was dismissed by Gasteiger and co-workers,4 as they did not observe the presence of formaldehyde, in agreement with the present findings (note that formaldehyde is only observed in our work at very high potentials, >4.7 V vs. Li+/Li, due to methanol oxidation). As Gasteiger and co-workers concluded, the intermediate reacts with 1O2 again (step III), producing a second carbonyl group and molecule of water. The resulting species then decomposes to produce CO2 and CO gas in a 2:1 ratio (step IV), with the overall reaction between EC and 1O2 being EC + 21O2 → 2CO2 + CO + 2H2O.
Previously it has been suggested that EC reacts with 1O2 to form VC and hydrogen peroxide (H2O2),11 however, neither VC or H2O2 was found in the EC solution after generating 1O2. Reaction of VC and 1O2 in a separate experiment was found to result in the formation of poly VC and several unidentified products, however, none of these products were formed when EC was reacted with 1O2. Therefore, it is concluded here that the reaction between EC and 1O2 does not lead to the formation of VC and H2O2, at least under the conditions studied here and the presence of VC in NMC-based cells at low potentials does not result from a 1O2-induced reaction.
Since the chemical reactions that generate VC occur at lower potentials than those that involve singlet oxygen, it is likely that these involve Ni3+ ions. Singlet oxygen formation will be favoured as the Ni formal oxidation state increases and will likely involve the reduction of Ni4+ ions.
The hydrolysis of the LiPF6 results in the formation of fluorophosphate esters and HF in the electrolyte solution. HF can then attack the borosilicate glass fibre separator, producing boron and silicon fluoride species, as is observed by the presence of BF4− and SiFx in the electrolyte, as reported previously. The formation of these species has been reported before and are summarised in Scheme 3.98 It is noted that borosilicate glass fibre separators are not used in commercial cells. In previous work on LiCoO2 electrodes by some of the authors,63 we reported the formation of glycolic acid at potentials above the onset of gas evolution; however, this assignment is found to be incorrect as the chemical shift for glycolic acid in DMSO (measured in a separate experiment) was determined to be 3.92 ppm (Fig. S30, ESI†). Instead, the signal at 3.99 ppm is now assigned to the fluorophosphates ester OPF2(OCH3), based on the appearance of a signal at 3.98 ppm in the 1H NMR spectra of LP30 with 2 vol% methanol added (Fig. 10).
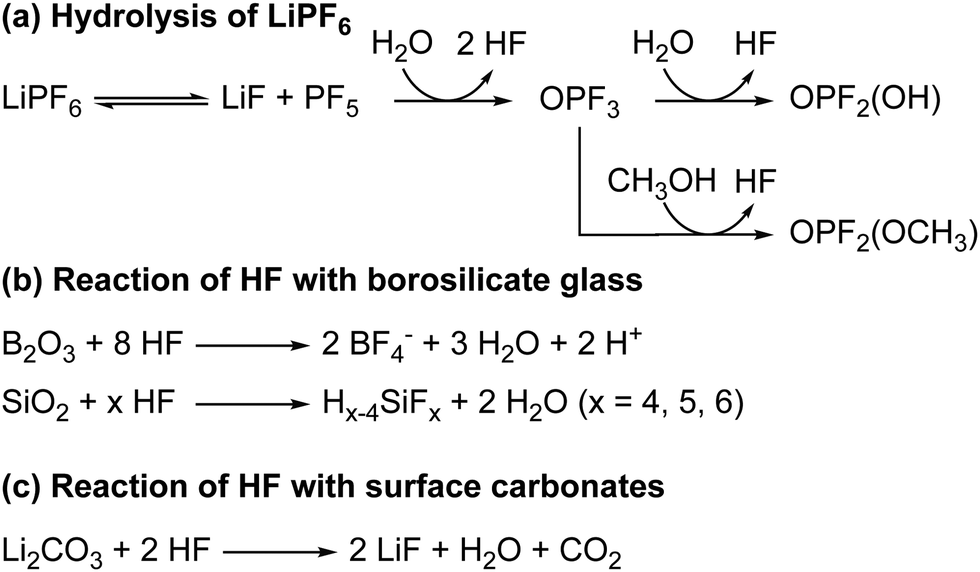 | ||
| Scheme 3 (a) The reaction for the hydrolysis of LiPF6 to form HF and fluorophosphate esters (OPF2(OR)). (b) The reactions of HF with the borosilicate glass fibre separator to form boron and silicon fluorides. (c) The acid–base reaction of HF with lithium carbonate to form lithium fluoride, H2O and CO2. | ||
The hydrolysis of DMC results in the formation of methanol and lithium carbonate as shown in Scheme 4 and reported in our previous work.63 No evidence for the hydrolysis of EC is observed, as neither lithium ethylene monocarbonate (LEMC; 4.08 and 3.55 ppm) ethylene glycol (EG; 3.44 and 3.25 ppm) could be detected in the 1H NMR spectra (Fig. 4). This is ascribed to EC being less susceptible to hydrolysis, in part because its hydrolysis product, LEMC, can undergo a ring-closing reaction, reforming the EC molecule.
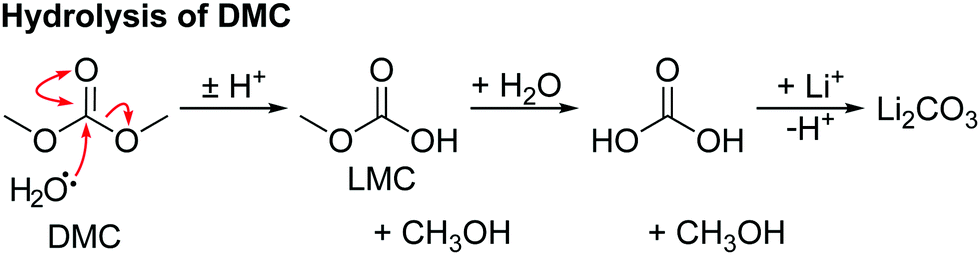 | ||
| Scheme 4 The reaction for the hydrolysis of dimethyl carbonate (DMC) to form methanol and lithium carbonate. Lithium methyl carbonate (LMC) and dihydrogen carbonate are intermediates. | ||
The absence of formaldehyde in NMC811/LFP cells cycled up to 4.5 V vs. Li+/Li, suggest that no significant amount methanol was produced in those cells. As discussed above, methanol is formed through the hydrolysis of DMC with water generated from EC oxidation. The absence of methanol at this potential may seem surprising, as gas evolution (which indicates EC oxidation by 1O2 and thus the formation of water) already occurs at 4.4 V vs. Li+/Li for NMC811. The cell where the NMC electrode is cycled to 4.5 V does, however, contain the hydrolysis products of LiPF6 (HF and fluorophosphate esters), suggesting that water is formed at this potential. The absence of methanol is thus ascribed to the faster hydrolysis of LiPF6versus DMC and/or the small amount of water formed at this potential.
The proposed reaction and mechanism for the chemical oxidation of methanol to formaldehyde are given in Scheme 5. Methanol is oxidised by transition metal ions on the surface of the electrode, resulting in the formation of formaldehyde and water, and the reduction of the transition metal ion. The proposed mechanism is loosely based on those suggested for the oxidation of methanol on iron molybdate and ruthenium complex catalysts:100,101 an acid–base reaction between methanol and a bridging oxygen results an methoxy group adsorbed to the TM ion and terminal OH group (step I and II). Nucleophilic attack by the OH oxygen on the methoxy group results in formation of formaldehyde and water, and the reduction of the transition metal ion at the surface (step III and IV).
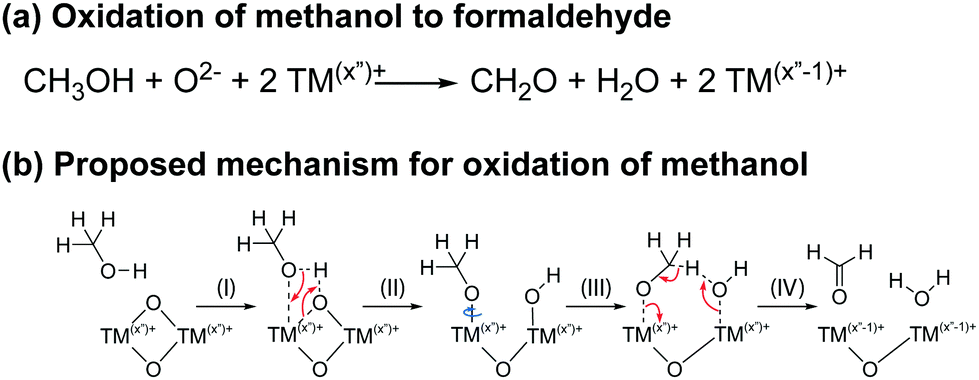 | ||
| Scheme 5 The proposed reaction (top) and mechanism (bottom) for the oxidation of methanol to formaldehyde at the surface of the NMC electrode. The oxidation states of the transition metal ions in this scheme are illustrative and other oxidation states are possible, the NMCs comprising a mixture of Ni3+ and Ni4+ (in the bulk) at the potentials at which these reactions occur. | ||
The presence of acetal species (methanediol and methoxymethanol) is ascribed to the reaction of water and methanol with formaldehyde. Scheme 6 shows the proposed mechanism for the hydration of formaldehyde: nucleophilic attack by water or methanol on the carbonyl carbon of formaldehyde result in the formation of methanediol and methoxymethanol, respectively.
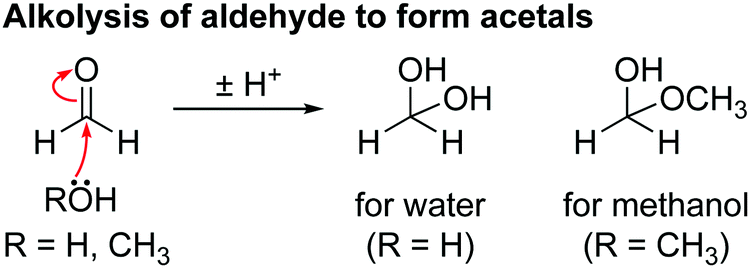 | ||
| Scheme 6 The reaction for the hydration of aldehydes by water (R = H) or methanol (R = CH3) to form acetals. | ||
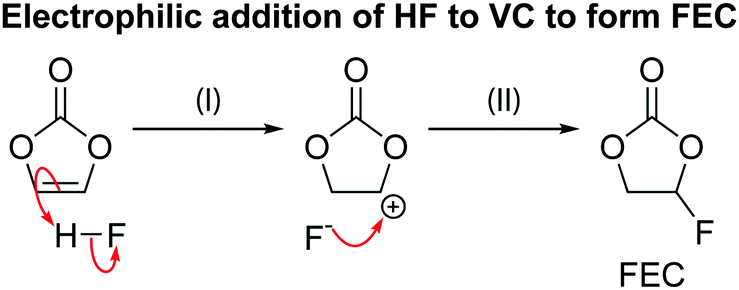 | ||
| Scheme 7 The reaction for electrophilic addition of hydrofluoric acid (HF) to vinylene carbonate (VC) to form fluoroethylene carbonate (FEC). | ||
4.3 Summary of reactions at the positive electrode
An overview of the two routes for electrolyte decomposition at the NMC electrode was given in Fig. 11 and is now revisited in the context of the reaction schemes proposed above. At low potentials (i.e., <80% SOC), the carbonate solvent, EC, is dehydrogenated to VC, reducing the transition metal ions at the surface and producing protons which convert the NMC oxide surface to an oxy-hydroxide (Scheme 1). At high potentials (i.e., >80% SOC), 1O2 released from the transition metal oxide lattice reacts with EC to produce CO2, CO and water (Scheme 2). This water can then hydrolyse the electrolyte, resulting in the formation of fluorophosphates and HF (Scheme 3a) and the HF can react further with the glass fibre separator to produce boron and silicon fluorides (Scheme 3b) and with VC to form FEC (Scheme 7). The water (from EC + 1O2) also slowly hydrolyses DMC to form methanol (Scheme 4), which can subsequently be oxidised to formaldehyde and formic acid (Scheme 5). Both water and methanol can hydrate the formaldehyde to produce acetals (Scheme 6). All of the decomposition reactions at high potentials (>80% SOC) are initiated by the formation of water from the reaction between 1O2 and EC. Although all these reactions are expected to happen regardless of the negative electrode material, some of the reaction products can diffuse away and react with the negative electrode, effect known as ‘electrodes’ cross-talk’, as discussed below.4.4 Further reactions of the electrolyte decomposition products at the negative electrode
The comparison of the decomposition products formed in NMC/LFP cells with those formed in NMC/graphite cells reveals that fewer decomposition products are present in the NMC/graphite “full cells”. The only signals detected in the electrolyte from the NMC811/graphite cells were those of lithium formate and formic acid, in addition to the signals for LEDC and methanol resulting from reactions at the graphite electrode. The signals from formaldehyde, VC, FEC, acetals, HF, BFx and SiFx, fluorophosphates esters could not be detected. Except for that of lithium formate, no new signals were observed. This implies that there were no reactions between the graphite electrode or SEI and the decomposition products from the NMC electrode that resulted in (partial) dissolution of SEI components or modification of the decomposition products (i.e., no soluble reaction products were formed).The presence of lithium formate and formic acid is ascribed to the reduction of CO2 at the graphite electrode,102,103 rather than the oxidation of methanol at the NMC electrode, as the intermediate for methanol oxidation (formaldehyde) was not detected. The CO2 is produced through the chemical oxidation of EC by 1O2 and Li2CO3 decomposition at the NMC electrode, and, subsequently, CO2 diffuses to the graphite electrode, where it is consumed.33,104 Even though methanol could arise from the hydrolysis of DMC (induced at the positive electrode), the quantities observed in the “full cell” are similar to those observed in the LFP/graphite cell and is thus attributed to the reduction of DMC at the graphite electrode.
The absence of the decomposition products formed at the NMC electrode in the NMC/graphite “full cells” is ascribed to the consumption of water, formed through the reaction between 1O2 and EC (which initiates the electrolyte decomposition chain), at the graphite electrode. Two alternative reaction pathways for water involving the graphite electrode are the hydrolysis of SEI components and the reduction of water to LiOH and H2. As no hydrolysis products of SEI components are detected in the electrolyte solution, it is concluded that water is reduced to LiOH and H2 at the graphite surface, thickening the SEI with inorganic components.105–107 Trace quantities of HF present in the pristine electrolyte solution will be reduced in a similar way to H2 and LiF.108 Reactions of HF with inorganic species such as Li2CO3 to form CO2, HF and H2O (and LiOH+ H2) are also possible. The absence of VC (the only product not formed as a result of the reaction between 1O2 and EC), is ascribed to the reduction of VC at the graphite electrode, a reaction which is known to occur at 1.1 V vs. Li+/Li.79,109 These results also suggest that the SEI on graphite in this cell is not completely passivating, as species in the electrolyte solution can still be reduced. These side reactions that occur at the graphite negative electrode, with compounds formed at the NMC electrode, have severe consequences in the lifetime of the battery, as discussed below.
4.5 Implications of electrolyte decomposition routes and products
Although it is desirable to cycle the batteries to high cell voltages, the results above show that electrolyte oxidation becomes more significant as the potential of the NMC electrode is increased, and as the time spent at this potential is increased.The formation of VC at low cell voltages is suggested to be less detrimental to the cell's lifetime: VC has been shown to be an effective electrolyte additive to produce a stable SEI on graphite electrodes, but when used at high concentrations (>2%) it causes an impedance rise at the negative electrode.109 A rough quantification (from NMR integration) revealed that ∼100 ppm VC is present in NMC/LFP cells after 10 cycles, making it an unlikely cause for the capacity fade. Furthermore, the potential at which VC is formed (<4.1 V) is lower than when the increased capacity fade is observed. The formation of VC could be prevented by introducing a coating on the NMC surface that would prevent direct contact between the electrolyte solution and the NMC particles.45 The formation of PO2F2− is also thought to be less harmful to the cell, as LiPO2F2 is routinely used as an additive in these systems,110,111 and thus some of the decomposition products may actually be beneficial.
The decomposition products formed at the positive electrode at high potentials (>80% SOC) appear to be consumed (i.e., reduced and/or deposited) on the surface of the graphite electrode, as no (new) soluble products were detected. The deposition of products on graphite surface further increases the cell impedance, and over many charge–discharge cycles, this may limit the ion transport to the bulk of the negative electrode, making a significant contribution to the capacity fade of the cell.21,24,26,28 The small amount of decomposition products formed at ≥80% SOC (total products ∼1000 ppm, quantified by NMR integration, after 10 cycles between 4.7–3.0 V) may not explain all of the capacity loss that is generally observed. Even though no dissolution of the SEI was detected, it is still possible that the decomposition products modified the SEI (without dissolving it) exposing a fresh surface for continued electrolyte reduction. For example, acid–base reactions between the acidic species formed at the NMC electrode and the basic components of the SEI could increase the porosity of the SEI (e.g., HF will react readily with Li2CO3), allowing for the electrolyte solution to penetrate into the SEI and be reduced at the graphite surface. This could lead to a much greater decrease in the available lithium inventory than the consumption of the decomposition products alone. A more in-depth study of the reaction between the decomposition products formed at the positive electrode and the SEI on the graphite electrode could clarify this.
We note that one major source of electrolyte decomposition is water and thus, the formation of these decomposition products could be mitigated by introducing a water-scavenging electrolyte additive or separator. Another approach would be the use of water-stable salts (unlike LiPF6, e.g., lithium borates: LiBF4 or LiBOB; lithium imides: LiTFSI, LiFSI) or electrolytes resistant to attack by singlet oxygen (unlike EC). Alternatively, a coating or graded particle that hinders or even prevents the release of oxygen from the lattice and transition metal dissolution, could be used. While DMC does appear to be stable against singlet oxygen, future studies will investigate the stability of other linear carbonates and PC.
5 Conclusion
This work focused on understanding the electrolyte decomposition reactions occurring at NMC electrodes and the further reaction of decomposition products at the negative electrode (graphite). Using solution NMR spectroscopy, the soluble decomposition products formed at NMC electrodes and in NMC/graphite cells were identified for the first time. The NMR results were complemented by gas analysis experiments to yield a more complete picture of the electrode/electrolyte decomposition reactions. To explore various possible decomposition mechanisms, the electrolyte solvent was reacted with isotopically labelled singlet oxygen (17O-labelled 1O2, produced from 17O-labelled 3O2via a photosensitiser).A comparison of the electrolyte decomposition products formed at NMC electrodes at high SOC with those formed through the reaction with 1O2 showed that the detected products formed at high potentials in NMC-based cells are consistent with 1O2 being released from the lattice and reacting with the electrolyte solution.
The identified decomposition products revealed two distinct routes for electrolyte decomposition, each with a different onset potential. At low potentials (i.e., <80% SOC), EC is dehydrogenated to VC, which may be coupled to the reduction of transition metal ions at the surface, but without the release of any gaseous decomposition products. The second, and more destructive, mechanism occurs when the material reaches 80% SOC, and 1O2 is released from the lattice: 1O2 chemically oxidises the electrolyte solvent (EC) to produce H2O, CO2 and CO. The formed water then hydrolyses the electrolyte solution and initiates a series of reactions that were so far unknown to occur in lithium-ion batteries: the oxidation of alcohols to their corresponding aldehydes and carboxylic acids, the hydration of aldehydes to form acetals, and the formation of FEC from VC – these products being identified by NMR. The NMC/graphite cells revealed fewer decomposition products, which is attributed to the reduction of water to form LiOH and H2 at the graphite (SEI) surface. The increased parasitic reactions at the negative electrode decrease the available lithium inventory and may contribute to the observed capacity fade when the cell is cycled to higher voltages. However, the interaction between the decomposition products and the SEI may be more complex (involving modifications of the SEI and the exposure of fresh surface leading to continual electrolyte reduction) and will be the subject of future studies.
The release of 1O2 drives the electrolyte decomposition reactions at the NMC electrode, a process which is intrinsically linked to reaching high SOC and thus higher cell capacities. Understanding the mechanism via which oxygen is released and developing strategies to prevent this process will be valuable for improving the lifetime of lithium-ion batteries, particularly those containing the more environmentally-sustainable Ni-rich positive electrode materials.
Author contributions
Bernardine L. D. Rinkel: conceptualisation; methodology; investigation; writing – original draft; writing – review & editing. J. Padmanabhan Vivek: methodology; investigation; writing – review & editing. Nuria Garcia-Araez: funding acquisition; supervision; writing – review & editing. Clare P. Grey: conceptualisation; funding acquisition; supervision; writing – review & editing.Conflicts of interest
There are no conflicts to declare.Acknowledgements
This work was funded by the ISCF Faraday Challenge project on “Degradation of Battery Materials” made available through grant EP/S003053/1. DR and CPG were supported by an ERC Advanced Investigator Grant for CPG (EC H2020 835073). N. G.-A. also thanks the EPSRC for an early career fellowship (EP/N024303/1). We would like to thank James Ellison and Ian Farnan for assistance with assembling the singlet oxygen setup and for providing 17O-enriched O2 gas, respectively. We would also like to thank David Hall for useful discussions.References
- R. Schmuch, R. Wagner, G. Hörpel, T. Placke and M. Winter, Performance and Cost of Materials for Lithium-Based Rechargeable Automotive Batteries, Nat. Energy, 2018, 3(4), 267–278, DOI:10.1038/s41560-018-0107-2
.
- J. Kim, H. Lee, H. Cha, M. Yoon, M. Park and J. Cho, Prospect and Reality of Ni-Rich Cathode for Commercialization, Adv. Energy Mater., 2018, 8, 1702028–1702052, DOI:10.1002/aenm.201702028
- H. J. Noh, S. Youn, C. S. Yoon and Y. K. Sun, Comparison of the Structural and Electrochemical Properties of Layered Li[NixCoyMnz]O2 (x = 1/3, 0.5, 0.6, 0.7, 0.8 and 0.85) Cathode Material for Lithium-Ion Batteries, J. Power Sources, 2013, 233, 121–130, DOI:10.1016/j.jpowsour.2013.01.063
- R. Jung, M. Metzger, F. Maglia, C. Stinner and H. A. Gasteiger, Oxygen Release and Its Effect on the Cycling Stability of LiNixMnyCozO2 (NMC) Cathode Materials for Li-Ion Batteries, J. Electrochem. Soc., 2017, 164(7), A1361–A1377, DOI:10.1149/2.0021707jes
- H. H. Ryu, K. J. Park, C. S. Yoon and Y. K. Sun, Capacity Fading of Ni-Rich Li[NixCoyMn1−x−y]O2 (0.6 ≤ x ≤ 0.95) Cathodes for High-Energy-Density Lithium-Ion Batteries: Bulk or Surface Degradation?, Chem. Mater., 2018, 30(3), 1155–1163, DOI:10.1021/acs.chemmater.7b05269
- J. Wandt, A. T. S. Freiberg, A. Ogrodnik and H. A. Gasteiger, Singlet Oxygen Evolution from Layered Transition Metal Oxide Cathode Materials and Its Implications for Lithium-Ion Batteries, Mater. Today, 2018, 21(8), 825–833, DOI:10.1016/j.mattod.2018.03.037
- F. Lin, I. M. Markus, D. Nordlund, T. C. Weng, M. D. Asta, H. L. Xin and M. M. Doeff, Surface Reconstruction and Chemical Evolution of Stoichiometric Layered Cathode Materials for Lithium-Ion Batteries, Nat. Commun., 2014, 5, 3529, DOI:10.1038/ncomms4529
- R. Jung, M. Metzger, F. Maglia, C. Stinner and H. A. Gasteiger, Chemical versus Electrochemical Electrolyte Oxidation on NMC111, NMC622, NMC811, LNMO, and Conductive Carbon, J. Phys. Chem. Lett., 2017, 8(19), 4820–4825, DOI:10.1021/acs.jpclett.7b01927
- B. Strehle, K. Kleiner, R. Jung, F. Chesneau, M. Mendez, H. A. Gasteiger and M. Piana, The Role of Oxygen Release from Li- and Mn-Rich Layered Oxides during the First Cycles Investigated by On-Line Electrochemical Mass Spectrometry, J. Electrochem. Soc., 2017, 164(2), A400–A406, DOI:10.1149/2.1001702jes
- R. Jung, P. Strobl, F. Maglia, C. Stinner and H. A. Gasteiger, Temperature Dependence of Oxygen Release from LiNi0.6Mn0.2Co0.2O2 (NMC622) Cathode Materials for Li-Ion Batteries, J. Electrochem. Soc., 2018, 165(11), A2869–A2879, DOI:10.1149/2.1261811jes
- A. T. S. Freiberg, M. K. Roos, J. Wandt, R. De Vivie-Riedle and H. A. Gasteiger, Singlet Oxygen Reactivity with Carbonate Solvents Used for Li-Ion Battery Electrolytes, J. Phys. Chem. A, 2018, 122(45), 8828–8839, DOI:10.1021/acs.jpca.8b08079
- J. Wandt, A. Freiberg, R. Thomas, Y. Gorlin, A. Siebel, R. Jung, H. A. Gasteiger and M. Tromp, Transition Metal Dissolution and Deposition in Li-Ion Batteries Investigated by Operando X-Ray Absorption Spectroscopy, J. Mater. Chem. A, 2016, 4(47), 18300–18305, 10.1039/C6TA08865A
- H. Zheng, Q. Sun, G. Liu, X. Song and V. S. Battaglia, Correlation between Dissolution Behavior and Electrochemical Cycling Performance for LiNi1/3Co1/3Mn1/3O2-Based Cells, J. Power Sources, 2012, 207, 134–140, DOI:10.1016/j.jpowsour.2012.01.122
- J. A. Gilbert, I. A. Shkrob and D. P. Abraham, Transition Metal Dissolution, Ion Migration, Electrocatalytic Reduction and Capacity Loss in Lithium-Ion Full Cells, J. Electrochem.
Soc., 2017, 164(2), A389–A399, DOI:10.1149/2.1111702jes
- C. Zhan, T. Wu, J. Lu and K. Amine, Dissolution, Migration, and Deposition of Transition Metal Ions in Li-Ion Batteries Exemplified by Mn-Based Cathodes-A Critical Review, Energy Environ. Sci., 2018, 11(2), 243–257, 10.1039/c7ee03122j
- K. J. Park, J. Y. Hwang, H. H. Ryu, F. Maglia, S. J. Kim, P. Lamp, C. S. Yoon and Y. K. Sun, Degradation Mechanism of Ni-Enriched NCA Cathode for Lithium Batteries: Are Microcracks Really Critical?, ACS Energy Lett., 2019, 4(6), 1394–1400, DOI:10.1021/acsenergylett.9b00733
- J. M. Lim, T. Hwang, D. Kim, M. S. Park, K. Cho and M. Cho, Intrinsic Origins of Crack Generation in Ni-Rich LiNi0.8Co0.1Mn0.1O2 Layered Oxide Cathode Material, Sci. Rep., 2017, 7, 2–11, DOI:10.1038/srep39669
- H. H. Ryu, G. T. Park, C. S. Yoon and Y. K. Sun, Microstructural Degradation of Ni-Rich Li[NixCoyMn1−x−y]O2 Cathodes During Accelerated Calendar Aging, Small, 2018, 14(45), 1–8, DOI:10.1002/smll.201803179
- L. M. Thompson, W. Stone, A. Eldesoky, N. K. Smith, C. R. M. Mcfarlane, J. S. Kim, M. B. Johnson, R. Petibon and J. R. Dahn, Quantifying Changes to the Electrolyte and Negative Electrode in Aged NMC532/Graphite Lithium-Ion Cells, J. Electrochem. Soc., 2018, 165(11), 2732–2740, DOI:10.1149/2.0721811jes
- X. Ma, J. E. Harlow, J. Li, L. Ma, D. S. Hall, M. Genovese, M. Cormier, J. R. Dahn and S. Buteau, Hindering Rollover Failure of Li[Ni0.5Mn0.3Co0.2]O2/Graphite Pouch Cells during Long-Term Cycling, J. Electrochem. Soc., 2019, 166(4), A711–A724, DOI:10.1149/2.0801904jes
- D. J. Xiong, L. D. Ellis, K. J. Nelson, T. Hynes, R. Petibon and J. R. Dahn, Rapid Impedance Growth and Gas Production at the Li-Ion Cell Positive Electrode in the Absence of a Negative Electrode, J. Electrochem. Soc., 2016, 163(14), A3069–A3077, DOI:10.1149/2.1031614jes
- M. Dubarry, V. Svoboda, R. Hwu and B. Y. Liaw, Incremental Capacity Analysis and Close-to-Equilibrium OCV Measurements to Quantify Capacity Fade in Commercial Rechargeable Lithium Batteries, Electrochem. Solid-State Lett., 2006, 9(10), A454–A457, DOI:10.1149/1.2221767
- M. Dubarry, V. Svoboda, R. Hwu and B. Y. Liaw, Capacity and Power Fading Mechanism Identification from a Commercial Cell Evaluation, J. Power Sources, 2007, 165(2), 566–572, DOI:10.1016/j.jpowsour.2006.10.046
- M. Dubarry, C. Truchot, B. Y. Liaw, K. Gering, S. Sazhin, D. Jamison and C. Michelbacher, Evaluation of Commercial Lithium-Ion Cells Based on Composite Positive Electrode for Plug-in Hybrid Electric Vehicle Applications. Part II. Degradation Mechanism under 2 C Cycle Aging, J. Power Sources, 2011, 196(23), 10336–10343, DOI:10.1016/j.jpowsour.2011.08.078
- I. Bloom, A. N. Jansen, D. P. Abraham, J. Knuth, S. A. Jones, V. S. Battaglia and G. L. Henriksen, Differential Voltage Analyses of High-Power, Lithium-Ion Cells 1. Technique and Application, J. Power Sources, 2005, 139(1–2), 295–303, DOI:10.1016/j.jpowsour.2004.07.021
- J. C. Burns, A. Kassam, N. N. Sinha, L. E. Downie, L. Solnickova, B. M. Way and J. R. Dahn, Predicting and Extending the Lifetime of Li-Ion Batteries, J. Electrochem. Soc., 2013, 160(9), A1451–A1456, DOI:10.1149/2.060309jes
- W. M. Dose, C. Xu, C. P. Grey and M. F. L. De Volder, Effect of Anode Slippage on Cathode Cutoff Potential and Degradation Mechanisms in Ni-Rich Li-Ion Batteries, Cell Rep. Phys. Sci., 2020, 1(11), 100253, DOI:10.1016/j.xcrp.2020.100253
- R. Dedryvère, D. Foix, S. Franger, S. Patoux, L. Daniel and D. Gonbeau, Electrode/Electrolyte Interface Reactivity in High-Voltage Spinel LiMn1.6Ni0.4O4/Li4Ti5O12 Lithium-Ion Battery, J. Phys. Chem. C, 2010, 114(24), 10999–11008, DOI:10.1021/jp1026509
- R. Sahore, F. Dogan and I. D. Bloom, Identification of Electrolyte-Soluble Organic Cross-Talk Species in a Lithium-Ion Battery via a Two-Compartment Cell, Chem. Mater., 2019, 31(8), 2884–2891, DOI:10.1021/acs.chemmater.9b00063
- M. Metzger, B. Strehle, S. Solchenbach and H. A. Gasteiger, Origin of H2 Evolution in LIBs: H2O Reduction vs. Electrolyte Oxidation, J. Electrochem. Soc., 2016, 163(5), A798–A809, DOI:10.1149/2.1151605jes
- L. D. Ellis, J. P. Allen, L. M. Thompson, J. E. Harlow, W. J. Stone, I. G. Hill and J. R. Dahn, Quantifying, Understanding and Evaluating the Effects of Gas Consumption in Lithium-Ion Cells, J. Electrochem. Soc., 2017, 164(14), A3518–A3528, DOI:10.1149/2.0191714jes
- S. Solchenbach, G. Hong, A. T. S. Freiberg, R. Jung and H. A. Gasteiger, Electrolyte and SEI Decomposition Reactions of Transition Metal Ions Investigated by On-Line Electrochemical Mass Spectrometry, J. Electrochem. Soc., 2018, 165(14), A3304–A3312, DOI:10.1149/2.0511814jes
- D. J. Xiong, L. D. Ellis, R. Petibon, T. Hynes, Q. Q. Liu and J. R. Dahn, Studies of Gas Generation, Gas Consumption and Impedance Growth in Li-Ion Cells with Carbonate or Fluorinated Electrolytes Using the Pouch Bag Method, J. Electrochem. Soc., 2017, 164(2), A340–A347, DOI:10.1149/2.1091702jes
- R. Imhof, Oxidative Electrolyte Solvent Degradation in Lithium-Ion Batteries: An In Situ Differential Electrochemical Mass Spectrometry Investigation, J. Electrochem. Soc., 1999, 146(5), 1702, DOI:10.1149/1.1391829
- S. Solchenbach, M. Metzger, M. Egawa, H. Beyer and H. A. Gasteiger, Quantification of PF 5 and POF 3 from Side Reactions of LiPF6 in Li-Ion Batteries, J. Electrochem. Soc., 2018, 165(13), A3022–A3028, DOI:10.1149/2.0481813jes
- J. L. Tebbe, T. F. Fuerst and C. B. Musgrave, Degradation of Ethylene Carbonate Electrolytes of Lithium Ion Batteries via Ring Opening Activated by LiCoO2 Cathode Surfaces and Electrolyte Species, ACS Appl. Mater. Interfaces, 2016, 8(40), 26664–26674, DOI:10.1021/acsami.6b06157
- L. Xing, W. Li, C. Wang, F. Gu, M. Xu, C. Tan and J. Yi, Theoretical Investigations on Oxidative Stability of Solvents and Oxidative Decomposition Mechanism of Ethylene Carbonate for Lithium Ion Battery Use, J. Phys. Chem. B, 2009, 113(52), 16596–16602, DOI:10.1021/jp9074064
- N. Galushkin, N. N. Yazvinskaya and D. N. Galushkin, Mechanism of Gases Generation during Lithium-Ion Batteries Cycling, J. Electrochem. Soc., 2019, 166(6), A897–A908, DOI:10.1149/2.0041906jes
- M. Arakawa and J. I. Yamaki, Anodic Oxidation of Propylene Carbonate and Ethylene Carbonate on Graphite Electrodes, J. Power Sources, 1995, 54(2), 250–254, DOI:10.1016/0378-7753(94)02078-H
- I. Azcarate, W. Yin, C. Méthivier, F. Ribot, C. Laberty-Robert and A. Grimaud, Assessing the Oxidation Behavior of EC:DMC Based Electrolyte on Non-Catalytically Active Surface, J. Electrochem. Soc., 2020, 167(8), 080530, DOI:10.1149/1945-7111/ab8f57
- D. Streich, C. Erk, A. Guéguen, P. Müller, F. F. Chesneau and E. J. Berg,
Operando Monitoring of Early Ni-Mediated Surface Reconstruction in Layered Lithiated Ni-Co-Mn Oxides, J. Phys. Chem. C, 2017, 121(25), 13481–13486, DOI:10.1021/acs.jpcc.7b02303
- L. Giordano, P. Karayaylali, Y. Yu, Y. Katayama, F. Maglia, S. Lux and Y. Shao-Horn, Chemical Reactivity Descriptor for the Oxide-Electrolyte Interface in Li-Ion Batteries, J. Phys. Chem. Lett., 2017, 8(16), 3881–3887, DOI:10.1021/acs.jpclett.7b01655
- Y. Yu, P. Karayaylali, Y. Katayama, L. Giordano, M. Gauthier, F. Maglia, R. Jung, I. Lund and Y. Shao-horn, Coupled LiPF6 Decomposition and Carbonate Dehydrogenation Enhanced by Highly Covalent Metal Oxides in High-Energy Li-Ion Batteries, J. Phys. Chem. C, 2018, 122, 27368–27382, DOI:10.1021/acs.jpcc.8b07848
- T. M. Østergaard, L. Giordano, I. E. Castelli, F. Maglia, B. K. Antonopoulos, Y. Shao-Horn and J. Rossmeisl, Oxidation of Ethylene Carbonate on Li Metal Oxide Surfaces, J. Phys. Chem. C, 2018, 122(19), 10442–10449, DOI:10.1021/acs.jpcc.8b01713
- Y. Zhang, Y. Katayama, R. Tatara, L. Giordano, Y. Yu, D. Fraggedakis, J. G. Sun, F. Maglia, R. Jung, M. Z. Bazant and Y. Shao-Horn, Revealing Electrolyte Oxidation: Via Carbonate Dehydrogenation on Ni-Based Oxides in Li-Ion Batteries by in Situ Fourier Transform Infrared Spectroscopy, Energy Environ. Sci., 2020, 13(1), 183–199, 10.1039/c9ee02543j
- R. Bernhard, S. Meini and H. A. Gasteiger, On-Line Electrochemical Mass Spectrometry Investigations on the Gassing Behavior of Li4Ti5O12 Electrodes and Its Origins, J. Electrochem. Soc., 2014, 161(4), A497–A505, DOI:10.1149/2.013404jes
- M. Metzger, J. Sicklinger, D. Haering, C. Kavakli, C. Stinner, C. Marino and H. A. Gasteiger, Carbon Coating Stability on High-Voltage Cathode Materials in H2O-Free and H2O-Containing Electrolyte, J. Electrochem. Soc., 2015, 162(7), A1227–A1235, DOI:10.1149/2.0461507jes
- B. Michalak, H. Sommer, D. Mannes, A. Kaestner, T. Brezesinski and J. Janek, Gas Evolution in Operating Lithium-Ion Batteries Studied in Situ by Neutron Imaging, Sci. Rep., 2015, 5, 1–9, DOI:10.1038/srep15627
- T. Hatsukade, A. Schiele, P. Hartmann, T. Brezesinski and J. Janek, Origin of Carbon Dioxide Evolved during Cycling of Nickel-Rich Layered NCM Cathodes, ACS Appl. Mater. Interfaces, 2018, 10(45), 38892–38899, DOI:10.1021/acsami.8b13158
- A. Guéguen, J. E. Soc, D. Streich, M. He, M. Mendez, F. F. Chesneau, P. Nov and E. J. Berg, Decomposition of LiPF6 in High Energy Lithium-Ion Batteries Studied with Online Electrochemical Mass Spectrometry Decomposition of LiPF6 in High Energy Lithium-Ion Batteries Studied with Online Electrochemical Mass Spectrometry, J. Electrochem. Soc., 2016, 163(6), A1095–A1100, DOI:10.1149/2.0981606jes
- R. Lundström and E. J. Berg, Design and Validation of an Online Partial and Total Pressure Measurement System for Li-Ion Cells, J. Power Sources, 2021, 485, 229347–229354, DOI:10.1016/j.jpowsour.2020.229347
- R. Jung, R. Morasch, P. Karayaylali, K. Phillips, F. Maglia, C. Stinner, Y. Shao-Horn and H. A. Gasteiger, Effect of Ambient Storage on the Degradation of Ni-Rich Positive Electrode Materials for Li-Ion Batteries, J. Electrochem. Soc., 2018, 165(2), A132–A141, DOI:10.1149/2.0401802jes
- S. Pérez-Rodríguez, S. D. S. Fitch, P. N. Bartlett and N. Garcia-Araez, LiFePO4 Battery Material for the Production of Lithium from Brines: Effect of Brine Composition and Benefits of Dilution, ChemSusChem, 2022, 15(1), 1–12, DOI:10.1002/cssc.202102182
- N. Intaranont, N. Garcia-Araez, A. L. Hector, J. A. Milton and J. R. Owen, Selective Lithium Extraction from Brines by Chemical Reaction with Battery Materials, J. Mater. Chem. A, 2014, 2(18), 6374–6377, 10.1039/c4ta01101e
- K. Hayashi, Y. Nemoto, S. Tobishima and J. Yamaki, Mixed Solvent Electrolyte for High Voltage Lithium Metal Secondary Cells, Electrochim. Acta, 1999, 44, 2337–2344 CrossRef CAS
- X. Zhang, J. E. Soc, X. Zhang, R. Kostecki, T. J. Richardson, J. K. Pugh and P. N. Ross, Electrochemical and Infrared Studies of the Reduction of Organic Carbonates Electrochemical and Infrared Studies of the Reduction of Organic Carbonates, J. Electrochem. Soc., 2001, 148(12), A1341–A1345, DOI:10.1149/1.1415547
-
D. Aurbach, Nonaqueous Electrochemistry, Marcel Dekker, Inc, New York, 1999 Search PubMed
- N. Ryall and N. Garcia-Araez, Highly Sensitive Operando Pressure Measurements of Li-Ion Battery Materials with a Simply Modified Swagelok Cell, J. Electrochem. Soc., 2020, 167(11), 110511, DOI:10.1149/1945-7111/ab9e81
- M. Metzger, C. Marino, J. Sicklinger, D. Haering and H. A. Gasteiger, Anodic Oxidation of Conductive Carbon and Ethylene Carbonate in High-Voltage Li-Ion Batteries Quantified by On-Line Electrochemical Mass Spectrometry, J. Electrochem. Soc., 2015, 162(7), A1123–A1134, DOI:10.1149/2.0951506jes
- P. Gottschalk, J. Paczkowski and D. C. Neckers, Factors Influencing the Quantum Yields for Rose Bengal Formation of Singlet Oxygen, J. Photochem., 1986, 35(3), 277–281, DOI:10.1016/0047-2670(86)87059-9
- A. Schiele, T. Hatsukade, B. B. Berkes, P. Hartmann, T. Brezesinski and J. Janek, High-Throughput in Situ Pressure Analysis of Lithium-Ion Batteries, Anal. Chem., 2017, 89(15), 8122–8128, DOI:10.1021/acs.analchem.7b01760
- J. Self, C. P. Aiken, R. Petibon and J. R. Dahn, Survey of Gas Expansion in Li-Ion NMC Pouch Cells, J. Electrochem. Soc., 2015, 162(6), A796–A802, DOI:10.1149/2.0081506jes
- B. L. D. Rinkel, D. S. Hall, I. Temprano and C. P. Grey, Electrolyte Oxidation Pathways in Lithium-Ion Batteries, J. Am. Chem. Soc., 2020, 142(35), 15058–15074, DOI:10.1021/jacs.0c06363
- M. Onuki, S. Kinoshita, Y. Sakata, M. Yanagidate, Y. Otake, M. Ue and M. Deguchi, Identification of the Source of Evolved Gas in Li-Ion Batteries Using [Sup 13]C-Labeled Solvents, J. Electrochem. Soc., 2008, 155(11), A794, DOI:10.1149/1.2969947
- B. Strehle, S. Solchenbach, M. Metzger, K. U. Schwenke and H. A. Gasteiger, The Effect of CO 2 on Alkyl Carbonate Trans-Esterification during Formation of Graphite Electrodes in Li-Ion Batteries, J. Electrochem. Soc., 2017, 164(12), A2513–A2526, DOI:10.1149/2.1001712jes
- H. Yoshida, T. Fukunaga, T. Hazama, M. Terasaki, M. Mizutani and M. Yamachi, Degradation Mechanism of Alkyl Carbonate Solvents Used in Lithium-Ion Cells during Initial Charging, J. Power Sources, 1997, 68(2), 311–315, DOI:10.1016/S0378-7753(97)02635-9
- R. Bernhard, M. Metzger and H. A. Gasteiger, Gas Evolution at Graphite Anodes Depending on Electrolyte Water Content and SEI Quality Studied by On-Line Electrochemical Mass Spectrometry, J. Electrochem. Soc., 2015, 162(10), A1984–A1989, DOI:10.1149/2.0191510jes
- M. Metzger, B. Strehle, S. Solchenbach and H. A. Gasteiger, Hydrolysis of Ethylene Carbonate with Water and Hydroxide under Battery Operating Conditions, J. Electrochem. Soc., 2016, 163(7), A1219–A1225, DOI:10.1149/2.0411607jes
- B. Ravdel, K. M. Abraham, R. Gitzendanner, J. DiCarlo, B. Lucht and C. Campion, Thermal Stability of Lithium-Ion Battery Electrolytes, J. Power Sources, 2003, 119–121, 805–810, DOI:10.1016/S0378-7753(03)00257-X
- C. L. Campion, W. Li and B. L. Lucht, Thermal Decomposition of LiPF6 -Based Electrolytes for Lithium-Ion Batteries, J. Electrochem. Soc., 2005, 152(12), A2327–A2334, DOI:10.1149/1.2083267
- G. R. Fulmer, A. J. M. Miller, N. H. Sherden, H. E. Gottlieb, A. Nudelman, B. M. Stoltz, J. E. Bercaw and K. I. Goldberg, NMR Chemical Shifts of Trace Impurities: Common Laboratory Solvents, Organics, and Gases in Deuterated Solvents Relevant to the Organometallic Chemist, Organometallics, 2010, 29(9), 2176–2179, DOI:10.1021/om100106e
- I. G. Shenderovich, S. N. Smirnov, G. S. Denisov, V. A. Gindin, N. S. Golubev, A. Dunger, R. Reibke, S. Kirpekar, O. L. Malkina and H. H. Limbach, Nuclear Magnetic Resonance of Hydrogen Bonded Clusters B between F- and (HF)n: Experiment and Theory, Ber. Bunsen-Ges., 1998, 102(3), 422–428, DOI:10.1002/bbpc.19981020322
- I. G. Shenderovich, P. M. Tolstoy, N. S. Golubev, S. N. Smirnov, G. S. Denisov and H. H. Limbach, Low-Temperature NMR Studies of the Structure and Dynamics of a Novel Series of Acid-Base Complexes of HF with Collidine Exhibiting Scalar Couplings across Hydrogen Bonds, J. Am. Chem. Soc., 2003, 125(38), 11710–11720, DOI:10.1021/ja029183a
- N. Mahne, B. Schafzahl, C. Leypold, M. Leypold, S. Grumm, A. Leitgeb, G. A. Strohmeier, M. Wilkening, O. Fontaine, D. Kramer, C. Slugovc, S. M. Borisov and S. A. Freunberger, Singlet Oxygen Generation as a Major Cause for Parasitic Reactions during Cycling of Aprotic Lithium-Oxygen Batteries, Nat. Energy, 2017, 2(5), 1–9, DOI:10.1038/nenergy.2017.36
- N. A. Stephenson and A. T. Bell, Quantitative Analysis of Hydrogen Peroxide by 1H NMR Spectroscopy, Anal. Bioanal. Chem., 2005, 381(6), 1289–1293, DOI:10.1007/s00216-005-3086-7
- H. Sharma, N. K. Tan, N. Trinh, J. H. Yeo, E. J. New and F. M. Pfeffer, A Fluorescent Naphthalimide NADH Mimic for Continuous and Reversible Sensing of Cellular Redox State, Chem. Commun., 2020, 56(15), 2240–2243, 10.1039/c9cc09748a
- S. E. Ashbrook and M. E. Smith, Solid State 17 O NMR—an Introduction to the Background Principles and Applications to Inorganic Materials, Chem. Soc. Rev., 2006, 35(8), 718–735, 10.1039/B514051J
- W. Makulski and K. Jackowski, The 17O Nuclear Magnetic Shielding Scale from Gas-Phase Measurements, J. Mol. Struct., 2003, 651–653, 265–269, DOI:10.1016/S0022-2860(02)00638-5
- H. Ota, Y. Sakata, A. Inoue and S. Yamaguchi, Analysis of Vinylene Carbonate Derived SEI Layers on Graphite Anode, J. Electrochem. Soc., 2004, 151(10), A1659, DOI:10.1149/1.1785795
- H. Ota, Y. Sakata, Y. Otake, K. Shima, M. Ue and J. Yamaki, Structural and Functional Analysis of Surface Film on Li Anode in Vinylene Carbonate-Containing Electrolyte, J. Electrochem. Soc., 2004, 151(11), A1778, DOI:10.1149/1.1798411
- D. J. Xiong, R. Petibon, L. Madec, D. S. Hall and J. R. Dahn, Some Effects of Intentionally Added Water on LiCoO2/Graphite Pouch Cells, J. Electrochem. Soc., 2016, 163(8), A1678–A1685, DOI:10.1149/2.0901608jes
- H. R. Morin, D. G. Graczyk, Y. Tsai, S. Lopykinski, H. Iddir, J. C. Garcia, N. Dietz Rago, S. Trask, L. R. Flores, S. B. Son, Z. Zhang, N. M. Johnson and I. Bloom, Transition-Metal Dissolution from NMC-Family Oxides: A Case Study, ACS Appl. Energy Mater., 2020, 3(3), 2565–2575, DOI:10.1021/acsaem.9b02277
- Z. Ruff, C. Xu and C. P. Grey, Transition Metal Dissolution and Degradation in NMC811-Graphite Electrochemical Cells, J. Electrochem. Soc., 2021, 168(6), 060518, DOI:10.1149/1945-7111/ac0359
- S. Jeong, J. Kim and J. Mun, Self-Generated Coating of LiCoO 2 by Washing and Heat Treatment without Coating Precursors, J. Electrochem. Soc., 2019, 166(3), A5038–A5044, DOI:10.1149/2.0071903jes
- D. Pritzl, T. Teufl, A. T. S. Freiberg, B. Strehle, J. Sicklinger, H. Sommer, P. Hartmann and H. A. Gasteiger, Washing of Nickel-Rich Cathode Materials for Lithium-Ion Batteries: Towards a Mechanistic Understanding, J. Electrochem. Soc., 2019, 166(16), A4056–A4066, DOI:10.1149/2.1351915jes
- A. C. Martinez, S. Grugeon, D. Cailleu, M. Courty, P. Tran-Van, B. Delobel and S. Laruelle, High Reactivity of the Nickel-Rich LiNi1-x-YMnxCoyO2 Layered Materials Surface towards H2O/CO2 Atmosphere and LiPF6-Based Electrolyte, J. Power Sources, 2020, 468, 1–10, DOI:10.1016/j.jpowsour.2020.228204
- R. Benedek, M. M. Thackeray and A. Van De Walle, Free Energy for Protonation Reaction in Lithium-Ion Battery Cathode Materials, Chem. Mater., 2008, 20(17), 5485–5490, DOI:10.1021/cm703042r
- X. Gu, J. L. Liu, J. H. Yang, H. J. Xiang, X. G. Gong and Y. Y. Xia, First-Principles Study of H+ Intercalation in Layer-Structured LiCoO2, J. Phys. Chem. C, 2011, 115(25), 12672–12676, DOI:10.1021/jp202846p
- S. E. Renfrew and B. D. McCloskey, Residual Lithium Carbonate Predominantly Accounts for First Cycle CO2 and CO Outgassing of Li-Stoichiometric and Li-Rich Layered Transition Metal Oxides, J. Am. Chem. Soc., 2017, 139, 17853–17860, DOI:10.1021/jacs.7b08461
- S. E. Renfrew, L. A. Kaufman and B. D. McCloskey, Altering Surface Contaminants and Defects Influences the First-Cycle Outgassing and Irreversible Transformations of LiNi0.6Mn0.2Co0.2O2, ACS Appl. Mater. Interfaces, 2019, 11(38), 34913–34921, DOI:10.1021/acsami.9b09992
- N. Mahne, S. E. Renfrew, B. D. McCloskey and S. A. Freunberger, Electrochemical Oxidation of Lithium Carbonate Generates Singlet Oxygen, Angew. Chem., Int. Ed., 2018, 57(19), 5529–5533, DOI:10.1002/anie.201802277
- H. Zhao, J. Wang, H. Shao, K. Xu and Y. Deng, Gas Generation Mechanism in Li-Metal Batteries, Energy Environ. Mater., 2021, 1–10, DOI:10.1002/eem2.12180
- X. Zhang, J. K. Pugh and P. N. Ross, Computation of Thermodynamic Oxidation Potentials of Organic Solvents Using Density Functional Theory, J. Electrochem. Soc., 2001, 148(5), E183, DOI:10.1149/1.1362546
- A. Sagadevan, K. C. Hwang and S. M. Der, Singlet Oxygen-Mediated Selective C-H Bond Hydroperoxidation of Ethereal Hydrocarbons, Nat. Commun., 2017, 8(1), 1–8, DOI:10.1038/s41467-017-01906-5
- M. B. Schmid, K. Zeitler and R. M. Gschwind, NMR Investigations on the Proline-Catalyzed Aldehyde Self-Condensation: Mannich Mechanism, Dienamine Detection, and Erosion of the Aldol Addition Selectivity, J. Org. Chem., 2011, 76(9), 3005–3015, DOI:10.1021/jo200431v
- C. K. Fay, J. B. Grutzner, L. F. Johnson, S. Sternhell and P. W. Westerman, Proton Nuclear Magnetic Resonance Spectra of 1-Substituted Acenaphthenes and Other Systems of Well-Defined Geometry, J. Org. Chem., 1973, 38(18), 3122–3136, DOI:10.1021/jo00958a012
- G. C. S. Collins and W. O. George, Nuclear Magnetic Resonance Spectra of Glycolaldehyde, J. Chem. Soc. B, 1971, 1352–1355 RSC
- S. E. Sloop, J. K. Pugh, S. Wang, J. B. Kerr and K. Kinoshita, Chemical Reactivity of PF5 and LiPF6 in Ethylene Carbonate/Dimethyl Carbonate Solutions, Electrochem. Solid-State Lett., 2001, 4(4), A42–A44, DOI:10.1149/1.1353158
- S. Zafeiratos, T. Dintzer, D. Teschner, R. Blume, M. Hävecker, A. Knop-Gericke and R. Schlögl, Methanol Oxidation over Model Cobalt Catalysts: Influence of the Cobalt Oxidation State on the Reactivity, J. Catal., 2010, 269(2), 309–317, DOI:10.1016/j.jcat.2009.11.013
- M. Bowker, R. Holroyd, M. House, R. Bracey, C. Bamroongwongdee, M. Shannon and A. Carley, The Selective Oxidation of Methanol on Iron Molybdate Catalysts, Top. Catal., 2008, 48(1–4), 158–165, DOI:10.1007/s11244-008-9058-3
- J. X. Wang, X. T. Zhou, Q. Han, X. X. Guo, X. H. Liu, C. Xue and H. B. Ji, Efficient and Selective Oxidation of Alcohols to Carbonyl Compounds at Room Temperature by a Ruthenium Complex Catalyst and Hydrogen Peroxide, New J. Chem., 2019, 43(48), 19415–19421, 10.1039/c9nj04393d
- X. Lu, D. Y. C. Leung, H. Wang, M. K. H. Leung and J. Xuan, Electrochemical Reduction of Carbon Dioxide to Formic Acid, ChemElectroChem, 2014, 1(5), 836–849, DOI:10.1002/celc.201300206
- Y. Jin, N. J. H. Kneusels, P. C. M. M. Magusin, G. Kim, E. Castillo-Martínez, L. E. Marbella, R. N. Kerber, D. J. Howe, S. Paul, T. Liu and C. P. Grey, Identifying the Structural Basis for the Increased Stability of the Solid Electrolyte Interphase Formed on Silicon with the Additive Fluoroethylene Carbonate, J. Am. Chem. Soc., 2017, 139(42), 14992–15004, DOI:10.1021/jacs.7b06834
- K. U. Schwenke, S. Solchenbach, J. Demeaux, B. L. Lucht and H. A. Gasteiger, The Impact of CO2 Evolved from VC and FEC during Formation of Graphite Anodes in Lithium-Ion Batteries, J. Electrochem. Soc., 2019, 166(10), A2035–A2047, DOI:10.1149/2.0821910jes
- G. V. Zhuang and P. N. Ross, Analysis of the Chemical Composition of the Passive Film on Li-Ion Battery Anodes Using Attentuated Total Reflection Infrared Spectroscopy, Electrochem. Solid-State Lett., 2003, 6(7), A136–A139, DOI:10.1149/1.1575594
- A. Schechter, D. Aurbach and H. Cohen, X-Ray Photoelectron Spectroscopy Study of Surface Films Formed on Li Electrodes Freshly Prepared in Alkyl Carbonate Solutions, Langmuir, 1999, 15(9), 3334–3342, DOI:10.1021/la981048h
- K. Tasaki, A. Goldberg, J.-J. Lian, M. Walker, A. Timmons and S. J. Harris, Solubility of Lithium Salts Formed on the Lithium-Ion Battery Negative Electrode Surface in Organic Solvents, J. Electrochem. Soc., 2009, 156(12), A1019, DOI:10.1149/1.3239850
- D. Strmcnik, I. E. Castelli, J. G. Connell, D. Haering, M. Zorko, P. Martins, P. P. Lopes, B. Genorio, T. Østergaard, H. A. Gasteiger, F. Maglia, B. K. Antonopoulos, V. R. Stamenkovic, J. Rossmeisl and N. M. Markovic, Electrocatalytic Transformation of HF Impurity to H2 and LiF in Lithium-Ion Batteries, Nat. Catal., 2018, 1(4), 255–262, DOI:10.1038/s41929-018-0047-z
- J. C. Burns, R. Petibon, K. J. Nelson, N. N. Sinha, A. Kassam, B. M. Way and J. R. Dahn, Studies of the Effect of Varying Vinylene Carbonate (VC) Content in Lithium Ion Cells on Cycling Performance and Cell Impedance, J. Electrochem. Soc., 2013, 160(10), A1668–A1674, DOI:10.1149/2.031310jes
- L. Ma, L. Ellis, S. L. Glazier, X. Ma, Q. Liu, J. Li and J. R. Dahn, LiPO2F2 as an Electrolyte Additive in Li[Ni0.5Mn0.3Co0.2]O2/Graphite Pouch Cells, J. Electrochem. Soc., 2018, 165(5), A891–A899, DOI:10.1149/2.0381805jes
- L. Ma, L. Ellis, S. L. Glazier, X. Ma and J. R. Dahn, Combinations of LiPO2F2 and Other Electrolyte Additives in Li[Ni 0.5 Mn 0.3 Co 0.2]O 2/Graphite Pouch Cells, J. Electrochem. Soc., 2018, 165(9), A1718–A1724, DOI:10.1149/2.0661809jes
Footnote |
| † Electronic supplementary information (ESI) available: Experimental setup; electrochemical data; additional 1H, 17O and 19F NMR spectra and assignments. See DOI: https://doi.org/10.1039/d1ee04053g |
| This journal is © The Royal Society of Chemistry 2022 |