 Open Access Article
Creative Commons Attribution 3.0 Unported Licence
Pentanoic acid from γ-valerolactone and formic acid using bifunctional catalysis†
Majd
Al-Naji
 *abc,
Joost
Van Aelst
b,
Yuhe
Liao
b,
Martin
d'Hullian
 b,
Zhipeng
Tian
d,
Chenguang
Wang
d,
Roger
Gläser
 c and
Bert F.
Sels
*b
aMax Planck Institute of Colloids and Interfaces, Department of Colloid Chemistry, 14476 Potsdam, Germany. E-mail: majd.al-naji@mpikg.mpg.de
bCentre for Sustainable Catalysis and Engineering, KU Leuven, Leuven Chem & Tech, Celestijnenlaan 200F Bus 2461, B-3001 Heverlee, Belgium. E-mail: bert.sels@kuleuven.be
cInstitute of Chemical Technology, Universität Leipzig, Linnéstraße 3, 04103 Leipzig, Germany
dGuangzhou Institute of Energy Conversion, Chinese Academy of Sciences No.2, Nengyuan, Road, Tianhe District, Guangzhou 510641, China
First published on 22nd November 2019
Abstract
Pentanoic acid (PA) is an industrially relevant chemical used in several applications, currently manufactured from fossil feedstock. Conversion of γ-valerolactone (GVL), a stable platform chemical from cellulosic biorefineries, into PA is studied here in the presence of aqueous formic acid (FA), as a sustainable and available reducing agent. For this purpose, bifunctional catalyst comprising Pt supported on acidic zeolites were utilized. Pt has a dual role, decomposing FA into hydrogen in the fastest step occuring in the initial stage of the reaction, and hydrogenating pentenoic acids (PEAs) intermediates, which are formed through acid-catalyzed ring opening of GVL, to PA. Since ring-opening is thermodynamically disfavored under hydrothermal conditions at high temperature (543 K), hydrogenation on Pt is rate limiting and thus fast provision of hydrogen is a prerequisite to PA formation from GVL. Strong acidity such as on ZSM-5 is required to catalyze the dehydration/ring-opening step in the reaction cascade from GVL to PA. High surface area of Pt improves GVL conversion rate, whereas no dependency of rate on Brønsted acidity is observed in the applied conditions. Strong interaction of the Pt/ZSM-5 catalyst with FA and its decomposition side-products, e.g. CO, retards the hydrogenation step, and therefore may better be added stepwise. The temperature dependency of this cascade reaction was determined, showing an apparent activation energy for GVL conversion and FA dehydrogenation of 73 kJ mol−1 and 19 kJ mol−1, respectively. Finally, the selective one-pot process of levulinic (LA) instead of GVL, to PA using FA as reducing agent was pioneered successfully.
Introduction
The associated resource stress, price volatility, as well as climate change and pollution effects of our fossil raw materials-based economy, necessitates a transition towards a sustainable circular bio-economy based on renewable resources such as biomass.1–10 Recently, a large number of reports dealing with the production of chemicals and liquid transportation fuels from lignocellulosic biomass was published.12–20 Among them, the homogeneously and heterogeneously aqueous-phase hydrogenation of levulinic acid (LA) to pentanoic acid (PA) through γ-valerolactone (GVL) and pentenoic acids (PEAs) has received significant attention.10–21 This correlates to the straightforward and robust production of LA, i.e., via acid catalysis of lignocellulosic biomass, with an equimolar formation of aqueous formic acid (FA). The latter crude can be used as an alternative and sustainable source of H2, thus avoiding the production of external H2, which is currently produced from fossil methane. In the last decade, LA hydrogenation to GVL over supported metal catalysts using externally supplied H2 and alternative reducing agents has been studied intensively and successfully.22–24 GVL has thus been considered as one of the most important platform chemicals available in future lignocellulosic biorefineries. GVL possesses excellent solvent properties (e.g., solvation) for homogeneous and heterogeneous catalysis,25–35 but it may also serve as stable and non-toxic platform chemical to be converted to a wide range of other useful chemicals.One of such chemicals may be PA (or valeric acid). PA is currently produced industrially from 1-butene and syngas using the OXO process, followed by air oxidation of the aldehyde product into PA.36 Utilization of expensive soluble Rh catalysts and its recuperation are main disadvantages, besides the formation of considerable amounts of side-products such as branched products, alcohols and alkanes.36 PA has found wide application as ester type lubricants in aviation turbine oils, fire resistant hydraulic fluids, refrigerator oils, plasticizers, vinyl stabilizers, and specialty chemicals and pharmaceuticals.37 PA can also be readily converted into 5-nonanone (dibutyl ketone), an industrial solvent in paint and resins and potential biofuel precursor, using established gas phase ketonization technology.38 Esters of PA has recently been mentioned as a promising component of advanced biofuels.39–41
GVL to PA includes different processes involving hydrodeoxygenation, dehydration and hydrogenation chemistry. Use of solid acid and supported metal catalysts is therefore no surpise.42,43 For example, Yun et al.44 studied the gas-phase hydrodeoxygenation of GVL in temperature range of 523–623 K, utilizing supported metal phosphide catalysts and a commercial γ-Al2O3 and MCM-41. The complete GVL conversion via ring-opening to PEAs with subsequent hydrogenation mainly to PA was observed at 598 K and 623 K with different side products, i.e., pentanal, unsaturated C4 and C5 hydrocarbons and CO, due to subsequent hydrodeoxygenation and decarbonylation pathways that occur at the high reaction temperature.44 Also, Pd supported on sulphonated porous coordinated polymer (MIL-101-SO3H) was efficiently employed for the one-pot hydrogenation of GVL (conversion of 100%) to yield 83% ethyl pentanoate in ethanol at 523 K using 3 MPa of H2.44 High amounts of Brønsted acid sites, assisting GVL ring-opening, have been reported to be essential.45 Aqueous-phase selective hydrogenation of GVL to PA over supported metal catalysts has been barely investigated. Lange et al.46 successfully converted neat GVL to PA in a continuous flow system over bifunctional Pt/SiO2-ZSM-5 catalysts via acid-catalyzed ring-opening to PEAs, followed by metal-catalyzed hydrogenation to PA with externally supplied H2. Pentanol formed as side product reacts with PA to form pentyl esters, recognized as promising biofuels. Alternatively, mainly for catalyst stability reasons, the Dumesic group reported on the aqueous-phase conversion of GVL to PA over bifunctional Pd on Nb2O5 at 598 K and 3.5 MPa of H2 in a flow reactor.47
All reported investigations on GVL to PA have utilized organic solvent or externally supplied H2. Therefore, an integrated, intrinsically benign and sustainable process for the production of PA from the available aqueous mixture of LA (or GVL) and FA, as directly accessible from the acid catalysis of cellulosic biomass in the biorefinery, may have industrial potential. This process runs without externally supplied H2 and separating LA and FA from water, a costly step in the biorefinery process, is not required. Additional cost of separation in the lignocellulose-to-LA process can also be avoided, since PA is poorly water-soluble (only 35 g L−1 at room temperature),48 as opposed to GVL, which is completely water soluble.
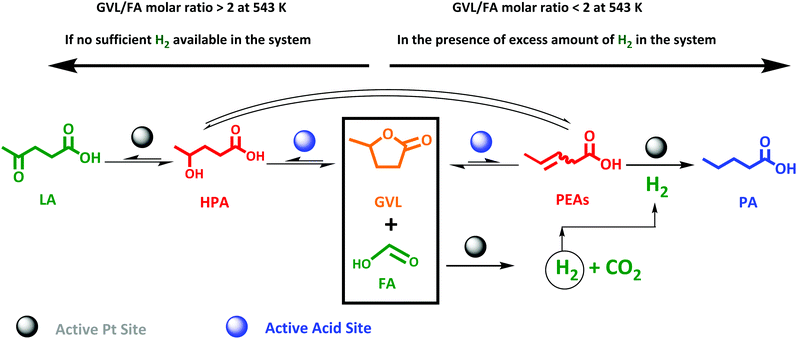
This study therefore aims, to our knowledge for the first time, at a direct and efficient use of aqueous FA as an alternative and sustainable reducing agent for the aqueous-phase selective hydrogenation of GVL to PA. In this study we propose that the aqueous-phase selective hydrogenation of GVL to PA in the presence of FA as a reducing agent proceeds through (1) decomposition of FA to H2 on the active metal sites, (2) GVL ring-opening to PEAs on the acidic function, and (3) hydrogenation of PEAs to PA on the active metal sites (Scheme 1). Bifunctional catalysis is clearly needed here. Thus, zeolites are known as highly potential catalyst support for metals to upgrade lignocellulosic biomass-derived compounds.49–52 In our study, we therefore suggest zeolites, i.e., ZSM-5, Beta and USY, to deliver the acid sites and to support the metal, here Pt, owing to their combination of high and tunable porosity, acidity and hydrothermal stability. In addition, the effect of varying the Pt surface area (SPt) and dispersion, acid site density of the zeolite material, GVL/FA molar ratio and reaction temperature on the catalytic performance were systematically investigated to find support for the proposed mechanism as well as to define the optimal catalytic requirements for the cascade reaction. Moreover, the one-pot aqueous-phase conversion of LA, instead of GVL, to PA in the presence of FA using zeolite-based catalyst was pioneered and discussed.
 | ||
| Scheme 1 Valorization route of the lignocellulosic biomass-derived GVL in the presence of FA as a reducing agent to PA over zeolite supported Pt bifunctional catalyst. | ||
Results and discussion
Catalyst preparation and characterization
The various Pt catalysts on zeolites were synthesized via incipient wetness impregnation, cf. ESI† for the details of the catalyst preparation procedure. Prior to the catalytic experiments, the set of catalysts were thoroughly characterized using N2-sorption, X-ray diffraction, elemental analysis via inductively coupled plasma optical emission spectroscopy (ICP-OES), temperature-programmed desorption of ammonia (NH3-TPD), transmission electron microscopy (TEM) and H2-chemisorption. Thermogravimetric analysis (TGA) of spent catalyst was conducted. The experimental details of these characterization procedures and set-ups are summarized in the ESI.† The textural, compositional, acid site density and the Pt average sizes and surface area are presented in Table 1. In this work catalysts are coded as follows: (actual metal loading)Pt/(Zeolite type)(Si/Al molar ratio), e.g., 2.0Pt/ZSM-5(11) means a 2.0 wt% Pt loaded ZSM-5 with a Si/Al ratio of 11.| Catalyst | S BET/m2 g−1 | V p/cm3 g−1 | Acid sites density/μmol g−1 | S Pt/m2 g−1 |
|---|---|---|---|---|
| 2.1Pt/USY(30) | 795 | 0.5 | 162 | 1.4 |
| 1.9Pt/USY(6) | 659 | 0.4 | 359 | 1.2 |
| 2.0Pt/Beta(12) | 475 | 0.6 | 285 | 1.3 |
| 0.5Pt/ZSM-5(11) | 329 | 0.2 | 521 | 0.7 |
| 2.0Pt/ZSM-5(11) | 317 | 0.2 | 466 | 1.4 |
| 4.7Pt/ZSM-5(11) | 244 | 0.2 | 418 | 4.5 |
| 1.7Pt/ZSM-5(11)_after1 st use | 234 | 0.2 | 295 | 0.4 |
| 2.0Pt/ZSM-5(24) | 371 | 0.2 | 323 | 1.0 |
| 1.8Pt/ZSM-5(42) | 292 | 0.2 | 244 | 0.8 |
| 1.9Pt/ZSM-5(146) | 430 | 0.2 | 51 | 1.0 |
The BET surface area between 300 and 800 m2 g−1 corresponds to the microporosity of the zeolites, showing the highest values for USY zeolites as the results of their pore architecture and presence of mesoporosity (Table 1, Fig. S1 and S2 at ESI†). Similarly, the pore volumes are higher for the less dense zeolites, e.g. beta vs. ZSM-5. The Pt surface area (SPt) shows larger values in the range of 0.5 to 5 m2 g−1 for samples with the higher Pt loading, while the average Pt size (dPt) is between 3 and 9 nm (TEM images at Fig. S3†) depending on the zeolite support; a larger Pt size is measured for the larger-pore zeolites and no significant effect of the Si/Al content and Pt loading is observed on the Pt size. The lowly loaded Pt on ZSM-5(11), i.e., 0.5 wt%, may be an exception. The measured acid sites density between 50 and 500 μmol g−1 zeolite is according to the expectations based on the Si/Al ratio.
Effect of the different zeolite supports
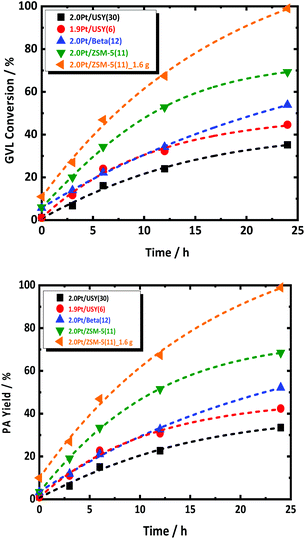
The catalytic aqueous-phase hydrogenation of GVL to PA is first studied over the catalysts with 2.0 wt% Pt, supported on different type of zeolite, i.e., USY(30), USY(6), Beta(12) and ZSM-5(11). FA was used as the reducing agent. In a typical experiment, a GVL-to-FA molar ratio of 0.4 was used to ensure excess of hydrogenation capacity with respect to GVL and its reaction to PA. The reaction evolution with regard to GVL conversion and PA yield are summarized in Fig. 1. Details description of the catalytic experiments procedure can be found at ESI.† All catalysts show conversion of GVL and formation of PA. Interestingly, PA is the dominant product for all catalysts at every time interval. Such indication of high PA selectivity at every conversion of the cascade reaction may be somewhat surprising, but this will be explained later. Inspection of the reaction evolution reveals a significant difference in the GVL conversion rate despite the similar Pt loading. The order of the conversion rate is the following: 2.0Pt/ZSM-5(11) > 2.0Pt/USY(6) > 2.0Pt/Beta(12) > 2.0Pt/USY(30). The same trend is apparent for the GVL conversion after long reaction time, except that 2.0Pt/USY(6) and 2.0Pt/Beta(12) changed order. After 24 h, the highest GVL conversion (69.3%) is obtained with 2.0Pt/ZSM-5(11), while 2.0Pt/Beta(12), 1.9Pt/USY(6) and 2.0Pt/USY(30) show a GVL conversion of 53.9, 44.6 and 35.2%, respectively. Furthermore, a notable quantitative GVL conversion to PA was achieved by doubling the amount of 2.0Pt/ZSM-5(11) catalyst in the reactor, i.e., from 0.8 g to 1.6 g at 543 K.It is speculative to attribute the high activity of 2.0Pt/ZSM-5(11) at this point to the difference in Pt size, while the available Pt surface area for all catalyst is comparable, and therefore other parameters may play a more prominent role. 2.0Pt/ZSM-5(11) exhibits the highest acid site density (466 μmol g−1) in comparison to the others, 2.0Pt/Beta(12), 1.9Pt/USY(6) and 2.0Pt/USY(30), which possess acid site densities of 285, 359 and 162 μmol g−1, respectively. In addition to the higher acid density, 2.0Pt/ZSM-5(11) is the only catalyst that largely preserved its crystal structure and textural properties, as well as the strong acid sites even after 24 h of reaction time in the hot liquid water conditions (at 543 K), cf. ESI at Fig. S4–S6.† This is in good agreement with the work of Resasco et al.53 for the same zeolite after treatment in hot liquid water.53 This is in sharp contrast to the loss of crystal structure for the other zeolites, 2.0Pt/Beta(12), 1.9Pt/USY(6) and in particularly 2.0Pt/USY(30), as confirmed by XRD, which already happens far earlier than the 24 h (Fig. S4 and S5 in ESI;† stability in time not shown). This is a well-known phenomenon for USY and Beta zeolite in hot liquid water and aqueous-phase hydrogenation reaction.54–56 This structural instability may impact the conversion rate early on, as well as explains the lower PA yield after 24 h and the observed change in catalyst activity order (see above), since 2.0Pt/Beta(12) is somewhat more stable than 1.9Pt/USY(6). Following this hypothesis, a certain amount of strong Brønsted acidity needs to preserve in order to allow the GVL to PA cascade reaction (Fig. S6 at ESI†). Most likely, the acid catalyst installs a rapid equilibrium between GVL and PEAs. Any retardation here, e.g. due to catalyst instability, may affect GVL conversion rate.
Effect of Pt loading and acid site density
Based on the above catalyst exploration, the most stable and active catalyst, i.e., 2.0Pt/ZSM-5(11) was selected to further investigate the effect of the Pt loading. In addition, the influence of the acid site density of the support, when stable under the reaction conditions, on the catalyst behaviour was studied. For this, commercial ZSM-5 with different Si/Al ratio were selected and impregnated with the same Pt loading (2.0 wt%).Experiments in absence of catalyst and only with parent ZSM-5(11) showed low GVL conversion yielding very low amounts of PA. Yet, we have observed some GVL conversion, which are due to metal impurities in the reactor (see the caution at the experimental procedure at ESI†). Besides, no significant amounts of PEAs or derived products have been observed in the withdrawn samples. FA decomposition occurs slowly under these circumstances (see Fig. S7, ESI†). Also, stirring speed above 400 rpm, i.e., 600 and 800 rpm, has no influence on GVL conversion and PA yield (Fig. S8 at ESI†). This suggest that the reaction under the investigated conditions occurs under kinetic regime and no pronounced influence of the stirring speed on GVL conversion and PA yield.
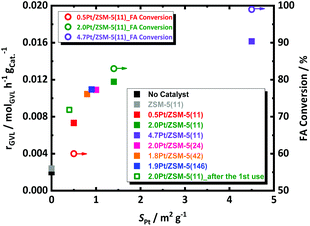
The decomposition of FA is tremendously accelerated in presence of 0.5, 2.0 and 4.7 wt% of Pt/ZSM-5(11), cf. at ESI, Fig. S7.† This acceleration is in line with the Pt loading. For instance, all FA is converted with the 4.7 wt% Pt catalyst already before reaching the reaction temperature, while such full FA conversion requires about 5 h (at the reaction temperature) in the presence of the 0.5 wt% Pt catalyst. Clearly the Pt loading plays a crucial role in the catalytic decomposition of FA. Since not so much the average size, but mainly the Pt surface area differs for the different Pt/ZSM-5(11) samples, the link between the Pt surface area and the FA conversion rate is obvious. This relationship is further corroborated by plotting the observed FA conversion (open circles) against SPt (Fig. 2). Our findings are here in agreement with FA decomposition literature, such as that of Fujitsuka et al.,57 who also correlated the high activity of Pt/C for FA dehydrogenation to the high Pt surface area (7.9 m2 g−1 with Pt nanoparticles of 3 nm measured by H2-chemisorption in their case), and they also tentatively excluded the existence of structure-sensitivity for FA decomposition. Similarly, kinetic profiles of the different catalysts were obtained to monitor the GVL conversion. The data are collected in Fig. S7 at ESI.† As before, all samples showed very high selectivity to PA (above 98%), irrespective of the catalyst and the contact time (conversion). Catalysts with more Pt sites, i.e., exposed surface area, show the highest GVL conversion rate with classic order-dependent behavior of the GVL conversion in function of time, except for the special S-shaped curve obtained in presence of the 0.5 wt% Pt catalyst. Note that here the conversion of FA is likely substantially interfering the kinetics of GVL conversion, leading to a first increasing GVL conversion rate with time as the concentration of hydrogen due to incomplete FA decomposition is still increasing. Once FA decomposition is complete, the conversion rate levels off due to shortness of reagents. This obviously implies an underestimate of the initial GVL conversion rate for this particular catalyst.
After 24 h, in spite of their difference in conversion rate, 2.0Pt/ZSM-5(11) and 4.7Pt/ZSM-5(11) display a similar GVL conversion (69.3% and 71.7%, respectively) and PA yield (68.5% and 70.3%, respectively). The low Pt content catalyst, 0.5Pt/ZSM-5(11), shows a somewhat lower GVL conversion and PA yield, 58.2% and 56.7%, respectively (cf. ESI, Fig. S7†).
The GVL conversion rate of the three Pt catalysts, as calculated from the data of Fig. S7† assuming a pseudo-zero order reaction (taking the slope of the first 3 points) for GVL conversion in accord to the kinetic model of Bond et al.,58 are plotted against the Pt surface area in Fig. 2. The conversion rate of GVL shows a similar trend with the amount of Pt sites as the FA decomposition, but perhaps deviation from linearity may be suggested here. We were unable so far to define a trustful link with the Pt particle size in our data.
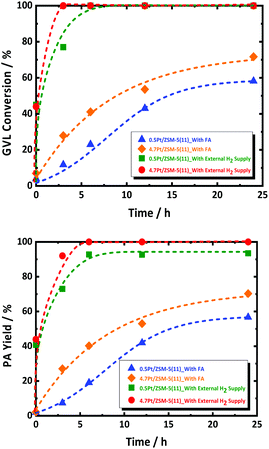
The observed GVL conversion rate may thus be coupled with that of FA decomposition. In order to decouple this, additional experiments were performed by using excess amount of external H2 (and no FA), simulating fast FA decomposition, in the presence of 0.5Pt/ZSM-5(11) and 4.7Pt/ZSM-5(11). The data are presented in Fig. 3. Both reactions run very fast showing complete conversion already within a couple of hours with very high PA selectivity. Also, here, PEAs as primary product have not been detected during the whole course of the reaction; instead PA is the dominant product formed with very high selectivity. This observation suggests unambiguously that PEAs hydrogenation is very fast, with higher conversion rates than that observed for the reactions in presence of FA. The catalyst 4.7Pt/ZSM-5(11) having the highest Pt surface area clearly shows the highest GVL conversion rate, respecting the defined catalytic role of the Pt surface sites.
The experiment thus shows that Pt/ZSM-5 is an excellent catalyst for GVL to PA conversion using hydrogen gas, and that the reaction runs much faster with externally supplied hydrogen, instead of hydrogen formed by FA decomposition, even though the latter reaction is already complete during the initial reactor heating. Thus, even if the two reactions are not interfering on the active site of the metal catalyst in certain conditions, e.g., at high Pt loading, the presence of little FA, or other side products such as CO (as a result of water shift reaction with CO2 and H2), retards GVL conversion most likely as a consequence of strong adsorption of such molecules on Pt. They can thus be considered as catalyst poisoners, and their presence is a true challenge for improving the GVL to PA catalysis using FA as reductant.59,60
The effect of acid site density on the catalytic performance was studied by altering the Si/Al molar ratio of ZSM-5, while Pt content kept constant. The following Si/Al molar ratio of 11, 24, 42 and 146 were used.
The kinetic profiles are presented in Fig. S9† and the GVL conversion rates are plotted against the Pt surface area in Fig. 2. The catalysts with varying acidity show very comparable reaction profiles and GVL conversion rates, with the 2.0 wt%-Pt catalyst apparently being somewhat more active. However, by taking into account the differences in Pt surface area between the catalysts, the Pt-normalized activity of the catalysts become all very similar, indicating that the acidity, when stable during the course of the reaction, has no marked effect on the reaction rate.
Our hypothetical scheme suggests therefore that the formation of PEAs is not rate limiting under the tested conditions, but yet it is never detected in the analyzed sample. This apparent ambiguity can only be explained taking into account an equilibrium between PEAs and GVL in favor of GVL under the conditions. This assumption is supported by recent studies of Bond et al.58 and Wong et al.61
Finally, a commercial Pt on carbon catalyst was tested, and the results are worse in comparison to those of the 2.0Pt/ZSM-5(11), cf. Fig. S10 at ESI.† This experiment supports the requirement of a strong acid, and that the acidity of FA itself is not the main contributor in the studied reaction.
Effect of GVL/FA molar ratio
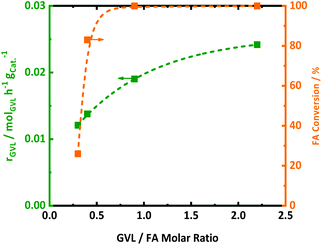
Since FA decomposition is interfering with GVL conversion, an optimal balance of the two reactions is likely important. Changing the GVL-to-FA ratio may be very informative to found more insight here. Four ratios were studied in the range of 0.3 and 2.5, in the presence of 2.0Pt/ZSM-5(11). The kinetic profiles are presented in Fig. S10,† while the calculated GVL conversion rates and FA conversion (only the first sample when the temperature reached 543 K) are plotted against the GVL-to-FA molar ratio in Fig. 4. Variation of the GVL-to-FA molar ratio significantly affects the GVL conversion rate. In this regard, the more FA is present for the same amount of GVL, the slower the conversion rate becomes. This observation suggests that high FA contents retard GVL conversion to PA. The opposite is true for low FA concentrations. Here, GVL conversion is faster, but incomplete conversions are obtained due to shortness of hydrogen. Notably, no significant amounts of intermediate PEAs were analyzed in any of the samples of the kinetic study. Closer inspection of the kinetic data reveals the highest GVL conversion rate, viz. 0.025 molGVL h−1 gCat−1 in case of 2.0Pt/ZSM-5(11), for a GVL-to-FA molar ratio of 2.2. However, the PA yield was low (58%) (Fig. S11 at ESI†) due to the limited amount of H2 in the catalytic system. Indeed, taking into account the stoichiometric formation of hydrogen from FA, complete hydrogenation to PA was impossible at such ratio. Instead, another competitive reaction sets in at the later stage of the reaction (Fig. S11 at ESI†), gradually forming LA. Under the reaction conditions, 23% LA yield was for instance found in the 24 h sample.LA formation is the result of a reverse ring-opening reaction of GVL to γ-hydroxypentanoic acid (HPA) on the active acid site (Scheme 2), followed by dehydrogenation of the alcoholic intermediate (which we have not directly observed throughout this study) at the Pt surface.
This indicates that Pt can also act as a dehydrogenation catalyst under poor H2 availability. The hydrogen formed in this reaction is also consumed for PA formation, explaining the super-stoichiometric amounts of PA formed (58% PA yield) with respect to FA as well as the high 82% GVL conversion. The observation of this ‘unproductive’ reaction of LA formation unveils that sufficient amounts of FA are necessary to achieve quantitative PA formation from GVL. Adequate amounts of H2 are present to fully convert GVL into PA for the GVL-to-FA molar ratios of 0.9, 0.4 and 0.3. In these circumstances, the catalytic results nicely show similar GVL conversion and PA yields (Fig. S11 at ESI†). Incomplete PA yields were observed for the reaction time, mainly due to the sluggish reaction rate, but stability issues of the catalyst under such a high FA concentration cannot be excluded (Fig. S11 at ESI†). In summary, low contents of FA keep the GVL conversion rate high, but high PA yields can only be achieved after very long reaction time. Multiple dosages of small aliquots of FA, e.g., by gradual addition, until complete GVL conversion to PA may be a great solution to obtain PA rapidly and quantitatively. Under such conditions, the catalyst will experience always low FA concentrations, being better for the structural integrity of the solid catalyst.
The impact of the GVL-to-FA molar ratio on the FA conversion rate is less clear (from a quantitative point of view), but a higher content of FA clearly demands a longer reaction time and catalyst effort to convert most of the FA (Fig. S11 at ESI†). Under these conditions, the GVL conversion rate drops considerably to lower values due to competition of FA decomposition and GVL (PEAs) hydrogenation at the Pt sites.
Effect of reaction temperature
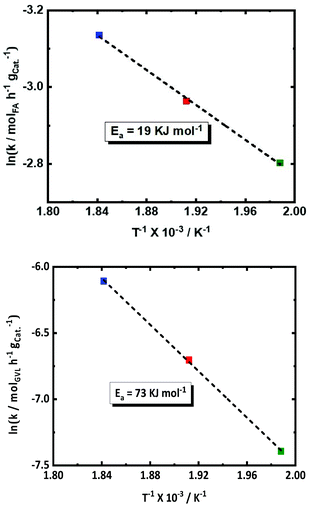
The effect of the temperature on the conversion rates and product selectivity is studied in the temperature range between 503 and 543 K in the presence of 2.0Pt/ZSM-5(11). The kinetic profiles are available in the ESI (Fig. S12†). Since also FA dehydrogenation is a zero-order reaction,57,62 Arrhenius plots were derived and are presented for both the observed conversion rate of GVL and FA in Fig. 5. Lower activities for both FA decomposition and GVL conversion were observed at the lower reaction temperatures. The S-shaped kinetic profiles at the lower temperature suggest again competition with FA decomposition at the initial stage of the reaction, whereas this reaction was already complete in case of the high reaction temperature. After 24 h of reaction, indeed only 60% of FA is converted at the lowest temperature, yielding 18% PA, while FA is 100% converted at the highest temperature showing 69% PA yield. PA yields are approaching the GVL conversions due to the high PA selectivity (>98%) in all cases.The observed apparent activation energy (Ea) for both FA dehydrogenation and GVL hydrogenation within the temperature range of (503 K, 523 K and 543 K) was calculated from the Arrhenius plots and amounted to 19 and 73 kJ mol−1, respectively. Note that the observed Ea value for FA dehydrogenation is comparable to that earlier reported for FA dehydrogenation using Pt/C (24.9 kJ mol−1) at 373 K and 473 K.53 Also, Ojeda et al.62 calculated the Ea of 72 kJ mol−1 for FA dehydrogenation in temperature range between 343 K and 383 K using 2 wt% Pt on γ-Al2O3. These reports show the dependence of the Ea for FA dehydrogenation on the applied reaction temperature range. Hence, our calculated Ea for FA dehydrogenation is relatively low (19 kJ mol−1) with respect to the other reports. Surprisingly, there has been no detailed kinetic study or reported apparent Ea values for GVL hydrogenation using FA or hydrogen as the reducing agent. Only the hydrogenation of LA to HPA using externally supplied H2 has been studied,57 obtaining a value of 46 kJ mol−1 for the observed apparent activation energy. However, the value we found is not unexceptional for double bond hydrogenation on Pt sites.63
In summary, these kinetic data show that FA dehydrogenation and surely the GVL conversion can be stimulated by working at higher temperature, favoring the overall kinetics of the cascade reaction. Catalyst stability obviously will be challenging though in such conditions.
Catalyst stability and reusability
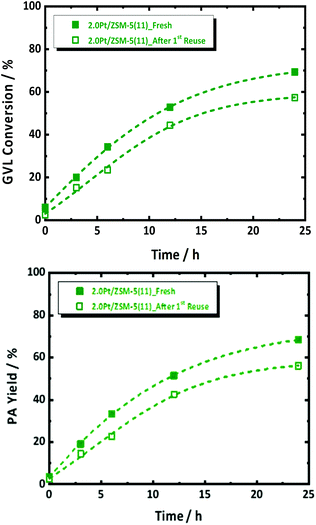
Thermal gravimetric analysis of spent catalyst was measured and it showed loss of around 5 wt% at a region from 295 K to 350 K, which corresponds to water (Fig. S13†). Given no cokes is found on the spent catalyst, a reusability experiment was conducted without taking specific steps for catalyst regeneration. Catalyst reusability is a prerequisite for heterogeneous catalysis. Its study is therefore important to understand the instability, and found solid solutions to that, if possible. Standard conditions in the presence of 2.0Pt/ZSM-5(11) were applied in the first catalytic run. The catalyst reusability was evaluated after catalyst separation, washing and drying. More details of the procedure can be found in the ESI.† The catalytic data of the fresh and spent catalyst are compared in Fig. 6.After the 1st reuse of the catalyst, PA remains the dominant product with selectivity above 98%. Only a slight decrease in the GVL conversion from 69 to 57% and PA yield from 68 to 55% was observed after 6 h of reaction. The initial GVL conversion rate, calculated from the kinetic profiles, dropped from 0.0117 molGVL h−1 gCat−1 to 0.0087 molGVL h−1 gCat−1. We anticipate that this drop in the catalyst performance is due to Pt leaching from the catalyst, reducing the loading from 2.0 to 1.7 wt% after 24 h of reaction time (confirmed by elemental analysis via ICP-OES), as well as to Pt sintering reducing SPt from 1.4 m2 g−1 to 0.4 m2 g−1 (by H2-chemisorption). In fact, plotting the rate against SPt of the re-used catalyst in Fig. 2 indeed shows the expected lowering of the activity due to the lowering of the Pt surface area. Note that a similar reduction of metal surface area has been reported for Ru on zeolites, which were used for the reductive splitting of cellulose and hemicellulose in hot liquid water.56
There is only limited degradation of the zeolite structure, as demonstrated by the X-ray analysis in Fig. S14 at ESI,† however the measured acidity density of the spent catalyst dropped significantly from 466 to 295 μmol g−1. Changes of the acid density in this range, as mentioned above (by varying Si/Al ratio, Fig. 2 and Fig. S7 at ESI†) has no significant impact on the reaction rate. Reduction in the specific surface area, viz. from 317 to 234 m2 g−1, is likely due to partially and local pore collapsing under the severe utilized hydrothermal conditions, since the crystalline structure of ZSM-5 was largely preserved. However, since the extrapolation of the activity, taking into account the real Pt surface area, viz. open square data point in Fig. 2, sufficiently explains the deactivation due to reduction of Pt sites (through leaching and sintering), pore blockage is not considered a main contributor to catalyst deactivation. There have been methods demonstrated to avoid Pt leaching and to install Pt redistribution from the surface of zeolite such as increasing the hydrophobicity of the zeolite or confinement effect.64
Pioneering the one-pot conversion of LA to PA
Pioneering the direct LA to PA conversion with FA is the logic next step. An equimolar reaction mixture of FA and LA is available through aqueous acid catalytic conversion of carbohydrates, while stoichiometric levels of FA to LA to form PA, viz. two-to-one (Scheme 3), is readily obtained by partly separating out LA, to be utilized as end-product or as feedstock for other chemicals synthesis such as the esters.65–68 Nevertheless, the synthesis of PA from LA proceeds through an even more complex cascade reaction involving reaction types such as hydrogenation, dehydration and ring-closing/opening. In detail, the main cascade reaction involves: (1) decomposition of FA on the active Pt sites to generate H2, (2) LA hydrogenation to HPA on the Pt active sites, followed by (3) dehydration and ring-closing to GVL on the active acid sites, and finally (4) GVL conversion to PA through ring-opening reaction on the active acid sites to PEAs, which subsequently undergoes (5) hydrogenation on the active Pt site. An overview is presented in Scheme 3. | ||
| Scheme 3 Proposed scheme for one-pot aqueous-phase conversion of LA to PA in the presence of FA as reducing agent over bifunctional Pt catalyst supported on zeolite. | ||
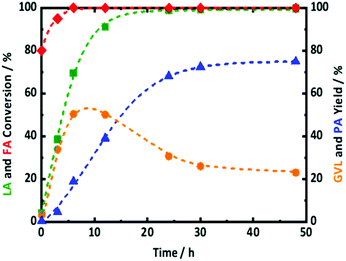
In this regard, the one-pot conversion of LA to PA with FA was tested in presence of 2.0Pt/ZSM-5(11). The reaction profiles along with the reaction conditions are presented in Fig. 7. After 6 h of reaction time, FA was found to be almost completely converted. The gradual increase in LA conversion with reaction time is associated with steady increase of GVL and PA yield. Between 6 and 12 h of reaction time, the GVL yield remains constant at 50%. At the same time, the yield of PA gradually increases from 20 to 40%. After 24 h of reaction time, LA is completely converted, the GVL yield decreased from 50 to 30%, while the PA yield reached 68%. This product evolution in time shows that GVL is an intermediate or primary product in the conversion of LA to PA, while PA is a secondary product as reflected by the S curve shape. It is important to mention that no significant amounts of HPA and PEAs were detected in any samples. This indicates that not only PEAs to GVL, but also HPA to GVL reactions over the acidic zeolite should be thermodynamically favorable in our conditions. In fact, this assumption is supported by the kinetic observations of Bond et al.58 and Abdelrahman et al.68 studying the microkinetics of GVL ring opening over silica-alumina and LA hydrogenation to GVL over Ru/C, respectively. This equilibrium between GVL and HPA and PEAs has also been emphasized by Wong et al.61 using aqueous-acidic solution extending the reaction time to 48 h resulted in a further increase of PA yield to 75% at the expense of the GVL yield, dropping to 23%. These results approach the best results of Kon et al.,69 who showed quantitative LA conversion with a 78% PA and 15% GVL yield, using 5.0 wt% Pt supported on ZSM-5, but with 0.8 MPa of externally supplied H2, albeit at lower temperature and shorter reaction time. Obviously, the number of chemical reactions that can compete on each active site, i.e., three reactions on the Pt active sites and two reactions on acid sites, (Scheme 3) can reduce the overall catalyst activity and may lead to less efficient catalysis. Further optimization is currently in progress to obtain more active catalytic systems with FA as hydrogen donor. The plateau in GVL and PA yield after prolonged reaction time in our case is not due to H2 shortness since the complete FA conversion delivers sufficient amount of hydrogen. A similar plateau in PA yield was observed recently by Luo et al.70,71 for the LA to PA conversion using external hydrogen in the presence of Ru/H-ZSM-5 catalyst. These authors have attributed this plateau due to catalyst deactivation by deposition of carbon species on the catalyst surface, blocking the accessibility to active acid and metal sites. In addition, previous part shows that Pt/ZSM-5 is not entirely stable in the reaction conditions, likely hampering the quantitative formation of PA in our case. In summary, PA formation directly from reaction of LA with FA is possible, but gradual addition of FA (for kinetic and stability reasons) to supply sufficient hydrogen into the system (for yield reasons) is suggested, while catalyst stabilization is a crucial point of concern requiring additional future research.
Conclusions
Bifunctional catalysis comprising of Pt and Brønsted acidic zeolites enables the conversion of GVL (and LA) to PA by using FA as a sustainable and available reducing agent in aqueous conditions. Pt serves a dual role as both FA decomposition to generate H2 as well as it enables the hydrogenation of the intermediate PEAs. A strong acid is required to assist ring-opening of GVL to form intermediate PEAs. Note that at these harsh hydrothermal conditions, PEAs ring closure to GVL is favorable, while the presence of H2 generated from FA shift the reaction equilibrium towards PA due to hydrogenation.Especially the reaction rate gains from an optimal balance of the catalytic system. A metal surface area as high as possible, provides the most active catalyst for fast FA decomposition to generate H2 for hydrogenation reaction. This hydrogenation, usually very fast, is retarded by competition with FA decomposition, as well as by self-poisoning due to strong adsorption of side products, likely CO. Therefore, gradual addition of FA will be helpful to improve the catalytic results, while metal catalyst development should search for catalysts that are insensitive to such poisoners. Acidity is required to rapidly set in the equilibrium between GVL and PEAs, but only small amounts of a strong acid are required. The existence of such equilibrium reaction within the cascade is very useful to achieve high selectivity as a result of low reactive intermediate concentrations. Only strong acidic sites like the ones in zeolites work efficiently, and therefore most hot liquid water-stable zeolite structures such as ZSM-5 are required. Pore blockage is not a main contributor to catalyst deactivation, while there is no organic cokes on a spent catalyst. However, future work should focus on stabilization efforts to better protect ZSM-5 from destruction in the hot liquid water, mainly to prevent undesired metal leaching and metal sintering. Some loss of acidity is not a large issue since the acidity is not rate determining (in our applied conditions). Furthermore, a detailed microkinetics study including the in situ hydrogen formation is required to foresee better quantifications of the kinetics (and its constants) and therefore will create more insight in the underlying mechanism. This may construct an efficient tool to maximize the catalytic output of the system in terms of PA productivity by understanding and design. It will also help optimizing the direct conversion of LA to PA. Despite the higher complexity in the cascade, this work proves industrially relevant PA can also be formed by reacting LA with FA using similar bifunctional catalytic concepts.
Conflicts of interest
There are no conflicts to declare.Acknowledgements
Dr Majd Al-Naji is grateful to COST Action FP1306 (LIGNOVAL) for funding the Short-Term Scientific Mission (STSM) at Centre for Sustainable Catalysis and Engineering, KU Leuven. He gratefully acknowledges the financial support from Erasmus + Traineeship program from Universität Leipzig and Max Planck Society. The KU Leuven scholarship to Dr Al-Naji is greatly acknowledged. Dr J. Van Aelst and Dr Y. Liao acknowledge KU Leuven for a postdoctoral mandate (PDM). Thanks are also due to Dipl.-Ing. Heike Rudzik of the Institute of Chemical Technology, Universität Leipzig (elemental analysis measurements), Walter Vermandel (for technical support) and Karel Duerinckx (1H NMR analysis) from KU Leuven. Open Access funding provided by the Max Planck Society. Valerio Cerasani are acknowledged for the idea and design of the graphical abstract.References
- http://unfccc.int/paris_agreement/items/9485.php , accessed on 17.07.2019.
- J. C. Serrano-Ruiz and J. A. Dumesic, Energy Environ. Sci., 2011, 4, 83 RSC.
- P. Y. Dapsens, C. Mondelli and J. Pérez-Ramírez, ACS Catal., 2012, 2, 1487 CrossRef CAS.
- M. J. Gilkey and B. Xu, ACS Catal., 2016, 6, 1420 CrossRef CAS.
- J. O. Metzger, Angew. Chem., Int. Ed., 2006, 45, 696 CrossRef CAS PubMed.
- M. Stöcker, Angew. Chem., Int. Ed., 2008, 47, 9200 CrossRef PubMed.
- L. T. Mika, E. Cséfalvay and Á. Németh, Chem. Rev., 2018, 118, 505 CrossRef CAS PubMed.
- J. N. Chheda, G. W. Huber and J. A. Dumesic, Angew. Chem., Int. Ed., 2007, 46, 7164 CrossRef CAS.
- P. Gallezot, Chem. Soc. Rev., 2012, 41, 1538 RSC.
- I. T. Horváth, H. Mehdi, V. Fábos, L. Boda and L. T. Mika, Green Chem., 2008, 10, 238 RSC.
- B. Op de Beeck, M. Dusselier, J. Geboers, J. Holsbeek, E. Morré, S. Oswald, L. Giebeler and B. F. Sels, Energy Environ. Sci., 2015, 8, 230 RSC.
- A. Deneyer, E. Peeters, T. Renders, S. Van den Bosch, N. Van Oeckel, T. Ennaert, T. Szarvas, T. I. Korányi, M. Dusselier and B. F. Sels, Nat. Energy, 2018, 3, 969 CrossRef CAS.
- D. Esposito and M. Antonietti, Chem. Soc. Rev., 2015, 44, 5821 RSC.
- M. Dusselier, P. Van Wouwe, A. Dewaele, E. Makshina and B. F. Sels, Energy Environ. Sci., 2016, 6, 1415 RSC.
- R. Palkovits, Angew. Chem., Int. Ed., 2010, 49, 4336 CrossRef CAS.
- V. Molinari, M. Antonietti and D. Esposito, Catal. Sci. Technol., 2014, 4, 3626 RSC.
- H. Li, S. Yang, A. Riisager, A. Pandey, R. S. Sangwan, S. Saravanamurugan and R. Luque, Green Chem., 2016, 18, 5701 RSC.
- M. Al-Naji, B. Puértolas, B. Kumru, D. Cruz, M. Bäumel, B. V. K. J. Schmidt, N. V. Tarakina and J. Pérez-Ramírez, ChemSusChem, 2019, 12, 2628 CrossRef CAS PubMed.
- D. Martin Alonso, S. G. Wettstein and J. A. Dumesic, Chem. Soc. Rev., 2012, 41, 8075 RSC.
- M. Besson, P. Gallezot and C. Pinel, Chem. Rev., 2014, 114, 1827 CrossRef CAS.
- P. Y. Dapsens, C. Mondelli and J. Pérez-Ramírez, Chem. Soc. Rev., 2015, 44, 7025 RSC.
- J. J. Bozell and G. R. Petersen, Green Chem., 2010, 12, 539 RSC.
- S. De, B. Saha and R. Luque, Bioresour. Technol., 2015, 178, 108 CrossRef CAS PubMed.
- M. Al-Naji, A. Yepez, A. M. Balu, A. A. Romero, Z. Chen, N. Wilde, H. Li, K. Shih, R. Gläser and R. Luque, J. Mol. Catal. A: Chem., 2016, 417, 145 CrossRef CAS.
- T. W. Walker, A. K. Chew, H. Li, B. Demir, Z. Conrad Zhang, G. W. Huber, R. C. Van Lehn and J. A. Dumesic, Energy Environ. Sci., 2018, 11, 617 RSC.
- A. H. Motagamwala, W. Won, C. T. Maraveliasa and J. A. Dumesic, Green Chem., 2016, 18, 5756 RSC.
- J. S. Luterbacher, A. Azarpira, A. H. Motagamwala, F. Lu, J. Ralphbc and J. A. Dumesic, Energy Environ. Sci., 2015, 8, 2657 RSC.
- M. A. Mellmer, D. Martin Alonso, J. S. Luterbacher, J. M. R. Gallo and J. A. Dumesic, Green Chem., 2014, 16, 4659 RSC.
- J. A. Dumesic, D. Martin Alonso, E. I. Girbiz and S. G. Wettstein, US Pat, 8399688B2, 2013 Search PubMed.
- E. I. Girbiz, J. M. R. Gallo, D. Martin Alonso, S. G. Wettstein, W. Y. Lim and J. A. Dumesic, Angew. Chem., Int. Ed., 2013, 52, 1270 CrossRef.
- X. Tian, F. Yang, D. Rasina, M. Bauer, S. Warratz, F. Ferlin, L. Vaccaro and L. Ackermann, Chem. Commun., 2016, 52, 9777 RSC.
- D. Rasina, A. Kahler-Quesada, S. Ziarelli, S. Warratz, H. Cao, S. Santoro, L. Ackermann and L. Vaccaro, Green Chem., 2016, 18, 5025 RSC.
- P. Pongrácz, L. Kollár and L. T. Mika, Green Chem., 2016, 18, 842 RSC.
- D. Marosvçlgyi-Haskj, B. Lengyel, J. M. Tukacs, L. Kollár and L. T. Mika, ChemPlusChem, 2016, 81, 1224 CrossRef.
- V. Fábos, L. T. Mika and I. T. Horváth, Organometallics, 2014, 33, 181 CrossRef.
- S. N. Bizzari, M. Blagoev and A. Kishi, “Oxo Chemicals”, CEH Marketing Research Report: Chemical Economics Handbook, SRI Consulting, September 2006, pages 17, 19, and 55.
- J. Kubitschke, H. Lange and H. Strutz, Carboxylic acids, aliphatic, in Ullmann's Encyclopedia of Industrial Chemistry, Wiley-VCH Verlag GmbH & Co., KGaA, 2014 Search PubMed.
- A. D. Patel, J. C. Serrano-Ruiz, J. A. Dumesic and R. P. Anex, Chem. Eng. J., 2010, 160, 311 CrossRef CAS.
- P. J. Deuss, K. Barta and J. G. de Vries, Catal. Sci. Technol., 2014, 4, 1174 RSC.
- T. Buntara, S. Noel, P. H. Phua, I. Melián-Cabrera, J. G. de Vries and H. J. Heeres, Angew. Chem., Int. Ed., 2011, 50, 7083 CrossRef CAS PubMed.
- K. Yan, Y. Yang, J. Chai and Y. Lu, Appl. Catal., B, 2015, 179, 292 CrossRef CAS.
- D. Martin-Alonso, S. G. Wettstein and J. A. Dumesic, Green Chem., 2013, 15, 584 RSC.
- S. G. Wettstein, D. Martin Alonso, Y. Chong and J. A. Dumisic, Energy Environ. Sci., 2012, 5, 8199 RSC.
- G. N. Yun, A. Takagaki, R. Kikuchi and S. T. Oyama, Catal. Sci. Technol., 2017, 7, 281 RSC.
- D. Zhang, F. Ye, Y. Guan, Y. Wang and E. J. M. Hensen, RSC Adv., 2014, 4, 39558 RSC.
- J. P. Lange, R. Price, P. M. Ayoub, J. Louis, L. Petrus, L. Clarke and H. Gosselink, Angew. Chem., Int. Ed., 2010, 49, 4479 CrossRef CAS.
- J. C. Serrano-Ruiz, D. Wang and J. A. Dumesic, Green Chem., 2010, 12, 574 RSC.
- C. M. Romero and F. Suárez, J. Solution Chem., 2009, 38, 315 CrossRef CAS.
- T. Ennaert, J. Van Aelst, J. Dijkmans, R. De Clercq, W. Schutyser, M. Dusselier, D. Verboekend and B. F. Sels, Chem. Soc. Rev., 2016, 45, 584 RSC.
- J. Van Aelst, D. Verboekend, A. Philippaerts, N. Nuttens, M. Kurttepeli, E. Gobechiya, M. Haouas, S. P. Sree, J. F. M. Denayer, J. A. Martens, C. E. A. Kirschhock, F. Taulelle, S. Bals, G. V. Baron, P. A. Jacobs and B. F. Sels, Adv. Funct. Mater., 2015, 25, 7130 CrossRef CAS.
- N. Nuttens, D. Verboekend, A. Deneyer, J. Van Aelst and B. F. Sels, ChemSusChem, 2015, 8, 1197 CrossRef CAS PubMed.
- D. Verboekend, N. Nuttens, R. Locus, J. Van Aelst, P. Verolme, J. C. Groen, J. Pérez-Ramírez and B. F. Sels, Chem. Soc. Rev., 2016, 45, 3331 RSC.
- L. Zhang, K. Chen, B. Chen, J. L. White and D. E. Resasco, J. Am. Chem. Soc., 2015, 137, 1180 Search PubMed.
- P. A. Zapata, Y. Huang, M. A. Gonzalez-Borja and D. E. Resasco, J. Catal., 2013, 308, 82 CrossRef CAS.
- L. Faba, B. T. Kusema, E. V. Murzina, A. Tokarev, N. Kumar, A. Smeds, E. Díaz, S. Ordóñez, P. Mäki-Arvela, S. Willför, T. Salmi and D. Y. Murzin, Microporous Mesoporous Mater., 2014, 189, 189 CrossRef CAS.
- T. Ennaert, S. Feys, D. Hendrikx, P. A. Jacobs and B. F. Sels, Green Chem., 2016, 18, 5295 RSC.
- H. Fujitsuka, K. Nakagawa, S. Hanprerakriengkrai, H. Nakagawa and T. Tago, J. Chem. Eng. Jpn., 2019, 5, 423 CrossRef.
- J. Q. Bond, C. S. Jungong and A. Chatzidimitriou, J. Catal., 2016, 344, 640 CrossRef CAS.
- M. D. Marcinkowski, J. Liu, C. J. Murphy, M. L. Liriano, N. A. Wasio, F. R. Lucci, M. F. Stephanopoulos and E. C. H. Sykes, ACS Catal., 2017, 7, 413 CrossRef CAS.
- L. Jia, D. A. Bulushev, O. Y. Podyacheva, A. I. Boronin, L. S. Kibis, E. Y. Gerasimov, S. Beloshapkin, I. A. Seryak, Z. R. Ismagilov and J. R. H. Ross, J. Catal., 2013, 307, 94 CrossRef CAS.
- C. Y. Y. Wong, A. W. T. Choi, M. Y. Lui, B. Fridrich, A. K. Horváth, L. T. Mika and I. Horváth, Struct. Chem., 2017, 28, 423 CrossRef CAS.
- M. Ojeda and E. Iglesia, Angew. Chem., Int. Ed., 2009, 48, 4800 CrossRef CAS.
- M. Al-Naji, PhD Thesis, Universität Leipzig, 2017.
- H. Xiong, H. N. Pham and A. K. Datye, Green Chem., 2014, 16, 4627 RSC.
- F. D. Pileidis and M. M. Titirici, ChemSusChem, 2016, 9, 562 CrossRef CAS PubMed.
- Z. Xue, Q. Liu, J. Wang and T. Mu, Green Chem., 2018, 20, 4391 RSC.
- L. Yan, Q. Yao and Y. Fu, Green Chem., 2017, 19, 5527 RSC.
- O. A. Abdelrahman, A. Heyden and J. Q. Bond, ACS Catal., 2014, 4, 1171 CrossRef CAS.
- K. Kon, W. Onodera and K.-I. Shimizu, Catal. Sci. Technol., 2014, 4, 3227 RSC.
- W. Luo, U. Deka, A. M. Beale, E. R. H. Van Eck, P. C. A. Bruijnincx and B. M. Weckhuysen, J. Catal., 2013, 301, 175 CrossRef CAS.
- W. Luo, P. C. A. Bruijnincx and B. M. Weckhuysen, J. Catal., 2014, 320, 33 CrossRef CAS.
Footnote |
| † Electronic supplementary information (ESI) available. See DOI: 10.1039/C9GC02627D |
| This journal is © The Royal Society of Chemistry 2020 |

