 Open Access Article
Creative Commons Attribution 3.0 Unported Licence
Correction: Free fatty acid release from vegetable and bovine milk fat-based infant formulas and human milk during two-phase in vitro digestion
Jeske H. J.
Hageman
 *ab,
Jaap
Keijer
 a,
Trine Kastrup
Dalsgaard
 c,
Lara W.
Zeper
 a,
Frédéric
Carrière
 d,
Anouk L.
Feitsma
 b and
Arie G.
Nieuwenhuizen
 a
a
aHuman and Animal Physiology, Wageningen University, de Elst 1, 6708 WD Wageningen, the Netherlands. E-mail: jeske.hageman@frieslandcampina.com
bFrieslandCampina, Stationsplein 1, 3818 LE Amersfoort, the Netherlands
cDepartment of Food Science, Aarhus University, Blichers Allé 20, DK-8830 Tjele Aarhus, Denmark
dAix Marseille Univ, CNRS, Bioénergetique et Ingénierie des Protéines UMR7281, 31 chemin Joseph Aiguier, 13402 Marseille, France
First published on 7th May 2019
Abstract
Correction for ‘Free fatty acid release from vegetable and bovine milk fat-based infant formulas and human milk during two-phase in vitro digestion’ by Jeske H. J. Hageman et al., Food Funct., 2019, 10, 2102–2113.
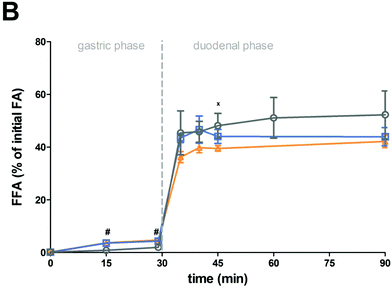
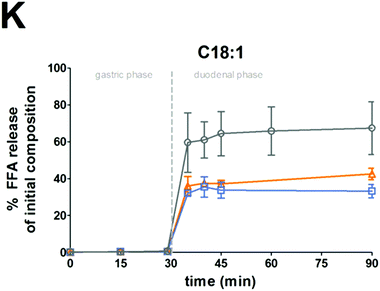
The authors regret that the lipid composition of IF1 was reported incorrectly. The percentage of C18:1n-9 should be 42.3%. Since the incorrect value was also used for some calculations, this also affects some of the results: it increases the total amount of fatty acids in the sample, and consequently the percentage of released FFA is lower. The FFA release (as a percentage of initial composition), both of total FFA and C18:1, is similar for both IFs. One small difference between IF1 and IF2 that was seen when using the incorrect value, i.e. a faster early duodenal digestion for IF1, was found to be no longer statistically significant. This has no consequences for the conclusions of the manuscript.
Page 2106 should read “The human milk samples showed less release of FFA during the gastric phase compared to IF1 and IF2 (2.0 ± 0.2% vs. 4.3 ± 0.2% and 4.7 ± 0.1% respectively, p < 0.01). Compared to the amount of FFA released after the digestion, during the gastric phase 4% of FFA were released from human milk, about 10% from IF1, and about 11% from IF2. Except for 45 minutes (p = 0.04), i.e. 15 minutes after the start of the duodenal phase, no differences were found in FFA release between the IFs compared to the human milk samples during this phase. The total release of FAs at the end of the digestion, as percentage of initial composition, was found to be similar for the different samples (43.9 ± 2.0%, 42.2 ± 1.4%, and 52.3 ± 4.5% for IF1, IF2 and human milk respectively, p = 0.14)”.
The correspondingly updated Fig. 2B, Fig. 5K, Table 2 and Table 3 are as presented below.
| Fatty acid | IF1 | IF2 | Human milk-1 | Human milk-2 | Human milk-3 | Human milk-4 |
|---|---|---|---|---|---|---|
| C4:0 | <0.1 | 2.6 | <0.1 | ND | <0.1 | <0.1 |
| C6:0 | <0.1 | 1.6 | <0.1 | ND | <0.1 | <0.1 |
| C8:0 | 0.6 | 1.2 | <0.1 | <0.1 | 0.2 | 0.3 |
| C10:0 | 0.5 | 2.1 | 0.9 | 0.7 | 1.6 | 1.6 |
| C11:0 | <0.1 | 0.3 | <0.1 | <0.1 | <0.1 | <0.1 |
| C12:0 | 7.0 | 4.3 | 3.8 | 3.1 | 7.8 | 5.6 |
| C14:0 | 3.0 | 8.2 | 6.1 | 6.7 | 10.0 | 5.9 |
| C15:0 | <0.1 | 0.7 | 0.5 | 0.6 | 0.4 | 0.3 |
| C16:0 | 24.7 | 22.8 | 30.0 | 28.3 | 21.0 | 18.4 |
| C18:0 | 3.1 | 7.1 | 8.1 | 9.4 | 6.6 | 4.7 |
| C18:1 n-9cis | 42.3 | 25.9 | 30.3 | 29.8 | 32.2 | 30.8 |
| C18:2 n-6 | 12.9 | 12.0 | 10.5 | 10.0 | 10.3 | 20.6 |
| C18:3 n-3 | 1.8 | 1.4 | 0.8 | 0.8 | 0.8 | 1.6 |
| Total SC/MCFA | 1.4 | 7.8 | 1.3 | 0.9 | 2.1 | 2.2 |
| Total LCFA | 94.9 | 82.4 | 90.1 | 88.7 | 89.1 | 87.9 |
| Total SFA | 39.3 | 50.9 | 49.8 | 49.0 | 47.9 | 37.1 |
| Total MUFA | 42.3 | 25.9 | 30.3 | 29.8 | 32.2 | 30.8 |
| Total PUFA | 14.7 | 13.4 | 11.3 | 10.8 | 11.1 | 22.2 |
| Fatty acid (%) | Gastric phase | Duodenal phase | Total digestion | |||||||||
|---|---|---|---|---|---|---|---|---|---|---|---|---|
| IF1 | IF2 | Human milk | p-Value | IF1 | IF-2 | Human milk | p-Value | IF1 | IF2 | Human milk | p-Value | |
| C4:0 | nd | 13.7 ± 1.8a | 0.0 ± 0.0b | <0.01 | nd | 41.1 ± 7.6 | 22.7 ± 3.7 | 0.10 | nd | 54.7 ± 5.8a | 22.7 ± 3.7b | 0.01 |
| C6:0 | 33.5 ± 0.7b | 24.9 ± 2.4a | 20.1 ± 3.7a | 0.07 | 3.9 ± 0.9a | 20.7 ± 1.5b | 40.9 ± 3.1c | <0.01 | 37.4 ± 1.1a | 46.6 ± 3.6a,b | 60.5 ± 1.8b | 0.02 |
| C8:0 | 55.5 ± 0.8 | 34.1 ± 0.4 | 52.4 ± 14.8 | 0.38 | 1.8 ± 0.8a | 11.3 ± 0.7a | 53.8 ± 15.8b | <0.01 | 57.3 ± 1.1 | 45.4 ± 0.0 | 106.2 ± 22.0 | 0.06 |
| C10:0 | 46.8 ± 0.6 | 26.5 ± 1.0 | 33.4 ± 8.2 | 0.13 | 14.1 ± 4.5a | 13.5 ± 2.7a | 51.6 ± 19.6b | <0.01 | 60.9 ± 3.0 | 40.0 ± 0.9 | 85.0 ± 18.0 | 0.11 |
| C11:0 | nd | 3.0 ± 0.1a | 8.5 ± 1.4b | 0.02 | nd | 3.6 ± 0.3a | 10.4 ± 2.1b | <0.01 | nd | 6.6 ± 0.2a | 19.0 ± 1.8b | <0.01 |
| C12:0 | 24.9 ± 1.2a | 10.9 ± 0.2b | 11.6 ± 2.2b | <0.01 | 26.0 ± 3.9a | 25.1 ± 1.5a | 55.5 ± 12.9b | <0.01 | 50.9 ± 2.3 | 36.1 ± 0.9 | 67.1 ± 8.7 | 0.33 |
| C14:0 | 3.1 ± 0.3a | 1.7 ± 0.0b | 0.4 ± 0.1c | <0.01 | 40.2 ± 2.0a | 26.9 ± 1.4b | 33.5 ± 5.7a,b | 0.01 | 43.3 ± 1.3a | 28.6 ± 0.8b | 33.9 ± 2.9a,b | <0.01 |
| C15:0 | nd | 2.1 ± 0.2 | 3.3 ± 0.9 | 0.35 | nd | 23.1 ± 1.0 | 18.7 ± 4.5 | 0.16 | nd | 25.2 ± 0.6 | 24.6 ± 2.6 | 0.83 |
| C16:0 | 1.8 ± 0.1a | 1.5 ± 0.1a | 0.2 ± 0.1b | <0.01 | 55.4 ± 6.7a | 44.5 ± 5.7a,b | 31.7 ± 6.0b | <0.01 | 57.2 ± 4.0a | 46.0 ± 3.2a,b | 31.8 ± 3.0b | <0.01 |
| C18:0 | 0.5 ± 0.3 | 0.7 ± 0.4 | 0.2 ± 0.2 | 0.51 | 76.9 ± 7.7 | 54.1 ± 2.7 | 63.5 ± 13.6 | 0.07 | 77.4 ± 4.2 | 54.8 ± 1.6 | 63.7 ± 6.9 | 0.07 |
| C18:1 | 0.5 ± 0.1 | 0.6 ± 0.1 | 0.7 ± 0.1 | 0.41 | 32.7 ± 3.5a | 41.9 ± 3.2a | 66.6 ± 14.0b | <0.01 | 33.2 ± 2.1a | 42.5 ± 1.8a | 67.4 ± 7.1b | <0.01 |
| C18:2 | 0.4 ± 0.1a | 0.4 ± 0.1a | 1.0 ± 0.2b | 0.02 | 33.0 ± 4.6a | 32.6 ± 3.0a | 61.1 ± 12.4b | <0.01 | 33.4 ± 2.6a | 32.9 ± 1.7a | 62.3 ± 6.3b | <0.01 |
| C18:3 | 1.0 ± 0.2a | 1.2 ± 0.2a | 2.9 ± 0.5b | 0.02 | 35.2 ± 4.1a | 36.1 ± 3.1a | 68.2 ± 12.6b | <0.01 | 36.2 ± 2.5a | 37.4 ± 1.9a | 71.1 ± 6.7b | <0.01 |
The Royal Society of Chemistry apologises for these errors and any consequent inconvenience to authors and readers.
| This journal is © The Royal Society of Chemistry 2019 |


