 Open Access Article
Alginate and HM-pectin in sports-drink give rise to intra-gastric gelation in vivo
Luca
Marciani
 ab,
Patricia
Lopez-Sanchez†
c,
Stefan
Pettersson
 d,
Caroline
Hoad
 ab,
Nichola
Abrehart
 ab,
Martin
Ahnoff
 c and
Anna
Ström
 *ef
*ef
aNottingham Digestive Diseases Centre and NIHR Nottingham Biomedical Research Centre, Nottingham University Hospitals NHS Trust and the University of Nottingham, Nottingham, UK
bSir Peter Mansfield Imaging Centre, University of Nottingham, University Park, Nottingham, NG7 2RD, UK
cMaurten AB, Biotech Center, Gothenburg, Sweden
dCenter for Health and Performance, Department of Food and Nutrition, and Sport Science, University of Gothenburg, Sweden
eApplied Chemistry, Chemistry and Chemical Engineering, Chalmers University of Technology, Gothenburg, Sweden
fSuMo Biomaterials, VINN Excellence Center, Chalmers University of Technology, Gothenburg, Sweden
First published on 22nd November 2019
Abstract
The addition of gelling polysaccharides to sport-drinks may provide improved tolerability of drinks with high concentration of digestible carbohydrates (CHO), otherwise known to increase the risk of gastro-intestinal complaints among athletes under prolonged exercise. The physico-chemical properties of a drink containing 14 wt% of digestible CHO (0.7![[thin space (1/6-em)]](https://www.rsc.org/images/entities/char_2009.gif) :
:![[thin space (1/6-em)]](https://www.rsc.org/images/entities/char_2009.gif) 1 fructose and maltodextrin-ratio), 0.2 wt% of HM-pectin/alginate and 0.06 wt%. sodium chloride were examined under in vitro gastric conditions using rheology and large deformation testing. The in vivo gelling behaviour of the drink was studied using magnetic resonance imaging of subjects at rest together with blood glucose measurements. The in vivo results confirm gelation of the test drink, with no gel remaining in the stomach at 60 min and blood glucose values were similar to control. The physico-chemical characterisation of the acidified test drink confirms the formation of a weak gel through which low Mw CHO can diffuse.
1 fructose and maltodextrin-ratio), 0.2 wt% of HM-pectin/alginate and 0.06 wt%. sodium chloride were examined under in vitro gastric conditions using rheology and large deformation testing. The in vivo gelling behaviour of the drink was studied using magnetic resonance imaging of subjects at rest together with blood glucose measurements. The in vivo results confirm gelation of the test drink, with no gel remaining in the stomach at 60 min and blood glucose values were similar to control. The physico-chemical characterisation of the acidified test drink confirms the formation of a weak gel through which low Mw CHO can diffuse.
1. Introduction
Fuel substrate depletion (i.e. muscle and liver glycogen) and dehydration (>2% loss in body mass) have been identified as main factors decreasing performance during prolonged (>2 h) moderate to high-intensity exercise.1,2 To counteract dehydration and to sustain euglycemia and high carbohydrate (CHO) oxidation rates during competition and prolonged key training sessions, general recommendations encourage athletes to consume <8% glucose polymer and/or mono and disaccharide solutions including 20–50 mEq L−1 sodium over water alone to enhance performance.3,4 However, if fluid needs are low (e.g. cooler conditions) and exercise duration exceeds 2.5 hours, it may be difficult for performance oriented athletes to provide carbohydrates at recommended rates (up to 1.5 g carbohydrates per min).5 Furthermore, excessive hypotonic fluid consumption (e.g. traditional sports drink formulations or water) is a major mechanism involved in exercise-induced hyponatremia6 whereas a more concentrated CHO solution may provide a practical strategy to sustain exercise performance and health for both elite and slower recreational level athletes. However, hypertonic drinks have been suggested to increase water retention in the intestines that, together with malabsorption of residual CHO, might increase the risk of gastrointestinal (GI) discomfort.7Attempts to change the basic formulation of CHO-rich products for sports nutrition involves the formation of a gel in various ways.8–10 Leiper et al. reported high gastric emptying rates for a drink containing a gel-forming high-molecular weight glucose polymer.8 Lopez-Sanchez et al. loaded alginate gel beads with low Mw CHO (60%). Low-Mw CHO was shown to diffuse unhindered through the beads under simulated gastric and intestinal conditions.9 Furthermore, a field study on elite long-distance runners reported high tolerability of an alginate containing drink with 30 wt% of CHO when used in individual training programs.11 The effect of adding polysaccharides, such as alginates, to food or drinks, on uptake of CHO in vivo is not clear. While some studies report reduced gastric emptying rate, increased feelings of fullness12–16 and attenuated peak glucose and insulin response17,18 upon addition of polysaccharides to solid foods or drinks, others report absence of any effect of added fibers.19–22 The contradictive results are possibly related to variation in physico-chemical properties (such as viscosity and gel strength) of the consumed food and drinks as it has been suggested that food and/or gels above a certain strength (>0.65 N) may be retained in the stomach.13,16 Attenuated or reduced CHO uptake is not wanted during prolonged exercise, where maintenance of blood glucose and increased rates of exogenous CHO is pivotal for performance.
The aim of this study was to test the hypotheses that a drink formulation containing low concentrations of HM-pectin and alginate together with a high concentration (14 wt%) of digestible CHO (fructose and maltodextrin) (1) is able to form a weak intra-gastric gel, and (2) has not a major effect on CHO uptake. For this investigation we carried out:
(a) An in depth in vitro characterization of the gels including rheology, microstructure and release of digestible CHO,
(b) In vivo magnetic resonance imaging (MRI) of the intragastric behavior of the sports drink in healthy volunteers.
2. Materials and methods
Food grade sodium alginate of high guluronate content (Manugel DMB) was obtained from FMC Biopolymers and the pectin was a commercial citrus pectin (Genu Pectin Type B from CP Kelco, Denmark). The alginate had a guluronate content of 60–70% as defined by the supplier. The pectin had a degree of methylesterification (DM) > 50 as given by the supplier. Both alginate and pectin are anionic linear polymers, where the alginate is composed of (1,4)-linked β-D-mannuronic acid and α-L-guluoronic acid residues and the pectin contains (1,4) linked α-D-galacturonate. Food grade maltodextrin (D.E. 16–19.9) was obtained from Cargill and food grade fructose (Fructopure 500) was obtained from Tate & Lyle. For simplicity, fructose and maltodextrin will from now on be referred to as digestible CHO. Glucono-delta-lactone (GDL) and NaCl used for in vitro experiments were obtained from Sigma-Aldrich, Sweden. For in vivo studies food grade NaCl (table salt) was used. Simulated gastric fluid without enzyme (pH 1.1–1.3, containing 0.7 M HCl and 0.1 M NaCl) and simulated intestinal fluid without enzyme (pH 6.5–6.6, containing ∼ 0.62 g L−1 sodium hydroxide and ∼ 6.8 g L−1 potassium phosphate monobasic) were obtained from Sigma Aldrich.2.1 Preparation of samples
![[thin space (1/6-em)]](https://www.rsc.org/images/entities/char_2009.gif) :
:![[thin space (1/6-em)]](https://www.rsc.org/images/entities/char_2009.gif) 40. The total digestible CHO (low molecular weight CHO, maltodextrin and fructose) concentration was 14 wt% and the ratio between maltodextrin and fructose was 1
40. The total digestible CHO (low molecular weight CHO, maltodextrin and fructose) concentration was 14 wt% and the ratio between maltodextrin and fructose was 1![[thin space (1/6-em)]](https://www.rsc.org/images/entities/char_2009.gif) :
:![[thin space (1/6-em)]](https://www.rsc.org/images/entities/char_2009.gif) 0.7. The NaCl concentration was 0.06%. Osmolality of the drink was 490 mOsm kg−1 and pH 6.0. The details are summarised in Table 1.
0.7. The NaCl concentration was 0.06%. Osmolality of the drink was 490 mOsm kg−1 and pH 6.0. The details are summarised in Table 1.
| Test drink | Control | |
|---|---|---|
| a Osmolality was measured using a Type 13 Autocal osmometer (Roebling Messentechnik, Bremen, Germany). | ||
| Contents per serving (g) | ||
| Total carbohydrates | 31.7 | 31.7 |
| Maltodextrin | 18.1 | 18.1 |
| Fructose | 13.6 | 13.6 |
| Sodium (Na+) | 0.20 | 0.20 |
| Water | 201 | 224 |
| Other ingredients | Alginate, pectin | — |
| pH | 6.0 | 7.2 |
| Osmolalitya (mOsm kg−1 H2O) | 490 | 485 |
2.2 Characterisation of the gel
 | (1) |
2.3 In vivo MRI study
| Magic ID | Gender | DOB | Age | Weight (kg) | Height (m) | BMI (kg m−2) |
|---|---|---|---|---|---|---|
| 1 | M | 1998-03-10 | 19 | 80 | 1.75 | 23 |
| 2 | F | 1987-01-02 | 30 | 58 | 1.58 | 18 |
| 3 | F | 1994-10-29 | 23 | 62 | 1.71 | 18 |
| 4 | F | 1995-09-13 | 22 | 53 | 1.64 | 16 |
| 5 | F | 1987-07-25 | 30 | 50 | 1.63 | 15 |
| 6 | F | 1995-10-23 | 22 | 61 | 1.63 | 19 |
| 7 | F | 1984-09-09 | 33 | 76 | 1.73 | 22 |
| 8 | M | 1997-04-30 | 20 | 74 | 1.77 | 21 |
3. Results and discussion
The composition of the test drink, in terms of type and ratio of alginate and pectin was chosen so to form gels in the presence of acid.21,26 The contents of maltodextrin and fructose (multiple transporter CHO solutions) for the control and test drink were chosen based on previous research demonstrating increased intestinal CHO absorption and higher exogenous CHO oxidation rates for fructose-glucose/glucose polymer mixtures compared to isoenergetic glucose/glucose polymer intake only.273.1 Physico-chemical characterisation of the test drink
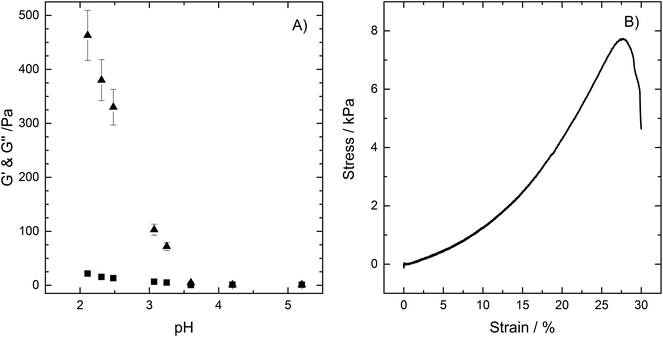
The test drink, prepared as outlined in the Materials and methods section, is characterized by a Newtonian flow and with a shear viscosity of 6.5 ± 0.9 mPa s. The gelation of the drink was followed in vitro as a function of pH where pH was reduced using the slowly hydrolysed lactone, GDL. The GDL was dispersed into the test drink, added to the rheometer while still a fluid, and let to set on the rheometer prior measurements of storage (G′) and loss (G′′) modulus (Fig. 1A). A gel (here defined as G′ > G′′) is formed already at pH 3.4 (pKa of both alginate and pectin being ∼3.5), which strength increases with reduced pH (Fig. 1A), in agreement with previous studies.21,28 Ström and co-workers have further shown that the formation of a HM-pectin and alginate gel occurs within minutes21 once the pH is lowered close to the pKa of alginate and pectin.The gel will be subjected to forces such as shear and compression in the stomach, especially as it is pushed through the antrum. The response of the gel to compression was therefore tested by forming cylindrical gels using a mould (H = 10 mm and D = 10 mm) in which the freshly prepared test drink plus GDL dispersion was poured and let to set for 24 hours. The cylinders were carefully removed after 48 hours and subjected to compression tests. The stress strain curves show a stress to fracture value of 7 ± 1 kPa, representing 0.5 N and a strain of fracture of 27 ± 1.6% (Fig. 1B). Such value of stress to fracture is just below the stated 10 kPa at force to fracture of gels previously shown to resist mechanical breakdown in the stomach,16 the formulation presented here should thus quickly pass on to the intestine.
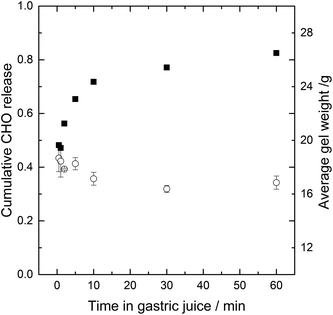
The stability of the gel in gastric fluid and the release of low molecular weight (Mw) CHO is shown in Fig. 2. The test drink was added to a beaker containing simulated gastric juice, upon which a gel was formed instantaneously. The gel was stable i.e. no extensive shrinking or swelling occurred over the 60 minutes test in simulated gastric juice, contrary as was observed for calcium alginate beads.10 The release of CHO from the gel was fast, with CHO concentration outside the gel reaching 70% of C∞ within ten minutes. In simulated intestinal juice the gel is expected to disintegrate, as pH of the gel increases to above the pKa of the polysaccharides, thus deprotonating the polysaccharides leading to electrostatic repulsion and disintegration of the gel.
In general, the main driving forces for solute transport from gel matrices are related to the gradient in chemical potential, often expressed as the concentration difference of active solute between the gel matrix and the bulk according to Fick's law. Other factors that will impact the diffusion are the swelling or degradation and erosion of the matrix, which is not observed in simulated gastric juice.
The driving force for release of digestible CHO here is thus the gradient in chemical potential between the digestible CHO entrapped within the gel and the absence of digestible CHO in the simulated gastric juice.
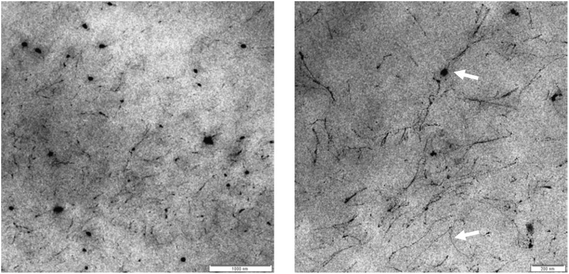
Further, the voids and pores present in the HM pectin – alginate network are large (several 100 ds of nanometer), as observed using TEM (Fig. 3) and in agreement with previous studies on alginate HM-pectin gels26 and calcium alginate.10 The polysaccharide network as visualised using TEM is corresponding to the black lines and dots. Keeping in mind that the size of the digestible CHO to be released, fructose with Mw of ∼180 Da and maltodextrin with Mw ∼180–1500 Da, it is unlikely that the gel formed hinder the release of the CHO from the gel other than it is reducing coverage of the stomach wall as it is in its gelled state and not a solution.
It can be hypothesized from the physico-chemical characterisation of the formulation that upon ingestion of the test drink a gel will be formed in the acidic environment of the stomach, from which low-Mw CHO will be released via non hindered diffusion. The gel is however weak, suggesting little or no retention in the stomach. Once in the intestine, the increase of pH will force the gel to disintegrate owing to deprotonisation of the polysaccharides electrostatic repulsion.
3.2 Magnetic resonance imaging
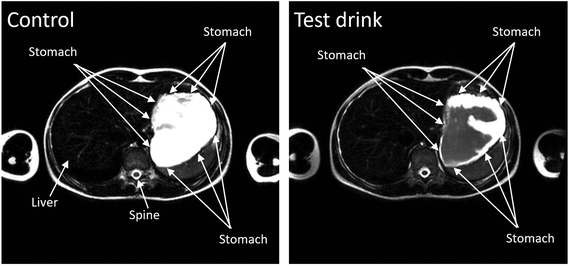
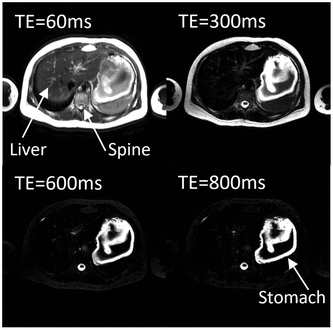
The study was well tolerated by the participants and no adverse events were recorded. One of the subjects did not comply with the overnight fasting restrictions as their stomach showed the presence of food and liquid at the baseline scan. This participant was therefore excluded from the study.It was possible to observe gelling of the test drink in the stomach of the seven remaining participants. The T2 weighted images taken after ingestion of the test drink showed two distinct components in the stomach, one bright (consistent with a fluid component) and one darker (consistent with a gelled component). This is shown in Fig. 4 on the right hand panel. Conversely on the control drink study days the stomach contents were mostly bright (as seen in Fig. 4 on the left hand panel), with some artifacts probably due to flowing/moving fluid in the stomach. Looking at progressively longer echo times (i.e. images taken at different interval and collecting the signal later in time so that more of the signal from shorter time constants will have decayed) the fluid component remained brighter and did not change shape or appearance whilst the gelled component disappeared from the images, a clear sign that the darker component of the sports drink images had a much shorter T2 than the brighter component. Intragastric gelling did not seem to be long-lived and in many subjects was not detectable by T = 60 min and beyond (Fig. 5).
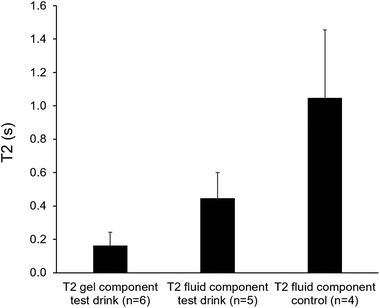
Where apparent, separate regions of interest were drawn for the gel and fluid components visible in the stomach. If a single fluid component was visible, as in the case of the control drink, then one single region of interest was drawn. The signal decay sampled in the regions of interest was then fitted to a relaxation time model. Fluid values are more variable due to increased artifacts in the fluid regions, possibly due to the motion of the drink in the stomach reducing the signal intensity, so lower values (∼0.5 s) could be assumed to be underestimated. Most of the areas identified as gel seemed to have a T2 around or below 0.2 s as shown in Fig. 6.
Measurement of blood glucose levels using the finger prick method over 120 min showed that control and test drinks gave rise to similar blood glucose levels (Fig. 7).
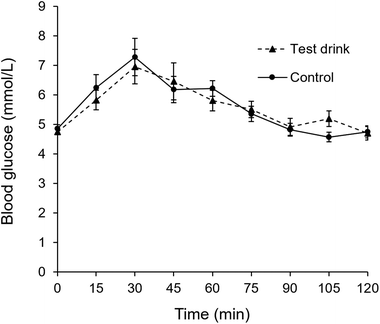 | ||
| Fig. 7 Capillary blood glucose levels in participants of the double blind magnetic resonance imaging trial upon consumption of test and control drink. | ||
The MRI study confirmed the formation of a gel in the stomach 15 min after ingestion of the test drink, and the absence of gel in the stomach upon ingestion of the control drink. Furthermore, the study showed that no gel seemed to remain in the stomach at the second MRI scan (60 min later). It is worthwhile to note that none of the participants reported gastric distress or increased fullness upon ingestion of test drink in line with the hypothesis that the strength of the gel formed from the test drink used in this study is too weak to affect feeling of fullness or attenuate blood glucose levels, thus enabling efficient use of digestible CHO.
Considering that there seems to be a link between endurance performance, CHO ingestion rate and high exogenous CHO oxidation,29,30 sport drinks should be formulated to maximize CHO delivery without causing negative GI symptoms. The formulation tested here appears promising in this respect and randomized studies on exogenous CHO oxidation rates should be performed.
4. Conclusions
We have shown that HM-pectin and alginate (0.2 wt%), in combination with digestible CHO (14 wt%), forms a weak gel under acid conditions, through which low-Mw CHO easily diffuses. MRI scanning confirms the presence of a gel in vivo in the stomach upon the first scan 15 minutes after ingestion of the test drink. Scanning the stomach 60 minutes after ingestion show that the gel is not retained, in line with the hypothesis of the gel being weak enough to easily be emptied from the stomach. While a gel is present at early times in the stomach, the blood glucose level remains similar as for the control. No negative GI symptoms was observed for either of the test drink or the control despite their high content of digestible CHO. In order to gain more insight in the potential of polysaccharides to alleviate GI distress in conjunction with high-intensity exercise, further studies are needed, where conditions are more likely to provoke severe symptoms of gastric discomfort. Future studies should also involve a double-blind and randomized study on exogenous CHO oxidation.Conflicts of interest
The study has been performed in collaboration with Maurten AB.Acknowledgements
VINNOVA VINN Excellence Center, SuMo BIOMATERIALS, VINNMER and Innovationskontoret, Chalmers are acknowledged for financial support to A. S. and the study, Johan Bergenståhl for the use of the rheometer. Annika Altskär is gratefully acknowledged for TEM experiments.References
- S. N. Cheuvront, R. Carter 3rd and M. N. Sawka, Fluid balance and endurance exercise performance, Curr. Sports Med. Rep., 2003, 2, 202 CrossRef.
- B. Essen, Intramuscular substrate utilization during prolonged exercise, Ann. N. Y. Acad. Sci., 1977, 301, 30 CrossRef CAS PubMed.
- M. N. Sawka, L. M. Burke, E. R. Eichner, R. J. Maughan, S. J. Montain and N. S. Stachenfeld, American College of Sports Medicine position stand: Exercise and fluid replacement, Med. Sci. Sports Exercise, 2007, 39, 377 CrossRef.
- X. Shi and C. V. Gisolfi, Fluid and carbohydrate replacement during intermitten exercise, Sports Med., 1998, 25, 157 CrossRef CAS.
- D. T. Thomas, K. A. Erdma and L. M. Burke, American college of sports medicine joint position statement. Nutrition and Athletic performance, Med. Sci. Sports Exercise, 2016, 48, 543 CAS.
- C. S. Almond, A. Y. Shin, E. B. Fortescue, R. C. Mannix, D. Wypij, B. A. Binstadt, C. N. Duncan, D. P. Olson, A. E. Salerno, J. W. Newburger and D. S. Greenes, Hyponatremia among runnerts in the Boston Marathon, N. Engl. J. Med., 2005, 352, 1550 CrossRef CAS PubMed.
- N. J. Rehrer, M. van Kemenade, W. Meester, F. Brouns and W. H. M. Saris, Gastrointestinal complaints in relation to dietary intekae in triathletes, Int. J. Sport Nutr., 1992, 2, 48 CAS.
- J. B. Leiper, K. P. Aulin and K. Soderlund, Improved gastric emptying rate in humans of a unique glucose polymer with gel-forming properties, Scand. J. Gastroenterol., 2000, 35, 1143 CrossRef CAS PubMed.
- P. Lopez-Sanchez, N. Fredriksson, A. Larsson, A. Altskär and A. Ström, High sugar content impacts microstructure, mechanics and release of calcium-alginate gels, Food Hydrocolloids, 2018, 84, 26 CrossRef CAS.
- M. Ahnoff, O. Sköld and A. Ström, WO/2017/186940A1, 2017.
- S. Sutehall, B. Muniz-Pardos, A. N. Bosch, A. Di Gianfrancesco and Y. P. Pitsiladis, Sports drinks on the edge of a new era, Curr. Sports Med. Rep., 2018, 17, 112 CrossRef.
- L. Benini, G. Castellani, F. Brighenti, K. W. Heaton, M. T. Brentegani, M. C. Casiraghi, C. Sembenini, N. Pellegrini, A. Fioretta and G. Minniti, Gastric emptying of a solid meal is accelerated by the removal of dietary fibre naturally present in food, Gut, 1995, 36, 825 CrossRef CAS.
- C. L. Hoad, P. Rayment, R. C. Spiller, L. Marciani, B. d. C. Alonso, C. Traynor, D. J. Mela, H. P. F. Peters and P. A. Gowland, In vivo imaging of intragastric gelation and its effect on satiety in humans, J. Nutr., 2004, 134, 2293 CrossRef CAS.
- M. Lyly, K.-H. Liukkonen, M. Salmenkallio-Marttila, L. Karhunen, K. Poutanen and L. Lähteenmäki, Fibre in beverages can enhance perceived satiety, Eur. J. Nutr., 2009, 48, 251 CrossRef CAS.
- K. R. Juvonen, A.-K. Purhonen, M. Salmenkallio-Marttila, L. Lähteenmäki, D. E. Laaksonen, K.-H. Herzig, M. I. J. Uusitupa, K. S. Poutanen and L. J. Karhunen, Viscosity of oat bran-enriched beverages influences gastrointestinal hormonal responses in healthy humans, J. Nutr., 2009, 139, 461 CrossRef CAS.
- L. Marciani, P. A. Gowland, A. Fillery-Travis, P. Manoj, J. Wright, A. Smith, P. Young, R. Moore and R. C. Spiller, Assessment of antral grinding of a model solid meal with echo-planar imaging, Am. J. Physiol.: Gastrointest. Liver Physiol., 2001, 280, G844 CrossRef CAS.
- I. Torsdottir, M. Alpsten, G. Holm, A. S. Sandberg and J. Tolli, A small dose of soluble alginate-fiber affects postprandial glycemia and gastric emptying in humans with diabetes, J. Nutr., 1991, 121, 795 CrossRef CAS.
- D. El Khoury, H. D. Goff, S. Berengut, R. Kubant and G. H. Anderson, Effect of sodium alginate addition to chocolate milk on glycemia, insulin, appetite and food intake in healthy adult men, Eur. J. Clin. Nutr., 2014, 68, 613 CrossRef CAS.
- R. D. Mattes, Effects of a combination fiber system on appetite and energy intake in overweight humans, Physiol. Behav., 2007, 90, 705 CrossRef CAS PubMed.
- N. C. Howarth, E. Saltzman and S. B. Roberts, Dietary fiber and weight regulation, Nutr. Rev., 2001, 59, 129 CrossRef CAS.
- A. Ström, R. Koppert, H. M. Boers, S. M. Melnikov, S. Wiseman and H. P. F. Peters, Physico-chemical properties of polysaccharides determines their appetite effect in Gums and Stabilisers for the food industry 15, Royal Society of Chemistry (RSC), 2010 Search PubMed.
- S. T. Odunsi, M. I. Vázquez-Roque, M. Camilleri, A. Papathanasopoulos, M. M. Clark, L. Wodrich, M. Lempke, S. McKinzie, M. Ryks, D. Burton and A. R. Zinsmeister, Effects of alginate on satiation, appetite, gastric function and selected gut satiety hormones in overweight and obesity, Obesity, 2010, 18, 1579 CrossRef CAS PubMed.
- K. Murray, V. Wilkinson-Smith, C. Hoad, C. Costigan, E. Cox, C. Lam, L. Marciani, P. Gowland and R. C. Spiller, Differential effects of FODMAPs (fermentable oligo-, di-, mono-saccharides and polyols) on small and large intestinal contents in healthy subjects shown by MRI, Am. J. Gastroenterol., 2014, 109, 110 CrossRef CAS PubMed.
- G. Major, S. Pritchard, K. Murray, J. P. Alappadan, C. L. Hoad, L. Marciani, P. Gowland and R. Spiller, Colon hypersensitivity to distension, rather than excessive gas production, produces carbohydrate-related symtomps in individuals with irritable bowel syndrom, Gastroenterology, 2017, 152, 124 CrossRef PubMed.
- C. L. Hoad, E. F. Cox and P. A. Gowland, Quantification of T(2) in the abdomen at 3.0 T using a T(2)-prepared balanced turbo field echo sequence, Magn. Reson. Med., 2010, 63, 356 CrossRef.
- P. Walkenström, S. Kidman, A.-M. Hermansson, P. B. Rasmussen and L. Hoegh, Microstructure and rheological behaviour of alginate/pectin mixed gels, Food Hydrocolloids, 2003, 17, 593 CrossRef.
- P. B. Wilson, Multiple transportable carbohydrates during exercise: Current limitations and directions for future research, J. Strength Cond. Res., 2015, 29, 2056 CrossRef PubMed.
- V. J. Morris and G. R. Chilvers, Cold setting alginate-pectin mixed gels, J. Sci. Food Agric., 1984, 35, 1370 CrossRef CAS.
- K. Currell and A. E. Jeukendrup, Superior endurance performance with ingestion of multiple transportable carbohydrates, Med. Sci. Sports Exercise, 2008, 40, 275 CrossRef CAS PubMed.
- D. Triplett, J. A. Doyle, J. C. Rupp and D. Benardot, An isocaloric glucose-fructose beverage's effect on simulated 100-km cycling performance compared with a glucose-only beverage, Int. J. Sport Nutr. Exercise Metab., 2010, 20, 122 CAS.
Footnote |
| † Current address: Agrifood and Bioscience, RISE-Research Institutes of Sweden, Gothenburg, Sweden. |
| This journal is © The Royal Society of Chemistry 2019 |

