 Open Access Article
Computational and biological investigation of the soybean lecithin–gallic acid complex for ameliorating alcoholic liver disease in mice with iron overload†
Xiangqun
Wu
a,
Yan
Wang
b,
Ran
Jia
 c,
Fang
Fang
*a,
Ya
Liu
*a and
Weiwei
Cui
 *a
*a
aDepartment of Nutrition and Food Hygiene, School of Public Health, Jilin University, Changchun, P. R. China. E-mail: cuiweiwei@jlu.edu.cn; fangfang7786@jlu.edu.cn; liuya@jlu.edu.cn; Tel: +86-431-8561-9455
bInstitute of Biomedical and Pharmaceutical Sciences, Guangdong University of Technology, Higher Education Mega Center, Guangzhou, P. R. China
cState Key Laboratory of Theoretical and Computational Chemistry, Institute of Theoretical Chemistry, Jilin University, Changchun, P. R. China
First published on 5th August 2019
Abstract
Alcoholic liver disease (ALD) is associated with significant morbidity and mortality globally. In this study, the soybean lecithin–gallic acid complex was synthesized, and its physicochemical properties were evaluated, which confirmed the complex formation. Compared with the free state of the drug, gallic acid exhibited significantly different physicochemical properties after it was complexed with soybean lecithin. To clarify the binding mode between two monomers, computational investigation was performed. From the computational data, we deduced the structure of the compound and predicted that it has a high affinity for human phosphatidylcholine transfer protein and exhibits strong pharmacological activities in vivo. The complex not only effectively ameliorated liver fibrosis, lipid peroxidation, and oxidative stress, but also reduced liver iron overload in a mouse ALD model induced by alcohol (p < 0.05). Additionally, it regulated iron metabolism by inhibiting TfR1 expression (p < 0.05) and promoting hepcidin expression (p < 0.05). These results suggest that the soybean lecithin–gallic acid complex ameliorates hepatic damage and iron overload induced by alcohol and exert hepatoprotective effects.
Introduction
Gallic acid (GA) is a common plant polyphenol and can be derived via hydrolysis from an aqueous solution of tannins that naturally occur in plants (Fig. 1A); it shows strong resistance to oxidation.1,2 Three adjacent phenolic hydroxyl (–OH) groups allow GA to form salts or complexes with many types of metal ions and to consume oxygen or free radicals, owing to which GA plays a protective role in biological tissues.3–6 However, lipid solubility of GA is too low to allow penetration into cell membranes, and its poor absorption rate in the animal small intestine (tmax, 60 min; Cmax, 0.71 ± 0.28 μmol L−1 in rats) leads to low bioavailability, resulting in an inability to achieve its desired pharmacological function.7,8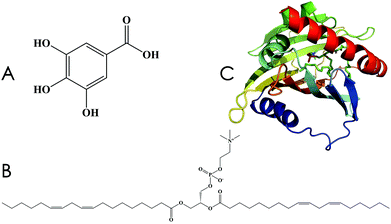 | ||
| Fig. 1 Chemical structures. (A) Gallic acid, 3,4,5-trihydroxybenzoic acid. (B) Lecithin. (C) Human phosphatidylcholine transfer protein (PDB ID: 1LN1). | ||
Lecithin (Fig. 1B) is a term applied to denote a group of yellow-brown fatty substances that occur in animal and plant tissues.9 The amphipathic structure of lecithin allows it to play a vital role in drug delivery, including the control of drug release and the transmission of active ingredients. Unlike the raw, natural, single ingredient, the phospholipid complex of lecithin shows significantly improved pharmacological effects, such as a longer drug half-life period and increased absorption in the gastrointestinal tract.10–12 Therefore, the use of lecithin complexes as carriers can be an effective way to increase bioavailability.
The effective targets of drugs are mainly proteins, which control the action and kinetic behavior of drugs within the organism.13–15 With advancements in theoretical chemistry, molecular dynamics (MD) simulations can effectively predict the interaction between drugs and proteins, facilitating our understanding of the interactive mechanism of in vivo drug action. Human phosphatidylcholine transfer protein (hPTP, PDB ID: 1LN1, Fig. 1C) was discovered by Roderick et al. in 2002; hPTP is involved in the highly efficient transportation of phospholipid compounds and is widely distributed in the liver.16 Therefore, it can be used as a target protein for the computational investigation of GA–phospholipid complexes.
Alcoholic liver disease (ALD), which is caused by excessive alcohol intake, is a commonly occurring disease all over the world.17 Recent epidemiological surveys estimate that alcohol-attributable cancers account for 5.8% of all cancer-related deaths worldwide.18,19 Several studies have indicated that ALD is associated with oxidative stress and that numerous antioxidants may protect the liver from ethanol-induced injury.20–22 Clinical studies have shown that patients with ALD often have increased iron levels along with the abnormal expression of iron metabolism-related genes and proteins.23 Furthermore, research has confirmed that the iron metabolic disorders and the abnormal expression of related proteins that are triggered by alcohol intake can be blocked by the antioxidant components of plants.24,25 GA has an excellent capacity to chelate iron and transform trivalent iron into redox-inactive iron, thereby protecting cells against oxidative stress-induced damage.26 Therefore, we hypothesized that the GA–phospholipid complex would ameliorate hepatic damage and restore iron homeostasis in the presence of ALD.
Materials and methods
Preparation of the soybean lecithin–GA complex (SL–GAC)
GA (188 mg) and soybean lecithin (750 mg) were mixed in 15 mL absolute ethyl alcohol at 25 °C until completely dissolved. The temperature was gradually increased from 25 °C to 50 °C. Stirring was continued with condensation and reflux for 3 h until the solution clarified. Rotary evaporation was used at 45 °C to dry the solvent, and an appropriate amount of trichloromethane was added to completely dissolve the product so that the remaining GA that did not react with lecithin was removed. After passage through a 0.45 μm non-aqueous filter membrane, the filtrate was vacuum-dried for 24 h, removed, and pushed through a 200 mesh screen, and the light yellow powder that was obtained was collected in an amber-colored glass bottle and stored at 4 °C. The complexing rate of GA with phospholipid to form the SL–GAC was 96.43% ± 1.8% w/w.Characterization of SL–GAC
IR spectra were recorded on a Fourier transform IR spectrometer (VERTEX 70, Bruker AXS, Germany). X-ray diffraction analysis was performed using an X-ray diffractometer (D8 ADVANCE, Bruker-AXS, Germany). FESEM examination was performed using an XL30 ESEM-FEG microscope (FEI, USA).Computational methods
The specific computational methods have been described in ESI.†Acute toxicity study
The specific operating conditions have been described in detail in the ESI.†Animals and experimental design
The principles of laboratory animal care were followed, and all procedures were conducted according to the guidelines established by the National Institutes of Health. Every effort was made to minimize the suffering of the animals. This study was approved by the Animal Experiment Committee of Jilin University. Sixty healthy male C57BL/6J mice (aged 8 weeks), weighing 18.0 ± 2.0 g, were procured from Changsheng Experimental Animal Company (Liaoning, China). All mice were caged under the same conditions as in the experiment for acute toxicity. Throughout the study, the mice were fed a normal chow diet and purified water ad libitum. The mice were randomly divided into 6 groups of 10 mice each and treated daily for 12 weeks as follows: (1) the control group, oral gavage with physiological saline (7.5 mL per kg BW), performed twice with a 1 h interval in between; (2) the model group (ALD), administered an alcohol solution (52% <v/v>, 7.5 mL per kg BW) 1 h prior to oral gavage with physiological saline (7.5 mL per kg BW); (3) the DFO group (100 mg per kg BW; Novartis International AG, Basel, Switzerland; positive control), a single intraperitoneal injection administered 1 h after the alcohol solution (52% <v/v>, 7.5 mL per kg BW); (4) the low dose SL–GAC group (100 mg per kg BW), a single dose administered by oral gavage 1 h after the alcohol solution (52% <v/v>, 7.5 mL per kg BW); (5) the middle dose SL–GAC group (200 mg per kg BW), a single dose administered by oral gavage 1 h after the alcohol solution (52% <v/v>, 7.5 mL per kg BW); and (6) the high dose SL–GAC group (400 mg per kg BW), a single dose administered by oral gavage 1 h after the alcohol solution (52% <v/v>, 7.5 mL per kg BW). The body weights of the mice were monitored daily.At the end of the 12th week, all the animals were anesthetized with an intraperitoneal injection of lidocaine at 200 mg per kg BW and then euthanized by cervical dislocation. Samples of intracardiac blood were collected in 1.5 mL Eppendorf tubes. The livers were harvested, and blood was immediately washed away with ice-cold physiological saline. The liver index of the mice was measured using the weighing method (liver weight/body weight). Each liver was divided into two parts: one part was immediately stored at −80 °C for subsequent analysis, and the other part was subjected to 10% formalin fixation for histopathological analysis.
Serum biochemical values, liver lipids, iron metabolism indices, lipid peroxidation, and liver antioxidant capacity
Physiological saline was used to remove as much blood as possible from the liver samples. Then, the tissue was homogenized on ice with phosphate-buffered saline (0.01 M, pH 7.4). The homogenates were centrifuged for 15 min at 4000 rpm at 4 °C, and the supernatants were carefully collected for liver biochemical assays. The serum levels of alanine transaminase (ALT), aspartate transaminase (AST) and gamma glutamyl transferase (γ-GT), and the hepatic levels of superoxide dismutase (SOD), reduced glutathione (GSH), malondialdehyde (MDA), total cholesterol (TC) and triglyceride (TG) were measured using commercial kits (Jiancheng Corporation, Nanjing, China). The serum iron and the total iron-binding capacity (TIBC) were determined using colorimetry, according to the manufacturer's specifications (Jiancheng Corporation, Nanjing, China). The transferrin saturation (TS%) was calculated by dividing the serum iron level by the TIBC. The unsaturated iron-binding capacity (UIBC) was equivalent to the sum of TIBC and serum iron. The liver iron content was established using an atomic absorption spectrophotometer (SpectrAA 220 Atomic Absorption Spectrometer, Varian, USA).Liver histopathology, ROS staining and immunohistochemical analysis for liver ferritin
Hematoxylin and eosin staining was used to observe the pathological morphology of hepatocytes. Frozen hepatic sections were stained with DHE and observed under a confocal laser scanning microscope (TCS-SP2 Laser Scanning Confocal Microscope, Leica, Germany). The expression of ferritin (Abcam Inc., Cambridge, MA, USA) in the hepatocytes was observed using immunohistochemical staining. Hepatic histopathological changes and ferritin expression were observed using an Olympus BX50 light microscope (Olympus Corp., Tokyo, Japan) with the HMIAS-2000 medical imaging system.Western blot assays
Western blotting was performed as previously described.27 The primary antibodies used in the experiment were as follows: TfR1, TfR2 and hepcidin (Abcam Inc., Cambridge, MA, USA).Statistical analysis
Values are expressed as mean ± SEM. Differences were considered significant at the 0.05 probability level. One-way analysis of variance and the least-significant difference test were used to analyze the differences between treatments. All statistical analyses were performed using SPSS v24.0 (IBM Corp., Armonk, New York, USA).Results
Preparation and characterization of the soybean lecithin–GA complex
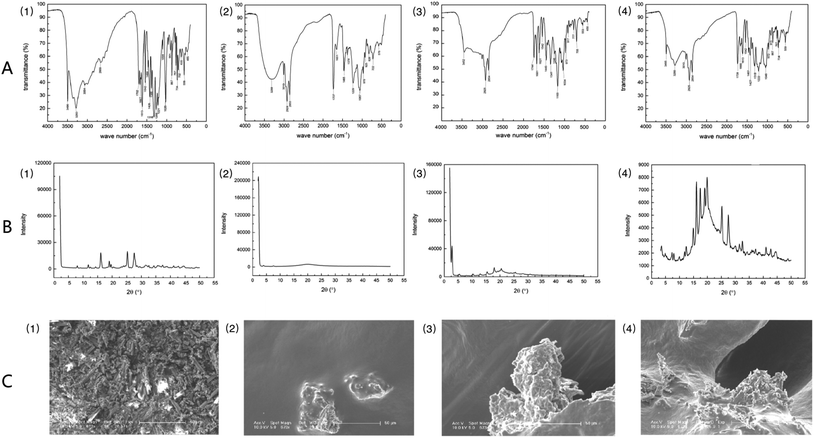
Fig. 2A shows the results of infrared spectroscopic analysis: GA exhibited the characteristic absorption bands of O–H (3283 cm−1, 3496 cm−1), C![[double bond, length as m-dash]](https://www.rsc.org/images/entities/char_e001.gif) C (1469 cm−1, 1542 cm−1), and C
C (1469 cm−1, 1542 cm−1), and C![[double bond, length as m-dash]](https://www.rsc.org/images/entities/char_e001.gif) O (1613 cm−1). Soybean lecithin showed the characteristic absorption peaks of O–H (3288 cm−1), C–H (2924 cm−1, 2853 cm−1), C
O (1613 cm−1). Soybean lecithin showed the characteristic absorption peaks of O–H (3288 cm−1), C–H (2924 cm−1, 2853 cm−1), C![[double bond, length as m-dash]](https://www.rsc.org/images/entities/char_e001.gif) O (1737 cm−1), P
O (1737 cm−1), P![[double bond, length as m-dash]](https://www.rsc.org/images/entities/char_e001.gif) O (1229 cm−1), P–O–C (1057 cm−1), and N+ (CH3)3 (970 cm−1). Analysis of the soybean lecithin–GA complex showed that the characteristic peaks of O–H (3283 cm−1, 3288 cm−1) had disappeared and the characteristic peak of O–H (3496 cm−1), which belongs to GA, had shifted to 3452 cm−1. And the characteristic bands of P
O (1229 cm−1), P–O–C (1057 cm−1), and N+ (CH3)3 (970 cm−1). Analysis of the soybean lecithin–GA complex showed that the characteristic peaks of O–H (3283 cm−1, 3288 cm−1) had disappeared and the characteristic peak of O–H (3496 cm−1), which belongs to GA, had shifted to 3452 cm−1. And the characteristic bands of P![[double bond, length as m-dash]](https://www.rsc.org/images/entities/char_e001.gif) O (1165 cm−1) and P–O–C (1034 cm−1) of the SL–GAC were not consistent with those of soybean lecithin. These findings revealed that the polar ends of GA and lecithin may interact in the SL–GAC. Analysis of a physical mixture of GA and soybean lecithin revealed the characteristic bands of O–H (3280 cm−1), P
O (1165 cm−1) and P–O–C (1034 cm−1) of the SL–GAC were not consistent with those of soybean lecithin. These findings revealed that the polar ends of GA and lecithin may interact in the SL–GAC. Analysis of a physical mixture of GA and soybean lecithin revealed the characteristic bands of O–H (3280 cm−1), P![[double bond, length as m-dash]](https://www.rsc.org/images/entities/char_e001.gif) O (1222 cm−1), and P–O–C (1046 cm−1), which indicated that GA and lecithin had both retained their characteristic chemical structures and not undergone a chemical reaction. X-ray diffraction patterns indicated that GA existed mainly in the form of crystals, which have multiple diffraction peaks (Fig. 2B). The soybean lecithin was found to exist in an amorphous form, with only a wide area in the diffraction diagram. In the X-ray diffraction patterns of the SL–GAC, the crystal diffraction peaks of GA could not be distinguished. Field emission scanning electron microscopy (FESEM) examination showed that GA exhibited various crystal characteristics and a small particle size, whereas soybean lecithin had no permanent form (Fig. 2C). The FESEM examination of the SL–GAC showed that the crystal form of GA had completely disappeared, and its particles had become larger and were completely combined with lecithin.
O (1222 cm−1), and P–O–C (1046 cm−1), which indicated that GA and lecithin had both retained their characteristic chemical structures and not undergone a chemical reaction. X-ray diffraction patterns indicated that GA existed mainly in the form of crystals, which have multiple diffraction peaks (Fig. 2B). The soybean lecithin was found to exist in an amorphous form, with only a wide area in the diffraction diagram. In the X-ray diffraction patterns of the SL–GAC, the crystal diffraction peaks of GA could not be distinguished. Field emission scanning electron microscopy (FESEM) examination showed that GA exhibited various crystal characteristics and a small particle size, whereas soybean lecithin had no permanent form (Fig. 2C). The FESEM examination of the SL–GAC showed that the crystal form of GA had completely disappeared, and its particles had become larger and were completely combined with lecithin.
Computer simulations
The structure of the SL–GAC was obtained using Gaussian-accelerated molecular dynamics (GaMD) simulation, the detailed method of which can be found in ESI.† By performing a GaMD simulation of the SL–GAC system for 2 μs, we generated 100![[thin space (1/6-em)]](https://www.rsc.org/images/entities/char_2009.gif) 000 frames. To assess the qualities of all these structures and find the most appropriate complex structure, we monitored the centroid distance between lecithin and GA molecules throughout the GaMD simulation (Fig. 3A). Among all these frames, only 2266 (2.3%) frames had a centroid distance of <3.0 Å. The frame with the lowest centroid distance was selected (Fig. 3B). The GA molecule was embedded within the lecithin molecule, and the fatty chains of the lecithin molecule enclosed the GA molecules. The complex structure of the SL–GAC sampled by GaMD was consistent with the experimental hypothetical structure proposed by Liu et al.28
000 frames. To assess the qualities of all these structures and find the most appropriate complex structure, we monitored the centroid distance between lecithin and GA molecules throughout the GaMD simulation (Fig. 3A). Among all these frames, only 2266 (2.3%) frames had a centroid distance of <3.0 Å. The frame with the lowest centroid distance was selected (Fig. 3B). The GA molecule was embedded within the lecithin molecule, and the fatty chains of the lecithin molecule enclosed the GA molecules. The complex structure of the SL–GAC sampled by GaMD was consistent with the experimental hypothetical structure proposed by Liu et al.28
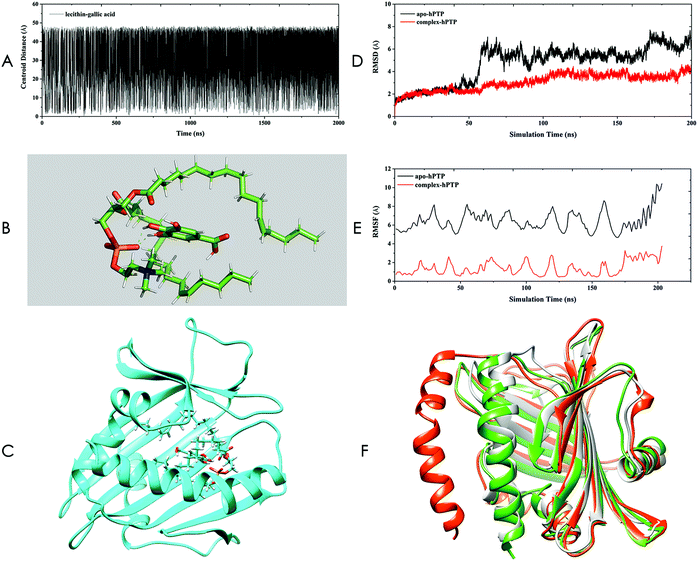 | ||
| Fig. 3 Computer investigation of the soybean lecithin–gallic acid complex (SL–GAC). (A) Centroid distances between lecithin and gallic acid obtained by Gaussian-accelerated molecular dynamics (GaMD) simulation. (B) Representation of the complex of lecithin–gallic acid. The green dashes represent hydrogen bonds. (C) Docking complex of hPTP and lecithin–gallic acid obtained by molecular docking. The lecithin and gallic acid molecules are presented using the stick mode. (D) Root mean square deviation (RMSD) plot for apo-hPTP and complex-hPTP. (E) Root mean square fluctuation (RMSF) plot for apo-hPTP and complex-hPTP. (F) The 1LN1 crystal structure (gray) and representative structures for apo-hPTP (red) and complex-hPTP (green). | ||
The structure obtained using GaMD was then subjected to infrared (IR) spectroscopy in the Gaussian 09 software package under the 6-311+g(d,p) basis set by the B3LYP method. The calculated IR spectrum was compared to the experimental IR spectrum, and the IR spectrum obtained using theoretical calculations was found to be in good agreement with the experimentally measured IR spectrum (Fig. S6†). Additionally, the two hydroxyl groups of the GA molecule were found to be in very close proximity to the phosphate group of the lecithin molecule; hydrogen bond interactions might form among these groups, which will be verified in the subsequent MD-simulation section.
Thus, the non-covalent bond structure sampled using GaMD was selected as the final structure of the SL–GAC and served as the starting point for subsequent studies. To investigate how the SL–GAC structure interacted with hPTP, we constructed a complex structure of hPTP and SL–GAC by using molecular docking (Fig. 3C). This SL–GAC–hPTP complex structure was used as the starting structure for the subsequent MD simulations.
We performed 200 ns MD simulations for the apo-hPTP and complex-hPTP systems in both an aqueous and an ethanol environment. The root mean square deviation (RMSD) can provide the overall structural stability of the simulated systems. We determined that the apo-hPTP system underwent large structural changes relative to the complex-hPTP system in an ethanol environment (Fig. 3D). We also performed MD simulations for the apo-hPTP and complex-hPTP systems in an aqueous environment, and the RMSD results showed that the hPTP protein had a smaller degree of conformational change than the apo-protein system after binding to the SL–GAC (Fig. S7†). Thus, the SL–GAC structure played a positive role in stabilizing the conformation of the hPTP protein in both ethanol and aqueous solution. Root mean square fluctuation (RMSF) analysis can provide details about the fluctuations of each residue during the simulation period. All of the residues belonging to the apo-hPTP system possessed higher RMSF values than those of the complex-hPTP system, which indicated that the overall structural flexibility of the apo-hPTP system was greater than that of the complex-hPTP system in an ethanol environment (Fig. 3E). In the previous section, we speculated that there was a hydrogen bond interaction between the phosphate group of lecithin and the hydroxyl group of GA. Using the trajectory files generated by the MD simulations, we monitored the hydrogen bonding between these two groups (Table S1†). We found that stable hydrogen bonds formed between the hydroxyl group of GA and the phosphate group of the lecithin molecule throughout the simulation period, which indicated that lecithin and GA formed a stable complex via non-bonded interactions.
Clustering analysis was performed using the average-linkage algorithm (Fig. 3F). Three structures were superimposed together. Compared to the crystal and complex-hPTP structures, the representative structure of apo-hPTP had large structural differences. In the apo-hPTP system, a section of the α-helical structure deviated from its original position. The structure of the complex-hPTP system was similar to the crystal structure.
To assess the binding affinity between the SL–GAC and hPTP, we calculated the binding free energy of the SL–GAC–hPTP complex system (both in an ethanol and in an aqueous environment). The calculation was carried out using molecular mechanics/generalized Born surface area (MM/GBSA) methods, and a detailed description of the calculation is provided in ESI.† The results showed that the SL–GAC had a strong binding affinity with hPTP in both ethanol and aqueous solution (Table S2†). The SL–GAC stabilized the conformations of hPTP in the solution by tightly binding to it.
Acute toxicity of SL–GAC
All mice survived the 7-day observation period. There were no clinical signs of toxicity throughout the experimental period (ESI†). These results suggest that the SL–GAC is safe for the organism.Effects of SL–GAC on body weight, liver weight, and liver index
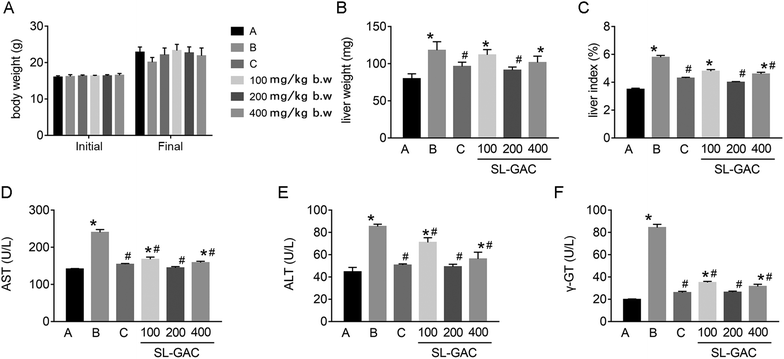
In C57Bl6/J mice with iron-overload ALD, ethanol caused no significant change in the body weight (p > 0.05, Fig. 4A), but significantly increased the liver weight (Fig. 4B) and liver index (Fig. 4C) as compared to the control group (p < 0.05). The administration of the SL–GAC for 12 weeks effectively improved these indicators, especially at a dose of 200 mg per kg body weight (BW).Effects of SL–GAC on biochemical values, iron metabolism indices, liver lipids, lipid peroxidation, and antioxidant capacities in mice chronically fed ethanol
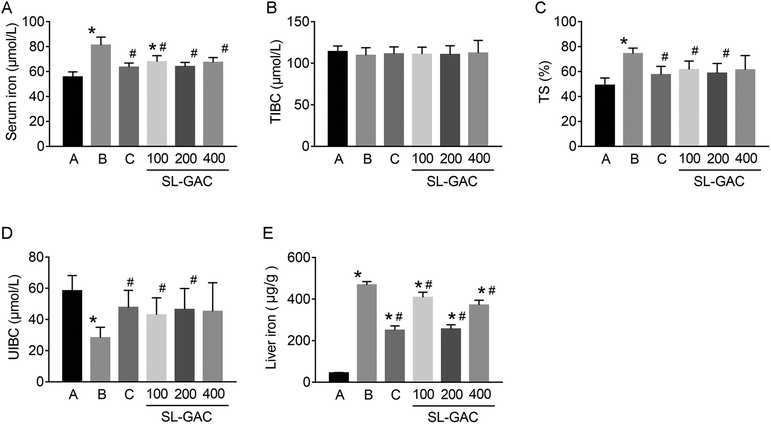
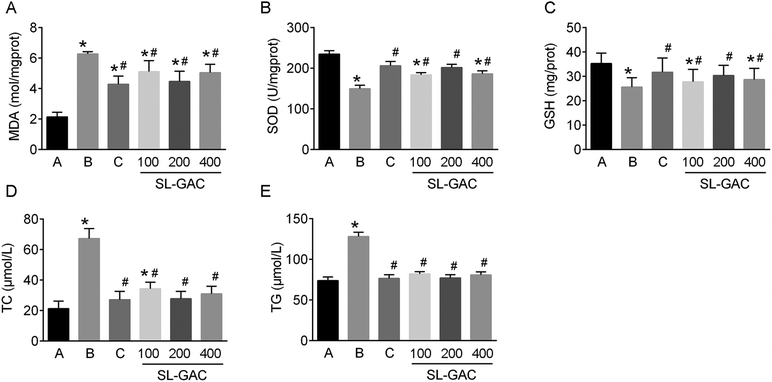
Compared with the blank-control group, the model group showed significantly increased (p < 0.05) serum levels of ALT, AST, γ-GT (Fig. 4D–F), and iron (Fig. 5A) and an increased TS% (Fig. 5C). However, TIBC was not significantly changed (p > 0.05, Fig. 5B), and UIBC was decreased (p < 0.05, Fig. 5D). In addition, MDA, TC, TG (Fig. 6A, D and E), and iron (Fig. 5E) in the liver tissue were significantly higher (p < 0.05) in the model group than in the blank-control group. In contrast, the levels of SOD and GSH in the liver tissue were significantly decreased (p < 0.05, Fig. 6B and C).Effects of SL–GAC treatment on histological findings and oxidative stress in the liver and immunohistochemical analysis for liver ferritin of mice chronically fed ethanol
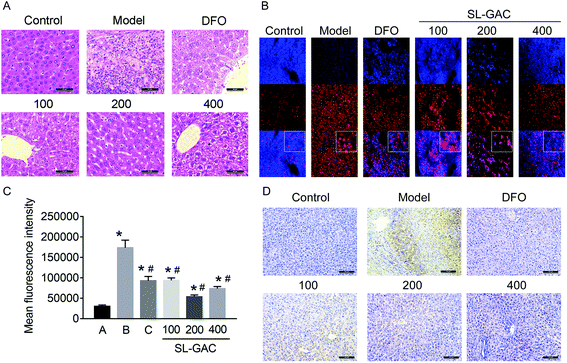
Pathological examination with hematoxylin–eosin staining revealed numerous fatty vacuoles and inflammatory cells infiltrating the hepatic tissue in the model group (Fig. 7A). Some of the normal hepatic lobules and cord structures had been replaced by fibrosis. Compared with the model group, the mice administered SL–GAC 200 mg per kg BW showed less severe liver-cell injury, with small fat vacuoles, little inflammatory cell infiltration, and no fibrosis. Dihydroethidium (DHE) staining showed significantly increased oxidative stress (indicated by red fluorescence) in the hepatic tissues in the model group (p < 0.05, Fig. 7B and C).Ferritin is a soluble, iron-containing protein formed by the combination of iron with apoferritin, a protein which has different proportions of two functionally distinct subunits: ferritin heavy chain H and ferritin light chain L.29 Immunohistochemical staining showed that compared with the control, the model group mice showed an increased ferritin expression (Fig. 7D). Compared with the model group, the 200 mg kg−1 SL–GAC group had a lower expression level of ferritin.
Effects of SL–GAC on the expression of iron metabolism-related proteins induced by chronic exposure to ethanol
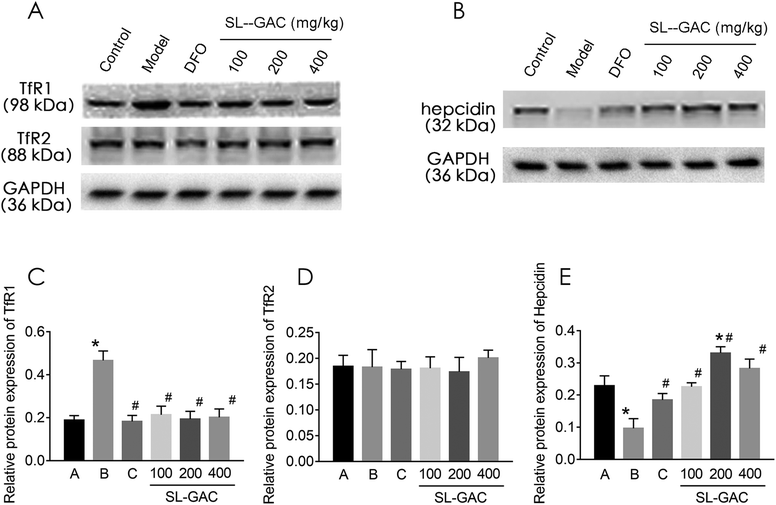
Under physiological conditions, the liver cells take up iron from the serum via endocytosis and acidification of the Fe3+–Tf–TfR1 complex.30 However, TfR2, a liver transferrin receptor on the cell membrane, has a high degree of homology to TfR1.31 After 12 weeks of alcohol intervention, the liver TfR1 protein expression was significantly higher in the alcohol (model) group than in the control group (p < 0.05, Fig. 8A and C), while the TfR2 expression showed no significant difference (p > 0.05, Fig. 8A and D). Treatment with the SL–GAC significantly reduced the abnormal alcohol-induced TfR1 expression and brought it close to the level in the control group (p < 0.05).Hepcidin regulates the expression level of ferroprotein and thereby regulates the level of iron turnover in the intestinal mucosal cells and macrophages, thus determining the level of circulating iron and affecting the iron load of the main iron-storage organs such as the liver.32 Hepcidin expression was significantly lower in the model group than in the control group (p < 0.05, Fig. 8B and E) and significantly higher in the SL–GAC treatment group than in the model group (p < 0.05).
Discussion
The results of the characterization of the SL–GAC suggested that this complex had physicochemical properties that were not consistent with those of GA, soybean lecithin, or their physical mixture. Furthermore, the characterization results were consistent between the various methods employed. However, the characterization failed to elucidate the specific binding pattern of the two compounds and the molecular configuration of the complex. Previous studies on phospholipid complexes of other drugs have also not represented the specific configurations of the corresponding complexes, and the binding mechanism of the drug–phospholipid complex remains poorly explained.33,34 Therefore, a theoretical chemical method that establishes a theoretical model that can predict the effects of intermolecular reactions may solve these problems.Based on the experimental data obtained using the characterization, a computer-simulated configuration was created after predicting the structure of the compound by using GaMD simulation.35 Our results confirmed that as a membrane protein, hPTP undergoes a conformational change after binding to the SL–GAC, indicating that the complex has good affinity with hPTP. Furthermore, we found that the SL–GAC stabilized the structure of hPTP in an aqueous and an ethanol environment because of its phospholipid complex molecular structure. Since hPTP is highly expressed in highly metabolic tissues and it can efficiently transfer phosphatidylcholines between membranes,16 we speculated that it could also promote the rapid intermembrane delivery of the SL–GAC after the body ingests alcohol and help the SL–GAC to achieve its expected pharmacological function.
Modern medical studies have shown that the cytotoxicity of ethanol metabolites (mainly acetaldehyde) and the metabolic disorder that these metabolites induce are the main causes of alcoholic liver injury.36,37 On this basis, lipid peroxidation further aggravates hepatocyte injury, leading to liver-tissue inflammation, necrosis, and fibrosis.38 Studies have shown that oxidative stress, which causes hepatocyte damage, is associated with the presence of trivalent iron ions in the cells.39 In addition, ALD patients often show abnormally elevated iron markers, such as the serum iron level, transferrin saturation, serum ferritin level, and hepatic iron concentration. Even mild-to-moderate drinking increases the risk of iron overload.40 This study found that alcohol caused a surge in the levels of reactive oxygen species (ROS) and iron in hepatocytes and aggravated liver damage. These results not only indicated that a mouse model of ALD with iron overload was successfully established but also verified the above points.
The administration of different doses of the SL–GAC effectively alleviated the adverse changes in the livers of the mice in the alcohol-intake group, and the results of the middle-dosage group were closest to those of the blank-control group. GA has antioxidant potential due to its ability to chelate pro-oxidant transition metals (e.g., Cu and Fe) and inhibit ROS production.41,42 However, it has been reported that at high concentrations, GA autoxidizes to produce ROS.43 This may explain why the effects of the SL–GAC on ALD mice were not dose dependent.
As an important organ of iron metabolism, the liver is responsible for transferrin synthesis, iron storage and transport, and the production of the raw materials required for hemoglobin synthesis. The body lacks an effective way to eliminate iron, and hepatic iron overload can occur easily. Ferritin, a soluble iron-containing protein formed by iron combining with apoferritin, regulates iron metabolism balance.29 Cells rich in ferritin, such as hepatocytes, have greater iron-storage capacity.44 We found that the hepatic ferritin expression increased in the mice administered ethanol. The result is consistent with those of other laboratory studies.25,45 The mechanism underlying the effect of alcohol consumption on ferritin is poorly understood. Studies have demonstrated that ferritin is not only a marker of iron deposition but also a potential marker of both acute and chronic liver damage.46,47 We speculated that alcohol may affect the ferritin expression in the following ways: altering iron absorption by changing gut permeability, inducing a hepatic inflammatory response with resultant de novo ferritin synthesis, and ferritin release from the liver cells.
In this study, we found that the liver iron content was lower in each SL–GAC group than in the model group, and the expression of ferritin was correlated with the liver iron content. The production of ROS through ethanol oxidation is considered to play an important role in the pathogenesis of ALD. We speculated that the liver iron content reduced in the 100 and 200 mg kg−1 SL–GAC groups owing to the iron-chelating and antioxidant properties of hydroxyl in the SL–GAC. However, the long-term administration of the SL–GAC at a dose of 400 mg kg−1 BW may induce an increase in the ROS in the liver and a hepatic inflammatory response. Thus, the high level of hepatic iron content in the mice administered 400 mg kg−1 SL–GAC may be attributable to the upregulated ferritin expression via a self-protective mechanism. However, we observed this phenomenon only over our experimental period of 12 weeks, and the mechanism needs to be further elucidated in future studies.
Studies suggest two possible mechanisms of hepatic iron overload in ALD: increased TfR1 expression and decreased hepcidin levels, which promote iron absorption in the intestine.30,32 Consistent with other studies,24,25,48 our data showed that in the model group, chronic ethanol feeding induced TfR1 expression, which suggested that the TfR1 protein plays a role in ethanol-induced hepatic iron uptake. However, TfR2 was found to have no considerable effect on hepatic iron uptake in the setting of ALD with iron overload. Additionally, the SL–GAC reduced the alcohol-induced increase in TfR1 expression to a level close to that observed in the control group. These findings suggest that the SL–GAC reduces iron intake by adjusting the protein expression of TfR1 and possibly also via its iron–chelating activity. However, compared with the mice in the 200 mg kg−1 SL–GAC group, those in the 400 mg kg−1 group exhibited a higher hepatic iron content despite the inhibition of TfR1 expression. This indicated that other membrane proteins besides TfR1 might participate in hepatic iron uptake under pathological conditions. Furthermore, the role of oxidative stress injury in the destruction of the normal iron-transport system in the hepatocytes cannot be excluded. Thus, the underlying mechanisms warrant further studies.
Hepcidin is a small peptide hormone produced by the liver that was discovered in 2000. A decrease in hepcidin secretion leads to an increased iron absorption in the small intestine. In this study, hepcidin expression was significantly lower in the model group than in the control group, which is consistent with other reports that alcohol reduces hepcidin expression in the liver.45,49,50 In patients with alcoholism, low hepcidin levels have been observed with a preserved liver function.51 This suggests that hepcidin suppression is a consequence of alcohol consumption rather than of ALD. Several studies have shown that additional factors (a second ‘hit’) may participate in the inhibition of hepcidin by alcohol, such as a large amount of iron accumulation in the hepatocytes in the presence of severe liver disease.52–54 However, other studies have reported that iron deficiency occurs with low hepcidin levels induced by alcohol consumption.55–57 We speculate that disordered hepcidin metabolism might be a primary cause of the abnormal iron homeostasis induced by alcohol; however, the mechanisms underlying the low levels of hepcidin are still elusive and remain to be fully explained. We also found that hepcidin expression was significantly higher in the SL–GAC groups than in the model group, which implied that the SL–GAC may reverse the ALD-associated iron overload by suppressing the downregulation of hepcidin and decreasing the iron absorption in the gut. The mechanism of how the SL–GAC blocks the ethanol-induced suppression of hepcidin needs to be elucidated.
Conclusions
In conclusion, our findings of the synthesis, computational investigation, and biological evaluation of the role of SL–GAC in ameliorating ALD with iron overload in mice can be summarized as follows: (1) SL–GAC was found to possess new physicochemical properties different from those of the raw materials, (2) computational investigation confirmed the molecular structure of SL–GAC and predicted that this complex may exert beneficial pharmacological activity in vivo through effectively combining with hPTP, (3) SL–GAC inhibited oxidative stress and lipid peroxidation and alleviated hepatic injury and iron accumulation induced by ALD, and (4) SL–GAC ameliorated alcohol-induced liver iron overload, possibly via the downregulation of TfR1 and the upregulation of hepcidin. These findings demonstrate the potential of SL–GAC as a protective treatment for ALD, especially for iron overload induced by ethanol. The mechanisms underlying these protective effects remain to be fully elucidated. Furthermore, SL–GAC had no dose-dependent effect on ALD mice. This phenomenon may be the result of autoxidation of SL–GAC at high doses, but this hypothesis requires further study.Author contributions
XQW prepared the SL–GAC. XQW and FF performed the animal experiments. YW and RJ performed the computational investigation. XQW and YW conceived the experiments, analyzed the data, and wrote the manuscript. WWC, YL, FF and RJ provided guidance and critically analyzed the work. All authors approved the final version of the manuscript.Conflicts of interest
The authors confirm that there is no conflict of interest with any financial organization regarding the results presented in this research manuscript.Acknowledgements
We thank Ran Jia and Yan Wang for their helpful advice and technical assistance with the computational simulations. The work presented in this study was supported by the National Natural Science Foundation of China (no. 81803218).References
- E. Fischer, Synthesis of depsides, lichen-substances and tannins, J. Am. Chem. Soc., 1914, 36, 1170–1201 CrossRef CAS.
- H. M. Chen, Y. C. Wu, Y. C. Chia, F. R. Chang, H. K. Hsu, Y. C. Hsieh, C. C. Chen and S. S. Yuan, Gallic acid, a major component of Toona sinensis leaf extracts, contains a ROS-mediated anti-cancer activity in human prostate cancer cells, Cancer Lett., 2009, 286, 161–171 CrossRef CAS PubMed.
- Z. He, A. Y. Chen, Y. Rojanasakul, G. O. Rankin and Y. C. Chen, Gallic acid, a phenolic compound, exerts anti-angiogenic effects via the PTEN/AKT/HIF-1alpha/VEGF signaling pathway in ovarian cancer cells, Oncol. Rep., 2016, 35, 291–297 CrossRef CAS PubMed.
- W. C. Hsu, S. P. Chang, L. C. Lin, C. L. Li, C. D. Richardson, C. C. Lin and L. T. Lin, Limonium sinense and gallic acid suppress hepatitis C virus infection by blocking early viral entry, Antiviral Res., 2015, 118, 139–147 CrossRef CAS PubMed.
- H. Khaledi, A. A. Alhadi, W. A. Yehye, H. M. Ali, M. A. Abdulla and P. Hassandarvish, Antioxidant, cytotoxic activities, and structure-activity relationship of gallic acid-based indole derivatives, Arch. Pharm., 2011, 344, 703–709 CrossRef CAS PubMed.
- L. Rashidi, E. Vasheghani-Farahani, K. Rostami, F. Ganji and M. Fallahpour, Mesoporous silica nanoparticles with different pore sizes for delivery of pH-sensitive gallic acid, Asia–Pac. J. Chem. Eng., 2014, 9, 845–853 CrossRef CAS.
- Y. Konishi, Y. Hitomi and E. Yoshioka, Intestinal absorption of p-coumaric and gallic acids in rats after oral administration, J. Agric. Food Chem., 2004, 52, 2527–2532 CrossRef CAS PubMed.
- T. Yasuda, A. Inaba, M. Ohmori, T. Endo, S. Kubo and K. Ohsawa, Urinary metabolites of gallic acid in rats and their radical-scavenging effects on 1,1-diphenyl-2-picrylhydrazyl radical, J. Nat. Prod., 2000, 63, 1444–1446 CrossRef CAS.
- W. S. Singleton, M. S. Gray, M. L. Brown and J. L. White, Chromatographically homogeneous lecithin from egg phospholipids, J. Am. Oil Chem. Soc., 1965, 42, 53–56 CrossRef CAS PubMed.
- A. Semalty, M. Semalty, D. Singh and M. S. M. Rawat, Preparation and characterization of phospholipid complexes of naringenin for effective drug delivery, J. Inclusion Phenom. Macrocyclic Chem., 2009, 67, 253–260 CrossRef.
- J. Khan, A. Alexander, Ajazuddin, S. Saraf and S. Saraf, Luteolin-phospholipid complex: preparation, characterization and biological evaluation, J. Pharm. Pharmacol., 2014, 66, 1451–1462 CrossRef CAS PubMed.
- F. Yu, M. Ao, X. Zheng, N. Li, J. Xia, Y. Li, D. Li, Z. Hou, Z. Qi and X. D. Chen, PEG-lipid-PLGA hybrid nanoparticles loaded with berberine-phospholipid complex to facilitate the oral delivery efficiency, Drug Delivery, 2017, 24, 825–833 CrossRef CAS PubMed.
- N. Mazurek, P. Bashkin and I. Pecht, Isolation of a basophilic membrane protein binding the anti-allergic drug cromolyn, EMBO J., 1982, 1, 585–590 CrossRef CAS PubMed.
- M. M. Dailey, C. Hait, P. A. Holt, J. M. Maguire, J. B. Meier, M. C. Miller, L. Petraccone and J. O. Trent, Structure-based drug design: from nucleic acid to membrane protein targets, Exp. Mol. Pathol., 2009, 86, 141–150 CrossRef CAS PubMed.
- X. Xue, M. D. Hall, Q. Zhang, P. C. Wang, M. M. Gottesman and X. J. Liang, Nanoscale drug delivery platforms overcome platinum-based resistance in cancer cells due to abnormal membrane protein trafficking, ACS Nano, 2013, 7, 10452–10464 CrossRef CAS PubMed.
- S. L. Roderick, W. W. Chan, D. S. Agate, L. R. Olsen, M. W. Vetting, K. R. Rajashankar and D. E. Cohen, Structure of human phosphatidylcholine transfer protein in complex with its ligand, Nat. Struct. Biol., 2002, 9, 507–511 CAS.
- V. T. Savolainen, K. Liesto, A. Männikkö, A. Penttilä and P. J. Karhunen, Alcohol Consumption and Alcoholic Liver Disease: Evidence of a Threshold Level of Effects of Ethanol, Alcohol.: Clin. Exp. Res., 1993, 17, 1112–1117 CrossRef CAS.
- J. Connor, Alcohol consumption as a cause of cancer, Addiction, 2017, 112, 222–228 CrossRef PubMed.
- D. Praud, M. Rota, J. Rehm, K. Shield, W. Zatonski, M. Hashibe, C. La Vecchia and P. Boffetta, Cancer incidence and mortality attributable to alcohol consumption, Int. J. Cancer, 2016, 138, 1380–1387 CrossRef CAS PubMed.
- Y. Wang, Y. Liu, I. Kirpich, Z. Ma, C. Wang, M. Zhang, J. Suttles, C. McClain and W. Feng, Lactobacillus rhamnosus GG reduces hepatic TNFalpha production and inflammation in chronic alcohol-induced liver injury, J. Nutr. Biochem., 2013, 24, 1609–1615 CrossRef CAS PubMed.
- X. Y. Han, J. N. Hu, Z. Wang, S. N. Wei, S. W. Zheng, Y. P. Wang and W. Li, 5-HMF Attenuates Liver Fibrosis in CCl4-Plus-Alcohol-Induced Mice by Suppression of Oxidative Stress, J. Nutr. Sci. Vitaminol., 2017, 63, 35–43 CrossRef CAS PubMed.
- S. Thangavel, C. T. Mulet, V. S. R. Atluri, M. Agudelo, R. Rosenberg, J. G. Devieux and M. P. N. Nair, Oxidative Stress in HIV Infection and Alcohol Use: Role of Redox Signals in Modulation of Lipid Rafts and ATP-Binding Cassette Transporters, Antioxid. Redox Signaling, 2018, 28, 324–337 CrossRef CAS PubMed.
- L. Costa-Matos, P. Batista, N. Monteiro, P. Henriques, F. Girão and A. Carvalho, Hfe mutations and iron overload in patients with alcoholic liver disease, Arq. Gastroenterol., 2013, 50, 35–41 CrossRef PubMed.
- Y. Ren, F. Deng, H. Zhu, W. Wan, J. Ye and B. Luo, Effect of epigallocatechin-3-gallate on iron overload in mice with alcoholic liver disease, Mol. Biol. Rep., 2011, 38, 879–886 CrossRef CAS PubMed.
- Y. Tang, Y. Li, H. Yu, C. Gao, L. Liu, M. Xing, L. Liu and P. Yao, Quercetin attenuates chronic ethanol hepatotoxicity: implication of “free” iron uptake and release, Food Chem. Toxicol., 2014, 67, 131–138 CrossRef CAS PubMed.
- M. Strlič, T. Radovič, J. Kolar and B. Pihlar, Anti- and Prooxidative Properties of Gallic Acid in Fenton-Type Systems, J. Agric. Food Chem., 2002, 50, 6313–6317 CrossRef PubMed.
- B. T. Kurien and R. H. Scofield, Western blotting, Methods, 2006, 38, 283–293 CrossRef CAS PubMed.
- C. Liu, C. Chen, H. Ma, E. Yuan and Q. Li, Characterization and DPPH Radical Scavenging Activity of Gallic Acid-Lecithin Complex, Trop. J. Pharm. Res., 2014, 13, 1333–1338 CrossRef CAS.
- E. C. Theil, Ferritin: structure, gene regulation, and cellular function in animals, plants, and microorganisms, Annu. Rev. Biochem., 1987, 56, 289–315 CrossRef CAS PubMed.
- D. R. Richardson, Mysteries of the Transferrin-Transferrin Receptor 1 Interaction Uncovered, Cell, 2004, 116, 483–485 CrossRef CAS PubMed.
- L. Silvestri, A. Nai, A. Pagani and C. Camaschella, The extrahepatic role of TFR2 in iron homeostasis, Front. Pharmacol., 2014, 5, 93 Search PubMed.
- E. Nemeth and T. Ganz, Regulation of iron metabolism by hepcidin, Annu. Rev. Nutr., 2006, 26, 323–342 CrossRef CAS PubMed.
- K. Maiti, K. Mukherjee, A. Gantait, B. P. Saha and P. K. Mukherjee, Curcumin-phospholipid complex: Preparation, therapeutic evaluation and pharmacokinetic study in rats, Int. J. Pharm., 2007, 330, 155–163 CrossRef CAS PubMed.
- F. Cui, K. Shi, L. Zhang, A. Tao and Y. Kawashima, Biodegradable nanoparticles loaded with insulin-phospholipid complex for oral delivery: preparation, in vitro characterization and in vivo evaluation, J. Controlled Release, 2006, 114, 242–250 CrossRef CAS PubMed.
- Y. Miao, V. A. Feher and J. A. McCammon, Gaussian Accelerated Molecular Dynamics: Unconstrained Enhanced Sampling and Free Energy Calculation, J. Chem. Theory Comput., 2015, 11, 3584–3595 CrossRef CAS PubMed.
- M. Setshedi, J. R. Wands and S. M. d. l. Monte, Acetaldehyde adducts in alcoholic liver disease, Oxid. Med. Cell. Longevity, 2010, 3, 178–185 CrossRef PubMed.
- S. D. Malnick, M. Beergabel and H. Knobler, Non-alcoholic fatty liver: a common manifestation of a metabolic disorder, QJM, 2003, 96, 699–709 CrossRef CAS PubMed.
- Y. Y. Chang, Y. L. Lin, D. J. Yang, C. W. Liu, C. L. Hsu, B. S. Tzang and Y. C. Chen, Hepatoprotection of noni juice against chronic alcohol consumption: lipid homeostasis, antioxidation, alcohol clearance, and anti-inflammation, J. Agric. Food Chem., 2013, 61, 11016–11024 CrossRef CAS PubMed.
- J. Klaudia and V. Marian, Importance of Iron Chelation in Free Radical-Induced Oxidative Stress and Human Disease, Curr. Pharm. Des., 2011, 17, 3460–3473 CrossRef PubMed.
- P. Brissot, M. Ropert, C. Le Lan and O. Loreal, Non-transferrin bound iron: a key role in iron overload and iron toxicity, Biochim. Biophys. Acta, 2012, 1820, 403–410 CrossRef CAS PubMed.
- A. E. Fazary, M. Taha and Y. H. Ju, Iron Complexation Studies of Gallic Acid, J. Chem. Eng. Data, 2009, 54, 35–42 CrossRef CAS.
- B. Badhani, N. Sharma and R. Kakkar, Gallic acid: a versatile antioxidant with promising therapeutic and industrial applications, RSC Adv., 2015, 5, 27540–27557 RSC.
- J. Gil-Longo and C. Gonzalez-Vazquez, Vascular pro-oxidant effects secondary to the autoxidation of gallic acid in rat aorta, J. Nutr. Biochem., 2010, 21, 304–309 CrossRef CAS PubMed.
- Y. Fan, J. Zhang, L. Cai, S. Wang, C. Liu, Y. Zhang, L. You, Y. Fu, Z. Shi, Z. Yin, L. Luo, Y. Chang and X. Duan, The effect of anti-inflammatory properties of ferritin light chain on lipopolysaccharide-induced inflammatory response in murine macrophages, Biochim. Biophys. Acta, 2014, 1843, 2775–2783 CrossRef CAS PubMed.
- D. D. Harrison-Findik, E. Klein, C. Crist, J. Evans, N. Timchenko and J. Gollan, Iron-mediated regulation of liver hepcidin expression in rats and mice is abolished by alcohol, Hepatology, 2007, 46, 1979–1985 CrossRef CAS PubMed.
- N. Naz, F. Moriconi, S. Ahmad, A. Amanzada, S. Khan, S. Mihm, G. Ramadori and I. A. Malik, Ferritin L is the sole serum ferritin constituent and a positive hepatic acute-phase protein, Shock, 2013, 39, 520–526 CrossRef CAS PubMed.
- N. Sheikh, J. Dudas and G. Ramadori, Changes of gene expression of iron regulatory proteins during turpentine oil-induced acute-phase response in the rat, Lab. Invest., 2007, 87, 713–725 CrossRef CAS PubMed.
- Y. Suzuki, H. Saito, M. Suzuki, Y. Hosoki, S. Sakurai, Y. Fujimoto and Y. Kohgo, Up-regulation of transferrin receptor expression in hepatocytes by habitual alcohol drinking is implicated in hepatic iron overload in alcoholic liver disease, Alcohol.: Clin. Exp. Res., 2002, 26, 26S–31S CrossRef CAS.
- E. Zmijewski, S. Lu and D. D. Harrison-Findik, TLR4 signaling and the inhibition of liver hepcidin expression by alcohol, World J. Gastroenterol., 2014, 20, 12161–12170 CrossRef CAS PubMed.
- L. N. Gerjevic, N. Liu, S. Lu and D. D. Harrison-Findik, Alcohol Activates TGF-Beta but Inhibits BMP Receptor-Mediated Smad Signaling and Smad4 Binding to Hepcidin Promoter in the Liver, Int. J. Hepatol., 2012, 2012, 459278 Search PubMed.
- L. Costa-Matos, P. Batista, N. Monteiro, M. Simoes, C. Egas, J. Pereira, H. Pinho, N. Santos, J. Ribeiro, M. A. Cipriano, P. Henriques, F. Girao, A. Rodrigues and A. Carvalho, Liver hepcidin mRNA expression is inappropriately low in alcoholic patients compared with healthy controls, Eur. J. Gastroenterol. Hepatol., 2012, 24, 1158–1165 CrossRef CAS PubMed.
- D. D. Harrison-Findik, Is the iron regulatory hormone hepcidin a risk factor for alcoholic liver disease?, World J. Gastroenterol., 2009, 15, 1186–1193 CrossRef CAS PubMed.
- D. D. Harrison-Findik and S. Lu, The effect of alcohol and hydrogen peroxide on liver hepcidin gene expression in mice lacking antioxidant enzymes, glutathione peroxidase-1 or catalase, Biomolecules, 2015, 5, 793–807 CrossRef CAS PubMed.
- S. M. Huebner, S. E. Blohowiak, P. J. Kling and S. M. Smith, Prenatal Alcohol Exposure Alters Fetal Iron Distribution and Elevates Hepatic Hepcidin in a Rat Model of Fetal Alcohol Spectrum Disorders, J. Nutr., 2016, 146, 1180–1188 CrossRef CAS PubMed.
- H. Tsukamoto, W. Horne, S. Kamimura, O. Niemelä, S. Parkkila, S. Ylä-Herttuala and G. M. Brittenham, Experimental liver cirrhosis induced by alcohol and iron, J. Clin. Invest., 1995, 96, 620–630 CrossRef CAS PubMed.
- J. Olynyk, P. Hall, W. Reed, P. Williams, R. Kerr and M. Mackinnon, A long-term study of the interaction between iron and alcohol in an animal model of iron overload, J. Hepatol., 1995, 22, 671–676 CrossRef CAS PubMed.
- J. Varghese, J. V. James, S. Sagi, S. Chakraborty, A. Sukumaran, B. Ramakrishna and M. Jacob, Decreased hepatic iron in response to alcohol may contribute to alcohol-induced suppression of hepcidin, Br. J. Nutr., 2016, 115, 1978–1986 CrossRef CAS PubMed.
Footnote |
| † Electronic supplementary information (ESI) available: Specific materials and methods of ultraviolet spectroscopy studies, differential thermal analysis, computational methods, and acute toxicity studies of the SL–GAC. Detailed data of ultraviolet, differential thermal analysis, supplementary computer simulation, and results of acute toxicity studies of the SL–GAC. See DOI: 10.1039/c9fo01022j |
| This journal is © The Royal Society of Chemistry 2019 |

