 Open Access Article
Kinetics of initiation of the third generation Grubbs metathesis catalyst: convergent associative and dissociative pathways
Veronica
Forcina
,
Andrés
García-Domínguez
and
Guy C.
Lloyd-Jones
 *
*
EaStChem, School of Chemistry, Joseph Black Building, David Brewster Road, EH9 3FJ, Edinburgh, UK. E-mail: guy.lloyd-jones@ed.ac.uk
First published on 21st May 2019
Abstract
The kinetics of the nominally irreversible reaction of the third generation Grubbs catalyst G-III-Br (4.6 μM) with ethyl vinyl ether (EVE) in toluene at 5 °C have been re-visited. There is a rapid equilibrium between the bispyridyl form of G-III-Br, 1, and its monopyridyl form, 2 (K ≈ 0.001 M). The empirical rate constants (kobs.) for the reaction with EVE, determined UV-vis spectrophotometrically under optimised anaerobic stopped-flow conditions, are found by testing the quality of fit of a series of steady-state approximations. The kinetics do not correlate with solely dissociative or associative pathways, but do correlate with a mechanism where these pathways converge at an alkene complex primed to undergo metathesis. In the presence of traces of air there is a marked increased in the rate of decay of G-III-Br due to competing oxidation to yield benzaldehyde; a process that appears to be very efficiently catalysed by trace metal contaminants. The apparent acceleration of the initiation process may account for the rates determined herein being over an order of magnitude lower than previously estimated.
Introduction
Initiation in metathesis
Over the last two decades, ruthenium alkylidene catalysed alkene metathesis1 has become ubiquitous, with applications at scales ranging from μg2 to kg.3 Much of this has been the direct consequence of a sustained period of development of a series of robust and well-characterised Ru-complexes,1 with three general mechanistic events4 identified as initiation,5,6 turnover, and decomposition.7 Initiation and turnover are mechanistically-related, and comprise, inter alia, alkene coordination, mutual interconversion of the alkylidene–alkene pair via a ruthenacyclobutane, then dissociation or displacement of the newly formed alkene. The co-product from initiation, most frequently styrene or a derivative,8 is non-innocent, able to undergo competitive metathetic reincorporation at ruthenium to regenerate the benzylidene complex.9Exquisite detail regarding catalyst turnover has been elucidated using techniques such as heteronuclear NMR magnetisation transfer,10 dynamic nuclear polarisation labelling,11 and single-molecule fluorescence.12 However, much of the work in the primary phases of the development of new ruthenium pre-catalysts, and the investigation of their relative efficiency and activity, focussed on the initiation event.1,4,5 A now classic example of such initiation studies is the series of experiments reported by Grubbs, Sanford and Love et al. in which a large excess of ethyl vinyl ether (EVE) was used to generate styrene and a stable Fischer-type alkylidene product [Ru] = CHOEt, in an apparently irreversible manner.13 Using this approach, the kinetics of initiation, of both G-I and G-II, were shown to proceed via pathway I (Fig. 1).13,14
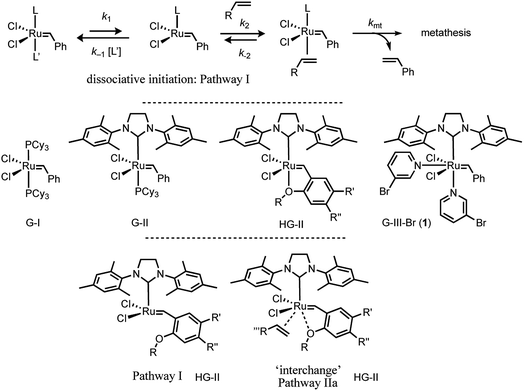 | ||
| Fig. 1 Generic dissociative (pathway I) initiation mechanism for ruthenium–alkylidene complexes G-I and G-II and additional associative-interchange (pathway IIa) for HG-II. | ||
The initiation mechanisms for a wide variety of other Grubbs type catalysts have been studied, at varying levels of detail, both computationally15 and experimentally.5 Most salient to the results presented herein are the in-depth investigations by Plenio16 and Percy17 of the initiation of the HG-II catalyst18 and analogues.16 The kinetic data were analysed either by the addition of a simple linear correction term, first order in alkene, to the standard hyperbolic fitting function for dissociative pathway I, or by the assumption of a second-order process.17 The kinetics16 and activation parameters17 were indicative that an associative ‘interchange’ (pathway IIa, Fig. 1) can also contribute to initiation.16,17
The Grubbs Third Generation Catalysts (G-III-X)
In 2001, Grubbs and Love reported the G-III-X (X = H, Cl, Br) catalysts, which undergo exceptionally fast initiation.19 In preliminary studies using UV-vis spectrophotometry, the lower-limit for the dissociative initiation (k1) of the fastest catalyst, G-III-Br, was estimated to be >4 s−1; more than six orders of magnitude faster than G-II,13,14 and three orders of magnitude faster than HG-II.18 The readily-synthesised third generation system G-III-Br (1) remains one of the fastest-initiating commercially available ruthenium alkylidene metathesis catalysts.1In 2013 Trzaskowski and Grela reported a computational analysis of the possible metathesis initiation pathways of the G-III-X pre-catalysts (X = Br, H) by ethene and but-1-ene, Fig. 2.20 A number of important conclusions were drawn. Firstly, the dissociation of a pyridine ligand from G-III-X (1 M standard state) was predicted to be only slightly endergonic, leading to K0 values in the range of 10−3 to 10−1 M. Secondly, in complex 2, the remaining pyridine ligand occupies a site that is intermediate between the cis and trans locations of the two pyridyl ligands in the precursor G-III-Br, 1. Thirdly, the dissociation (k1) of the remaining pyridine ligand from 2, to generate the 14e− complex 3, is also predicted to be only mildly endergonic, with a transition state barrier of between 10.1–13.6 kcal mol−1; subsequent alkene coordination (k2, to generate complex 4, Fig. 2) has a low barrier (<4 kcal mol−1) and is mildly exergonic. Finally, a pathway involving association of the alkene with monopyridyl complex 2 to generate a discrete 18e− intermediate (analogous complex to 6, Fig. 2), en route to 16e− alkene complex 4 (stepwise associative, type IIb, k4) was computed to have a similar barrier (at standard state) to dissociation (pathway I, k1) and a lower barrier than the direct formation of 3via interchange (IIa, k3) at the 16e− intermediate 2, Fig. 2. Thus overall, it was concluded, from DFT energetics, that dissociative (pathway I) and associative–dissociative (pathways IIa, b) processes are all feasible mechanisms to initiation, and simultaneously that they are the rate-limiting steps for the overall initiation process.20
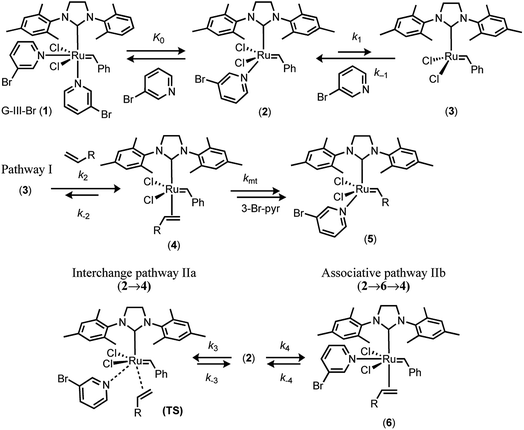 | ||
| Fig. 2 Trzaskowski and Grela’s computational analysis20 of mechanisms for initiation of the third-generation catalyst G-III-Br with ethene (R = H) and butene (R = Et). | ||
In 2017, Guironnet reported detailed NMR studies of the solution phase speciation of the G-III-X complexes (X = H, Br) and the kinetics of polymerisation of N-hexyl-exo-norbornene-5,6-dicarboximide.21 Titrations of G-III-X (X = H, Br) in CH2Cl2 with pyridine, monitored by 1H NMR, established that at room temperature, K0 = 0.4–0.5 M for G-III-H, and 2.4 M for G-III-Br (1),21 values broadly consistent with the calculations of Trzaskowski and Grela.20 Guironnet demonstrated that this has significant phenomenological impact on the metathesis kinetics, notably in living-polymerisation, since the net effect of using G-III-Br 1 is that the pre-dissociated 3-Br-pyridine (L), present at a concentration identical to the active species, 2, acts as an inhibitor to initiation and then turnover. Grubbs later reported on the co-polymerization kinetics of 23 different norbornenyl comonomers with ω-norbornenyl macromonomer, catalysed by G-III-H, for which the 1H NMR pyridine titrations of G-III-H in CH2Cl2 yielded K0 = 0.25 M, at room temperature.22 The polymerization kinetics were analysed on the basis of the dissociative mechanism (pathway I) in which a monoligated intermediate [(IMes)Ru(![[double bond, length as m-dash]](https://www.rsc.org/images/entities/char_e001.gif) CHpoly)Cl2(3-H-pyr)1] (poly = living polymer) is the dominant resting state in a pre-saturation regime (k2 ≪ k−1). However, it was noted that the associative pathway II, proceeding in a stepwise (IIb) or concerted (IIa)20 manner, could not be conclusively ruled out.21
CHpoly)Cl2(3-H-pyr)1] (poly = living polymer) is the dominant resting state in a pre-saturation regime (k2 ≪ k−1). However, it was noted that the associative pathway II, proceeding in a stepwise (IIb) or concerted (IIa)20 manner, could not be conclusively ruled out.21
Herein, we revisit the reaction of G-III-Br (1) with ethyl vinyl ether (EVE, ‘E’) in toluene at 5 °C, Fig. 3,19 to test whether the dissociative (I) and associative (II) pathways explored computationally by Trzaskowski and Grela,20Fig. 2, can be distinguished experimentally.13,14,19
Results and discussion
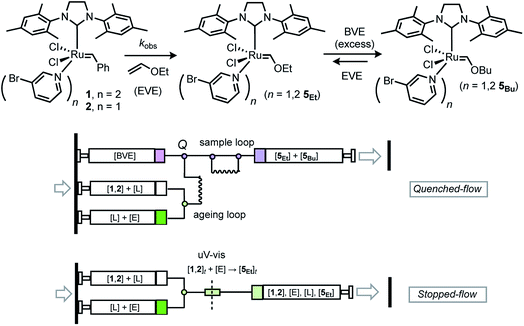
Initial tests confirmed that the alkylidene Ru![[double bond, length as m-dash]](https://www.rsc.org/images/entities/char_e001.gif) CH signal in the 1H NMR spectra of G-III-Br versus Fischer carbene 5Et was well resolved in toluene (19.4 ppm versus 13.8 ppm, respectively), and that addition of ≥1.1 equivalents of EVE to 1 and 2 led to >99% conversion to 5Et. We began by exploring automated rapid quenched-flow (RQF, Fig. 3) using butyl vinyl ether, BVE, in large excess (100 equiv.) as a quenching agent (Q). However, the control experiments showed that, somewhat surprisingly, 5Et/5Bu undergo interconversion, leading to the erosion of the kinetic trapping ratio of 5Et/5Bu, over a period of minutes, even after adding PPh3 as a stabiliser.
CH signal in the 1H NMR spectra of G-III-Br versus Fischer carbene 5Et was well resolved in toluene (19.4 ppm versus 13.8 ppm, respectively), and that addition of ≥1.1 equivalents of EVE to 1 and 2 led to >99% conversion to 5Et. We began by exploring automated rapid quenched-flow (RQF, Fig. 3) using butyl vinyl ether, BVE, in large excess (100 equiv.) as a quenching agent (Q). However, the control experiments showed that, somewhat surprisingly, 5Et/5Bu undergo interconversion, leading to the erosion of the kinetic trapping ratio of 5Et/5Bu, over a period of minutes, even after adding PPh3 as a stabiliser.
Stopped-flow UV-vis analysis
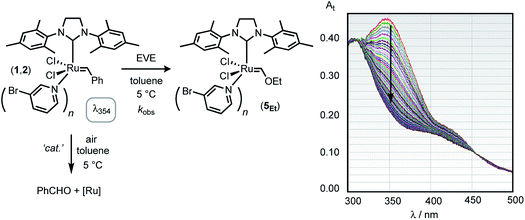
Given the above complications, we turned to the analysis of the reactions by in situ UV-vis spectrophotometric analysis.19 Using a stopped-flow system, Fig. 3, we monitored the signal centred at 354 nm, assumed to arise from metal to benzylidene π* charge transfer analogous to that with H-G-II,16 and absent in the initiation product ([Ru] = CHOEt), which lacks the conjugated phenyl group. Whilst this in situ method leads to a substantial increase in data-density compared to e.g. RQF, the low concentrations of [Ru]tot (approx. 50 μM) required for the UV-vis analysis initially resulted in some variability in rates between runs. This was eventually identified as arising from trace diffusion of air into reagent delivery lines, the solvent-purification system, and into sample reservoirs in the stopped-flow apparatus, which led to periods during which the first-order rate of quenching of the UV absorption at 348 nm increased sporadically between runs. The deliberate oxidation of G-III-Br in d8-toluene was monitored by 1H NMR spectroscopy, which confirmed benzaldehyde generation by the oxidative cleavage of the benzylidene ligand, and thus the loss of the moiety responsible for the MLCT band; the complex mixture of ruthenium co-products was not further investigated. Subsequent tests confirmed that the aerobic oxidation reaction of dilute solutions of G-III-Br (1,2) in toluene solution, as monitored by the decay of the MLCT band at 354 nm, is not photocatalysed (decay rates were unaffected by gating the UV-vis irradiation) but is highly sensitive to the method of stock-solution preparation and its introduction into the stopped-flow system. The passage of the solution of G-III-Br through stainless-steel needles during sample preparation (sequential dilutions etc.) or during introduction to the apparatus induces very rapid oxidative decay rates, as compared to samples prepared and delivered solely through glass/PTFE systems.† After extensive procedural refinement, the rates of decay of the MLCT band became stable and reproducible, within experimental error, between samples and runs, including attenuation to zero when no EVE was present, and thus attributable solely to metathesis initiation, rather than other competing processes.Kinetics of reaction of EVE with G-III-Br
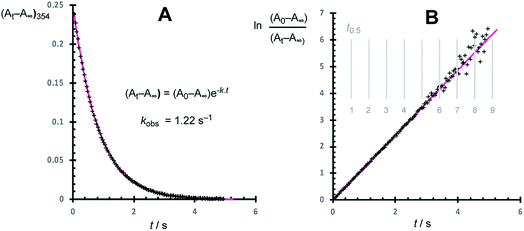
Using the stopped-flow method, the kinetic data were obtained from the temporal decay of the signal at 354 nm, Fig. 4, obtained approximately 8 ms after the mixing of a solution of G-III-Br (1,2) + 3-Br-pyridine ([Ru]tot = ‘L’ = 92 μM) with solutions of ethyl vinyl ether (‘E’, 0.8 mM to 1.66 M) in toluene at 5.0 ± 0.1 °C. In further experiments, the solution of ethyl vinyl ether also contained 3-Br-pyridine (‘L’, 0 to 4.2 mM). The empirical first order rate constants were obtained by non-linear regression of the exponential decay in absorbance, Fig. 5. First-order decays in the signal were obtained through >6 half-lives (>98% conversion) under all conditions tested. The empirical rate constants, kobs., Table 1, were then determined by averaging a minimum of 10 experiments per concentration variation. For comparison, analogous experiments were conducted with the slower-initiating G-I catalyst system, at [EVE] concentrations ranging from 0.1 to 1.5 M, again in toluene, but at 21 °C, Table 2.| Entry | [EVE]0/M | [L]added/mM | k obs. /s |
|---|---|---|---|
| a k obs. non-linear regression, see Fig. 5; average of ≥20 determinations, with standard deviation for each dataset (1σ) in parenthesis. [Ru]tot = 0.046 mM. Concentrations are after mixing at 5 ± 0.1 °C. b Reaction in toluene/Et2O; (EVE + Et2O) = 0.83 M. | |||
| 1 | 0.063 | 0.000 | 0.29(0.03) |
| 2 | 0.310 | 0.000 | 0.57(0.03) |
| 3 | 0.520 | 0.000 | 0.90(0.05) |
| 4 | 0.630 | 0.000 | 1.06(0.05) |
| 5 | 0.690 | 0.000 | 1.00(0.02) |
| 6 | 0.830 | 0.000 | 1.26(0.05) |
| 7 | 0.063 | 0.250 | 0.18(0.02) |
| 8 | 0.310 | 0.250 | 0.31(0.02) |
| 9 | 0.630 | 0.250 | 0.50(0.03) |
| 10 | 0.830 | 0.250 | 0.63(0.01) |
| 11 | 0.063 | 0.446 | 0.15(0.01) |
| 12 | 0.310 | 0.446 | 0.24(0.01) |
| 13 | 0.630 | 0.446 | 0.36(0.02) |
| 14 | 0.830 | 0.446 | 0.44(0.007) |
| 15 | 0.063 | 1.046 | 0.10(0.01) |
| 16 | 0.310 | 1.046 | 0.14(0.01) |
| 17 | 0.630 | 1.046 | 0.22(0.01) |
| 18 | 0.830 | 1.046 | 0.24(0.01) |
| 19 | 0.063 | 2.050 | 0.06(0.003) |
| 20 | 0.310 | 2.050 | 0.09(0.007) |
| 21 | 0.630 | 2.050 | 0.12(0.01) |
| 22 | 0.830 | 2.050 | 0.15(0.01) |
| 23 | 0.0004 | 0.000 | 0.06(0.002) |
| 24 | 0.0020 | 0.000 | 0.14(0.01) |
| 25 | 0.0040 | 0.000 | 0.21(0.02) |
| 26 | 0.0063 | 0.000 | 0.22(0.03) |
| 27 | 0.0340 | 0.000 | 0.29(0.03) |
| 28b | 0.063 | 0.000 | 0.35(0.05) |
| Entry | [EVE]0/M | [L]addedb/mM | k obs. /s |
|---|---|---|---|
| a k obs. is an average of ≥10 experiments, obtained by non-linear regression of growth of the signal at 484 nm. Standard deviation (1σ) in parenthesis. [Ru]tot = 0.046 mM. Concentrations are those after mixing at 21 ± 0.1 °C. b No additional ligand was added. | |||
| 1 | 0.146 | 0.000 | 0.0070(0.0002) |
| 2 | 0.198 | 0.000 | 0.0079(0.0002) |
| 3 | 0.245 | 0.000 | 0.0080(0.0002) |
| 4 | 0.371 | 0.000 | 0.0097(0.0002) |
| 5 | 0.493 | 0.000 | 0.0110(0.0001) |
| 6 | 0.618 | 0.000 | 0.0110(0.0001) |
| 7 | 0.668 | 0.000 | 0.0108(0.0001) |
| 8 | 0.718 | 0.000 | 0.0113(0.0001) |
| 9 | 0.912 | 0.000 | 0.0119(0.0001) |
| 10 | 1.500 | 0.000 | 0.0123(0.0002) |
As anticipated,13,14 the data obtained for the G-I system (Table 2) gave a simple correlation with [EVE], as analysed graphically, Fig. 6A, by the application of the standard steady-state rate equation for pathway I, yielding an initiation rate (k1) of 0.014 ± 0.002 s−1 at 21 °C, in agreement with the value reported by Sanford, Ulman and Grubbs (0.016 s−1).13
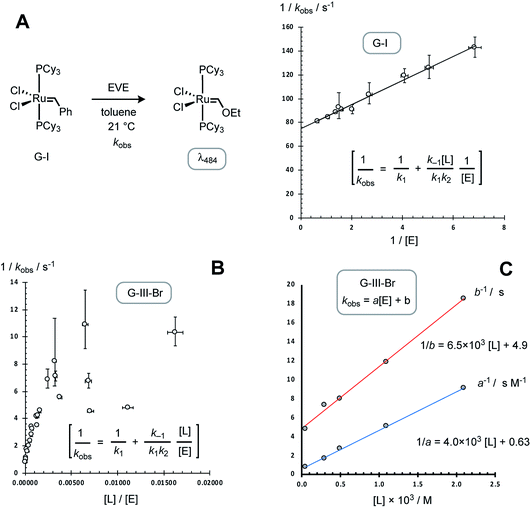 | ||
| Fig. 6 Preliminary analyses of rate-data from Tables 1 and 2, employing the equation for initiation solely via dissociative pathway I (see Fig. 2 for rate constant definitions). (A) G-I initiation at 21 °C; correlation: 1/kobs. = 10.5/[E] + 74, leads to k1 = 0.014 s−1. Error bars are propagated from ±1σ in kobs and ±2.5% in [E]. (B) G-III-Br initiation at 5 °C; scattered correlation. Table 1 entries 19 and 23 omitted for clarity. [L] calculated from K0 = 0.001 M. Error bars are propagated from ±1σ in kobs. and ±2.5% in both [L] and [E]. (C) Correlation of empirical coefficients for kobs. = a[E] + b, Table 3, with [L]tot, leading to kobs./s = ([E]/(4.0 × 103 [L] + 0.63)) + 1/(6.5 × 103 [L] + 4.9), when 0.83 ≥ [E] ≥ 0.06 M and [L], calculated using K0 = 0.001 M, is in the range 0.05 to 2.1 mM. | ||
In contrast to G-I, the application of the analogous standard steady-state rate equation for pathway I,14–16 for the data obtained with G-III-Br (Table 1), did not give a simple linear correlation, Fig. 6B, which was indicative that dissociation (k1) does not dominate initiation across the range of concentrations tested. The reactions conducted without added 3-Br-pyridine (L) and with ethyl vinyl ether (E) concentrations in the range 0.06 to 0.83 M (Table 1, entries 1–6) gave rates that were linearly dependent on [E]; but had a substantial non-zero y-axis intercept: kobs. = a[E] + b; Table 3, entry 1. The kinetics deviated strongly from the relationship kobs. = a[E] + b when [E]0 ≤ 4 mM (Table 1, entries 23–27); see below for further discussion and global kinetic analysis. The inclusion of exogenous ligand ([L] = 0.3–2 mM, Table 1, entries 7–22) resulted in progressive reduction in the empirical coefficients a and b, Table 3, entries 2–5. Graphical analysis showed that both 1/a and 1/b have an approximately linear dependence on [L], Fig. 6C, indicative of inhibition by added ligand L, via at least two pathways.
Ligand dissociation from G-III-Br
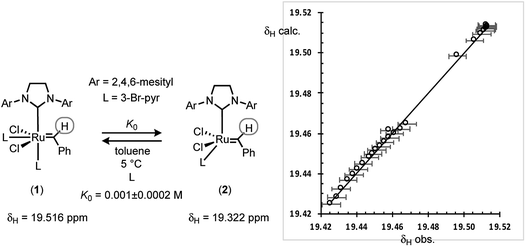
Guironnet21 and Grubbs,22 have independently determined K0 for G-III-H and G-III-Br in CH2Cl2. The values from van’t Hoff analysis of G-III-H,21 together with the (K0Br/K0H) ratio of 4.8, might then suggest that for the reactions reported herein there will be >99% dissociation of 1 to 2. However, this requires a negligible impact of solvent (CH2Cl2versus toluene) on the equilibrium. G-III-Br was thus analysed by 1H NMR spectroscopy in d8-toluene at 5 °C, combining data from a series of additions of 3-bromopyridine ligand to G-III-Br, and a series of dilutions of G-III-Br without added ligand. The linear regression of the time-average population-weighted chemical shift of the benzylidene CH signal (19.3–19.5 ppm) against that calculated using a standard quadratic equation for the equilibrium of 1 with 2, with K0, δ1 and δ2 as variables, Fig. 7, established that ligand dissociation from 1 is considerably less favourable in toluene at 5 °C, compared to CH2Cl2 at room temperature.Given the sensitivity of the equilibrium to solvent, the initiation rate of G-III-Br conducted at high concentrations of ethyl vinyl ether, [E], could conceivably be affected by the change in medium from pure toluene to mixtures of toluene and ethyl vinyl ether. A control experiment in which the reaction was conducted in toluene containing 0.063 M ethyl vinyl ether and 0.767 M Et2O, as a non-metathetic surrogate, gave a similar empirical rate constant to that conducted with just the ethyl vinyl ether in toluene (Table 1, entries 1 and 28), indicative that the changing reaction medium does not contribute significantly to the observed increase in empirical coefficient a as [E] is increased.
Steady-state analyses of dissociative and associative initiation mechanisms for G-III-Br
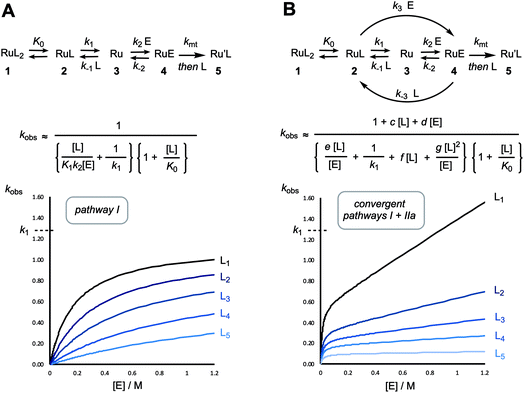
A dissociative mechanism beginning from 2, and proceeding via3 and 4, to irreversibly generate 5 will result in the rate of metathesis rising as the ethyl vinyl ether concentration, [E], is raised, but in a decreasingly proportionate manner, eventually reaching an asymptote when k2km[E] ≫ k−1[L](k−2 + km), such that the overall rate of conversion of 2 to 5 becomes independent of [E] and is dictated solely by the rate of ligand (L) dissociation (k1); i.e. saturation kinetics. Based on the pyridine dissociation constant (K0) determined herein (Fig. 7) the speciation of the G-III-Br complex 1 in solution under the conditions employed for stopped-flow UV-vis will vary from being dominated by monopyridyl complex 2 (96%), when no exogenous 3-bromopyridine ligand (L) is present, through to predominantly the bispyridyl complex 1 (66%) when L = 2 mM. Thus, as the free ligand concentration, [L], is raised (Table 1, entries 7–22) the rate of metathesis will be attenuated in both the pre-saturation phase and the saturation phase, as outlined schematically in Fig. 8A.However, even with this adjustment for K0, the single-pathway dissociative mechanism (pathway I) is inconsistent with the observed dependencies on [E] and [L], Table 1. The augmentation of the steady-state rate equation for pathway I with an additional term that solely comprises a divergent associative pathway (IIa or IIb)16 gives a better, but still imperfect, correlation. However, non-linear regression of the predicted versus empirical rate constant (kobs.) as a function of [E] and [L] using a speciation-weighted (K0) steady-state rate equation in which 2 undergoes conversion to 5via convergence of pathways I and II at intermediate 4 (Fig. 8B) gives a good overall correlation, Fig. 9A, including data at low concentrations of [E] and [L], where the dominant process is dissociative (pathway I), see inset to Fig. 9B. A key component in the steady-state analysis for the convergent mechanism I + II is that the dissociative pathway via2 → 3 → 4 can be attenuated by the direct conversion of 4 to 2, (or 6), by [L], which phenomenologically appears to attenuate the saturation limit (k1 = 0.24(±0.08) s−1 in toluene at 5 °C).
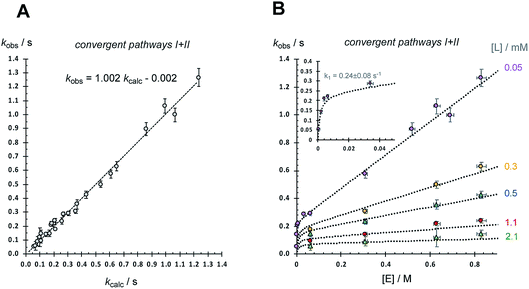 | ||
| Fig. 9 Analysis using steady-state rate equation for convergent mechanism I + II (Fig. 8B) and data from Table 1. kcalc. = x2 {(1 + 7 × 10³ [L] + 6.1[E])/(1.2 × 102 [L]/[E] + 2.7 × 10⁴[L] + 5 × 10⁵ [L]2/E + 4.2)}; see Fig. 8B. (A) Correlation of kobs. with kcalc.; R2 = 0.991. Error bars for kobs are plotted at the greater of 5%/standard deviation (±2σ) (B) Correlations of kobs. with [E] (0.0004 to 0.83 M) at various free ligand L concentrations, as indicated. Error bars are plotted at the greater of 5%/standard deviation (±2σ) for kobs., and ±2.5% for [E]. Dotted lines = kcalc. Inset shows region where pathway (I) dominates. In the calculations, x2 is the mole fraction [2]/[Ru] and [L] = [2] + [L]exog. Both are calculated using a standard quadratic equation for the equilibrium between 1 and 2, based on K0 = 0.001 M; see Fig. 11, eqn (6–8). | ||
Conclusions
The kinetics of the nominally irreversible reaction of the third generation Grubbs catalyst G-III-Br with ethyl vinyl ether (E) in toluene at 5 °C have been re-visited.19 The rapid equilibrium between the bispyridyl form of G-III-Br, 1, and the monopyridyl form, 2, was analysed by 1H NMR titration/dilution, yielding K0 = 0.001 M. The empirical pseudo first-order rate constants (kobs.) for the kinetics of the reaction of G-III-Br (46 μM) with ethyl vinyl ether (E), to generate 5Et, have been determined under anaerobic stopped-flow conditions by the UV-vis spectrophotometric analysis of the decay of the MLCT band at 354 nM. Across the range of concentrations of the exogenous ligand, [L], explored, the speciation of G-III-Br ranges from 33% to 96% 2, based on K0 = 0.001 M. There was no evidence for any significant accumulation of intermediates, decays in [1,2] were clean first-order, and the isosbestic points in the UV-vis spectra were retained.The empirical rate constants obtained (kobs.) were analysed in detail by testing the quality of fit of a series of steady-state approximations. The kinetics correlate with a mechanism where the dissociative and associative pathways converge at the pyridyl-free complex 4 in which the alkene is bound and primed to undergo metathesis with the benzylidene. The analysis (Fig. 8 and 9) requires that complex 4 has a lifetime, and thus kmt < (k−3[L] + k−2), i.e.4, can revert to both 2 and 3, or progress to 5.
The previous analyses of the initiation kinetics for the Grubbs catalysts, and related species, have predominantly, but not exclusively,16,17 been by the application of a steady-state dissociative mechanism (pathway I).13–22 However, our study strongly supports the conclusions of Trzaskowski and Grela20 that both the associative and dissociative pathways are kinetically relevant in the initiation, and thus also propagation, of G-III systems. Indeed, the higher the alkene concentration, the more dominant the associative pathway, Fig. 10. In principle, saturation kinetics can be achieved for G-III-Br at high alkene [E] concentrations and low ligand [L] concentrations, where the steady-state approximation for growth of metathesis product5 eventually reduces to kobs. ≈ kmt (IIa and IIb) or k4 (IIb), accompanied by a change in dominant speciation from 1 and 2 to 4 (or alkene complex 6, Fig. 2). However, even when the ethyl vinyl ether concentration approaches its limiting value (≈10.5 M), such saturation may be unachievable. Nonetheless, using more reactive alkenes, other solvents and other temperatures, it may be feasible to deconvolute the interchange (IIa) from the step-wise (IIb) association–dissociation pathways for G-III-Br.
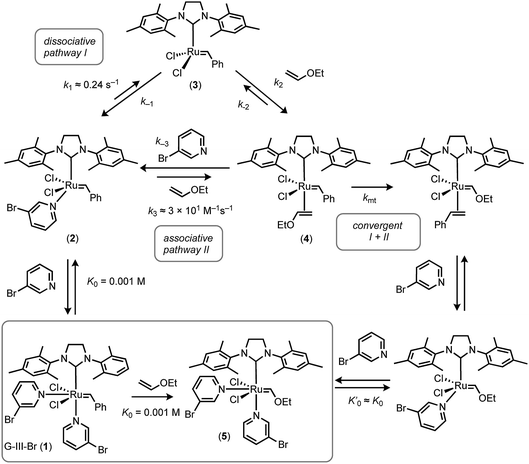 | ||
| Fig. 10 Summary of overall scheme for reaction of G-III-Br with EVE at 5 °C in toluene, and minimal kinetic model for satisfactory simulation (see Fig. 8 and 9). | ||
Also of interest is the increased rate of decay of the UV-vis signal from the MLCT band in 1/2, arising by competing oxidation to yield benzaldehyde; a process that appears to be catalysed by trace-metal contaminants.23† Attempts to deliberately induce this effect met with limited success due to unreproducible kinetics and very transient periods of stability of [1,2] prior to decomposition.24 Nonetheless, the apparent acceleration of benzylidene metathesis by (catalysed) oxidation may account for the previous estimation of the initiation rate19 being more than an order of magnitude greater‡ than that determined herein.
Overall, in the context of optimising the application of the G-III-Br system in catalysis, for a given level of aerobic exposure, conducting reactions at high catalyst and alkene concentrations will favour turnover over oxidative degradation. Moreover, if other alkenes also propagate by the associative pathway, then the selectivity between the competing alkenes may not be a simple linear correlation against their relative concentrations, a factor that may be important in e.g. co-polymerisations.
Experimental
General
All reagents were obtained from Sigma Aldrich. Anhydrous organic solvents were obtained from a solvent purification system (MBraun SPS 800) and dispensed using gas-tight syringes under a positive pressure of nitrogen. The NMR spectra were recorded at 27 °C on a Bruker Ascend 400 spectrometer. The 1H and 13C{1H} spectra were referenced to TMS. The commercial samples of complex 1 (G-III-Br) were found to be of variable quality. For reproducible kinetic data, the complex was prepared from G-II employing the procedure of Grubbs and co-workers.19 Thus, G-II (0.5 g, 0.6 mmol) and 3-bromopyridine (1.1 mL, 11.0 mmol) were added to a 20 mL vial. The vial was capped and the reaction mixture was left stirring for 5 minutes while the color changed from red to bright green. Pentane (20 mL) was layered onto the green solution at room temperature to initiate the precipitation of a green solid. The vial was then capped and left at −20 °C overnight (freezer). The green precipitate was collected by vacuum-filtration and washed with 4 × 10.0 mL of room temperature pentane. After drying the precipitate under vacuum, complex 1 was obtained as a green powder (0.4 g, 80% yield) matching all the reported spectral data.19Kinetic analyses
The stopped-flow UV-vis experiments were carried out with a Hi-Tech Scientific SFA-20 accessory coupled through a thermostatted umbilical to a Hellma Analytics fused-silica flow cell (5.0 ± 0.1 °C, 80 μL volume, with 10/2 mm light paths, and integral mixer), and the outlet connected via the umbilical to a trigger-syringe with microswitch. Within an N2-filled glovebox, stock solutions of G-III-Br (92 mM) and ethyl vinyl ether (0.0008 to 1.66 M; plus 3-bromopyridine 0–4 mM) in toluene were prepared in volumetric glassware, then transferred to 10 mL gas-tight syringes (VWR) coupled to a 1 mm OD Tefzel tube and sealed with a plugged flangeless PTFE nut. Prior to kinetic experiments the system was washed through with large volumes of toluene, and then a background UV-vis spectrum recorded. The reagents were then loaded into the two independent 2.5 mL syringe reservoirs via three-way PTFE valves on the SFA-20 connected to the 10 mL gas tight syringes via flangeless fittings, and using hydraulic overpressure for all liquid transfers, i.e. ‘pushing’ rather than ‘pulling’ solutions. The system was then flushed twice with the stock solutions (5 mL of each, in parallel) to ensure complete purging of toluene, before reloading the reservoirs and conducting a series of 10–25 shots, each comprising 0.1 mL of each stock solution. The shots were initiated by a pneumatic drive at constant 5 bar pressure. The UV spectra were recorded on Ocean-Optics USB4000 and Flame Spectrometers connected via the cuvette holder to a DH2000-BALUV lamp using solarised resistant grade optical fibres. The data collection was timed by the microswitch on the terminus of the trigger syringe transit, sending a stabilised 5V signal to the spectrometer and PC. 200 UV-vis spectra were recorded over 8–80 s, depending on kobs., after a dead-time of approximately 8 ms, with a 284–890 nm spectral window. The UV-vis spectra were analysed with Kinetic Studio software, version 5.02, using singular value decomposition (SVD) and recombination of the first two or three components to filter noise. For G-III, the rates of reaction (kobs.) were obtained by non-linear regression of the exponential decay of the signal (At) at 354 nm, averaged across a 0.6 nm spectral range (3 data points) from A0 to A∞. The data for G-I were obtained analogously, but by non-linear regression of the growth of the signal (At) at 484 nm.Steady-state rate approximations
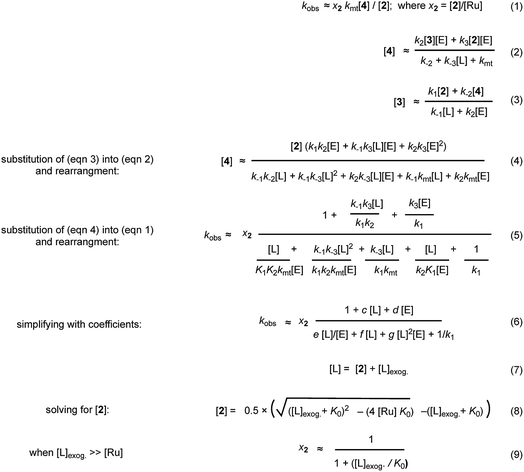
The rate equations for pathway 1, pathway II, and pathways I + II were derived using standard Bodenstein approximations to solve for the mole fraction of pre-metathesis complex 4, as a function of 2, assuming that the ruthenium species 2, accumulating product 5 (in mono and bis-pyridyl forms) and bispyridyl complex 1, are dominant over all other complexes. Fitting of eqn (6) (Fig. 11) against the observed data (Table 1) was conducted by non-linear regression of kcalc. against kobs. using the Excel solver function to minimise the weighted sum square error, SSE = Σ{(kcalc. − kobs.)2/kobs.} with c, d, e, f, g, and k1 as variables. Although the inclusion of g in the fitting gives a marginally better correlation the model is relatively insensitive to g ≤ 5 × 10⁵. A standard quadratic analysis of the mono/bis-pyridyl speciation from rapid equilibrium (K0) between 1 + 5 and 2, as dictated by [Ru]tot and free [L], was used to correct the rates for mole fraction 2 (x2, see eqn (1, 7 and 8), Fig. 11). The speciation for the mono and bis-pyridyl forms of product 5 was assumed to be similar, i.e. , and thus free [L]tot is constant through the reaction.
Conflicts of interest
There are no conflicts to declare.Acknowledgements
The research leading to these results received funding from the European Research Council under the European Union’s Seventh Framework Programme (FP7/2007–2013)/ERC Grant Agreement 340163, the University of Edinburgh (V. F.), and the Swiss National Science Foundation (A.G.D.). We thank Edward J. King (TgK Scientific) for extensive technical advice and assistance.Notes and references
- For a recent review on the advances in ruthenium alkylidene catalysed alkene metathesis, see: O. M. Ogba, N. C. Warner, D. J. O’Leary and R. H. Grubbs, Chem. Soc. Rev., 2018, 47, 4510–4544 RSC.
- M. Jeschek, R. Reuter, T. Heinisch, C. Trindler, J. Klehr, S. Panke and T. R. Ward, Nature, 2018, 537, 661–668 CrossRef PubMed.
- For examples of the use of transition metal catalysed alkene metathesis in industrial settings see: D. Stoianova, A. Johns and R. Pederson, Handbook of Metathesis, ed. R. H. Grubbs and A. G. Wenzel, Wiley-VCH Verlag GmbH & Co. KGaA, 2nd edn, 2015, vol. 1, pp. 699–726 Search PubMed, see also ref. 1.
- For an overview of the mechanistic events in Ru-catalysed metathesis, see: D. J. Nelson, S. Manzini, C. A. Urbina-Blanco and S. P. Nolan, Chem. Commun., 2014, 50, 10355–10375 RSC.
- For an excellent review on the initiation in Ru-catalysed metathesis, see: J. R. Griffiths and S. D. Diver, Handbook of Metathesis, ed. R. H. Grubbs and A. G. Wenzel, Wiley-VCH Verlag GmbH & Co. KGaA, 2nd edn, 2015, vol. 1, pp. 273–303 Search PubMed.
- For an example of circumventing poor initiation rate in polymerisation, see J. C. Foster, S. Varlas, L. D. Blackman, L. A. Arkinstall and R. K. O’Reilly, Angew. Chem., Int. Ed., 2018, 57, 10672–10676 CrossRef CAS PubMed , and references therein.
- For recent examples of inhibition, see: G. A. Bailey, M. Foscato, C. S. Higman, C. S. Day, V. R. Jensen and D. E. Fogg, J. Am. Chem. Soc., 2018, 140, 6931–6944 CrossRef CAS PubMed , and references therein.
- J. S. Kingsbury, J. P. A. Harrity, P. J. Bonitatebus and A. H. Hoveyda, J. Am. Chem. Soc., 1999, 121, 791–799 CrossRef CAS.
- For an example of a ‘boomerang’ system, see: J. M. Bates, J. A. M. Lummiss, G. A. Bailey and D. E. Fogg, ACS Catal., 2014, 4, 2387–2394 CrossRef CAS , and references therein.
- See e.g. J. A. Love, M. S. Sanford, M. W. Day and R. H. Grubbs, J. Am. Chem. Soc., 2003, 125, 10103–10109 CrossRef CAS PubMed.
- Y. Kim, C.-H. Chen and C. Hilty, Chem. Commun., 2018, 54, 4333–4336 RSC.
- Q. T. Easter and S. A. Blum, Angew. Chem., Int. Ed., 2018, 57, 12027–12032 CrossRef CAS PubMed.
- M. S. Sanford, M. Ulman and R. H. Grubbs, J. Am. Chem. Soc., 2001, 123, 749–750 CrossRef CAS PubMed.
- E. L. Dias, S. T. Nguyen and R. H. Grubbs, J. Am. Chem. Soc., 1997, 119, 3887–3897 CrossRef CAS.
- Y. Minenkov, G. Occhipinti and V. R. Jensen, Organometallics, 2013, 32, 2099–2111 CrossRef CAS.
- V. Thiel, M. Hendann, K.-J. Wannowius and H. Plenio, J. Am. Chem. Soc., 2012, 134, 1104–1114 CrossRef CAS PubMed.
- I. W. Ashworth, I. H. Hillier, D. J. Nelson, J. M. Percy and M. A. Vincent, Chem. Commun., 2011, 47, 5428–5430 RSC.
- S. B. Garber, J. S. Kingsbury, B. L. Gray and A. H. Hoveyda, J. Am. Chem. Soc., 2000, 122, 8168–8179 CrossRef CAS.
- J. A. Love, J. P. Morgan, T. M. Trnka and R. H. Grubbs, Angew. Chem., Int. Ed., 2002, 41, 4035–4037 CrossRef CAS PubMed.
- B. Trzaskowski and K. Grela, Organometallics, 2013, 32, 3625–3630 CrossRef CAS.
- D. J. Walsh, S. H. Lau, M. G. Hyatt and D. Guironnet, J. Am. Chem. Soc., 2017, 139, 13644–13647 CrossRef CAS PubMed.
- A. B. Chang, T.-P. Lin, N. B. Thompson, S.-X. Luo, A. L. Liberman-Martin, H.-Y. Chen, B. Lee and R. H. Grubbs, J. Am. Chem. Soc., 2017, 139, 17683–17693 CrossRef CAS PubMed.
- I. Thomé, A. Nijs and C. Bolm, Chem. Soc. Rev., 2012, 41, 979–987 RSC.
- S. Guidone, O. Songis, F. Nahra and C. S. J. Cazin, ACS Catal., 2015, 5, 2697–2701 CrossRef CAS.
Footnotes |
| † There was no impact from the use of glass-bodied syringes with PTFE-tipped plungers versus disposable plastic syringes or versus ground-glass barrel/plunger type syringes. The stainless-steel needles employed for the work are brazed or compression-bonded to a nickel-plated brass Luer-lock hub. The possibility that the 3-Br-pyridine ligand leaches traces of metal from the inside surface of the needle bore (e.g. Ni, Fe, Mn, Cr, Mo) or Luer-lock hub (e.g. Ni, Cu, Zn) is consistent with the observations; there was substantial variability, in terms of impact on the rate of oxidation, between nominally identical needles that were tested. We are currently investigating this phenomenon in more detail, including testing homogeneous solutions of the simple pyridyl complexes of a range of transition metals as catalysts for the aerobic oxidation of G-III-Br. |
| ‡ The original report (see ESI to ref. 19) indicated that on addition of a solution of G-III-Br in toluene to a solution of EVE in toluene in a cuvette at 5 °C, ([Ru]tot = 0.046 mM, EVE 17 mM) the UV signal at 354 nM was quenched in less than 0.5 seconds, leading to a dissociative initiation rate (kinit) of G-III-Br being estimated as >4 s−1. The rate of reaction of G-III-Br with EVE determined by stopped-flow under the same final concentrations ([Ru]tot = 0.046 mM, EVE 17 mM) is 0.14 s−1;Fig. 9; see also Table 1, entry 24; EVE = 20 mM. |
| This journal is © The Royal Society of Chemistry 2019 |

