 Open Access Article
 This Open Access Article is licensed under a
 Creative Commons Attribution 3.0 Unported Licence
Application of novel solid phase extraction-NMR protocols for metabolic profiling of human urine
Daniel
McGill
 *a,
Elena
Chekmeneva
a,
John C.
Lindon
a,
Zoltan
Takats
a and
Jeremy K.
Nicholson
b
*a,
Elena
Chekmeneva
a,
John C.
Lindon
a,
Zoltan
Takats
a and
Jeremy K.
Nicholson
b
aDivision of Computational and Systems Medicine, Department of Surgery and Cancer, Faculty of Medicine, Imperial College London, South Kensington Campus, London SW7 2AZ, UK. E-mail: d.mcgill16@imperial.ac.uk
bThe Australian National Phenome Center, Research and Innovation, Murdoch University, 50, South Street Murdoch, Perth WA6150, Australia
First published on 21st January 2019
Abstract
Metabolite identification and annotation procedures are necessary for the discovery of biomarkers indicative of phenotypes or disease states, but these processes can be bottlenecked by the sheer complexity of biofluids containing thousands of different compounds. Here we describe low-cost novel SPE-NMR protocols utilising different cartridges and conditions, on both natural and artificial urine mixtures, which produce unique retention profiles useful for metabolic profiling. We find that different SPE methods applied to biofluids such as urine can be used to selectively retain metabolites based on compound taxonomy or other key functional groups, reducing peak overlap through concentration and fractionation of unknowns and hence promising greater control over the metabolite annotation/identification process.
Introduction
Structure elucidation is a necessary and complex task for synthetic chemistry, drug discovery, and natural products research, but it is also a major challenge in areas related to the life sciences. Metabolite structure elucidation is considered a bottleneck in metabolic profiling (the study of low molecular weight metabolite patterns in organisms) – metabolites found within biofluids can be identified and described as biomarkers characteristic of specific phenotypes and disease states. For example, Elliott et al.1 were able to characterise the biomarkers of adiposity in US adults through analysis of urine samples. Metabolites representative of different metabolite classes and biochemical pathways (such as N-acetylneuraminate and trimethylamine) were shown to have significant association with BMI. Hence, structure elucidation for metabolic profiling has been demonstrated to indirectly deepen knowledge of metabolic pathways, which may aid the development of future diagnostic and therapeutic techniques. Within metabolic profiling, 1H Nuclear Magnetic Resonance (NMR) spectroscopy has become an extremely valuable tool for the characterisation of complex mixtures;2 statistical spectroscopy tools have also been applied to extract information from complex spectral sets.3 Posma et al.4 have demonstrated the use of statistical 2D NMR, utilising the RED-STORM probabilistic statistical spectroscopy tool on data acquired from diet-controlled human urine samples, in order to further expand the understanding of dietary biomarkers.As such, there is currently a high interest in the identification of metabolites. Urine has found widespread use in metabolic profiling due to its non-invasive ease of collection; however, the human urinary metabolome remains only partially mapped. This is in part because of the sheer number and dynamic range of compounds within a given urine sample – and, as a corollary of this, because of peak overlap that frustrates annotation efforts. In a high-throughput NMR study of human urine, it was found by Bingol et al.5 that in a sample 13C–1H HSQC spectrum, of the 1012 peaks detected, only 437 peaks (belonging to 98 individual metabolites) could be assigned. In 2013, Bouatra et al.6 utilised a variety of analytical platforms (NMR, GC-MS, DFI/LC-MS/MS, ICP-MS, and HPLC) in order to identify 445 and quantify 378 unique urine metabolites, and a literature review led to the identification of an additional 2206 compounds. The Urine Metabolome Database (http://www.urinemetabolome.ca) at the time of writing counts 4237 total metabolites, of which only 1607 are ‘detected and quantified’, 421 are ‘detected but not quantified’, and 2209 are ‘expected but not detected’.
There is a need to expand the understanding of the human urinary metabolome in order to improve our capacity for characterization of population phenotypes and for discovery of biomarkers related to disease and diet. Currently, the two most powerful analytical techniques used for metabolite annotation (the putative identification of metabolites based on spectral similarity to literature or external data) and identification (confirmation of molecular identity based on ‘a minimum of two independent and orthogonal datasets relative to an authentic reference standard’)7 are mass spectrometry (MS) and NMR spectroscopy, as they provide orthogonal qualitative data, as well as absolute and relative quantification, in a very precise and high-throughput manner. In the framework of LC-MS analysis, different column chemistries have been explored to ensure wide metabolome coverage of biofluids, and to take account of the physicochemical diversity of their components. Integration of NMR spectroscopy allows acquisition of complementary information for definitive structure elucidation and confirmation. Despite its reproducibility, ease of use, and quantitative data generation, the limited sensitivity of NMR remains a bottleneck to metabolite identification – low-concentration compounds become indistinguishable from noise, and peak overlap by more concentrated compounds regularly obscures signals from less concentrated compounds.
The use of SPE-NMR of urine has been demonstrated previously by Wilson and Nicholson for retention of specific drug metabolites such as paracetamol, ibuprofen, and naproxen.8 The fractionation of human urine using SPE to reduce NMR peak overlap has also been demonstrated by Yang et al.9 and Jacobs et al.10 using C18 and HLB cartridges, respectively. All previous SPE-NMR experiments have utilised standard or widely available methods using classic reversed phase sorbents, but have not varied or altered conditions such as pH to generate different retention profiles; additionally, the use of ion exchange SPE cartridges on biofluids for the purpose of metabolite annotation has not been attempted before. The expansion of available SPE methods should promise greater control over metabolite retention, and hence greater insight into the human urinary metabolome – this can be done through studying how different SPE methods can retain not only individual metabolites, but entire compound classes. Hence this approach is highly relevant to the detection and characterisation of unknowns in many complex biological mixtures.
Experimental
Sample collection
Urine was collected from 12 healthy volunteers in 500 mL Corning™ tubes pre-rinsed with ultrapure water – each volunteer provided informed consent in writing. Each urine sample was individually analysed using NMR as a check for polyethylene glycol contamination. Samples were pooled into a pre-rinsed polypropylene carboy with a stir bar. The pooled sample was homogenised by stirring for five minutes, after which 15 mL aliquots were dispensed into 20 mL Sterilin sample tubes. Samples were labelled sequentially and stored at −80 °C; samples to be used were subsequently transferred to a 4 °C fridge for thawing.pH-altered urine samples
Concentrated HCl or NaOH solution was added dropwise to 250 mL of pooled urine until the desired pH was achieved. The acidified (pH 2 and pH 5) and basified (pH 11 and pH 9) samples were then stored at 4 °C.Artificial urine preparation
500 mL ultrapure water was added to a 1 L flask. Constituent compounds and salts were then added (see Results section, Table 2) with constant stirring. An additional 500 mL of distilled water was added to make 1 L of artificial urine.SPE methods
All solid phase extraction cartridges obtained had a 6 mL capacity and 500 mg bed weight. C18 cartridges were acquired from Thermofisher (Hypersep™) and Agilent (Bond Elut™). C18-ec, NH2 (Weak Anion eXchange – WAX), CN, and SO3− (Weak Cation eXchange – WCX) cartridges were acquired from Biotage (Isolute™). C8, phenyl, and diol cartridges were acquired from Thermofisher (Hypersep™). Hydrophilic–Lipophilic Balance (HLB) cartridges were acquired from Waters (Oasis™). PhenylBoronic Acid (PBA), Strong Anion eXchange (SAX), and Strong Cation eXchange (SCX) cartridges were acquired from Macherey-Nagel (Chromabond™). Sample pretreatment, conditioning, equilibration, wash, and elution steps were tailored for the cartridge and method. Different methods utilised a variety of pH levels and solvent systems (Table 1). The use of different conditions altered the retention profiles exhibited by the different cartridges, resulting in elutions composed of different metabolites.| Cartridge | Method name | Modification |
|---|---|---|
| C18 | Neutral | No modification |
| Formic acid | 2% formic acid added to conditioning, equilibration, wash, and elution steps | |
| Weakly acidified | Sample acidified to pH 5 | |
| Strongly acidified | Sample acidified to pH 2 | |
| HLB | Neutral | No modification |
| Formic acid | 2% formic acid added to conditioning, equilibration, wash, and elution steps | |
| Weakly acidified | Sample acidified to pH 5 | |
| Strongly acidified | Sample acidified to pH 2 | |
| Phenyl | Neutral | No modification |
| Formic acid | 2% formic acid added to conditioning, equilibration, wash, and elution steps | |
| Weakly acidified | Sample acidified to pH 5 | |
| Strongly acidified | Sample acidified to pH 2 | |
| SCX | Neutral | No modification |
| Formic acid | 2% formic acid added to conditioning and equilibration steps | |
| Weakly acidified | Sample acidified to pH 5 | |
| Strongly acidified | Sample acidified to pH 2 | |
| SAX | Neutral | No modification |
| Formic acid | 2% formic acid added to conditioning and equilibration steps | |
| Weakly basified | Sample basified to pH 9 | |
| Strongly basified | Sample basified to pH 11 | |
| PBA | Glycine buffer | Glycine-based buffer |
| Phosphate buffer | Sodium phosphate-based buffer |
![[thin space (1/6-em)]](https://www.rsc.org/images/entities/char_2009.gif) :30 water:acetonitrile (6 mL), then equilibrated with sodium phosphate buffer basified to pH 10 with sodium hydroxide (6 mL). Pooled urine (3 mL) was loaded onto the cartridge, which was then washed with sodium phosphate buffer basified to pH 8.5 with sodium hydroxide (6 mL). Water (6 mL) was used to elute the first set of metabolites, followed by a solution of 1% HCl in 70:30 water:acetonitrile (6 mL) for the second elution.
:30 water:acetonitrile (6 mL), then equilibrated with sodium phosphate buffer basified to pH 10 with sodium hydroxide (6 mL). Pooled urine (3 mL) was loaded onto the cartridge, which was then washed with sodium phosphate buffer basified to pH 8.5 with sodium hydroxide (6 mL). Water (6 mL) was used to elute the first set of metabolites, followed by a solution of 1% HCl in 70:30 water:acetonitrile (6 mL) for the second elution.
NMR sample preparation
Washes and elutions were dried under nitrogen and reconstituted in ultrapure water (3 mL). Buffer containing trimethylsilylpropionate (TMS) as an internal reference standard was added to 540 μL of reconstituted sample, as described by Dona et al.11 580 μL of the manually vortexed sample was then transferred into 5 mm SampleJet NMR racks.Samples which required additional 2D NMR experiments were dried under nitrogen and reconstituted in D2O (3 mL). TMS phosphate buffer (60 μL) was added to 540 μL of reconstituted sample, and 580 μL of the resulting manually vortexed sample was transferred into 5 mm NMR tubes.
NMR data acquisition
All 1D experiments were run using a Bruker Avance III 600 MHz spectrometer equipped with SampleJet. Samples were analysed using one-dimensional water-suppressed 1H NOESY experiments at 300 K.Additional 1H–1H J-resolved experiments, and 2D-NMR experiments, including 1H–1H Total Correlation Spectroscopy (TOCSY), 1H–1H Correlation Spectroscopy (COSY), and 1H–13C Heteronuclear Single Quantum Coherence spectroscopy (HSQC), were utilised for metabolite annotation. The data from the 2D NMR experiments was acquired using a Bruker Avance III 600 MHz spectrometer equipped with a cryoprobe.
Data analysis
NMR datasets were imported into MatLab using the Imperial Metabolic Profiling and Chemometrics Toolbox (IMPaCTS).12 Water (4.26–5.50 ppm) and formate (8.25–8.63 ppm) regions were removed from the spectra to eliminate interferences; the spectra were then normalised against the TSP region (−0.5 to 0.5 ppm) using a probabilistic quotient normalisation function.13 Principal Component Analysis (PCA) plots were subsequently constructed with 5 principal components.Results
Different cartridge chemistries were utilised in order to produce unique retention profiles for different compound classes (as demonstrated in Fig. 1). All samples utilised a sample load incorporating 3 mL of urine as a compromise between substrate retention capacity and spectral resolution. Each elution demonstrated differing retention profiles for each method – replicates of the same method, however, had little difference between spectra. Hence the reproducibility of the SPE methods outlined here can be guaranteed.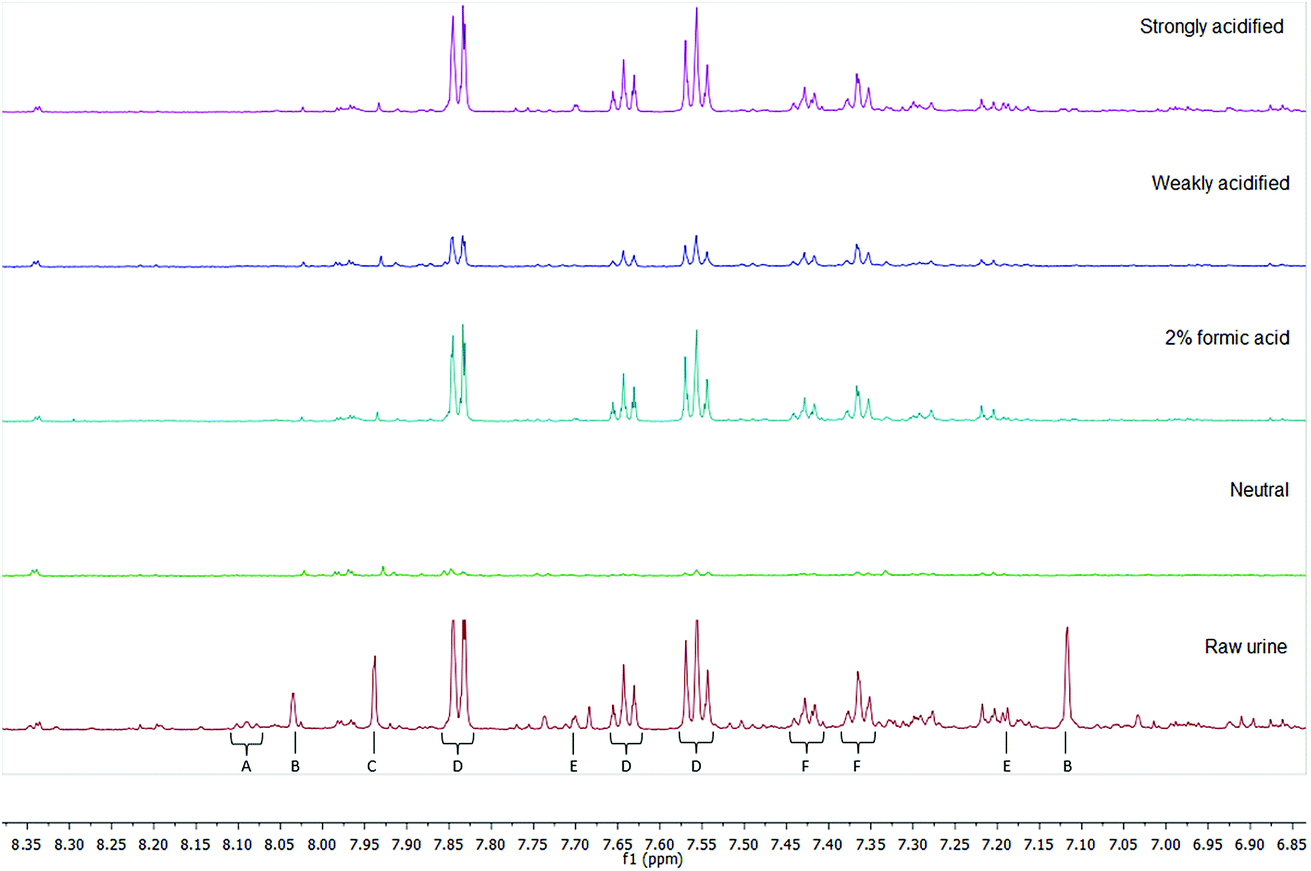 | ||
| Fig. 1 A comparison of the aromatic regions of 600 MHz NMR spectra utilising different C18 SPE methods on natural human urine. From top: sample acidified to pH 2, sample acidified to pH 5, 2% formic acid added to all steps, neutral sample, and pooled urine before SPE treatment. Select metabolites labelled: (A) trigonelline, (B) 3-methylhistidine, (C) histidine, (D) hippurate, (E) 2-furoylglycine, and (F) phenylalanine. | ||
Key molecules
Quantifying the extent of retention of different classes of compound can be done using molecules representative of a chemical class. In the Human Urine Metabolome database,14 chemicals are assigned taxonomically – first to classes, then to subclasses – using the ChemOnt automated taxonomy. As the taxonomy is automated, its class structure can be utilised in order to demonstrate retention profiles for given methods.Two separate lists of metabolites were utilised to generate a list of representative compounds. One set of metabolites was examined and ranked according to their frequency of occurrence in the human urinary metabolome,6 such that the metabolites being examined would have a significant chance of being characterised in pooled urine samples. The second set was generated from a method for producing artificial urine.15 The two lists were combined, and the resulting set of metabolites (Table 2) was then characterised by their assigned subclass from the ChemOnt automated taxonomy.
| Name | Occurrence in urine (%)6 | Assigned subclass (HMDB) |
|---|---|---|
| trans-Aconitic acid | 55 | Tricarboxylic acids and derivatives |
| Tartaric acid | 82 | Carbohydrates and carbohydrate conjugates |
| Succinic acid | 91 | Dicarboxylic acids and derivatives |
| L-Asparagine | 95 | Asparagine and derivatives |
| L-Aspartic acid | 95 | Aspartic acid and derivatives |
| 2-Furoylglycine | 100 | N-Acyl-alpha amino acids |
| 3-Aminoisobutanoic acid | 100 | Beta amino acids and derivatives |
| 3-Methylhistidine | 100 | Histidine and derivatives |
| Acetic acid | 100 | Carboxylic acids |
| Allantoin | 100 | Imidazoles |
| Betaine | 100 | Alpha amino acids and derivatives |
| Citric acid | 100 | Tricarboxylic acids and derivatives |
| Creatine | 100 | Alpha amino acids and derivatives |
| Creatinine | 100 | Alpha amino acids and derivatives |
| D-Glucose | 100 | Carbohydrates and carbohydrate conjugates |
| Dimethyl sulfone | 100 | Sulfones |
| Dimethylamine | 100 | Organonitrogen compounds |
| Erythritol | 100 | Carbohydrates and carbohydrate conjugates |
| Ethanolamine | 100 | Amines |
| Formic acid | 100 | Carboxylic acids |
| Glycerol | 100 | Carbohydrates and carbohydrate conjugates |
| Glycine | 100 | Alpha amino acids and derivatives |
| Glycolic acid | 100 | Alpha hydroxy acids and derivatives |
| Guanidoacetic acid | 100 | Alpha amino acids and derivatives |
| Hippuric acid | 100 | Benzoic acids and derivatives |
| Indoxyl sulfate | 100 | Arylsulfates |
| L-Alanine | 100 | Alanine and derivatives |
| L-Cysteine | 100 | Cysteine and derivatives |
| L-Cystine | 100 | L-Cysteine-S-conjugates |
| L-Glutamic acid | 100 | Glutamic acid and derivatives |
| L-Glutamine | 100 | Alpha amino acids and derivatives |
| L-Histidine | 100 | Histidine and derivatives |
| L-Lactic acid | 100 | Alpha hydroxy acids and derivatives |
| L-Lysine | 100 | Alpha amino acids and derivatives |
| L-Phenylalanine | 100 | Phenylalanine and derivatives |
| L-Serine | 100 | Serine and derivatives |
| L-Threonine | 100 | Alpha amino acids and derivatives |
| Methanol | 100 | Alcohols and polyols |
| Myoinositol | 100 | Alcohols and polyols |
| p-Hydroxyphenylacetic acid | 100 | Phenols |
| Propylene glycol | 100 | Alcohols and polyols |
| Taurine | 100 | Organosulfonic acids and derivatives |
| Trigonelline | 100 | Alkaloids and derivatives |
| Trimethylamine N-oxide | 100 | Aminoxides |
The intensities of specific peaks corresponding to these metabolites in the elutions were compared to the intensities of the same peaks in the raw pooled urine samples. From this, the percentage retention per compound class could be estimated – hence, insight into which methods can selectively retain different compound classes can be achieved. For example, the peak intensity of retained creatinine (belonging to the subclass ‘alpha amino acids and derivatives’) from a method utilising a C18 cartridge at neutral conditions was measured at 257. When compared to the intensity of the same peak in the ‘raw’ urine sample (5027), this gives an estimated retention capacity of creatinine using this method of 5%. After accounting for the other members of that subclass, C18 under neutral conditions has an overall retention of α-amino acids and derivatives of 0.75%.
The compound class retentions per method were then summed to produce a measure of the total retention capacity out of 100 – where methods ranking 0 would retain nothing, while methods ranking 100 would retain everything (Table 3). It can be expected that the sum of the retention capacity estimates of the elutions and the washes for a given method is equal to 100.
| SPE method | Total retention capacity (%) |
|---|---|
| C18, neutral conditions | 4.57 |
| C18, 2% formic acid | 12.91 |
| C18, weakly acidified sample | 10.65 |
| C18, strongly acidified sample | 15.69 |
| HLB, neutral conditions | 8.87 |
| HLB, 2% formic acid | 17.40 |
| HLB, weakly acidified sample | 13.77 |
| HLB, strongly acidified sample | 22.13 |
| Phenyl, neutral conditions | 1.68 |
| Phenyl, 2% formic acid | 2.05 |
| Phenyl, weakly acidified sample | 3.41 |
| Phenyl, strongly acidified sample | 5.67 |
| SCX, neutral conditions | 0 |
| SCX, 2% formic acid | 0 |
| SCX, weakly acidified sample | 2.57 |
| SCX, strongly acidified sample | 14.67 |
| SAX, neutral conditions | 12.11 |
| SAX, 2% formic acid | 5.28 |
| SAX, weakly basified sample | 2.24 |
| SAX, strongly basified sample | 0.35 |
| PBA, phosphate buffer | 0.93 |
Principal component analysis (PCA)
An alternative approach to quantifying the retention profiles of each SPE cartridge can be achieved using PCA. PCA is an analytical method that can be used to reduce the dimensionality of data and produce visual representations of correlations between datasets – for NMR spectra, it allows for clustering and trends between experiments to be demonstrated, as well as for discovering potential outliers.A PCA structure built with the datasets from all elution methods utilising natural urine demonstrated that the elutions from acidified ion exchange methods were clearly separated from the other chemistries (Fig. 2). The below table (Table 4) lists the NMR signals visible in the PCA loadings plot, as well as their correlation coefficient and their tentative assignment – all assignments are made with comparison to the reported values in the literature, and hence can be considered annotated to a level 2 standard.16 It demonstrates that a small number of peaks (creatinine, histidine, creatine, trimethylamine-N-oxide, and 3-methylhistidine being the most prominent) contributed to 69.24% of the differences between elutions. These metabolites were all retained by SCX cartridges under acidic conditions, and their spectral peaks are sensitive to pH changes, causing significant chemical shifts even in buffered samples.
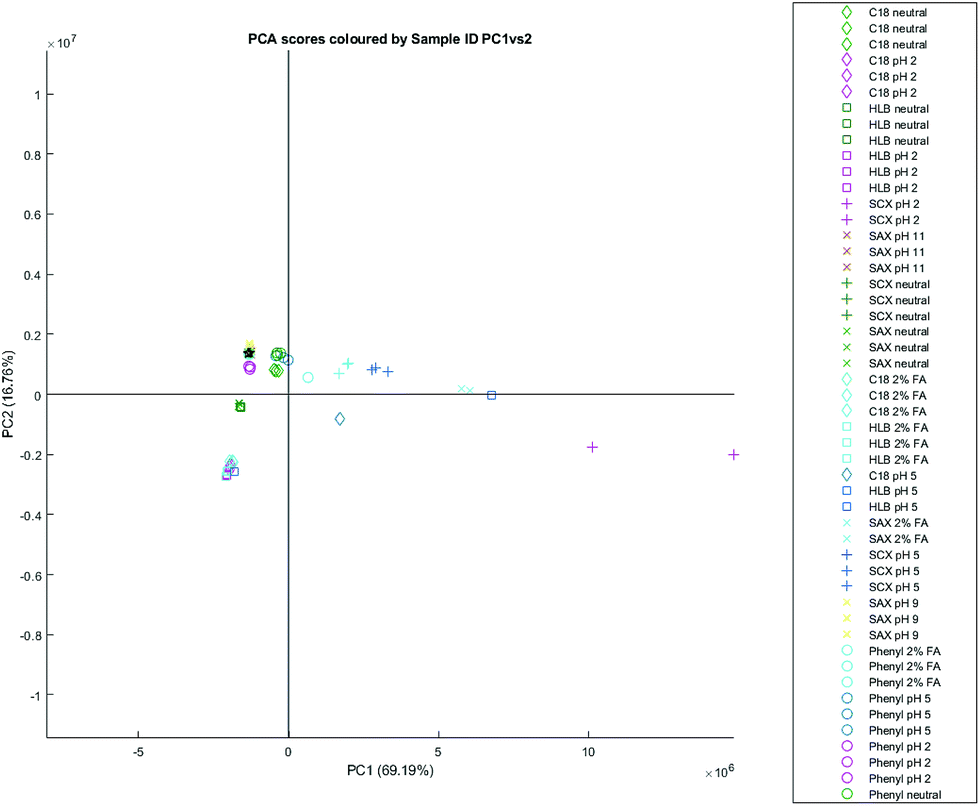 | ||
| Fig. 2 A PCA scores plot based on all SPE elutions of natural urine, PC1 (69.19%) vs. PC2 (16.76%). | ||
| Peak (ppm) | Assignment | Pearson’s correlation |
|---|---|---|
| 7.96 (s) | 3-Methylhistidine | 0.64 |
| 7.90 (s) | Histidine | 0.89 |
| 7.70 (s) | 1-Methylhistidine | 0.81 |
| 7.10 (s) | Histidine | 0.95 |
| 7.08 (s) | 3-Methylhistidine | 0.90 |
| 7.02 (s) | 1-Methylhistidine | 0.92 |
| 4.06 (s) | Creatinine | 1.00 |
| 4.05 (d) | Unknown A | 0.79 |
| 4.00 (dd) | Histidine | 0.90 |
| 3.72 (s) | 3-Methylhistidine | 0.89 |
| 3.70 (s) | 3-Methylhistidine | 0.80 |
| 3.29 (s) | Unknown B | 0.93 |
| 3.27 (s) | TMAO | 0.96 |
| 3.25 (s) | Unknown B | 0.94 |
| 3.24 (s?) | Unknown C | 0.94 |
| 3.23 (d?) | Unknown D | 0.95 |
| 3.21 (s) | Unknown E | 0.84 |
| 3.18 (s) | Unknown F | 0.87 |
| 3.16 (s) | Unknown G | 0.93 |
| 3.14 (s) | Unknown H | 0.89 |
| 3.05 (s) | Creatinine | 0.99 |
| 3.04 (s) | Creatine | 0.83 |
Unknowns in bold have both 1H and 13C signals identifiable, but could not be matched to compounds in metabolite databases.
The ion exchange method most separated from other datasets is the one which produces elutions from strongly acidified urine using an SCX cartridge. However, there is also significant differentiation with the SAX elutions with 2% formic acid – under these conditions, the SAX cartridge begins to retain compounds like creatinine and histidine where it otherwise wouldn’t under neutral or basic conditions. It is not clear why the SAX retention profile would begin to resemble that of SCX; one possibility could be that the silanol groups from the silica on which the SO3− and ammonium modifications are based are more able to retain these compounds under acidic conditions. However, silanols are usually protonated under acidic conditions, and hence would not express this ionic character; the explanation additionally doesn’t account for why C18 with 2% formic acid – which, similarly, contains silanol groups – does not retain creatinine or histidine.
Besides the separation between ion exchange and reversed phase methods, there is additional separation along the secondary principal component axis between phenyl, C18 neutral, SAX neutral, and SCX neutral elutions, and C18 acidified and HLB acidified elutions – with HLB neutral elutions found in between the two clusters (Fig. 3). Removing elutions from ion exchange cartridges and reconstructing the PCA affords a similar differentiation with more clarity. The clusters suggest that C18 neutral elutions have more in common with phenyl elutions than with acidified C18 or even HLB neutral elutions. The NMR signals responsible for the separation between reversed phase elutions are tabulated in Table 5 – it also notes whether the annotated metabolites or unknowns are positively correlated with phenyl cartridges (and hence retained by phenyl), or are negatively correlated (and hence retained by C18/HLB). Signals marked with an asterisk * are not visible in the loadings plot, but can be observed with manual inspection of the spectra.
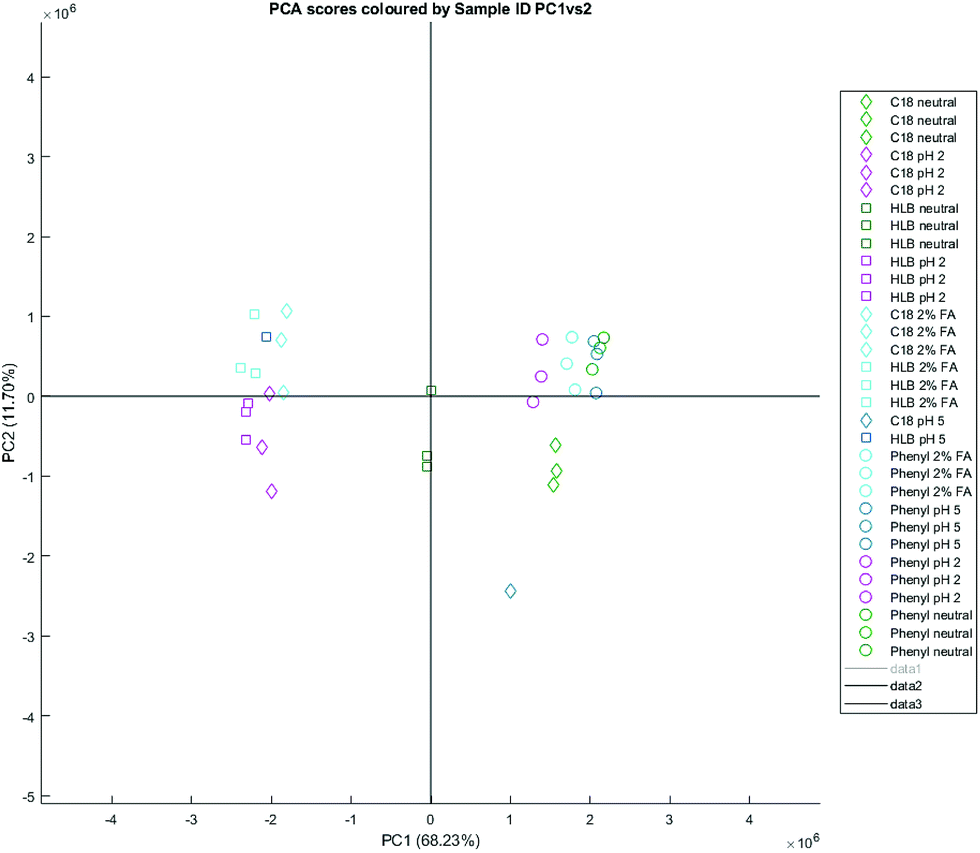 | ||
| Fig. 3 A PCA scores plot based on reversed phase SPE elutions of natural urine, PC1 (68.23%) vs. PC2 (16.76%). | ||
| Peak (ppm) | Assignment | Pearson’s correlation | Phenyl correlation |
|---|---|---|---|
| 9.13 (s) | Trigonelline | 0.78 | Positive |
| 8.84 (t) | Trigonelline | 0.77 | Positive |
| [8.45 (d)] | Quinolinate | * | Negative |
| [8.34 (d)] | N-Methyl-2-pyridone-5-carboxamide | * | Negative |
| 8.09 (t) | Trigonelline | 0.76 | Positive |
| 8.03 (s) | 3-Methylxanthine | 0.84 | Negative |
| 8.00 (s) | Phenylacetyl-glutamine17 | 0.91 | Negative |
| 7.97 (dd) | N-Methyl-2-pyridone-5-carboxamide | 0.98 | Negative |
| 7.94 (s) | Unknown I | 0.77 | Negative |
| 7.91 (d?) | Unknown J | 0.93 | Negative |
| 7.87 (d) | Unknown K | 0.90 | Negative |
| 7.84 (dd) | Hippurate | 0.98 | Negative |
| 7.77 (d?) | 4-Hydroxyhippurate? | 0.92 | Negative |
| 7.70 (dd) | 2-Furoylglycine | 0.92 | Negative |
| 7.64 (tt) | Hippurate | 0.98 | Negative |
| 7.56 (t) | Hippurate | 0.99 | Negative |
| 7.46 (dd) | Quinolate | 0.93 | Negative |
| 7.43 (m) | Phenylacetyl-glutamine | 0.97 | Negative |
| 7.37 (m) | Phenylacetyl-glutamine | 0.97 | Negative |
| 7.30 (t?) | Unknown L | 0.97 | Negative |
| 7.24 (d) | Unknown M | 0.96 | |
| 7.19 (d) | 2-Furoylglycine | 0.92 | Negative |
| 7.17 (d) | 4-Hydroxyphenyl-acetate | 0.94 | Negative |
| 7.12 (ddd) | Unknown N | 0.96 | Negative |
| 7.07 (m) | Unknown O | 0.98 | Negative |
| 6.98 (d) | 4-Hydroxyhippurate? | 0.94 | Negative |
| 6.93 (t) | Unknown P | 0.89 | Negative |
| 6.87 (d) | 4-Hydroxyphenyl-acetate | 0.95 | Negative |
| 6.68 (d) | N-Methyl-2-pyridone-5-carboxamide | 0.97 | Negative |
| 6.64 (dd) | 2-Furoylglycine | 0.86 | Negative |
| 4.19 (td) | Phenylacetyl-glutamine | 0.98 | Negative |
| 4.06 (s) | Creatinine | 0.55 | Positive |
| 4.01 (dd) | Phenylalanine | 0.86 | Negative |
| 3.97 (d) | Hippurate | 0.98 | Negative |
| 3.96 (s) | 4-Hydroxyhippurate? | 0.97 | Negative |
| 3.94 (s?) | Unknown Q | 0.99 | Negative |
| 3.93 (s) | (2-Furoylglycine) | 0.93 | Negative |
| 3.92 (s?) | Unknown R | 0.96 | Negative |
| 3.87 (s/t?) | Unknown S | 0.96 | Negative |
| 3.70 (s) | Unknown T | 0.96 | Negative |
| 3.67 (d) | Unknown U | 0.97 | Negative |
| 3.65 (s) | N-Methyl-2-pyridone-5-carboxamide | 0.98 | Negative |
| 3.63 (s) | Unknown T | 0.98 | Negative |
| 3.54 (s) | Unknown V | 0.92 | Negative |
| 3.53 (s) | Unknown W | 0.99 | Negative |
| 3.49 (s) | Unknown X | 0.88 | Negative |
| 3.48 (s) | Unknown Y | 0.96 | Negative |
| 3.45 (s) | Unknown Z | 0.98 | Negative |
| 3.34 (s) | Unknown AA | 0.96 | Negative |
| 3.32 (s) | Unknown AB | 0.96 | Negative |
| 3.30 (s) | Unknown AC | 0.97 | Negative |
| 3.27 (s) | Unknown AD | 0.67 | Positive |
| 3.17 (s) | Unknown AE | 0.98 | Negative |
| 3.11 (s) | Unknown AF | 0.79 | Positive |
| 3.05 (s) | Creatinine | 0.55 | Positive |
| 3.00 (s) | Unknown AG | 0.91 | Negative |
| 2.71 (s?) | Unknown AH | 0.93 | Negative |
| 2.69 (s?) | Unknown AI | 0.87 | Negative |
| 2.68 (s?) | Unknown AJ | 0.89 | Negative |
| 2.67 (s?) | Unknown AK | 0.88 | Negative |
| 2.63 (d) | Unknown T | 0.92 | Negative |
| 2.35 (s) | Unknown AL | 0.78 | Negative |
| 2.27 (t?) | Phenylacetyl-glutamine | 0.98 | Negative |
| 2.12 (m?) | Phenylacetyl-glutamine | 0.98 | Negative |
| 1.93 (m?) | Phenylacetyl-glutamine | 0.98 | Negative |
| 1.31 (m) | Valerate | 0.82 | Negative |
| 0.94 (m?) | Unknown AM | 0.92 | Negative |
| 0.89 (t) | Valerate | 0.92 | Negative |
Clustering can be observed forming an almost linear scale for C18 and HLB cartridges (Fig. 4) – with C18 neutral elutions at one end, acidified elutions at the other, and HLB neutral elutions in between. Many of the assigned peaks (Table 6) in the aromatic region are caused by differences in chemical shift between identical compounds (likely due to pH differences) – for example, N-methyl-2-pyridone-5-carboxamide (2PY) is significantly correlated both positively and negatively with phenyl elutions (Fig. 5), as its spectral peaks undergo chemical shifting due to pH differences in different experiments.
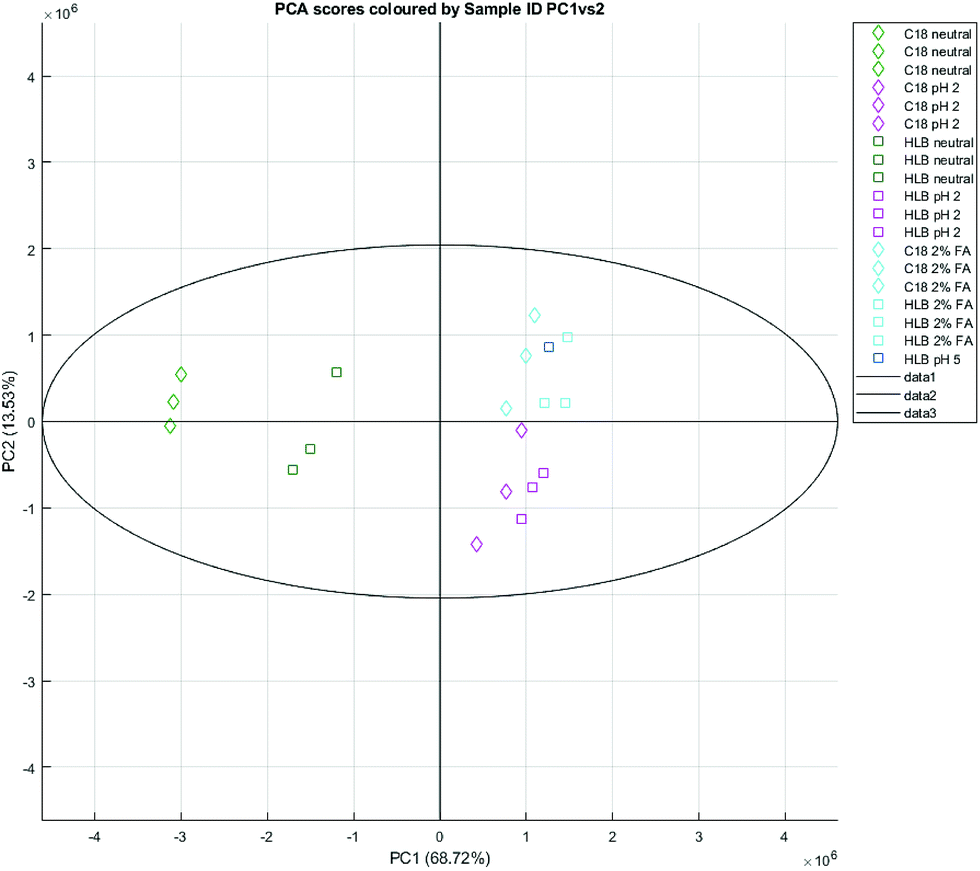 | ||
| Fig. 4 A PCA scores plot based on C18 and HLB SPE elutions of natural urine, PC1 (68.72%) vs. PC2 (13.53%). | ||
 | ||
| Fig. 5 The PC1 loadings plot for C18/HLB elutions, demonstrating both positive and negative correlation of 2PY. | ||
| Peak (ppm) | Assignment | Pearson’s correlation | HLB correlation |
|---|---|---|---|
| 8.05 (m?) | Unknown AN | 0.87 | Positive |
| 7.97 (br s?) | Unknown AO | 0.91 | Positive |
| 7.97 (dd) | N-Methyl-2-pyridone-5-carboxamide | 0.91 | Negative |
| 7.96 (dd) | N-Methyl-2-pyridone-5-carboxamide | 0.96 | Positive |
| 7.94 (s) | Unknown I | 0.70 | Positive |
| 7.93 (s) | Unknown AP | 0.83 | Negative |
| 7.92 (s) | Unknown AQ | 0.82 | Negative |
| 7.91 (s) | Unknown AR | 0.91 | Positive |
| 7.91 (s) | Unknown AS | 0.61 | Negative |
| 7.90 (s) | Unknown AT | 0.84 | Positive |
| 7.87 (d) | Unknown K | 0.83 | Positive |
| 7.84 (dd) | Hippurate | 0.91 | Positive |
| 7.76 (d?) | 4-Hydroxyhippurate? | 0.88 | Positive |
| 7.70 (dd) | 2-Furoylglycine | 0.81 | Positive |
| 7.64 (tt) | Hippurate | 0.99 | Positive |
| 7.56 (t) | Hippurate | 0.99 | Positive |
| 7.43 (m) | Phenylalanine | 0.95 | Positive |
| 7.37 (m) | Phenylalanine | 0.95 | Positive |
| 7.31 (s) | Unknown AU | 0.83 | Positive |
| 7.30 (t) | Unknown L | 0.92 | Positive |
| 7.19 (d) | 2-Furoylglycine | 0.80 | Positive |
| 7.17 (d) | 4-Hydroxyphenyl-acetate | 0.85 | Positive |
| 7.12 (ddd) | Unknown N | 0.96 | Positive |
| 6.98 (d) | 4-Hydroxyhippurate? | 0.85 | Positive |
| 6.87 (d) | 4-Hydroxyphenyl-acetate | 0.90 | Positive |
| 6.81 (s/t?) | Unknown AV | 0.92 | Positive |
| 6.68 (d) | N-Methyl-2-pyridone-5-carboxamide | 0.92 | Positive |
| 6.67 (d) | N-Methyl-2-pyridone-5-carboxamide | 0.91 | Negative |
| 4.19 (td) | Phenylacetylglutamine | 0.96 | Positive |
| 4.06 (s) | Creatinine | 0.80 | Negative |
| 3.97 (d) | Hippurate | 0.99 | Positive |
| 3.96 (s) | Unknown AW | 0.94 | Positive |
| 3.94 (d?) | Unknown AX | 0.92 | Negative |
| 3.93 (d?) | Unknown AY | 0.95 | Positive |
| 3.93 (s) | Unknown AZ | 0.88 | Positive |
| 3.87 (s/t?) | Unknown T | 0.98 | Positive |
| 3.70 (s) | Unknown BA | 0.98 | Positive |
| 3.67 (d?) | Unknown BB | 0.95 | Positive |
| 3.65 (s) | N-Methyl-2-pyridone-5-carboxamide | 0.92 | Negative |
| 3.65 (s) | N-Methyl-2-pyridone-5-carboxamide | 0.97 | Positive |
| 3.63 (s) | Unknown T | 0.97 | Positive |
| 3.53 (s) | Unknown BC | 0.79 | Negative |
| 3.53 (s) | 3-Methylxanthine? | 0.95 | Positive |
| 3.49 (s) | Unknown BD | 0.81 | Negative |
| 3.49 (s) | Unknown BE | 0.84 | Positive |
| 3.48 (s) | Unknown BF | 0.90 | Positive |
| 3.46 (s) | Unknown BG | 0.93 | Positive |
| 3.45 (s) | Unknown BH | 0.88 | Positive |
| 3.36 (s) | Unknown BI | 0.87 | Negative |
| 3.35 (s?) | Unknown BJ | 0.86 | Negative |
| 3.34 (s?) | Unknown BK | 0.95 | Positive |
| 3.33 (s?) | Unknown BL | 0.83 | Negative |
| 3.32 (s?) | Unknown BM | 0.93 | Positive |
| 3.30 (s?) | Unknown BN | 0.96 | Positive |
| 3.27 (s) | TMAO | 0.80 | Negative |
| 3.17 (s) | Unknown BO | 0.88 | Negative |
| 3.17 (s) | Unknown BP | 0.95 | Positive |
| 3.05 (s) | Creatinine | 0.80 | Negative |
| 2.27 (t) | Phenylacetyl-glutamine | 0.97 | Positive |
| 2.12 (m) | Phenylacetyl-glutamine | 0.97 | Positive |
| 0.93 (m) | Phenylacetyl-glutamine | 0.97 | Positive |
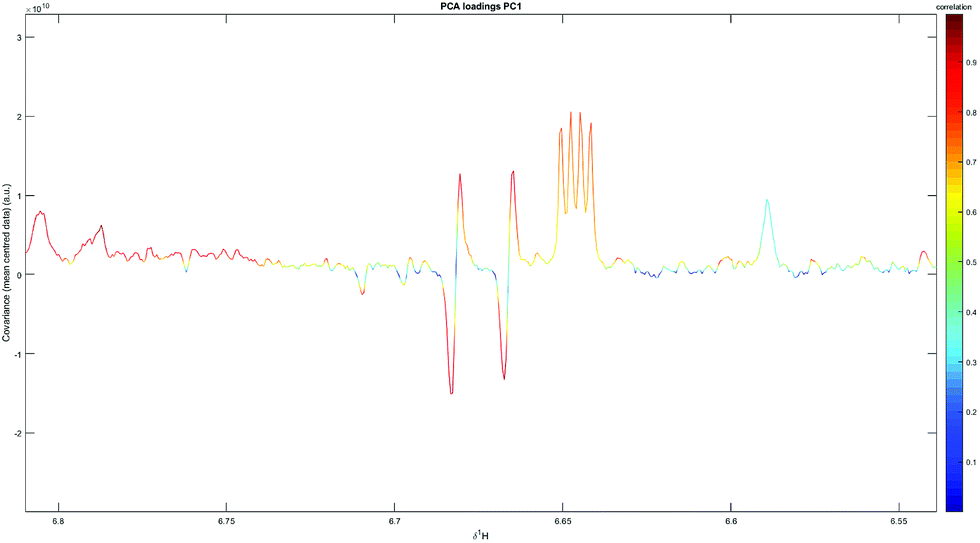
The PC3 vs. PC4 plot in the all-elutions structure also demonstrated clustering (Fig. 6) of the PBA elutions, positively correlated with the PC4 dimension. The PC4 loadings hence closely resemble the averaged spectra from the PBA elutions – the metabolites (Table 7) being mostly represented by mannitol and N-methylnicotinamide.
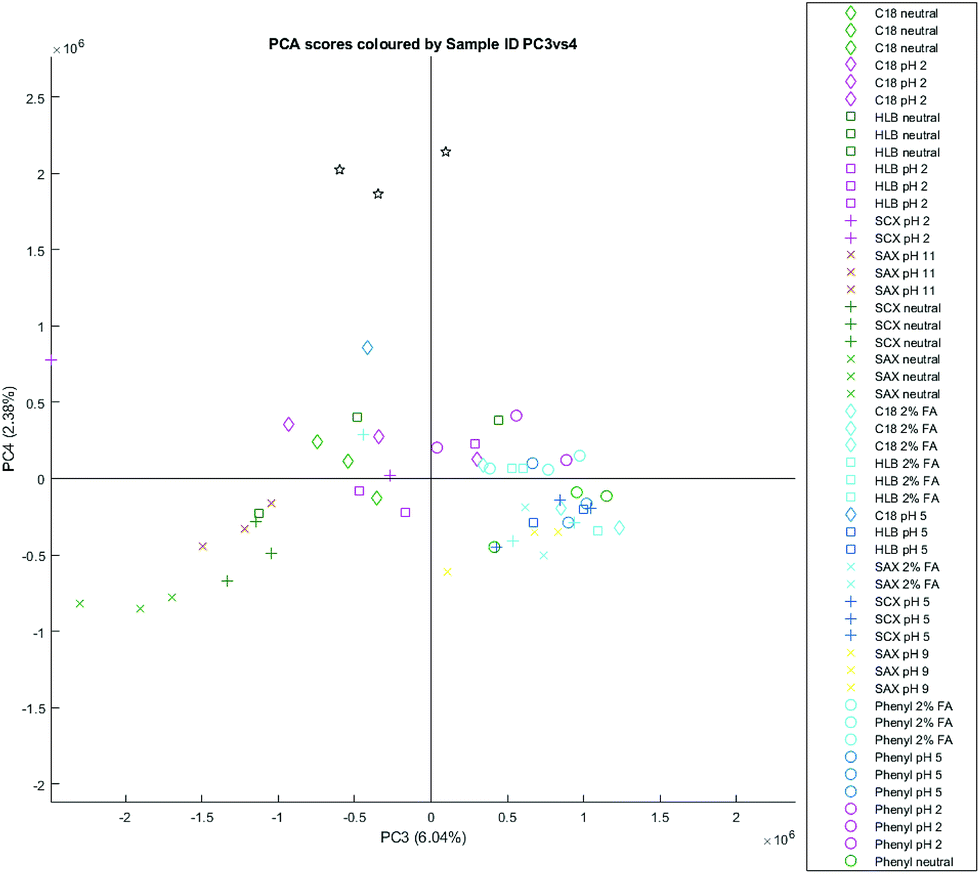 | ||
| Fig. 6 A PCA scores plot based all SPE elutions of natural urine, PC3 (6.04%) vs. PC4 (2.38%). | ||
| Peak (ppm) | Assignment | Pearson’s correlation |
|---|---|---|
| 9.29 (s) | N-Methylnicotinamide | 0.82 |
| 8.97 (d) | N-Methylnicotinamide | 0.72 |
| 8.90 (d) | N-Methylnicotinamide | 0.71 |
| 8.79 (d) | Unknown BQ | 0.69 |
| [8.53 (t)] | Unknown BQ | * |
| 8.06 (t?) | Unknown BQ | 0.63 |
| 7.68 (s) | Unknown BR | 0.88 |
| 5.85 (d) | Unknown BS | 0.49 |
| [4.31 (t)] | Unknown BS | * |
| 4.16 (t) | Unknown BS | 0.53 |
| 4.11 (s) | Unknown BT | 0.68 |
| 4.02 (t) | Unknown BU | 0.73 |
| 3.89 (d) | Mannitol | 0.86 |
| 3.87 (d) | Mannitol | 0.87 |
| 3.82 (s) | Mannitol | 0.86 |
| 3.80 (s) | Mannitol | 0.84 |
| 3.77 (m) | Mannitol | 0.87 |
| 3.67 (d?) | Unknown BV | 0.87 |
| 3.69 (dd) | Mannitol | 0.86 |
| 3.20 (s) | Unknown BW | 0.79 |
| 2.76 (t) | Ethanolamine? | 0.76 |
| 2.72 (s) | DMA | 0.85 |
| 2.01 (s) | Acetamide? | 0.82 |
Artificial urine
A similar PCA can be constructed for reversed phase elutions utilising artificial urine – again, there is separation across the first component, demonstrating a notable difference between phenyl and C18/HLB retention profiles. As with the natural urine elutions, the loadings (Table 8) can be annotated to demonstrate the most important spectral differences separating different methods.| Peak (ppm) | Assignment | Pearson’s correlation | Phenyl correlation |
|---|---|---|---|
| 9.13 (s) | Trigonelline | 0.95 | Positive |
| 8.84 (t) | Trigonelline | 0.97 | Positive |
| 8.09 (t) | Trigonelline | 0.92 | Positive |
| 7.97 (d) | Hippurate | 0.97 | Negative |
| 7.88 (m) | Benzoate | 1.00 | Negative |
| 7.84 (dt) | Hippurate | 1.00 | Negative |
| 7.78 (t) | Hippurate | 0.97 | Negative |
| 7.70 (t) | Hippurate | 0.97 | Negative |
| 7.64 (tt) | Hippurate | 1.00 | Negative |
| 7.56 (m) | Hippurate | 1.00 | Negative |
| 7.49 (m) | Benzoate | 1.00 | Negative |
| 7.44 (tt) | Phenylalanine | 0.99 | Negative |
| 7.38 (tt) | Phenylalanine | 0.99 | Negative |
| 7.34 (m) | Phenylalanine | 0.99 | Negative |
| 7.17 (dt) | 4-Hydroxyphenyl-acetate | 0.93 | Negative |
| 6.87 (dt) | 4-Hydroxyphenyl-acetate | 0.93 | Negative |
| 6.59 (s) | trans-Aconitate | 0.85 | Negative |
| 4.00 (q) | Phenylalanine | 0.96 | Negative |
| 3.97 (d) | Hippurate | 0.99 | Negative |
| 3.30 (d) | Phenylalanine? | 0.97 | Negative |
| 3.27 (s) | TMAO | 0.91 | Positive |
| 3.13 (m) | Phenylalanine? | 0.99 | Negative |
| 3.05 (s) | Creatine? | 0.93 | Positive |
| 2.66 (d) | Citrate | 0.91 | Negative |
| 2.55 (d) | Citrate | 0.94 | Negative |
| 2.41 (s) | Succinate | 0.84 | Negative |
Here, artificial urine was used to demonstrate that a mixture of representative compounds can be used to estimate the retention capacity of cartridges without using natural urine – as with the natural urine reversed phase elutions, metabolites such as hippurate can be shown to be retained on C18/HLB, but not on phenyl cartridges; similarly, trigonelline can be shown to be retained on phenyl, but not on C18/HLB. This allows for greater control over future SPE experiments aimed at characterising retention profiles of SPE cartridges.
Discussion
The guiding philosophy behind this use of SPE-NMR suggests that not only each cartridge, but each pH and solvent system utilised in a given experiment, would result in different retention profiles. These retention profiles can be classified either through annotation of a selection of common metabolites from different compound classes, or using a more holistic approach, determining the compounds more likely to be retained under different conditions through data treatment. Selective use of methods can then be utilised to reduce peak overlap and aid metabolite identification. One example of this is displayed in Fig. 7; interferences in the ‘raw’ pooled urine sample are removed by the use of a PBA-based method to clearly reveal mannitol.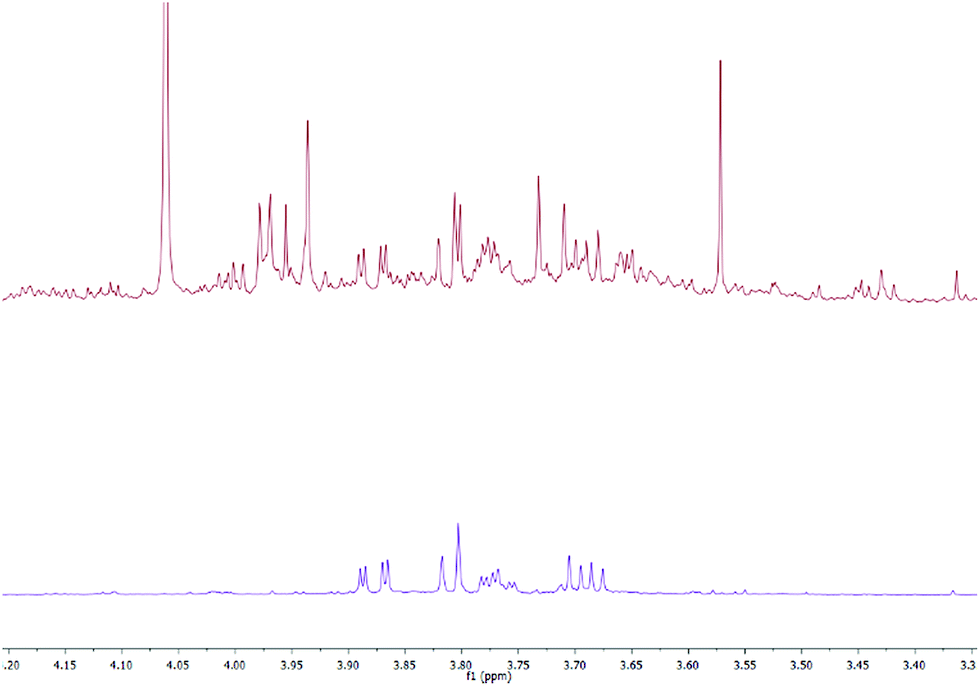 | ||
| Fig. 7 Comparison of the 3.30–4.15 ppm region of the 600 MHz NMR spectra of the pooled urine sample (top) and PBA SPE-treated urine (bottom), the latter revealing only mannitol peaks. | ||
Annotation of a selection of common metabolites is facile and provides immediate and useful information of individual compounds. Ideally, this could be done using a list of metabolites representative of the compound classes generally found in human urine; unfortunately, the partial identification of the human urinary metabolome hinders the creation of a fully representative sample. Additionally, the natural rate of occurrence of metabolites may make a representation of an ‘average’ sample difficult or even impossible. Peak intensities can also be impacted by NMR shimming, peak overlap, and pH changes – all of which can affect the intensity recorded. Despite these shortcomings, general trends can be established by considering functional groups and structural commonalities between compound classes.
Clustering in PCA plots can be used to demonstrate substantial differences between datasets. The Strong Cation Exchange (SCX) cartridge – utilising the pseudo-permanently charged phenylsulfonic derivative (pKa ≈ 2.1) – provides the greatest separation between clusters when included in PCA structures, due to the ion exchange mechanisms not present in reversed phase chromatography. Ion exchange retention profiles rely heavily on pH control, since all compounds must have at least one positively charged atom in order to have sufficient attraction to the sorbent to be retained; hence, compounds that do not have a positive charge at physiological pH must be in acidic solution for retention to occur. This intrusive sample adjustment will naturally affect the chemistry of the biofluid; using acidified (or basified) conditions is, then, necessarily a trade-off between greater insight into the metabolome through retention, and authenticity of the sample itself. It is additionally feasible that compounds not normally present in the sample may be formed and retained due to the change of conditions, although this was not noted during the course of the experiments.
The importance of pH control is reflected in the retention capacity of SCX cartridges; the neutral pH retention profile is one of the least retaining methods with an estimated retention capacity of 0 – at pH 2, its retention capacity (14.67) is comparable to a more widely recognised reversed phase method, such as HLB with 2% formic acid in all steps (17.40). The compounds best retained on SCX under acidic conditions were predominantly histidine-based – with histidine, 3-methylhistidine, and 1-methylhistidine being well retained at pH 2. Creatinine and TMAO were also present in the elutions. A cationic nitrogen atom, possibly stabilised by electron-donating groups through hyperconjugation, may serve as the most important characteristic uniting the compounds. Compounds without nitrogen-containing functional groups (such as amino acids) were generally not present in the acidified SCX elutions, although the presence of a nitrogen-containing functional group did not necessarily result in retention – for example, of the proteinogenic amino acids that were retained, only histidine was retained in any significant quantity. It may be notable that histidine has a pKa of 6.04 (pyrrolic nitrogen), far lower than the other positively charged amino acids, arginine (pKa 12.10) and lysine (pKa 10.67).
Removing ion exchange elutions from the dataset and reconstructing a PCA plot demonstrates additional separation between C18/HLB and phenyl elutions and allows for further probing into the differences between the reversed phase methods. Previous uses of phenyl cartridges in the literature have remarked on their similar retention capabilities to C18, with slightly better retention for polycyclic aromatic compounds,18 but slightly worse retention for other hydrocarbons.19 Phenyl cartridges utilise π-stacking on top of hydrophobic forces in order to provide additional retention for aromatic compounds – however, the strength of π–π interactions tends to be bound between around 8–12 kJ mol−1 for benzene dimers.20 For comparison, hydrophobic forces may be up to 4 times stronger;21 hence, despite having an additional mechanism of action, the actual retention capacity for phenyl cartridges is significantly lower than that of C18 or HLB cartridges across all methods due to a weaker hydrophobic retention mechanism.
The two major compounds that were retained selectively by phenyl (but not by C18 or HLB) were trigonelline and creatinine, both nitrogen-containing heterocycles. Other compounds with phenyl functional groups – such as phenylalanine or hippurate – did not experience greater retention using phenyl cartridges, and in fact retained much less, if at all. Conversely, the cyclic metabolites retained under acidic conditions by C18/HLB – but not by phenyl – are predominantly aromatic, with both heterocycles (2-furoylglycine, quinolinate, and N-methyl-2-pyridone-5-carboxamine), and hydrocarbon rings (hippurate, phenylacetylglutamine, and p-hydroxyphenylacetate) present. The aromatic heterocycles here do not have the ability to form cationic nitrogen in the rings themselves, unlike the aromatic compounds retained in phenyl elutions, such as trigonelline. Short chain fatty acids such as valeric acid were also retained under non-neutral conditions. It is unclear why charged metabolites like trigonelline would be better retained on phenyl cartridges – although as the charge is positive, it is hypothetically possible that the π-electron clouds located above and below the benzene rings are able to electrostatically attract these metabolites with enough strength that they can be retained.
Out of the remaining reversed phase sorbents, the C18 and HLB cartridges are known to have similar retention profiles to each other,10 with HLB cartridges often being preferred for their tolerance to drying and the possibility for elimination of conditioning and equilibration steps. The differences between the two can be demonstrated through comparison of elutions – while the two have comparable retention, HLB cartridges tend to retain a slightly larger range of compounds in greater quantities. This is especially true under neutral conditions, where C18 cartridges retain relatively little. Generally speaking, as with the SCX cartridges, more acidic conditions result in greater retention – possibly due to the deionisation of silanol groups on the surface of the sorbent. However, this again comes with the trade-off of authenticity, as the acidic conditions may cause signal suppression, unwanted reactions between metabolites, or general degradation of the sample itself. Use of 2% formic acid in all steps allows for a balance between the two – while the retention does not extend as deeply as that under pH 2 conditions, the higher pH environment should not be as destructive to sample authenticity, and chemical shifts caused by drastic pH changes should be absent. HLB and C18 under acidic conditions are powerful analytical methods that can reveal signals that are otherwise not visible – for example, unknown N, which displays a doublet of doublet of doublets (ddd) signal at 7.12 ppm, is normally obscured by a 3-methylhistidine peak (Fig. 8). The use of reversed phase methods can hence provide additional information about the human urinary metabolome.
 | ||
| Fig. 8 Unknown N (ddd), normally obscured by 3-methylhistidine (top), is revealed after HLB SPE treatment under acidic conditions (bottom), but not under neutral conditions (middle). | ||
C18 and HLB cartridges themselves can also be differentiated from each other. On top of the obvious differences in sorbent structure (a hydrocarbon chain, compared to a polymer containing divinylbenzene), HLB cartridges are not silica-based – hence, silanol groups present in C18 cartridges are not present in HLB. These silanol groups produce secondary interactions with metabolites, commonly expressed as a weak cation exchanger, which can influence retention. This is reflected in the differences between C18 elutions under neutral and acidified conditions – at lower pH, the silanols are generally protonated; at neutral pH, at least some silanols are deprotonated, giving the cartridge the ability to selectively retain some cations. Indeed, observing the PCA results shows that compounds such as creatinine and TMAO are retained under neutral conditions – these compounds also being retained by the SCX cartridge under the appropriate conditions.
The final elutions to consider were those afforded from methods utilising phenylboronic acid (PBA) cartridges. PBA cartridges utilise a unique covalent bonding mechanism in order to selectively retain diols, α-hydroxy ketones, or any other functional groups where two unsubstituted heteroatoms are separated by at least one carbon.22,23 It is not clear whether the diols must adopt a specific isomerism for retention to occur: mannitol is heavily retained in the elutions, but contains both R and S carbon centres, as well as terminal hydroxyls which can rotate to become a given conformer – its retention hence does not give additional insight. Other compounds retained include acetate, acetamide, and N-methylnicotinamide, a metabolite of niacin. The presence of adjacent heteroatoms does not guarantee good retention: for example, citric acid is poorly retained, despite having three carboxylate groups. There is also some retention of dimethylamine in both artificial and natural urine samples, despite it not being a diol – however, it could hypothetically be retained through a single substitution of water at the boronate, rather than through a double-substitution, as is normally the case.
Conclusions
We have demonstrated and compared the use of different SPE methods for the retention of different compound classes within the human urinary metabolome. Different retention profiles can give unique insight into the metabolome by revealing metabolite peaks in NMR spectroscopy that had previously been obscured by peak overlap – SPE can hence be used to either remove the suppressing metabolite(s) or to isolate the unknown metabolite itself. These retention profiles can be differentiated based on their retention of not only individual metabolites, but of broader subclasses of compounds united by their structure commonalities, including shared functional groups. Hence, different methods can be utilised in order to give greater control over the annotation process. On top of the metabolites identified by comparison to metabolite databases and available literature, several unknowns were annotated in the elutions – further experiments and comparisons to an authentic chemical reference will be required to identify them to a level 1 standard.16 There also exists the possibility to study washes from the SPE experiments further, as well as to use multiple SPE methods in series, in order to narrow down a set of retained compounds even further. Finally, it may be possible to transfer these methods to an automated SPE system for more high-throughput analysis. All of these will hopefully broaden our understanding of the human urinary metabolome, and hence our understanding of biomarkers and the disease states and phenotypes that they represent.Conflicts of interest
The authors register no conflicts of interest.Acknowledgements
Author Dan McGill is supported by the Bruker Corporation and the Stratified Medicine Graduate Training Programme in Systems Medicine and Spectroscopic Profiling (STRATiGRAD). The authors would like to thank Rose Tolson (Imperial College London) for running the polyethylene glycol screening and Gordon Haggart (Imperial College London) for his assistance with troubleshooting the IMPaCTS toolbox. Elena Chekmeneva was supported by the NIHR Imperial Biomedical Research Centre.Notes and references
- P. Elliott, et al., Urinary metabolic signatures of human adiposity, Sci. Transl. Med., 2015, 7, 285ra62 CrossRef.
- J. K. Nicholson and I. D. Wilson, High resolution proton magnetic resonance spectroscopy of biological fluids, Prog. Nucl. Magn. Reson. Spectrosc., 1989, 21, 449–501 CrossRef CAS.
- S. L. Robinette, J. C. Lindon and J. K. Nicholson, Statistical Spectroscopic Tools for Biomarker Discovery and Systems Medicine, Anal. Chem., 2013, 85, 5297–5303 CrossRef CAS.
- J. M. Posma, et al., Integrated Analytical and Statistical Two-Dimensional Spectroscopy Strategy for Metabolite Identification: Application to Dietary Biomarkers, Anal. Chem., 2017, 89, 3300–3309 CrossRef CAS.
- K. Bingol and R. Brüschweiler, NMR/MS Translator for the Enhanced Simultaneous Analysis of Metabolomics Mixtures by NMR Spectroscopy and Mass Spectrometry: Application to Human Urine, J. Proteome Res., 2015, 14, 2642–2648 CrossRef CAS.
- S. Bouatra, et al., The Human Urine Metabolome, PLoS One, 2013, 8, e73076 CrossRef CAS.
- L. W. Sumner, et al., Proposed minimum reporting standards for chemical analysis Chemical Analysis Working Group (CAWG) Metabolomics Standards Initiative (MSI), Metabolomics, 2007, 3, 211–221 CrossRef CAS.
- I. D. Wilson and J. K. Nicholson, Solid phase extraction chromatography and NMR spectroscopy (SPEC-NMR) for the rapid identification of drug metabolites in urine, J. Pharm. Biomed. Anal., 1988, 6, 151–165 CrossRef CAS.
- W. Yang, Y. Wang, Q. Zhou and H. Tang, Analysis of human urine metabolites using SPE and NMR spectroscopy, Sci. China, Ser. B: Chem., 2008, 51, 218–225 CrossRef CAS.
- D. M. Jacobs, L. Spiesser, M. Garnier, N. De Roo, F. Van Dorsten, B. Hollebrands, E. Van Velzen, R. Draijer and J. Van Duynhoven, SPE-NMR metabolite sub-profiling of urine, Anal. Bioanal. Chem., 2012, 404, 2349–2361 CrossRef CAS PubMed.
- A. C. Dona, et al., Precision High-Throughput Proton NMR Spectroscopy of Human Urine, Serum, and Plasma for Large-Scale Metabolic Phenotyping, Anal. Chem., 2014, 86, 9887–9894 CrossRef CAS PubMed.
- Imperial Metabolic Profiling and Chemometrics Toolbox (IMPaCTS), available at: 10.5281/zenodo.803330 Search PubMed.
- F. Dieterle, A. Ross, G. Schlotterbeck and H. Senn, Probabilistic Quotient Normalization as Robust Method to Account for Dilution of Complex Biological Mixtures. Application in 1H NMR Metabonomics, Anal. Chem., 2016, 78, 4281–4290 CrossRef PubMed.
- The Human Urine Metabolome Database, available at: http://www.urinemetabolome.ca/.
- P. G. Takis, H. Schäfer, M. Spraul and C. Luchinat, Deconvoluting interrelationships between concentrations and chemical shifts in urine provides a powerful analysis tool, Nat. Commun., 2017, 8, 1662 CrossRef PubMed.
- L. W. Sumner, et al., Proposed quantitative and alphanumeric metabolite identification metrics, Metabolomics, 2014, 10, 1047–1049 CrossRef CAS.
- W. Barton, et al., The microbiome of professional athletes differs from that of more sedentary subjects in composition and particularly at the functional metabolic level, Gut, 2017, 67, gutjnl-2016-313627 CrossRef PubMed.
- R. Marcé and F. Borrull, Solid-phase extraction of polycyclic aromatic compounds, J. Chromatogr. A, 2000, 885, 273–290 CrossRef.
- M.-C. Hennio, Solid-phase extraction: method development, sorbents, and coupling with liquid chromatography, J. Chromatogr. A, 1999, 856, 3–54 CrossRef.
- M. O. Sinnokrot, E. F. Valeev and C. D. Sherrill, Estimates of the Ab Initio Limit for π–π Interactions: The Benzene Dimer, J. Am. Chem. Soc., 2002, 124, 10887–10893 CrossRef CAS.
- R. H. Petrucci, F. G. Herring, J. D. Madura and C. Bissonnette, General Chemistry: Principles and Modern Applications, Prentice Hall, 2016 Search PubMed.
- M. Tugnait, F. Y. K. Ghauri, I. D. Wilson and J. K. Nicholson, NMR-monitored solid-phase extraction of phenolphthalein glucuronide on phenylboronic acid and C18 bonded phases, J. Pharm. Biomed. Anal., 1991, 9, 895–899 CrossRef CAS.
- P. Martin, B. Leadbetter and I. D. Wilson, Immobilized phenylboronic acids for the selective extraction of β-blocking drugs from aqueous solution and plasma, J. Pharm. Biomed. Anal., 1993, 11, 307–312 CrossRef CAS.
| This journal is © The Royal Society of Chemistry 2019 |