
 Open Access Article
 This Open Access Article is licensed under a Creative Commons Attribution-Non Commercial 3.0 Unported Licence
A framework to analyze sulfate versus chloride selectivity in nanofiltration†
Yagnaseni
Roy
and
John H.
Lienhard
V
 *
*
Department of Mechanical Engineering, Massachusetts Institute of Technology, Cambridge, MA 02139-4307, USA. E-mail: lienhard@mit.edu
First published on 21st January 2019
Abstract
The preferential removal of sodium sulfate over sodium chloride (fractionation) by nanofiltration (NF) is studied. A fractionation metric, M, is defined, and a simple set of equations are derived to describe its variation due to operating parameters, such as temperature and pressure. The use of these equations to explain known behavior of NF systems and suggest improvements in system or membrane design is demonstrated. Furthermore, the derived framework is applicable to all membranes used in pressure-driven technologies, without detailed characterization of specific membrane properties, such as structural parameters (pore radius, active layer thickness, tortuosity, porosity) or charge-based parameters. Given that the principal applications of NF involve the selective removal of multivalent ions over monovalent ions, the introduced metric provides a direct measure of its efficacy in such applications, and is shown to be more accurate in some cases than comparing salt rejection ratios, as usually done. Finally, the concept of ‘breakthrough’, commonly observed as the point at which rejection ratio begins to decrease with increase in pressure, is mathematically described, and its implication on selectivity discussed.
Water impactNanofiltration is used in water treatment to separate multivalent ions from monovalent ions, particularly to soften water and to prevent scaling. The interplay of size-based and charge-based exclusion mechanisms in NF makes interspecies selectivity very complicated to model. This work introduces an intuitively-appealing framework for inter-ion selectivity, relevant to seawater and industrial-effluent treatment, using sulfate vs. chloride selectivity as an example. |
1. Introduction
Nanofiltration (NF) is a pressure-driven membrane-based separation technology, similar to reverse osmosis (RO). The niche of this technology is for applications requiring high removal efficiency for only multivalent ions. The separation of sodium sulfate from sodium chloride upon nanofiltration treatment of an incoming mixture, is a well-studied application. For convenience, the separation of sodium sulfate from sodium chloride will be referred to as ‘fractionation’ in this work.The temperature of industrial effluents that undergo this treatment depends on the source, although NF-treatment is limited by membrane material limits. Ref. 1 and 2 study nanofiltration for fractionation with feed temperature ranges 32–59 °C and 30–40 °C respectively, but do not discuss the change of fractionation efficacy due to temperature change. Other sources, such as ref. 3, discuss the decrease in rejection of all ions due to increase in feed temperature during NF-based fractionation. Indeed, in academic literature, the change of rejection ratio due to various operating conditions is reported as the primary metric for membrane-based separation. Studies of other NF applications, such as seawater desalination, that depend on the preferential selectivity to multivalent ions also report rejection ratio. However, comparing rejection ratio change due to variation in operating conditions does not provide a direct response to the question: is the nanofiltration membrane more selective to sulfate or chloride ions at a different pressure, temperature or pH?
For example, as detailed in section 4.1, when temperature increases, many sources report negligible decrease in rejection ratio of divalent species (e.g. SO42−, Ca2+), while the rejection of monovalent species (e.g. Na+, Cl−, K+) decreases by a much larger percentage.4–6 This trend, at first glance, indicates that the membrane's selectivity to divalent species remains high at larger temperatures and that of monovalents decreases notably. While the small decrease in rejection ratio of the divalent species does indicate that the permeate concentration, Cp, remains small compared to the feed concentration, Cf, the Cp value may have increased by several multiples. In fact, if the user is interested in the selectivity of divalent vs. monovalent species as measured by the multiple by which their respective Cp values increase, the message is quite different: the divalents' Cp increases by several more multiples than that of the monovalents. Consequently, the membrane's selectivity to divalents is lowered more significantly due to increase in temperature compared to the monovalents.
In the present work, a performance metric that answers the previous question is defined and its variations with temperature and pressure are analyzed. An analytical framework to explain the observed variations is developed. This analytical framework interprets the change in selectivity as the result of a ‘competition’ between the fluxes of sodium chloride and sodium sulfate. Values of the permeate concentrations of these two salts and of water flux obtained from experiment can be ‘plugged in’ to the framework. Consequently, experimental results from any membrane can be analyzed in this manner. Applicability to all membrane types used in pressure-driven technologies is the key advantage of the proposed method of analysis. Furthermore, the analysis informs the membrane operator on how to improve selectivity in their system, and the analysis identifies focus areas for improving membranes for the given application.
Five feed compositions (A–E) representing a range of NaCl–Na2SO4 concentration ratios will be considered and the changes in their selectivity metric with temperature, pressure and membrane charge variation will be studied. Fig. 1 describes the molar compositions of solutions A–D, while solution E has the same ratio of salt concentrations as A, but at ten times the total salinity. For compositions A to D, the total equivalents of anions are fixed. For example, in A and D, the anion equivalents are 30 + 2 × 15 = 60 and 12 + 2 × 24 = 60 respectively. Composition E contains ten times the anion equivalents in A–D: 300 + 2 × 150 = 600. In contrast to the other compositions, D has a greater percentage by moles of sodium sulfate than sodium chloride.
 | ||
| Fig. 1 Percentage of moles of NaCl and Na2SO4 in each feed composition. Specifically, the compositions of the test solutions are A: 30 mol m−3 NaCl + 15 mol m−3 Na2SO4, B: 40 mol m−3 NaCl + 10 mol m−3 Na2SO4, C: 20 mol m−3 NaCl + 20 mol m−3 Na2SO4, D: 12 mol m−3 NaCl + 24 mol m−3 Na2SO4 and E: 300 mol m−3 NaCl + 150 mol m−3 Na2SO4 respectively. | ||
2. Governing equations
2.1. Analytical framework
The desired outcome of fractionation is to minimize Na2SO4 concentration and maximize NaCl concentration in the permeate stream. Consequently, in this work, the primary metric for fractionation performance is defined by eqn (1):| M = (Cp,NaCl/Cp,Na2SO4) | (1) |
In the above equation, Cp is the permeate concentration. A parameter similar to M has been used to measure nanofiltration (NF) selectivity in previous literature, such as in ref. 7 while investigating selectivity between two pharmaceutical chemicals and ref. 8 in studying selectivity between Na+ and Mg2+ ions by polyelectrolyte multilayer NF membranes. In pressure driven processes such as NF and RO, the salt (i.e. NaCl or Na2SO4) flux and water flux directions are the same, and the following equation holds:9–11
| Cp,s = Js/Jw | (2) |
In eqn (2), Js and Jw are the salt flux and water flux respectively, and this equation can be applied separately to each of the salts considered, NaCl and Na2SO4. Eqn (2) holds in case of negative rejection (refer Fig. 6c), since in pressure-driven processes the transport in the support layer is convection-dominated and back-diffusion is eliminated due to a flat concentration profile in this region.
Using quotient rule of differentiation on eqn (2),
 | (3) |
For each salt, the quantity on the right-hand side of eqn (3) can be thought of as a ‘competition’ between the relative increase in salt flux, Js, and the relative increase in water flux, Jw. If the changes are larger than a differential amount, the quantities dCp,s, dJs and dJw can be replaced by ΔCp,s, ΔJs and ΔJw respectively, as done in section 4. Furthermore, as done in section 4, the ‘relative changes’ ΔCp,s/ΔCp,s, ΔJs/ΔJs and ΔJw/ΔJw can be interpreted as percentage changes.
The derivative of M with respect to a quantity X (temperature, membrane charge or pressure in this paper) is:
 | (4) |
Dividing eqn (4) through by M,
 | (5a) |
Eqn (5a) gives the relative (percentage) change in M due to dX. The equation states that when M increases (dM/M > 0), the relative change in Cp,NaCl (dCp,NaCl/Cp,NaCl) due to dX is larger than that of Cp,Na2SO4 (i.e. dCp,NaCl/Cp,NaCl > dCp,Na2SO4/Cp,Na2SO4). Conversely, when M decreases, the percentage change in Cp,NaCl is smaller than that of Cp,Na2SO4.
Now using eqn (3) in eqn (5a), and cancelling the dJw/Jw terms for the two salts,
 | (5b) |
In summary, an increase in M implies that the percentage change in Cp,NaCl and JNaCl due to dX are higher than the corresponding values for Na2SO4. All inequality signs can be reversed to account for a decrease in M.
Finally, the mass balance on the concentration polarization boundary layer will be used to explain ‘breakthrough’ in section 4.5.2. As derived in the ESI,† section S.2 for salts containing two ionic species, the electrical potential-gradient component can be replaced by an expression in terms of ion mass transfer coefficients and diffusivities. Hence, for each salt, the equation effectively reduces to the form shown in eqn (6a). The first term on the right is the convective flux for each salt towards the feed–membrane interface, and the second term is the diffusion flux away from this interface.
| Js = JwCm,s − Ks(Cm,s − Cf,s) | (6a) |
Using eqn (2) to replace Js,
| JwCp,s = JwCm,s − Ks(Cm,s − Cf,s) | (6b) |
2.2. Nanofiltration modeling
The aim of this work is to explain changes in NF selectivity observed in practical systems, caused due to changes in feed conditions and operating parameters. The commercial membrane projection software for NF/RO system design created by Dow (named ROSA) is used as a reference for practically observed trends. The analytical framework developed in section 2.1 explains those known trends of fractionation performance due to temperature and pressure variation. The trends are mentioned in section 3 based on results from ROSA and are reproduced (and explained) in section 4 using the widely-used NF model described in our previous work.9,12The results presented in section 4 are obtained considering the Donnan and steric exclusion mechanisms.‡ Another exclusion mechanism, namely the dielectric exclusion is known to influence ion transport in NF, and is discussed briefly in section 4.2. The model provides values of salt fluxes, water fluxes and salt concentrations that are necessary for the explanations in section 4.
Since the aim of this work is to demonstrate a membrane-independent analytical procedure, details of membrane parameters will not be described here. Phenomena related to temperature-dependence have been accounted for while generating results shown here: ion diffusivity and water viscosity changes are accounted for as shown in our previous work.12§ Typical trends of membrane structural variations are also included,6,13,14 and numerical values of membrane pore radius and active layer thickness used are reproduced in the ESI,† section S.1 (further details in ref. 15).
3. Known trends on selectivity: effect of various operating conditions on M as per ROSA
In this section, the metric M for various feed conditions is obtained from the commercial software ROSA (created by Dow), which is a popular tool for nanofiltration (NF) and reverse osmosis (RO) system design. ROSA has been used as a predictive tool for ion removal in research papers and patents focusing on treatment of various feed waters, including seawater, brackish water, produced water and brine.16–19 Sources comparing experimental results with ROSA predictions find satisfactory agreement, deeming it a useful system-design tool.20–22 Section 4 will show that these trends are also predicted by the NF model used in the present work, and can be explained using the approach developed in section 2.1.Fig. 2 shows the ratio of M values for the feed composition labeled on the horizontal axis, by that of composition A at reference conditions (22 °C and 10 bar applied pressure). If the M value for the feed composition (c) on the horizontal axis is larger than that for composition A in its reference condition, the bar plot will rise over the dotted red line (denoting Mc/MA∣22 °C, 10 bar = 1). For both the NF90 nanofiltration membrane and the SW30 reverse osmosis membrane, common trends of an increase or decrease of M from the reference state are: M decreases at the higher temperature (the first bar is below the dotted red line corresponding to Mc/MA∣22 °C, 10 bar = 1); (Mc/MA∣22 °C, 10 bar) for compositions B, C and D are in decreasing order of magnitude, with the ratio for B greater than 1; the M value for E is smaller than A under the same operating conditions (its bar is below the dotted red line); and the M value at the higher pressure of 20 bar for composition A (at fixed temperature of 22 °C) is lower than the value at 10 bar, causing the last bar to be below the red line. These trends are explained using an analytical approach in section 4.
 | ||
| Fig. 2 Increase or decrease of M compared to the reference state of composition A (22 °C and 10 bar applied pressure) for various feed compositions, from ROSA. Fig. 2a shows results for the NF90 nanofiltration membrane, while 2b shows results for the SW30 reverse osmosis membrane. Various feed compositions (details in section 1) at different temperatures and pressures are indicated on the horizontal axis, and are represented by the dummy variable, ‘c’. The dotted red line denotes (Mc/MA∣22 °C, 10 bar = 1), so that if the M value for any composition is larger than MA∣22 °C ,10 bar, its bar will lie above the line. For both the nanofiltration (NF90) and reverse osmosis membrane (SW30), (Mc/MA∣22 °C, 10 bar) values for compositions B, C and D are in decreasing order of magnitude, with that for B greater than 1 (explained in section 4.3). The M value for a higher salinity feed (E) is smaller than A under the same operating conditions (explained in section 4.4). Furthermore, for both membranes, M decreases at the higher temperature and the bar lies below the red line (explained in section 4.1). At the higher pressure of 20 bar for composition A (at fixed temperature of 22 °C) the M value is lower than that at 10 bar (explained in section 4.5). | ||
4. Results and discussion
In this section, the variation of M due to change in temperature, pressure, feed composition and membrane charge will be studied using the NF modeling mentioned in section 2.2. Trends obtained from this modeling match those obtained from ROSA, as described in section 3. However, this modeling approach provides values of salt and water flux necessary for explanations in subsequent sections. Furthermore, the membrane charge and mass transfer coefficient can be independently varied, thereby allowing the study of these effects individually on M. A small patch of membrane is modeled (so that there is no variation of flow conditions along the membrane surface), instead of a full-scale NF unit. Trends obtained from ROSA are qualitatively reproduced using this model and results on salt flux (Js) and water flux (Jw) obtained can be used to explain these trends. Other than section 4.5, applied pressure is kept constant at 10 bar.4.1. Why fractionation worsens at higher temperature
As shown earlier, the fractionation performance metric, M = (Cp,NaCl/Cp,Na2SO4) decreases with an increase in temperature. From section 2.1, the decrease in M occurs when the relative/percentage change in permeate concentration of sodium chloride is less than that of sodium sulfate. Rewriting eqn (5a) and (5b) for the change in temperature, the conditions can be expressed as: | (7a) |
 | (7b) |
The above conditions are satisfied because the denominators in the ratios for Na2SO4 are significantly smaller than those for NaCl, which causes the overall ratios to be larger for sodium sulfate. The significantly smaller permeate concentration and salt flux for Na2SO4 is due to the larger transport hindrance experienced by the SO42− ion compared to the Cl− ion. Given that the NF and RO membranes are typically negatively charged, the restricting factor in sodium sulfate flux is the membrane's repulsion of the sulfate ion. Consequently, the sodium sulfate flux (and hence permeate concentration) are small enough to result in a large value of the ratios on the left-hand side in eqn (7a) and (b). Solute flux and permeate concentrations for both salts increase with temperature, so the numerators of both sides of eqn (7a) and (b) are positive. Fig. 3a and b show the relative (percentage) change in permeate concentration and salt flux for sodium chloride and sodium sulfate going from 22 to 50 °C (used in eqn (7a) and (7b) respectively) at constant applied pressure of 10 bar.
 | ||
Fig. 3 The selectivity metric, M, decreases at the higher temperature. Fig. 3a and b show the relative (percentage) increase in permeate concentration and salt flux  and and  respectively (used in terms in eqn (7a) and (7b)) and depict the larger relative increase in sodium sulfate permeate concentration and solute flux, compared to those of sodium chloride. The larger magnitudes of relative change for sodium sulfate result in the decrease in M at the higher temperatures, as shown in Fig. 3c. Fig. 3d shows the rejection ratio (1 − Cp,s/Cf,s) for the two salts at both temperatures. The analytical framework from section 2.1 can be applied to any two temperatures. Results in Fig. 3 are for feed composition A but similar trends hold for the others. respectively (used in terms in eqn (7a) and (7b)) and depict the larger relative increase in sodium sulfate permeate concentration and solute flux, compared to those of sodium chloride. The larger magnitudes of relative change for sodium sulfate result in the decrease in M at the higher temperatures, as shown in Fig. 3c. Fig. 3d shows the rejection ratio (1 − Cp,s/Cf,s) for the two salts at both temperatures. The analytical framework from section 2.1 can be applied to any two temperatures. Results in Fig. 3 are for feed composition A but similar trends hold for the others. | ||
As indicated in section 1, the rejection ratio (defined as (1 − Cp,s/Cf,s) for NF)4–6 can mislead the membrane operator to conclude that selective removal of sodium sulfate is higher at the higher temperature. Referring to Fig. 3d, the decrease in rejection ratio for Na2SO4 is much smaller (less than 1% from 22 to 50 °C) than that of NaCl (around 20%) from 22 to 50 °C. The small drop in rejection ratio for Na2SO4 seems to indicate that its permeate concentration barely changed with temperature. However, the permeate concentration of Na2SO4 (i.e. Cp,Na2SO4) increased by several factors more than that of NaCl, as shown in Fig. 3a.
The analytical framework developed in section 2.1 and demonstrated between 22 °C and 50 °C by eqn (7), can also be used for any other pair of temperature values. Fig. 3c shows M values at four temperatures, illustrating the decrease in M with temperature. Results shown in Fig. 3 are for feed composition A, but the same trends apply to all other compositions.
4.2. Negatively charged membranes are advantageous for fractionation
Nanofiltration membranes develop a charge in solution, determined by feed solution pH and ion adsorption propensity from the feed solution.23,24 As shown in Fig. 4a, the fractionation metric, M, is higher when the membrane is negatively charged. The improved selectivity between NaCl and Na2SO4 with negatively charged membranes is due to the stronger response of the bivalent SO42− ion to the increased Donnan exclusion, relative to that for the monovalent Cl− ion. Fig. 4b and c show that the fluxes of both salts decrease going from a neutral membrane charge (CX = 0 mol m−3) to a negative charge value (CX = −∣CX∣ mol m−3). However, the relative decrease in salt flux is larger in magnitude for sodium sulfate.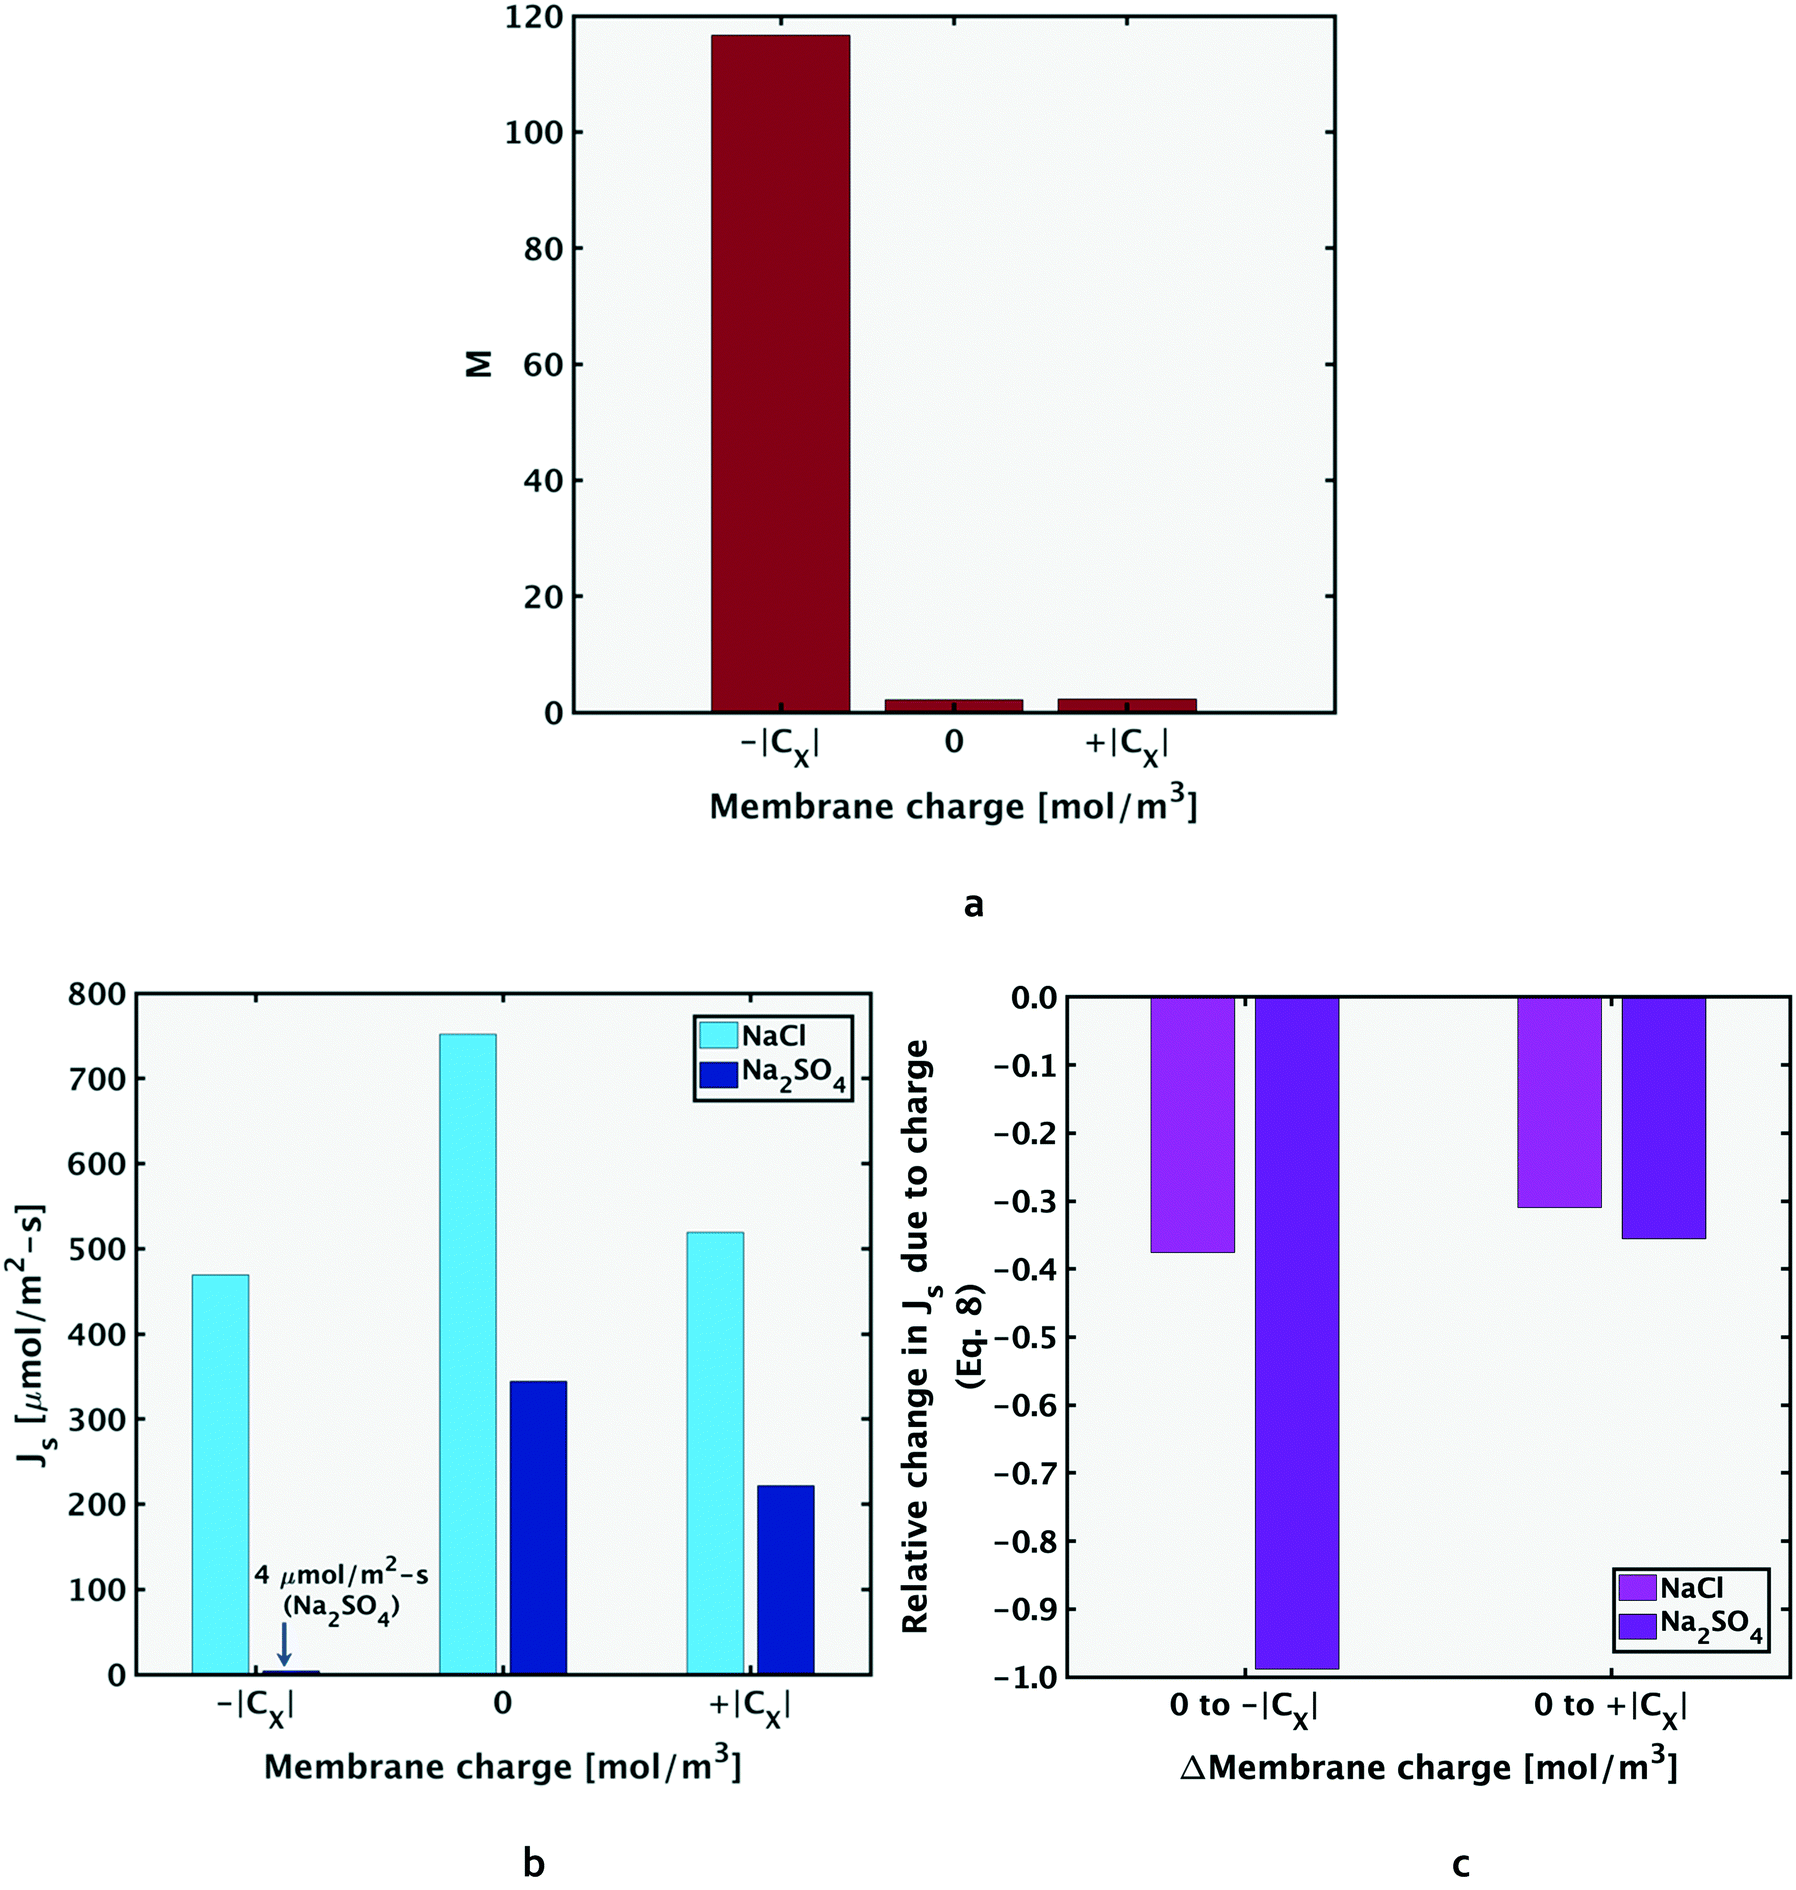 | ||
| Fig. 4 Negatively charged membranes have better selectivity to sodium sulfate than neutrally charged or positively charged membranes, as shown by the M values in Fig. 4a. As shown in Fig. 4b, the fluxes for both salts reduce going from a neutral to a charged membrane, and the decrease is more significant for Na2SO4, especially with the negatively charged membrane. This enhanced selectivity by the negative membrane is due to the stronger Donnan exclusion of sulfate ions, resulting in a more significant relative decrease in its solute flux compared to sodium chloride, as shown in Fig. 4c, and mathematically represented in eqn (8). Results in Fig. 4 are for feed composition A at 22 °C and 10 bar applied pressure due to varying membrane charge, but similar trends hold for the other feed compositions. | ||
Rewriting eqn (5b) to reflect these changes,
 | (8) |
Hence, the selective removal of sodium sulfate compared to sodium chloride, measured by the M value, increases moving to more negatively charged membranes. The above explanation is similar for the positive membrane charge, where sulfate ions still experience stronger exclusion due to their larger size. Accordingly, the increase in M from CX = 0 to +∣CX∣ mol m−3 is less significant compared to that from CX = 0 to −∣CX∣ mol m−3. Results for composition A due to variation of membrane charge, with operating conditions fixed at 22 °C and 10 bar applied pressure are shown in Fig. 4, although the same trends hold for other feed compositions.
In the above discussion, only the effect of membrane charge variation has been considered. In NF modeling, another effect known as the dielectric exclusion mechanism is considered. If the Born exclusion mechanism is considered, as done in ref. 9, 11, 12 and 25), the sulfate ion will experience greater dielectric exclusion than the chloride ion due to its larger charge. Consequently, enhanced dielectric exclusion (due to a reduction in pore dielectric constant value) results to increased M value.
4.3. Observations on M at different compositions
In this section, the M values of four feed compositions, A, B, C and D shown previously in Fig. 1 will be compared under the same operating conditions. All feed compositions considered in this section contain the same overall charge equivalents of anionic species, as explained in section 1.As shown in Fig. 5a, M decreases in the order of the ratio of feed concentrations of NaCl by Na2SO4 (Cf,NaCl/Cf,Na2SO4), i.e. MB > MA > MC > MD. For all cases, however, M = (Cp,NaCl/Cp,Na2SO4) is larger than 1 (including composition D where the feed molar concentration of Na2SO4 is higher than NaCl), since in a negatively charged membrane (common for NF and RO, as explained in the previous section), the Donnan exclusion will affect the SO42− ions in sodium sulfate more strongly.
 | ||
| Fig. 5 As shown in Fig. 5a, the ratio of NaCl by Na2SO4 concentration in the feed (decreasing as B, A, C, D) is reflected in the order of decreasing M values. Furthermore, the metric M changes by the same multiple as the ratio (Cf,NaCl/Cf,Na2SO4). Fig. 5b shows that M for all feed compositions decreases by the same factor at the higher temperature. The operating pressure is 10 bar for all results shown. | ||
Since the same temperature-dependent parameters are used to model all compositions,  is the same for compositions A, B, C and D for both Na2SO4 and NaCl respectively. Consequently,
  (the relative change in M) is the same value for compositions A, B, C and D, as per eqn (5b). As a consequence of the relative/percentage change in M being equal for all compositions, the following expression holds (Fig. 5b):
 | (9) |
To summarize, for feed compositions that differ only in the ratio of chloride to sulfate charge equivalents in the feed, (total anionic charge equivalents in the feed is the same for compositions A, B, C and D, cf. section 1), the ‘quality’ of the permeate stream in terms of relative proportion of NaCl compared to Na2SO4, quantified by metric M, directly reflects the ‘quality’ of the feed stream: going from one composition to another, the metric M changes by the same multiple as the ratio (Cf,NaCl/Cf,Na2SO4). The quality of all feed streams improves after permeating the NF membrane. In fact, all compositions, including D, in which the feed stream has a higher concentration of Na2SO4 than NaCl (Cf,NaCl/Cf,Na2SO4) < 1, has a permeate with (M = Cp,NaCl/Cp,Na2SO4 > 1). For all compositions, selective removal of sulfate is less effective at higher temperatures and decreases by the same extent. The applied pressure for results at both temperatures for all compositions is 10 bar.
4.4. Fractionation of higher TDS solutions – reduced M and negative Cl− rejection
In this section, performance metrics for feed compositions A and E (low and high total salinity) will be compared. Compositions A and E have the same ratio of NaCl to Na2SO4 feed concentrations, but the total salinity of E is ten times that of A (section 1). As reported in previous literature, the rejection ratio of any salt is lower at a higher concentration, attributed to the lower Donnan exclusion by the membrane.25–27 When the feed concentration of a salt is increased, the number of ions available to cross the membrane per unit time, i.e. ion flux, is increased. To allow the increased passage of membrane co-ions (ions with the same charge as the membrane), the Donnan potential (and hence Donnan exclusion) decreases in magnitude.Since sulfate ions have higher negative charge than chloride ions, the decrease in Donnan exclusion allows the increase in JNa2SO4 to be several times larger than that of JNaCl (the bivalent SO42− ions respond more significantly to the reduction in passage restriction of negative ions than the monovalent Cl− ions). The relative increase in salt flux (eqn (5b)) is higher for sodium sulfate than sodium chloride: going from composition A to E, the feed concentration of both salts increases by 10 times, and the salt flux increased by 12 times and 305 times for NaCl and Na2SO4 respectively. Consequently, the metric M reduces at the higher concentration.
A further consequence of the significant increase in sodium sulfate flux is that ΔJNa2SO4|22 to 50 °C/JNa2SO4|22 °C is lower for the higher concentration mixture (the denominator is significantly larger than lower concentration case). Hence, the magnitude of relative decrease in M, (dM/M), is lower for the higher salinity case i.e. composition E.
The above discussion is mathematically expressed by rewriting eqn (5b) as eqn (10a) (also shown in Fig. 6b). The term ΔJNaCl|22 to 50 °C/JNaCl|22 °C also reduces in magnitude for composition E compared to A, but the reduction is less significant than the corresponding term for Na2SO4. It should be noted that both sides of the inequality in eqn (10a) are negative in magnitude (as discussed in section 4.1, M decreases for each solution at higher temperatures), therefore the inequality operator switches direction when the absolute value of percentage change in M is discussed in eqn (10b).
 | (10a) |
 | (10b) |
 | ||
| Fig. 6 As shown in Fig. 6a, the M value for feed solution E (the higher salinity composition), is lower than that of A (which contains the same ratio of NaCl to Na2SO4 concentration, but overall salinity 10 times lower than E). The reduced selectivity at the higher salinity is due to decreased Donnan exclusion, which affects sulfate ions more significantly. Fig. 6b shows the magnitude of relative change in M due to temperature increase for both solutions, as defined by eqn (10b). The rejection ratio of both salts decreases at higher feed salinity, and can result in negative rejection for sodium-chloride (Fig. 6c). | ||
Several studies have reported negative rejection ratio in a ternary mixture of ions.28,29 As mentioned earlier, the rejection ratio decreases when the total salinity increases. Hence, the possibility of negative rejection is enhanced at higher salinity. In a negatively charged membrane (the case for most polyamide NF membranes), the rejection ratio of NaCl is smaller than that of Na2SO4. As shown in Fig. 6c, the reduction of rejection ratio at the higher salinity is large enough so that the value for NaCl becomes negative (compare Fig. 3d for the lower salinity case).
4.5. Response of M to pressure variation
 | (11a) |
 | ||
| Fig. 7 Effect of pressure on selectivity at fixed temperature. M values are smaller for the higher salinity composition, E, compared to the lower salinity composition, A (Fig. 7a). The relative change with pressure increase is lower for composition E, compared to A (Fig. 7b). | ||
It should be noted that while the decrease in M, and the explanation in eqn (11a), is true for most of the pressure range; at lower pressures,¶M increases briefly before beginning its decreasing trend. This brief increase is visible for the no CP case in Fig. 8c, and will be explained for both cases: ‘with CP’ and ‘no CP’ in Appendix A. The current discussion considers the values of M following the initial rise.
 | ||
| Fig. 8 When concentration polarization exists in a system, the rejection ratio (left y-axis in Fig. 8a and b) decreases beyond a certain pressure (a phenomenon termed ‘breakthrough’). At this pressure, the convective transport towards the membrane starts to grow faster than the diffusive salt flux back to the feed (the ratio on the left-hand side of eqn (12d) becomes >1). The breakthrough point for both salts (when concentration polarization (CP) exists in the system) is shown at the point where rejection ratio starts dropping and the left-hand side of eqn (12d) (dashed lines) rises above 1. The rejection ratio and ratio given by the left-hand side of eqn (12d) for NaCl and Na2SO4 respectively are given by Fig. 8a and b. When CP is absent from the system, the left-hand side of eqn (12d) is ≪1, and is too small to be visible on the figure. As shown in Fig. 8c, when CP is absent, the value of M stays at a high value compared to the case with CP. Results shown in the figure above are for solution A, and similar trends with pressure variation hold for the other test solutions. | ||
Furthermore, the decrease is less significant for the higher salinity composition E (Fig. 7b), and the explanation is similar to that for temperature increase (section 4.4). As explained in section 4.4, Donnan exclusion is reduced for a higher salinity mixture under given operating conditions, and the passage restriction for especially the bivalent sulfate ions is greatly alleviated. Hence, the denominator in the expression for relative change in Na2SO4 flux (ΔJNa2SO4|10 to 20 bar/JNa2SO4|10 bar) is larger at higher salinity (causing the ratio to be smaller). Consequently, going from solution A to E, the relative change in sodium sulfate flux decreases significantly, while that for NaCl decreases to a much lesser extent:
 | (11b) |
 | (11c) |
Eqn (6b) can be written in words to show the terms that contribute to salt build-up (JwCm,s) or reduce salt build-up (−Ks(Cm,s − Cf,s)) in the CP boundary layer. These two components can be referred to as ‘salt flux towards membrane’ (TM) and ‘salt flux towards feed’ (TF) respectively:
| JwCp,s = towards membrane (TM) + towards feed (TF) | (12a) |
 | (12b) |
Eqn (12b) can be written for a pressure P and for a pressure slightly lower than P (= P − δP). Subtraction of the latter from the former (value at P minus value at P − δP) gives the change in permeate concentration, Cp,s, for a pressure increase of δP:
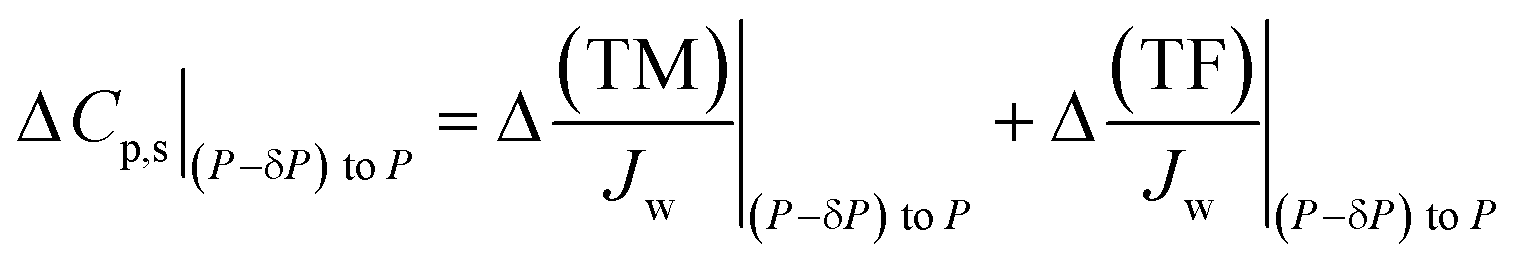 | (12c) |
Breakthrough occurs for each salt when the condition given by eqn (12d) is satisfied, i.e. when the TM component grows faster than the TF component (depicted in Fig. 8a and b). Breakthrough can only occur when there is CP in the system. When CP is absent from the system, the left-hand side of eqn (12d) is ≪1. Fig. 8a and b show that when CP is not present, the rejection ratio continues to increase with pressure (and will at some point reach a plateau). For the pressure range plotted, the continuing increase of rejection ratio indicates a decrease in permeate concentration with pressure increase (in the presence of CP, the permeate concentration of each salt will begin increasing again after its breakthrough point, as shown in Appendix A).
 | (12d) |
As shown in Fig. 8c, in the presence of CP (dark green line), a steady decrease in the selectivity metric with increase in pressure is observed. When CP is absent (light green line), the M value remains comparatively high over the pressure range. Furthermore, the no CP case shows an increase in M at a certain low pressure, followed by a continuing decrease with increasing pressure. The initial increase in M at low pressures is also seen in the ‘with CP’ case, as explained further in Appendix A. The key distinction between the cases with and without CP is the increasing M over the pressure range as the extent of CP reduces (i.e. Ks increases in magnitude). These findings indicate that in an industrial system, if the decrease in M due to pressure increase is to be minimized, increasing flow rate (or other steps to increase mass transfer coefficient Ks) should be undertaken.
5. Conclusions
The present framework to analyze membrane selectivity applied to explain the effect of temperature, pressure, feed composition and membrane charge provides the following insights:1. The ability of a membrane to selectively remove multivalent ions over monovalent ions decreases at higher temperature.
2. Membranes that acquire negative charge in solution are best for sulfate-chloride fractionation. Consequently, for higher temperature applications, operating conditions and membrane characteristics that favor a negative acquired charge are desirable. For example, higher operating feed pH, membranes that exhibit enhanced anion adsorption capacity or functional group dissociation to enhance negative membrane charge, are preferred at higher temperature.
3. The desired membrane properties at higher temperature also depends on the feed composition. For example, fractionation efficiency for solutions with higher TDS will not decrease as drastically at higher temperature, hence the requirement of increasing negative membrane charge will not be as significant, compared to applications involving lower TDS feed.
4. Selectivity decreases at higher operating pressure, especially if concentration polarization (CP) is present in the system. Consequently, steps to increase the mass transfer coefficient in the system are desirable, such as increased feed flow rate and improved feed spacers. Furthermore, controlling the ‘build-up’ of the CP layer, by reducing permeate flux, will also improve selectivity.
Appendix A: variation in Cp,NaCl and Cp,Na2SO4 with pressure, with and without CP
In this section, a more detailed analysis of the trends of variation in M with pressure, shown in Fig. 8c, will be provided. In Fig. 8c, the light green and dark green lines represent values of M in the ‘no CP’ and ‘with CP’ cases respectively. Referring to Fig. 9, in the case with no CP (Fig. 9a), Cp,s for both salts reduce over the pressure range. Furthermore, in section A of Fig. 9a, the rate of decrease of Cp,Na2SO4 is faster than that of Cp,NaCl, while after the dotted red line (in section B), the line for Cp,Na2SO4 is ‘flatter’ than that of Cp,NaCl, and so its rate of decrease with pressure increase is lower. | ||
| Fig. 9 a Shows the permeate concentrations of NaCl and Na2SO4 (values on the left y-axis and right y-axis respectively) for modeling with no concentration polarization (CP). b Shows the permeate concentrations over the same pressure range, but with modeling with CP. Values of rejection ratio and M for the same cases were shown in Fig. 8 in the main text. c Shows the M values in Fig. 8c along with those at an intermediate value of mass transfer coefficient (extent of CP intermediate to those in Fig. 8c). | ||
In the case with CP (Fig. 9b), the line representing Cp,Na2SO4 starts rising after reaching its breakthrough point (the junction between sections C and D). Following the breakthrough point (through section D), the rate of increase in Cp,Na2SO4 is faster than that of Cp,NaCl. Consequently, in section D, M decreases. The initial increase in M observed in the light green line in Fig. 8c also occurs when CP is present, since before breakthrough point, the Cp,s for boths salts decrease, like in the ‘no CP’ case. In fact, the evolution in concentration profiles in sections B and C in Fig. 9 is similar in nature. This initial increase in M is clearer in Fig. 9c. Fig. 9c shows M when a larger Ks value (for both salts) than the case shown in Fig. 8 and 9b is used, such that the extent of CP is lower. The increase in Ks (and lowering in extent of CP) causes the breakthrough point for Na2SO4 to shift to a higher pressure. As mentioned in section 4.5.2, the key observation is the increase in M as CP reduces.
Nomenclature
| C | Concentration (mol m−3) |
| C X | Membrane charge (mol m−3) |
| CP | Concentration polarization |
| D ∞ | Diffusivity in bulk solution (m2 s−1) |
| J s | Salt flux (mol m−2 s−1) |
| J w | Water flux (m s−1) |
| k | Mass transfer coefficient for each ion (ESI† S.2) (m s−1) |
| K | Effective salt mass transfer coefficient (eqn (6a)) (m s−1) |
| M | Fractionation metric |
| P | Pressure (Pa) |
| T | Temperature (°C) |
| TDS | Total dissolved solids (mol m−3) |
| TF | Salt flux towards feed (eqn (12a)) (mol m−2 s−1) |
| TM | Salt flux towards membrane (eqn (12a)) (mol m−2 s−1) |
| X | Operating condition dummy variable (pressure or temperature) |
| z | Ion valence |
Greek symbols
| ζ | Potential gradient at feed–membrane interface (V m−1) |
Subscripts
| f | Feed |
| i | Ion |
| m | At membrane surface-concentration polarization layer interface |
| p | Permeate |
| s | Salt |
Conflicts of interest
There are no conflicts to declare.References
- G. Bargeman, M. Steensma, A. ten Kate, J. B. Westerink, R. L. M. Demmer and H. Bekkenes, et al., Nanofiltration as energy-efficient solution for sulfate waste in vacuum salt production, Desalination, 2009, 245(1–3), 460–468 CrossRef CAS.
- E. Curcio, X. Ji, A. Matin, S. Barghi, G. Di Profio and E. Fontananova, et al., Hybrid nanofiltration – membrane crystallization system for the treatment of sulfate wastes, J. Membr. Sci., 2010, 360, 493–498 CrossRef CAS.
- S. E. Mousavi, S. M. A. Moosavian, M. Jalali, P. Zahedi and E. Karimi, Sulfate removal from chlor-alkali brine using nanofiltration: Parameters investigation and optimization via Taguchi design method, Desalin. Water Treat., 2017, 100(January), 75–90 Search PubMed.
- Y. K. Ong, F. Y. Li, S. P. Sun, B. W. Zhao, C. Z. Liang and T. S. Chung, Nanofiltration hollow fiber membranes for textile wastewater treatment : Lab-scale and pilot-scale studies, Chem. Eng. Sci., 2014, 114, 51–57 CrossRef CAS.
- J. Gao, S. P. Sun, W. P. Zhu and T. S. Chung, Green modification of outer selective P84 nanofiltration (NF) hollow fiber membranes for cadmium removal, J. Membr. Sci., 2016, 499, 361–369 CrossRef CAS.
- N. Ben Amar, H. Saidani, A. Deratani and J. Palmeri, Effect of temperature on the transport of water and neutral solutes across nanofiltration membranes, Langmuir, 2007, 23(6), 2937–2952 CrossRef CAS PubMed.
- S. Zhang, J. Zhou, L. Fan, Y. Qiu, L. Jiang and L. Zhao, Investigating the mechanism of nanofiltration separation of glucosamine hydrochloride and N - acetyl glucosamine, Bioresour. Bioprocess., 2016, 3, 34 CrossRef.
- Y. I. Dirir, Y. Hanafi, A. Ghoufi and A. Szymczyk, Theoretical investigation of the ionic selectivity of polyelectrolyte multilayer membranes in nanofiltration, Langmuir, 2015, 31(1), 451–457 CrossRef CAS PubMed.
- Y. Roy, M. H. Sharqawy and J. H. Lienhard, Modeling of flat-sheet and spiral-wound nanofiltration configurations and its application in seawater nanofiltration, J. Membr. Sci., 2015, 493, 360–372 CrossRef CAS.
- E. Nagy, A general, resistance-in-series, salt- and water flux models for forward osmosis and pressure-retarded osmosis for energy generation, J. Membr. Sci., 2014, 460, 71–81 CrossRef CAS.
- V. Geraldes and A. M. Brites Alves, Computer program for simulation of mass transport in nanofiltration membranes, J. Membr. Sci., 2008, 321(2), 172–182 CrossRef CAS.
- Y. Roy, D. M. Warsinger and J. H. Lienhard, Effect of temperature on the solute transport in nanofiltration : diffusion, convection and electromigration, Desalination, 2017, 420C, 241–257 CrossRef.
- R. Sharma and S. Chellam, Temperature effects on the transport of water, uncharged and charged solutes across polymeric nanofiltration membranes, in: American Water Works Association Membrane Technology Confernce, 2007, pp. 17–20 Search PubMed.
- R. R. Sharma, Temperature Effects on the Morphology of Porous Thin Film Composite Nanofiltration Membranes, Environ. Sci. Technol., 2005, 39(13), 5022–5030 CrossRef CAS PubMed.
- Y. Roy and J. H. Lienhard, Factors contributing to the change in permeate quality upon temperature variation in nanofiltration, Desalination, 2019, 455, 58–70 CrossRef CAS.
- P. Prakash, R. B. Pruet and D. Q. Vu, US Pat. Application Publication, Pub. No.: US2006/0222585A1, 2011 Search PubMed.
- M. A. Aghdam, F. Zraick, J. Simon, J. Farrell and S. A. Snyder, A novel brine precipitation process for higher water recovery, Desalination, 2016, 385, 69–74 CrossRef.
- S. Zamani, M. Fazeli and A. R. Mehrabadi, The potential use of nanofilters to supply potable water in Persian Gulf and Oman sea watershed basin, World Acad. Sci. Eng. Technol., 2009, 37(1), 6–10 Search PubMed.
- M. Wilf, L. Awerbuch, C. Bartels, M. Mickley, G. Pearce and N. Voutchkov, Nanofiltration technology and applications, in: The guidebook to membrane desalination technology, L'Aquila: Desalination publications, 2007, pp. 243–454 Search PubMed.
- J. Choi, B. G. Choi and S. Hong, Effects of NF treated water on corrosion of pipe distribution system and its implications to blending with conventionally treated water, Desalination, 2015, 360, 138–145 CrossRef CAS.
- A. Abbas, Simulation and analysis of an industrial water desalination plant, Chem. Eng. Process., 2005, 44(9), 999–1004 CrossRef CAS.
- A. Robertson and L. D. Nghiem, Treatment of high TDS liquid waste: Is zero liquid discharge feasible?, J. Water Sustainability, 2011, 1(2), 1–11 Search PubMed.
- N. S. Kotrappanavar, A. A. Hussain, M. E. E. Abashar, I. S. Al-Mutaz, T. M. Aminabhavi and M. N. Nadagouda, Prediction of physical properties of nanofiltration membranes for neutral and charged solutes, Desalination, 2011, 280(1–3), 174–182 CrossRef CAS.
- R. R. Sharma and S. Chellam, Temperature and concentration effects on electrolyte transport across porous thin-film composite nanofiltration membranes: Pore transport mechanisms and energetics of permeation, J. Colloid Interface Sci., 2006, 298(1), 327–340 CrossRef CAS PubMed.
- W. R. Bowen and J. S. Welfoot, Modelling the performance of membrane nanofiltration — critical assessment and model development, Chem. Eng. Sci., 2002, 57(7), 1121–1137 CrossRef CAS.
- W. R. Bowen and A. W. Mohammad, Diafiltration by nanofiltration: Prediction and optimization, AIChE J., 1998, 44(8), 1799–1812 CrossRef CAS.
- J. M. M. Peeters, M. H. V. Mulder and H. Strathmann, Streaming potential measurements as a characterization method for nanofiltration membranes, Colloids Surf., A, 1999, 150(1–3), 247–259 CrossRef CAS.
- G. Hagmeyer and R. Gimbel, Modelling the salt rejection of nanofiltration membranes for ternary ion mixtures and for single salts at different pH values, Desalination, 1998, 117(1–3), 247–256 CrossRef CAS.
- O. Labban, C. Liu, T. H. Chong and J. H. Lienhard, Fundamentals of low-pressure nanofiltration: Membrane characterization, modeling, and understanding the multi-ionic interactions in water softening, J. Membr. Sci., 2017, 521, 18–32 CrossRef CAS.
- B. A. M. Al-Rashdi, D. J. Johnson and N. Hilal, Removal of heavy metal ions by nanofiltration, Desalination, 2013, 315, 2–17 CrossRef CAS.
- J. Lin, W. Ye, H. Zeng, H. Yang, J. Shen and S. Darvishmanesh, et al., Fractionation of direct dyes and salts in aqueous solution using loose nanofiltration membranes, J. Membr. Sci., 2015, 477, 183–193 CrossRef CAS.
Footnotes |
| † Electronic supplementary information (ESI) available. See DOI: 10.1039/c8ew00847g |
| ‡ For all results shown in the current work, except for the section on the effect of membrane charge variation on M (section 4.2), the membrane charge is fixed at a value of −1000 mol m−3. This value of membrane charge is within a reasonable range for NF modeling considering the Donnan exclusion and steric exclusion mechanisms.23 The membrane charge is known to increase in magnitude with temperature increase15,24 and with feed salinity increase.26 However, the non-inclusion of these effects does not prevent qualitative agreement of trends on M, dM/M, Cp,s and dCp,s/Cp,s from the modeling with respect to those from the membrane projection software (ROSA) used in designing practical NF/RO systems. |
| § The temperature dependence of the diffusivity of each ion is captured by the Stokes–Einstein equation, while the viscosity of each solution is approximated as that of water at the relevant temperature. The difference in viscosity of solutions A to D with that of water at each temperature is up to 1%. For solution E, the deviation is relatively large (∼10%), but differences in ΔJs/Js, ΔCp,s/Cp,s and M discussed in section 4, differ by no more than 1%, 5% and 2% respectively. |
| ¶ As shown in Appendix A, the increase in M for solution A continues until approximately 10 bar in the ‘no CP’ case, and as the extent of CP increases, the maximum M value shifts to lower applied pressures. |
| This journal is © The Royal Society of Chemistry 2019 |