
 Open Access Article
 This Open Access Article is licensed under a Creative Commons Attribution-Non Commercial 3.0 Unported Licence
Development of a suitable detection method for silver nanoparticles in fish tissue using single particle ICP-MS†
Nathaniel J.
Clark
 a,
Robert
Clough
b,
David
Boyle
a and
Richard D.
Handy
*a
a,
Robert
Clough
b,
David
Boyle
a and
Richard D.
Handy
*a
aSchool of Biological and Marine Sciences, University of Plymouth, Plymouth, UK. E-mail: r.handy@plymouth.ac.uk
bAnalytical Research Facility, School of Geography, Earth and Environmental Sciences, University of Plymouth, Plymouth, UK
First published on 11th October 2019
Abstract
To determine bioaccumulation potential, suitable methods to extract and quantify engineered nanomaterials (ENMs) from fish tissues are required. The aim was to develop single particle inductively coupled plasma mass spectrometry (spICP-MS) protocols for liver tissue from rainbow trout and to assess the suitability of enzymatic (proteinase K) and alkali (tetramethylammonium hydroxide; TMAH) methods of extraction. A total of four different extractants were used: proteinase K or TMAH both with/without CaCl2. Spike recovery tests using equal mass concentrations (50 ng L−1 of Ag) as silver nanoparticles (Ag NPs) or AgNO3 were conducted. Extractants alone spiked with Ag NPs showed recovery similar to ultrapure deionised water (95–105%). However, the TMAH alone caused AgNO3 to precipitate and was not a suitable extractant. A second series of experiments looked at spike recovery on liver tissue samples. Proteinase K, with or without CaCl2, failed to completely digest the tissues. Only TMAH + CaCl2 demonstrated the ability to solubilise the liver. Ag NPs spiked onto liver tissues and analysed 24 h later, also showed no significant change in particle size distribution or particle mass concentration compared to those freshly spiked without liver present. The particle number concentration fell significantly to around 80% of the freshly spiked Ag NPs. Samples from an in vivo dietary study where fish were fed nominally 100 mg kg−1 Ag as either AgNO3 or Ag NPs were analysed to demonstrate the utility of the method. There was no significant difference between the particle number concentration, mean particle size or particle mass concentration between the in vivo AgNO3 and Ag NP treatment liver tissues. For example, the particle number concentrations were 68.3 ± 33.1 and 76.9 ± 51.6 × 10⁹ particle per g dw liver in the AgNO3 and Ag NPs, respectively. In conclusion, a TMAH + CaCl2 extraction method was developed with good recovery and utility for detecting Ag NPs from in vivo exposures of trout liver.
Environmental significanceRobust methods to quantitatively detect particulate forms of engineered nanomaterial in fish tissues are needed for environmental risk assessment and food safety. This study describes an extraction method for fish liver that enables the detection of silver nanoparticles without altering the dissolved or particulate fractions in the sample. Of the extraction methods explored, only an alkali extraction using tetramethylammonium hydroxide (TMAH) with 5 mmol L−1 calcium chloride did not cause artefacts or dissolved silver interferences. This method was then applied to quantify biologically incorporated Ag in fish livers. Particles were readily detected in the livers of fish previously exposed to silver nitrate or silver nanoparticles via the diet in vivo. |
Introduction
The toxicity of metal-containing ENMs has been demonstrated in fish and other aquatic organisms (reviews,1,2). However, metallic ENMs can sometimes partially dissolve in the environment and aquatic organisms may take up the substance in the particulate form, as a dissolved metal, or both.1 Silver is especially of concern as it is one of the most toxic elements to aquatic species.3 There is also the potential for the dissolution of metallic ENMs inside the tissues of the test organism and a central question for a hazard assessment is whether the toxicity arises from the physical presence of the particles themselves or metal ions released from them. There is also a lack of suitable techniques for the routine environmental monitoring of ENMs in biota,4 or to determine the bioaccumulation potential of particulate forms in fish.5The available methods for detecting and characterising ENMs in environmental samples have been documented (reviews,6–8). For tissue samples, the approaches for metallic particles have been mainly concerned with the in situ detection of the presence or absence of particles, such as scanning electron microscopy coupled with energy dispersive X-ray measurements (EDX) for elemental composition.9 Coherent anti-Stokes Raman scattering (CARS) microscopy has also been used to identify metallic ENMs in or on fish gills.10 While such methods can successfully identify ENMs in cells, microscopy is often only semi-quantitative and laborious. Alternative approaches include attempts to extract the ENM from the tissue into liquid samples. For example, toluene extraction of C60 from Daphnia magna,11 or acid-extraction of (acid resistant) TiO2 NPs from fish tissues.12 However, any subsequent effort to quantify the particle number concentration or size distribution in the extracted sample by light scattering methods (e.g., nanoparticle tracking analysis, NTA) is problematic because of the corrosive nature of the samples, interferences from other colloids in the sample, and/or the modest detection limits for light scattering methods (around 10 mg L−1, see ref. 9).
The development of single particle inductively coupled plasma mass spectrometry (spICP-MS), has allowed the measurement of both particle number concentration and particle size distributions in liquid samples. The approach relies on aspirating a dispersion of intact particles into the plasma of the ICP-MS instrument. The extremely high temperature (5000–10![[thin space (1/6-em)]](https://www.rsc.org/images/entities/char_2009.gif) 000 K) of the plasma atomises each particle to produce an ion ‘cloud’, which in theory, arrives at the detector together (i.e., within one time period or dwell time). The resulting signal is proportional to the size of the particle atomised, and the signal frequency magnitude is proportional to the number of particles in the sample.13 The spICP-MS technique was first demonstrated in ultrapure water14 and has been used to demonstrate its capability to detect silver nanoparticles in ultrapure water.15 The technique has also been applied to tissues of animals16 and plants materials (tomato plants,17 rice plants,18).
000 K) of the plasma atomises each particle to produce an ion ‘cloud’, which in theory, arrives at the detector together (i.e., within one time period or dwell time). The resulting signal is proportional to the size of the particle atomised, and the signal frequency magnitude is proportional to the number of particles in the sample.13 The spICP-MS technique was first demonstrated in ultrapure water14 and has been used to demonstrate its capability to detect silver nanoparticles in ultrapure water.15 The technique has also been applied to tissues of animals16 and plants materials (tomato plants,17 rice plants,18).
However, these methods have not been applied to fish tissue. The determination of ENMs in fish is crucially important for environmental regulation, and currently there is no validated method for ENM detection to support mandatory bioaccumulation testing,5 for environmental monitoring, or the food safety of edible fish. Furthermore, to gain regulatory acceptance, any method would need to be robust and simple, preferably without multiple steps in digestion procedures or expensive reagents. There are two approaches that have been reported for animal tissues, and neither has been applied to trout. The first is a strong alkali digestion, using tetramethylammonium hydroxide (TMAH) to extract Ag NPs and Au NPs from Daphnia after waterborne exposure to these ENMs followed by the measurement of particle size distributions.19 The second approach used an enzymatic digestion with proteinase K to extract Ag NPs which had been spiked into a chicken meat matrix; with subsequent analysis by spICP-MS.20 However, organisms contain both particulate and dissolved fractions of metals in their tissues following an ENM exposure,1,21 but the reports so far on tissue extraction methods for ENMs have not assessed the suitability of extractants to remove the dissolved metal in the tissue, without causing any changes to the sample. For example, the precipitation of ‘dissolved’ metal species to make new particulates in the tissue, and/or altered dissolution of the original ENM. Such changes could result in false positives, where particles from the dissolved metal are apparently detected, and not part of the original ENM dose inside the tissue. However, there are some additional technical challenges to overcome to routinely apply either method to determine Ag NPs in fish tissues. Firstly, exposure to Ag NPs at environmentally-relevant concentrations result in a modest bioavailability (typically a few percent of the exposure dose,22), and a key challenge is to routinely detect low concentrations (e.g., ng g−1) of Ag NPs in fish without suffering interferences from the chemical matrix of the sample. Secondly, fish have a ‘naturally’ occurring background of dissolved Ag in the tissue of around 1 μg g−1 dry weight or less,23 and this will influence both the detection limit and the minimum particle size that can be determined by spICP-MS. Finally, since there are no certified reference tissue samples for ENMs in fish tissues, spike recovery tests must be used for quality control; but spike-recovery test with dissolved silver (e.g., silver nitrate) may not represent the recovery of the nano form.
The present study aimed to tackle these challenges and to develop a robust, but simple method to extract Ag NPs from fish tissues, using modified versions of the proteinase K or TMAH digestions outlined above to determine the particle number concentration, particle mass concentration and particle size distributions in liver tissue from rainbow trout by spICP-MS. The specific objectives included spiking different extractants with either Ag NPs or AgNO3 to determine the effect of the digestion matrix on the detection of each form of Ag. Then, experiments were performed by spiking normal liver tissues prior to extraction in order to investigate the procedural recovery of the entire protocol. Finally, attempts were made to establish the dissolved versus nanoparticulate fractions of Ag from fish livers that had been previously exposed in vivo to either AgNO3 or Ag NPs via the diet.24 These latter measurements aimed at determining if the method could detect ‘biologically incorporated’ Ag NPs in a tissue sample compared to artificial processes of directly spiking liver samples with Ag NPs. It also enabled some appreciation of the likely ratio of dissolved to particulate silver in exposed fish in vivo.
Methods
Reagents, materials and nanomaterial characterisation
Reagents were analytical grade or higher (proteinase K [lyophilized powder from Tritirachium album], TMAH [25% in H2O], calcium chloride, Triton X-100, calcium acetate, Tris buffer, Primar Plus grade nitric acid [Fisher, UK]) and were obtained from Sigma-Aldrich (UK). High purity water (HPW) was used throughout (18.2 MΩ cm; Elga Ltd, UK). The Ag NPs were obtained from Applied Nanoparticles (Barcelona, Spain) and the characterisation of the same batch used here has been reported elsewhere.22 Briefly, the manufacturer's specifications were a primary particle diameter of 50 nm diameter and a mass concentration of 10.4 mg Ag mL−1 suspended in 5.5 mmol L−1 of sodium citrate and 25 μmol L−1 tannic acid. Measurements were made at Plymouth University to confirm the composition of the stock. The measured total Ag concentration in the stock supplied by the manufacturer at the time of these experiments was 9.5 ± 0.4 mg mL−1 and the original primary particle size measured by transmission electron microscopy (TEM) was 56 ± 9 nm (mean ± S.D., n = 120). A working suspension of 1 mg L−1 Ag NPs was freshly made daily before use (see below). Gold nanoparticles (Au NPs) were used for reference to help optimise the initial settings of the spICP-MS and were obtained from BBI Solutions (UK), with a nominal size of 60 nm at a total Au concentration of 56.8 mg L−1 in HPW. The Au NPs were prepared for TEM by taking 1 mL of the stock suspension into a 2 mL centrifuge tube (Eppendorf, UK), then centrifuged at 13000 rpm for 20 minutes. After this, the supernatant was removed, and 20 μL sample was used for TEM analysis. The primary particle diameter of the Au NPs was confirmed by TEM as 59 ± 6 nm (mean ± S.D., n = 100) and the mass concentration of total Au as 49.4 mg L−1 by acid digestion and then analysis by ICP-MS. A commercially available dissolved Ag standard (QMX Laboratories Ltd, UK) at a concentration of 1000 ± 5 μg mL−1 in 2% HNO3 was used for routine instrument calibration after dilution to appropriate concentrations. All suspensions and solutions were prepared daily before use.
Animal husbandry and tissue collection
Rainbow trout (Oncorhynchus mykiss) weighing ∼150 g were obtained from Exmoor fisheries. Fish were kept in a recirculating system until sampling and fed a commercially available diet (Aller Futura, Kaliningrad, Russia). Liver tissue, as a key target organ for metals in fish, was selected for the analytical work. For liver tissue collection, normally healthy fish were euthanised by induced concussion followed by pithing of the brain (schedule 1 method in accordance with ethical approvals, Home Office, UK and in compliance with the EU directive 2010/63/EU). An in vivo study (below) was also under ethical approval as outlined above and is described in detail elsewhere.24Trace amounts of Ag was present in the normal animal diet. Batches of the food pellets were digested in primer plus grade nitric acid, diluted and analysed using ICP-MS,5 with a total Ag concentration in the animal feed of 0.52 ± 0.02 μg g−1 dw (mean ± S.E.M., n = 5). Livers were also collected from juvenile rainbow trout that had been subject to a dietary exposure in vivo to food containing no added Ag (control) or 100 mg kg−1 Ag as either AgNO3 or Ag NPs (see ref. 24). The animals were fed a 2% ration and the Ag was applied to the food as a ‘top dressing’ to a commercially available diet (i.e., the control diet).24 Livers were collected at week 2 of the exposure for spICP-MS.
Experimental work
Initial experiments were aimed at optimising the ICP-MS instrument for the detection of particle suspensions in HPW. For this initial work, 25 ng L−1 dispersions of the Au NPs were used for reference and to calculate instrument transport efficiency measurements (see below) for Ag NP experiments. Initial Ag NP experiments involved observing the effect of different dispersion concentrations on the measured particle number concentration and particle size distribution. This allowed optimum concentration, where double particle events do not occur (i.e., 2 particle entering the plasma at the same time), of 50 ng L−1 for Ag NPs to be found.The next series of experiments were conducted to assess the stability of either AgNO3 or Ag NPs in solutions of the two extractants under study, namely proteinase K or TMAH. The proteinase K extractant was prepared as previously reported,20 but with minor modifications. A digestion buffer was made containing 10 mmol L−1 Tris buffer, 1% Triton X-100 and 1 mmol L−1 calcium acetate and adjusted to pH of 9.5 with NaOH. A working stock solution of proteinase K (one unit will hydrolyse urea-denatured haemoglobin to produce colour equivalent to 1.0 μmole of tyrosine per min at pH 7.5 and at 37 °C) was also prepared by dissolving 6 mg of proteinase K in 1 mL of HPW. Subsequently, 0.57 mL of this solution was added to 4 mL of the digestion buffer, giving a final proteinase K activity of 3.74 units per mL. The manufacturers recommend a different approach which was also followed. Therefore, a solution of proteinase K (1 mg mL−1) was added to 5 mmol L−1 CaCl2 with 50 mmol L−1 Tris-HCl and the pH adjusted to pH 8.
To assess the stability of AgNO3 or Ag NPs in TMAH, 2 mL of 25% TMAH was added to a 15 mL centrifuge tube and 50 μL of 100 μg L−1 Ag NP stock added to give a final total Ag concentration of 2.5 μg L−1. The effect of added CaCl2 on the stability was also examined by adding 0.4 mL of a 25 mmol L−1 CaCl2 solution to separate 1.6 mL aliquots of TMAH. The samples of Ag-spiked matrix were immediately vortexed for 1 min and then diluted 50-fold using HPW to a final concentration of 50 ng L−1 before analysis by spICP-MS. Separate samples were also spiked with 50 μL of 100 μg L−1 Ag as silver nitrate for comparison in exactly the same way. To measure the within sample variability, a relevant selected sample was measured five consecutive times, and to determine between sample variability, measurements on at least five independently prepared samples were made.
The suitability of proteinase K, proteinase K + CaCl2, TMAH and TMAH + CaCl2 solutions (prepared as above) for digesting fish livers was also assessed. Using approximately 50 mg (dry weight) of fish liver accurately weighed into a 15 mL centrifuge tube. For both proteinase K extraction protocols, 4 mL of extraction buffer was added to the tissue. The samples were vortexed for 1 min, sonicated for 5 min (FB15048 ultrasonic bath, 35 W, Thermo Fisher) and then incubated in a water bath at 35 °C for 3 hours.20 For the TMAH-based extractions, 2 mL of extractant was added to the fish liver and vortexed for 1 min and the samples were left in the dark at room temperature for 24 h.
To investigate the overall procedural recovery of the entire digestion plus the measurement protocol, normal liver tissues were spiked with either AgNO3 or Ag NPs. Only the TMAH + CaCl2 extractant was used for these experiments as the results obtained for the three other extractants were unsatisfactory. The 50 mg dry weight of liver tissue, plus the 2 mL of extraction solution was fortified with 50 μL of 100 μg L−1 Ag as Ag NPs or AgNO3. The samples were left in the dark at room temperature for 24 hours before being diluted 50-fold with HPW and analysed using spICP-MS (see below).
The final experiment involved liver tissue from week 2 of an in vivo dietary exposure.24 Fish (n = 6/treatment) were euthanised with an overdose of buffered (NaHCO3) MS222 and pithing to destroy the brain (schedule 1), following which the liver was carefully removed, weighed, and then freeze dried. The resulting tissue was cut in half (as reported in Clark et al.24) and the sub-sample weighed (∼25 mg) and digested using the optimised TMAH + CaCl2 protocol, and the extract analysed using spICP-MS. This latter experiment was aimed at determining if the method could detect ‘biologically incorporated’ Ag NPs in a tissue sample compared to the artificial process of directly spiking liver samples with Ag NPs. It also provided an opportunity to measure the dissolved versus nanoparticulate fractions of Ag from fish livers that had been previously exposed in vivo.
Instrumentation
An iCAP RQ ICP-MS instrument (Thermo Fisher) was operated in collision cell mode with He as the cell gas. Sample introduction was via a micromist nebuliser (400 μL min−1 uptake rate, Glass Expansion, Australia) and quartz cyclonic spray chamber cooled to 2 °C. The plasma power was 1550 Watts and the plasma, nebulizer and auxiliary Ar flow rates were 14.0, 1.0 and 0.8 L min−1. A nickel plated sampler and high matrix skimmer cones were used throughout this work. A dwell time of 3 ms was used throughout this work, and data acquisition time was 60 seconds. Before analysis, the ICP-MS was tuned such that it performed to the manufacturer's installation specifications using a multi-element solution (Ba, Bi, Ce, Co, Ho, In, Li, Mg, Ti, U and Y at 1 μg L−1) for optimal stability and sensitivity and a minimum oxide (CeO/Ce) formation of <0.01%. In spICP-MS, only one m/z ratio can be measured at a time. Silver has two isotopes (at nominal masses of 107 and 109 AMU), with the data presented here being for 107Ag. A solution of 4% HCl in 2% HNO3 was used as a wash for 60 seconds to ensure minimal carryover between samples. Daily before use the sample uptake flow rate was determined gravimetrically, by difference between the uptake of HPW over 2 min (n = 5) and remained between 0.2 and 0.3 mL min−1 in all experiments. The transport efficiency was calculated daily and according to Pace et al.25 The transport efficiency was calculated in each matrix used, as well as in ultrapure water (n = 5). The instrument was calibrated using 60 nm Au NPs spiked into a solution of whichever sample matrix was to be analysed. The calibration curves were produced using a series of dissolved Ag standards, ranging from 0 to 4 μg L−1, which were prepared in the appropriate sample matrix. Quality control measures of procedural blanks and check standards analysed every 10–15 samples were also included. The limit of detection (LOD) for determining particles in a sample was 3× the standard deviation of the procedural blank (n = 3; see ref. 21). The minimum particle size was calculated by using the minimum signal (333 CPS) in the Excel sheet,26 and equates to a 16 nm. All solution preparation and ICP-MS analyses were undertaken in a laboratory managed under an ISO 9001 certified quality management system.Data processing and statistics
For a 60 second time scan, with a dwell time of 3 ms, a total of 20000 data points are generated per sample. The raw data for each sample was exported from the instrument and entered into a bespoke Excel© spreadsheet which calculates the signal distribution (Fig. S1†) and particle size distribution (Fig. S2†). Full details of the spICP-MS approach and the calculations can be found in Peters et al.20 Previously, this spreadsheet has been used for spike recovery tests.20,27,28 The average transport efficiency of the Au NPs (n = 5) in the appropriate matrix was used for the calculations on the Ag spiked and unknown samples.
Statistical analysis was performed in SigmaPlot 13.0, unless otherwise specified. Data were checked for normality and equal variance (Shapiro–Wilk and Brown Forsythe tests, respectively). Statistical differences were highlighted using either a one-way ANOVA (between day variability and in vivo data) or a two-way ANOVA (between/within sample variation and matrix). The normality of the size distributions was checked using a Kolmogorov–Smirnov test (with and without the presence of liver, and spiked liver versus in vivo data) and was conducted in SPSS software.
Results and discussion
Analysis of Au NPs and Ag NPs in ultrapure water using spICP-MS
To assess whether ENMs could be sized accurately, the mean particle diameter of Au NPs and Ag NPs from spICP-MS were compared to those measured by TEM. The mean values of the Au NPs and Ag NPs (n = 100 and 122 particles, respectively) measured by TEM were 59 ± 6 and 56 ± 9 nm, respectively (Fig. S2†). The mean value of particle size using spICP-MS was 59 ± 0.1 and 57 ± 0.5 nm for the Au NPs and Ag NPs, respectively (n = 5 and 5, respectively). Generally, the two methods are comparable, giving similar information on particle size. Table S1† shows the particle number concentration and size measured on three consecutive days of independent sample preparation. There was no difference between the particle number concentrations, mean particle size or particle mass concentration reported on the three different days (one-way ANOVA, P > 0.05), demonstrating that the measurements were reproducible.Spiking silver nanoparticles and AgNO3 into extraction matrices alone
The aim of this experiment was to determine if the different extractants (i.e., TMAH or proteinase K digestions, with and without CaCl2) caused alterations to the form of silver when spiked with either Ag NPs or AgNO3. Data are presented as % recoveries of the expected particle mass concentration, particle number concentration and mean particle size based on the results by spICP-MS of the equivalent dispersions made in HPW rather than TEM analysis of the primary particle size distributions. The reason for doing this was that the measurement artefacts in TEM (e.g., dried samples, difficulty in seeing every individual particle) are not the same as those for spICP-MS (e.g., variability in sampling rate, the apparent dissolved metal background). Thus, with two different assumptions being made in the two detection procedures, it is preferable to use the particle distributions in ultrapure water by ICP-MS for reference (see discussion in Pace et al.).25The recovery of Ag NPs in the proteinase K extractant without additions of 5 mmol L−1 CaCl2 showed no appreciable loss of particle mass concentration, particle number concentration or mean particle size (96–103%; Table 1, Fig. 1). However, proteinase K in the presence of 5 mmol L−1 CaCl2 caused a significant increase in the apparent particle mass concentration (140–150%) and mean particle size (111–112%) compared to suspensions in deionised ultrapure water for within and between sample variation. Despite these changes, there was no change in the particle size distribution except more particles were found in higher bin sizes. The likely cause of this is particle agglomeration, resulting in multiple particles in each dwell time, which would affect the particle mass concentration and size, but not necessarily the particle number concentration. This effect was not observed in the proteinase K extractant in the absence of 5 mmol L−1 CaCl2 (Fig. 1). When AgNO3 was added to proteinase K in either the presence or absence of CaCl2, there was no unwanted reaction from the reagents (Fig. 2). Therefore, proteinase K in the presence or absence of 5 mmol L−1 CaCl2 is a suitable extractant that does not alter the Ag NPs or AgNO3.
| Extraction method | Form of silver | Sample type | Particle mass concentration (ng L−1) | % recovery | Coefficient of variation (%) | Mean particle number concentration L−1 (×106) | % recovery | Coefficient of variation (%) | Mean particle size (nm) | % recovery | Coefficient of variation (%) |
|---|---|---|---|---|---|---|---|---|---|---|---|
| Data are means ± S.D., n = 5. Recovery was based on the particle number concentration as measured in ultrapure deionised water at the same concentration suspension (50 ng L−1). The limit of detection was 12 particles per scan, which equates to 0.38 × 10⁶ particles per L. N/A indicates does not apply due to no particles detected (ND), or cannot be calculated as was a false positive (e.g. AgNO3 in TMAH only). Different uppercase letters denotes significant difference between same sample and silver type compared to different extraction method (two-way ANOVA or Kruskal–Wallis). Different lower case letters denote significant difference between sample types within the same form of silver (two-way ANOVA or Kruskal–Wallis). There was no significant difference in any measurements of the AgNO3 in TMAH (one-way ANOVA or Kruskal–Wallis). | |||||||||||
| High purity water | Ag NPs | Within sample | 47.66 ± 2.06Aa | 100 ± 4.32 | 4.32 | 45.1 ± 0.9Aa | 100 ± 1.98 | 1.98 | 57.21 ± 0.57Aa | 100 ± 1.00 | 1.00 |
| Between samples | 51.83 ± 2.90Ab | 100 ± 5.59 | 5.59 | 48.5 ± 1.9Aa | 100 ± 3.98 | 3.98 | 57.65 ± 0.53Aa | 100 ± 0.92 | 0.92 | ||
| AgNO3 | Within sample | ND | N/A | N/A | ND | N/A | N/A | ND | N/A | N/A | |
| Between samples | ND | N/A | N/A | ND | N/A | N/A | ND | N/A | N/A | ||
| Proteinase K (without CaCl2) | Ag NPs | Within sample | 49.48 ± 1.38Aa | 103.84 ± 2.89 | 2.78 | 45.4 ± 1.3Aa | 100.67 ± 2.86 | 2.84 | 58.29 ± 0.23Ba | 101.90 ± 0.41 | 0.40 |
| Between samples | 50.74 ± 1.66Aa | 97.90 ± 3.20 | 3.27 | 46.6 ± 1.3Aa | 96.15 ± 2.62 | 2.73 | 58.09 ± 0.20Ba | 100.00 ± 0.35 | 0.35 | ||
| AgNO3 | Within sample | ND | N/A | N/A | ND | N/A | N/A | ND | N/A | N/A | |
| Between samples | ND | N/A | N/A | ND | N/A | N/A | ND | N/A | N/A | ||
| Proteinase K (with 5 mmol L−1 CaCl2) | Ag NPs | Within sample | 70.79 ± 3.67Ba | 148.54 ± 7.71 | 5.19 | 47.0 ± 2.1Aa | 104.19 ± 4.59 | 4.40 | 64.58 ± 0.33Da | 112.89 ± 0.58 | 0.52 |
| Between samples | 72.87 ± 3.54Ba | 140.58 ± 6.83 | 4.86 | 48.7 ± 1.7Aa | 100.52 ± 3.42 | 3.40 | 64.38 ± 0.39Da | 111.68 ± 0.67 | 0.60 | ||
| AgNO3 | Within sample | ND | N/A | N/A | ND | N/A | N/A | ND | N/A | N/A | |
| Between samples | ND | N/A | N/A | ND | N/A | N/A | ND | N/A | N/A | ||
| TMAH (without CaCl2) | Ag NPs | Within sample | 50.16 ± 1.27Aa | 105.25 ± 2.66 | 2.66 | 44.3 ± 1.3Aa | 98.26 ± 2.84 | 2.89 | 59.06 ± 0.22Ca | 103.24 ± 0.38 | 0.37 |
| Between samples | 54.72 ± 3.75Ab | 105.58 ± 7.24 | 7.24 | 48.6 ± 4.6Aa | 100.32 ± 9.56 | 9.53 | 58.98 ± 0.51Ca | 102.30 ± 0.88 | 0.86 | ||
| AgNO3 | Within sample | 0.85 ± 0.11Aa | N/A | 13.52 | 3.0 ± 0.3Aa | N/A | 10.54 | 34.34 ± 0.25Aa | N/A | 0.73 | |
| Between samples | 0.67 ± 0.27Aa | N/A | 39.58 | 2.3 ± 0.7Aa | N/A | 33.25 | 34.04 ± 0.72Aa | N/A | 2.12 | ||
| TMAH (with 5 mmol L−1 CaCl2) | Ag NPs | Within sample | 51.04 ± 0.78Aa | 107.09 ± 1.65 | 1.54 | 44.8 ± 0.5Aa | 99.24 ± 1.12 | 1.13 | 59.05 ± 0.17Ca | 103.22 ± 0.31 | 0.30 |
| Between samples | 53.30 ± 2.08Aa | 102.83 ± 4.02 | 3.91 | 47.0 ± 1.6Aa | 96.86 ± 3.23 | 3.33 | 59.09 ± 0.11BCa | 102.50 ± 0.20 | 0.19 | ||
| AgNO3 | Within sample | ND | N/A | N/A | ND | N/A | N/A | ND | N/A | N/A | |
| Between samples | ND | N/A | N/A | ND | N/A | N/A | ND | N/A | N/A | ||
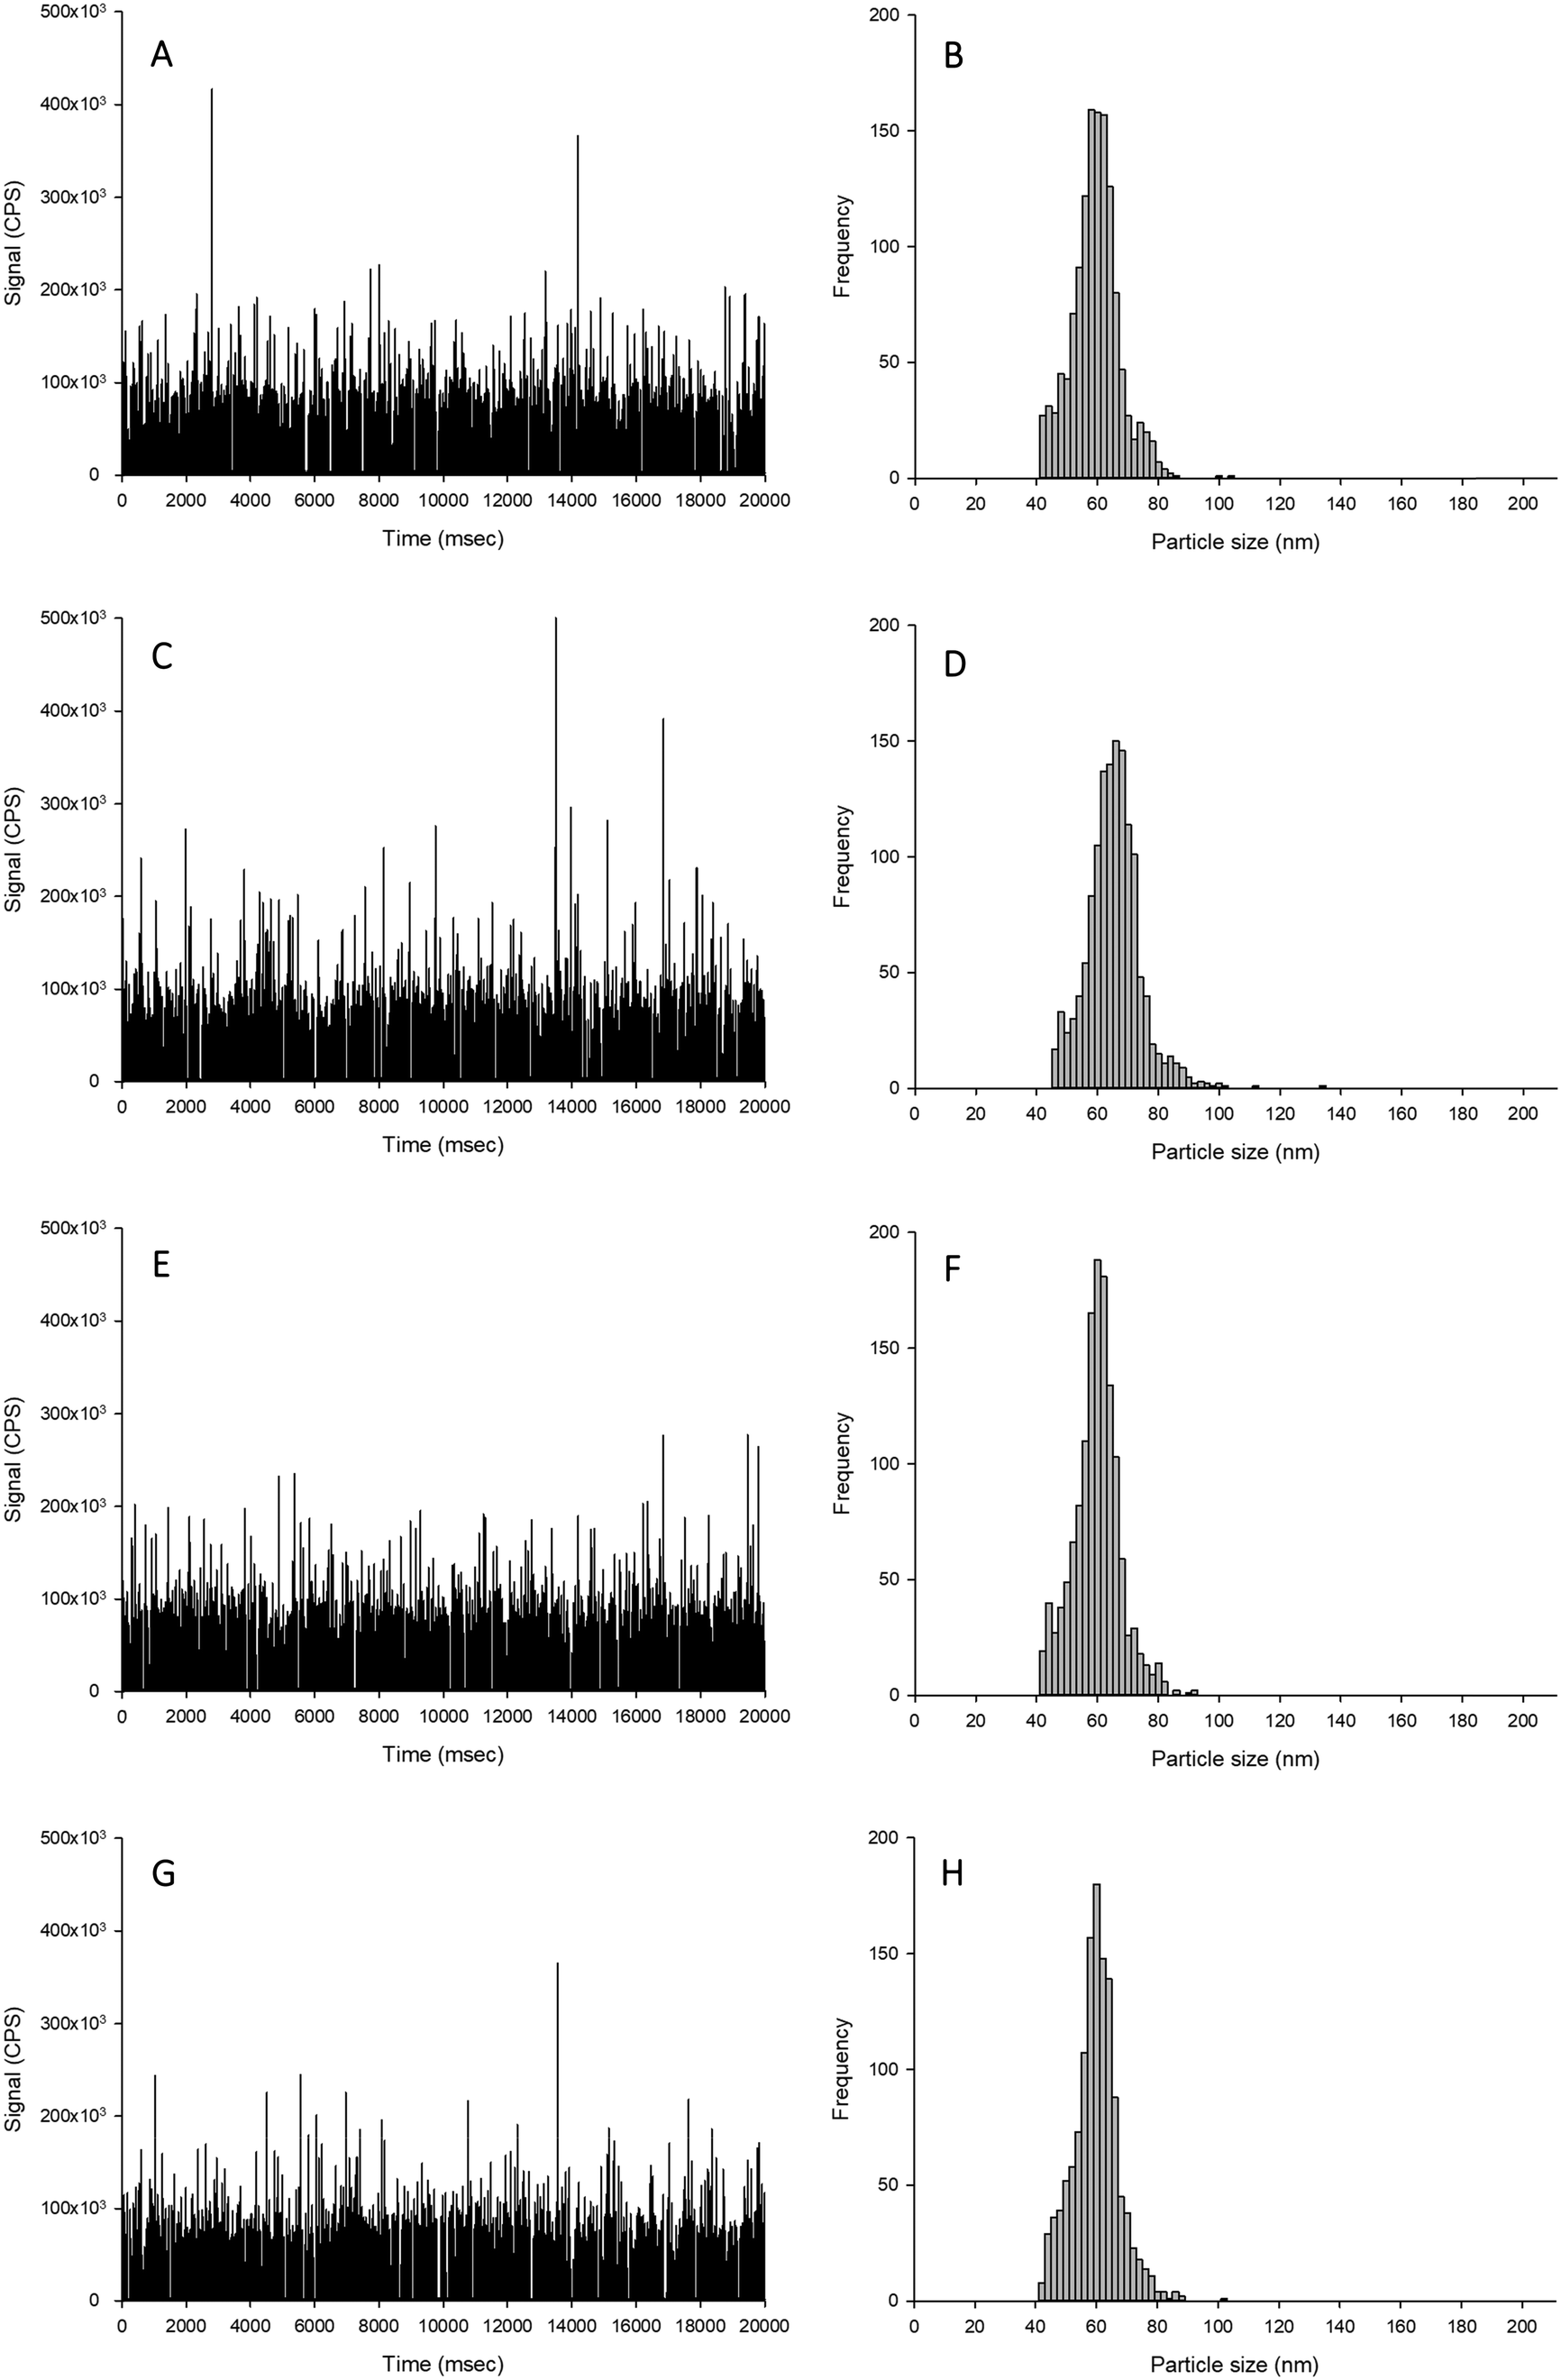 | ||
| Fig. 1 Example time scans (left panels) and size distributions (right panels) of Ag NPs spiked into proteinase K without CaCl2 (A and B), proteinase K with 5 mmol L−1 CaCl2 (C and D), TMAH without CaCl2 (E and F) or TMAH with 5 mmol L−1 CaCl2 (G and H). | ||
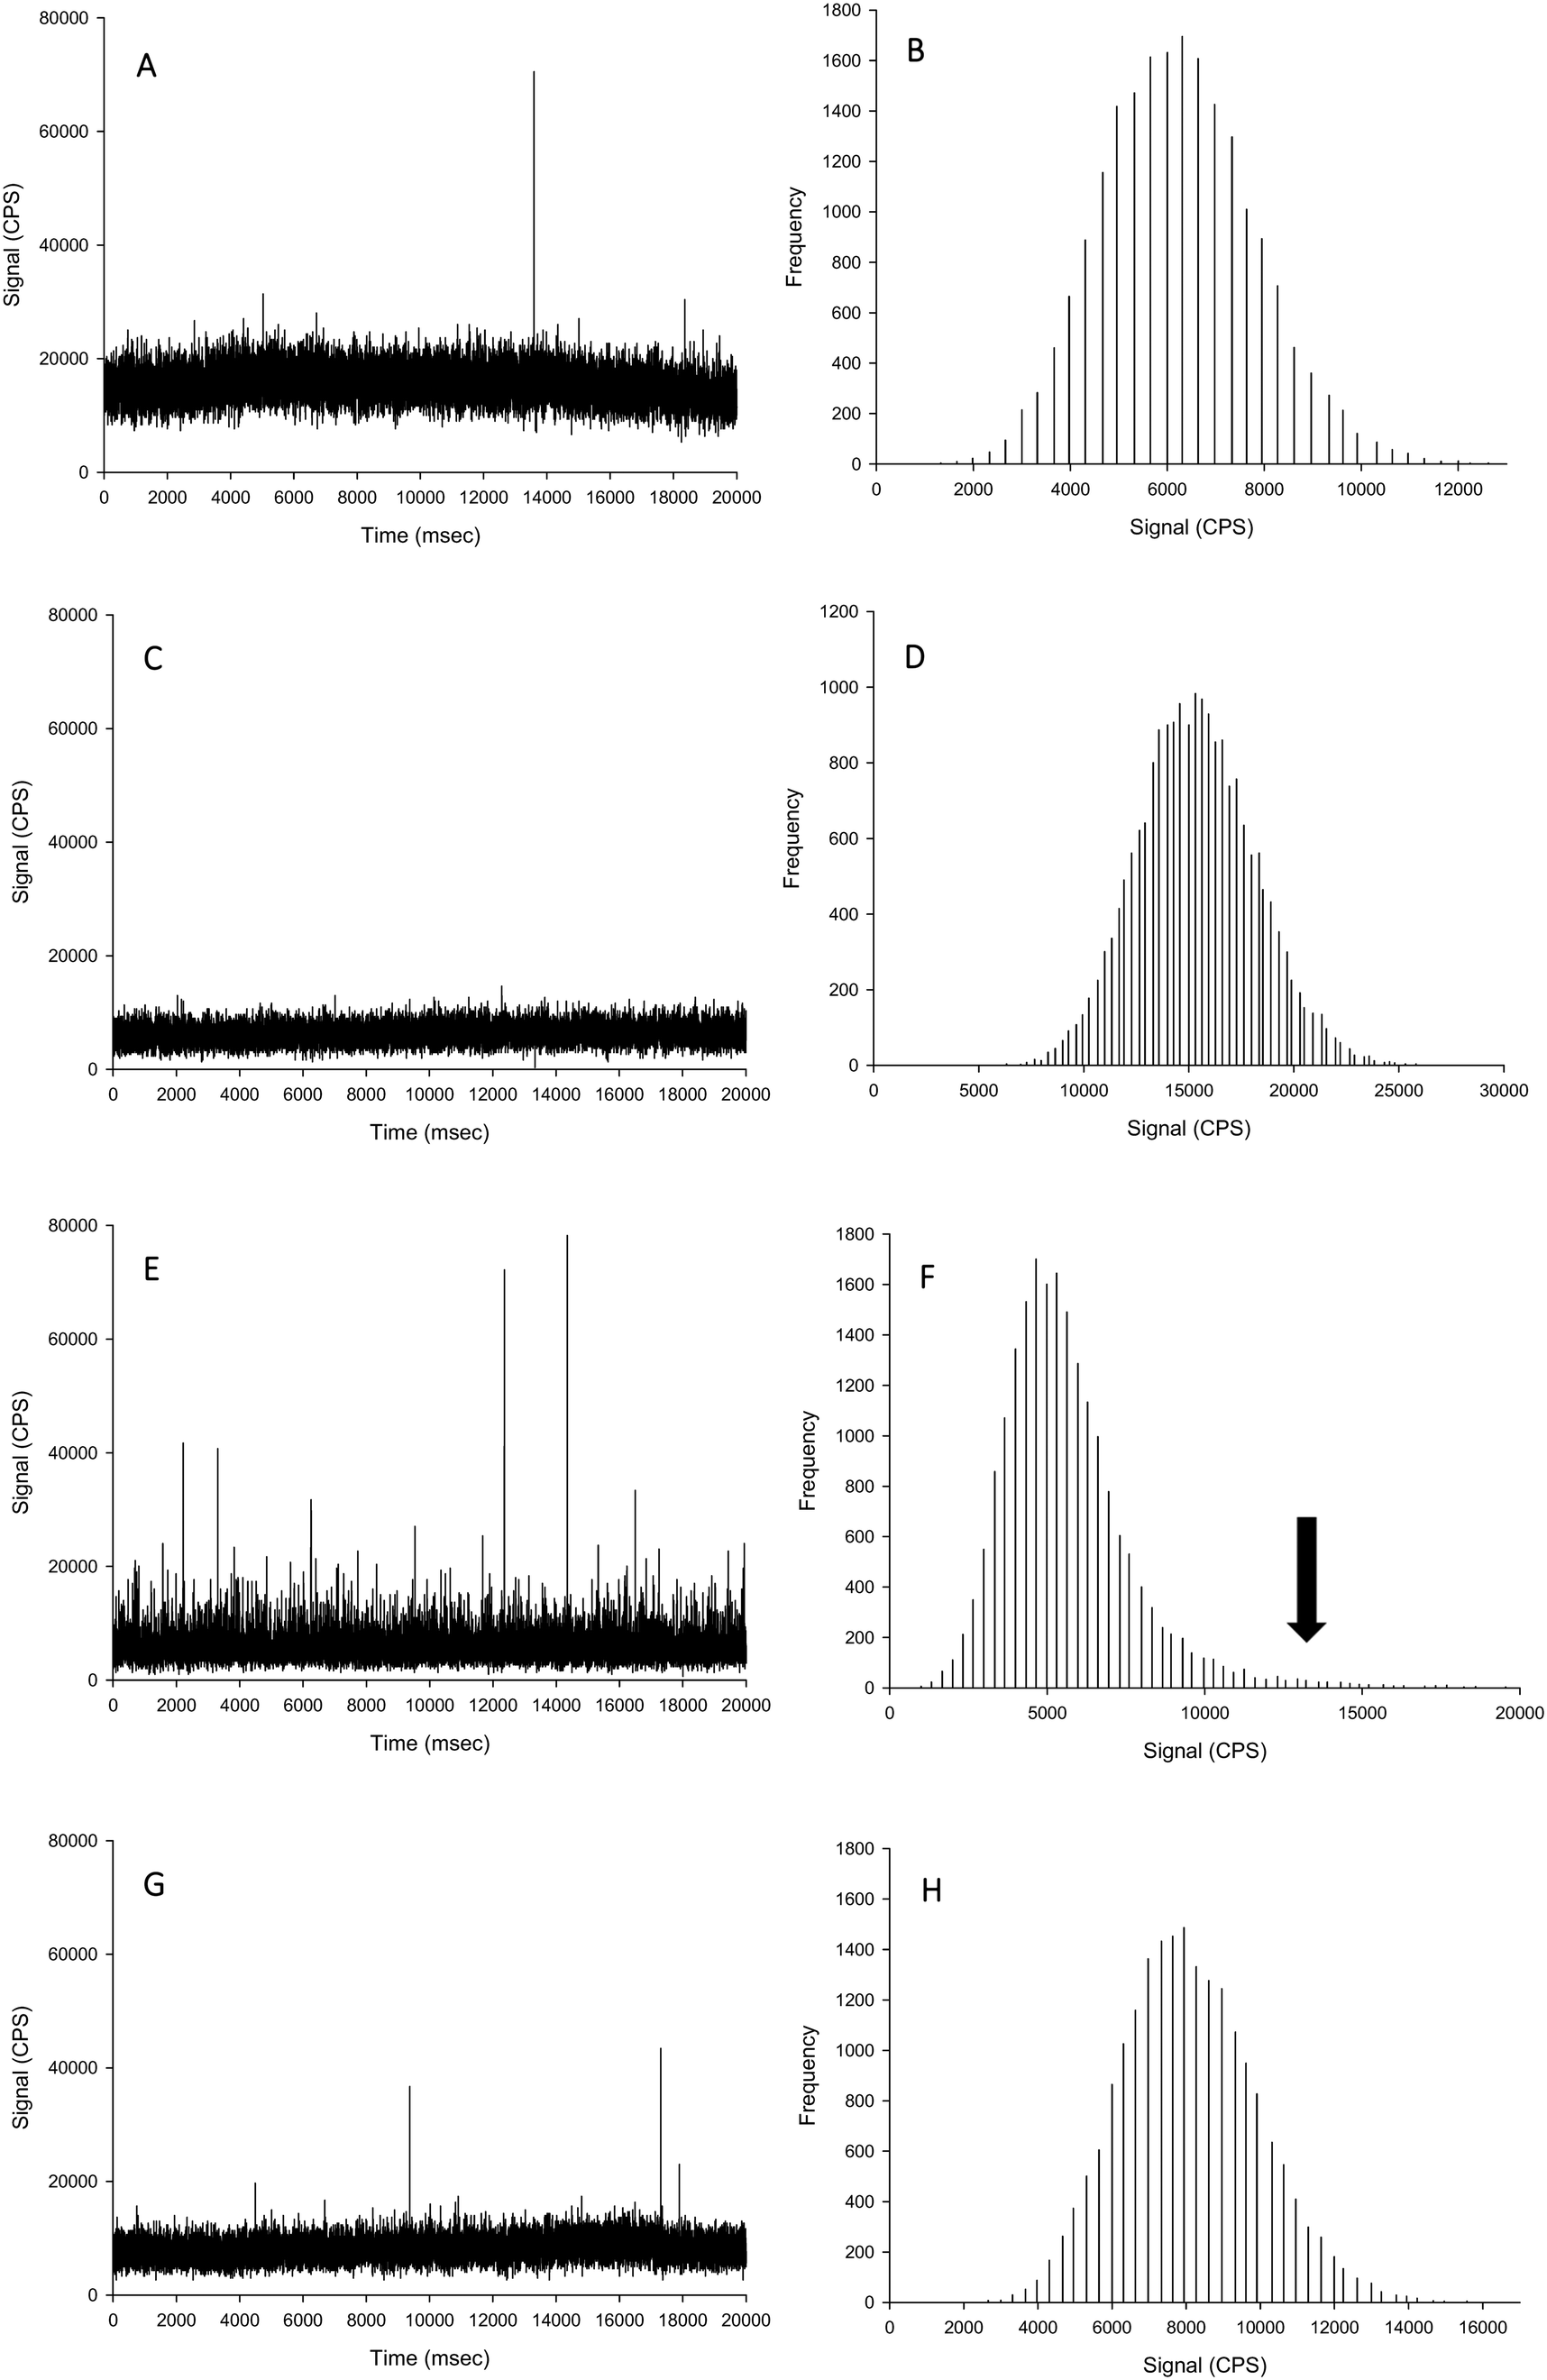 | ||
| Fig. 2 Example time scans (left panels) and signal distributions (right panels) of AgNO3 spiked into proteinase K without CaCl2 (A and B), proteinase K with 5 mmol L−1 CaCl2, (C and D), TMAH without CaCl2 (E and F), and TMAH with 5 mmol L−1 CaCl2 (G and H). Black arrow indicates loss of normal distribution through presence of particles being formed in TMAH matrix without the presence of chloride. | ||
For the TMAH digestion (without CaCl2), the particle mass concentration and particle number concentration recovery was within generally accepted limits of 100 ± 5%, and did not significantly differ from those measurements in ultrapure deionised (Table 1). However, there was a slight but significant increase in the mean particle size to 59 nm (two-way ANOVA, P < 0.001). When AgNO3 was spiked into TMAH, particle-like events were observed in the time scan (Table 1, Fig. 2). Of these particle-like events, there was no difference observed between the within and between sample variation (one-way ANOVA or Kruskal–Wallis, P > 0.05). Therefore, TMAH alone is not a suitable extractant when there is a potential background of dissolved Ag in the original sample (e.g. from particle dissolution or the incidental occurrence of dissolved silver salts in the original sample). The cause of this apparent particulate signal with TMAH is likely to be precipitation as Ag2O under the high pH conditions.29,30 The mechanism by which the addition of CaCl2 to the TMAH solution prevented particle like events from AgNO3 requires further investigation. The presence of TMAH at high pH with AgNO3 without added CaCl2 may promote the formation of AgOH and/or Ag2O species. However, the additional of more dissolved Cl− ions as CaCl2 might drive dissolved Ag+ to form complexes with the Cl− anion instead (e.g. AgCl2−), or perhaps complexes with TMAH such as [AgN(CH4)4]2+. Any competition between complex formations at high pH would depend on the reaction rate and stability constants for the Ag species involved. Further experiments, such as stripping voltammetry, may help verify this hypothesis, and is beyond the scope of the present study.
For the TMAH digestion in the presence of 5 mmol L−1 CaCl2, there was no effect on the between and within sample variation particle mass or particle number concentrations (Table 1). However, similarly for TMAH alone, there was a slight but statistically significant increase (∼103%) in the mean size particle, both between and within samples (two-way ANOVA, P < 0.001). This is within acceptable limits for the analysis of even dissolved metals in complex matrices (i.e., within 10%), and while acceptable limits of deviation for measurements with ENMs are not generally agreed,6 the percent deviation for an ‘ideal’ suspension by spICP-MS has been suggested to be 100 ± 25% or less.19 The results here (Table 1) for TMAH + CaCl2 are all within the suggested limit offered by Gray et al.19 When AgNO3 was spiked into the sample, there was no presence of particle-like events (Fig. 2, Table 1); therefore, TMAH in the presence of 5 mmol L−1 CaCl2 is a suitable extractant that will not alter the form of silver within the tissue.
Spiking silver nanoparticles on liver tissues
The proteinase K method, both in the absence and presence of 5 mmol L−1 CaCl2, was not suitable for breaking down the liver tissues, and resulted in only partially digested samples that could not be analysed. This is in contrast the previous studies with proteinase K with chicken meat.20 These differences in the proteinase K effect between fish liver and chicken meat are not organism specific per se because the mode of action of the enzyme is broad, cleaving the peptide bond adjacent to the carboxyl group on many aromatic amino acids. Instead, this difference between fish liver and chicken meat is likely explained by the composition of the tissues. Fish liver has a higher lipid content than lean chicken meat, and the matrix of the tissue seems to be important. For example, Shaw et al.12 found that Ti recovery from tissues exposed to TiO2 was dependent on the preparation method, tissue type and species of fish. Notably, they found that the use of the non-ionic surfactant, Triton X-100, improved the analyte recovery during the measurement phase of the protocol. Critically, resolving the proteinase K method for fish tissue would likely require additional digestion steps, such as the use of lipase to remove the lipid content or serial centrifugations with surfactants such as Triton X-100. Such an approach would be moving away from the goal of having a simple and robust method that could gain regulatory acceptance for bioaccumulation testing or environmental monitoring of wildlife. The use of lipase might also compromise any organic coatings on the surface of functionalized ENMs. Therefore, for reasons of utility, tests using proteinase K did not proceed any further.From the results presented, it is apparent that TMAH in the presence of 5 mmol L−1 CaCl2 was the only suitable extractant for Ag NPs contained within/on liver tissues. Spiking Ag NPs onto liver tissue that were left in the dark at room temperature for 24 h caused no appreciable change in particle size distribution compared to freshly spiked samples (Fig. 3). The results of the liver tissue spiking tests, where TMAH + CaCl2 was spiked with Ag NPs or AgNO3 in either the presence or absence of liver tissue and left for 24 h are shown (Table 2). The presence of liver tissue did not alter the particle mass concentration (two-way ANOVA, P > 0.05), or size distribution (Fig. 3). However, the presence of the liver did cause a significant decrease in mean particle number concentration and an increase in mean particle size, which suggests some settling and/or agglomeration occurred. For example, the between sample particle number concentration decreased from 47 to 36 × 106 particle per L in the absence and presence of liver, respectively (Table 2). Nonetheless, the coefficient of variation between samples was only 5% and within acceptable limits and the particle mass recovered was 100% (Table 2). Gray et al.19 spiked beef and Daphnia magna samples with Ag NPs in a TMAH matrix, and the recoveries found are also comparable to those reported here for fish.
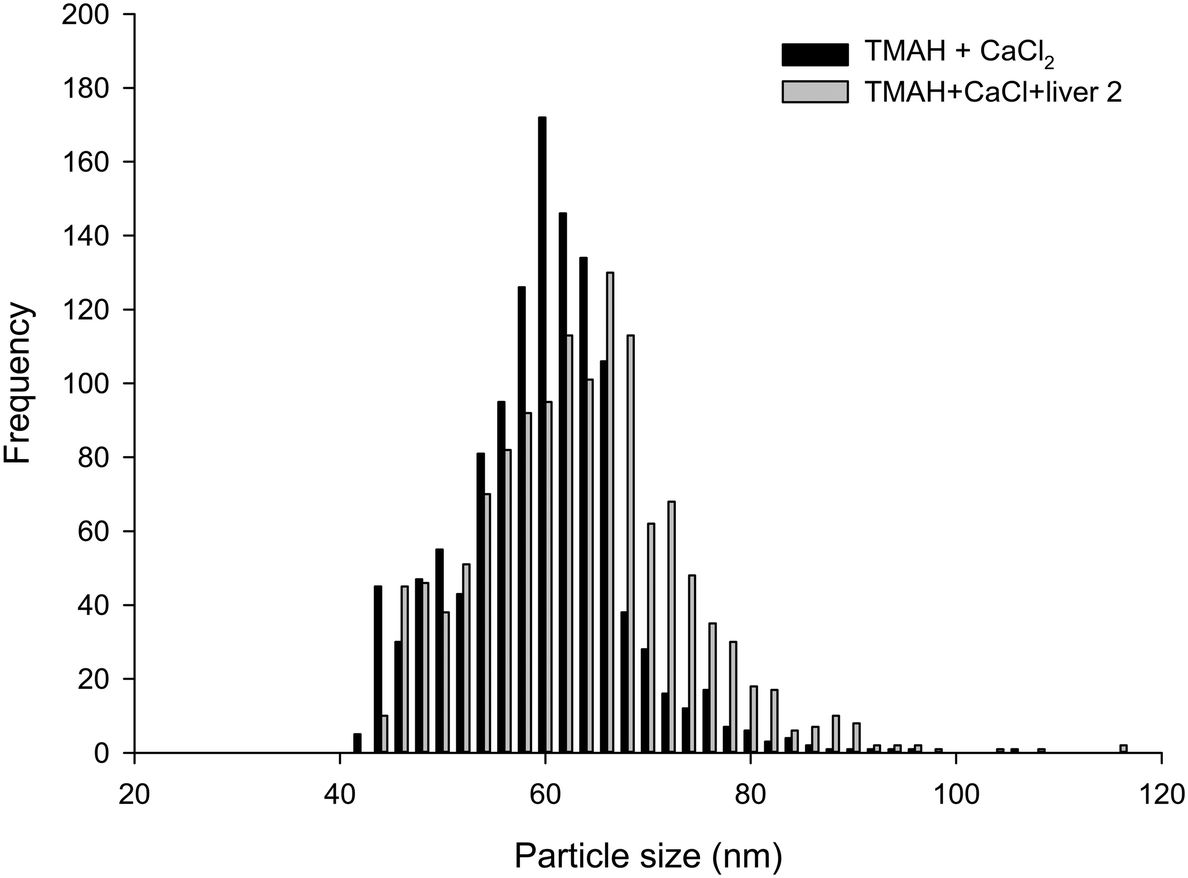 | ||
| Fig. 3 Example particle size distributions of Ag NPs in TMAH plus 5 mmol L−1 CaCl2 either freshly into the extraction matrix, or onto a piece of liver tissue and allowed to solubilise overnight (representing the extraction protocol). | ||
| TMAH + CaCl2 | Sample type | Particle mass concentration (ng L−1) | % recovery | Coefficient of variation (%) | Mean particle number concentration L−1 (×106) | % recovery | Coefficient of variation (%) | Mean particle size (nm) | % recovery | Coefficient of variation (%) |
|---|---|---|---|---|---|---|---|---|---|---|
| Data are means ± S.D., n = 5. Recovery was based on the particle number concentration as measured in freshly spiked TMAH + 5 mmol L−1 CaCl2 at the same Ag concentration solution (50 ng L−1). No particles were detected in both AgNO3 treatments (ND). Different upper case letters denote statistical difference between the presence and absence of liver tissue with TMAH + 5 mmol L−1 CaCl2 matrix within the same sample type (two-way ANOVA or Kruskal–Wallis). Different lower case letters denote statistical difference between sample types (two-way ANOVA or Kruskal–Wallis). | ||||||||||
| Spiked with Ag NPs | Within sample | 49.07 ± 2.49Aa | 96.14 ± 4.88 | 5.07 | 41.2 ± 1.8Aa | 91.93 ± 4.06 | 4.42 | 59.30 ± 0.18Aa | 100.43 ± 0.30 | 0.30 |
| Between samples | 52.98 ± 2.36Aa | 99.40 ± 4.43 | 4.45 | 46.8 ± 4.9Ab | 99.57 ± 10.39 | 10.44 | 59.26 ± 0.45Aa | 100.28 ± 0.77 | 0.77 | |
| Spiked with AgNO3 | Within sample | ND | N/A | N/A | ND | N/A | N/A | ND | N/A | N/A |
| Between samples | ND | N/A | N/A | ND | N/A | N/A | ND | N/A | N/A | |
| Liver spiked with Ag NPs | Within sample | 54.60 ± 2.03Aa | 106.98 ± 3.98 | 3.72 | 37.6 ± 1.2Ba | 83.96 ± 2.95 | 3.15 | 63.42 ± 0.65Aa | 107.41 ± 1.10 | 1.03 |
| Between samples | 53.38 ± 4.85Aa | 100.15 ± 9.11 | 9.09 | 36.0 ± 2.0Ba | 76.77 ± 5.58 | 5.58 | 63.46 ± 1.81Ba | 107.39 ± 3.06 | 2.85 | |
| Liver spiked with AgNO3 | Within sample | ND | N/A | N/A | ND | N/A | N/A | ND | N/A | N/A |
| Between samples | ND | N/A | N/A | ND | N/A | N/A | ND | N/A | N/A | |
Extraction methods for tissue samples containing biologically incorporated silver
The challenge for determining the Ag NP particle number concentration in tissues that had been exposed in vivo is that the tissue may contain an incidental natural concentration of silver (forms unknown) acquired from trace amounts of silver in the ingredients such as fish meal used to make the animal feed. Thus, any extraction protocol with subsequent spICP-MS would need to be able to extract and detect both any apparent dissolved Ag and particulate Ag in the tissue; and to do that without causing changes in the ratio of dissolved to particulate metal in the sample. It is also important to understand the composition of the unexposed control tissue samples (i.e., normal fish tissue) in order to interpret the tissue samples from animals exposed to AgNO3 or Ag NPs. The livers of unexposed control fish had some incidental particulate silver above the LOD threshold (1.5 × 10⁶ particles per g tissue dw), but most of the silver in the control fish was in the dissolved form as evidenced by the intense signal band up to around 5000 CPS (Fig. 4A). The particles in the control liver equated to around 7 × 10⁶ particle per g dw tissue, which was 10000-fold lower compared to the exposed tissues.
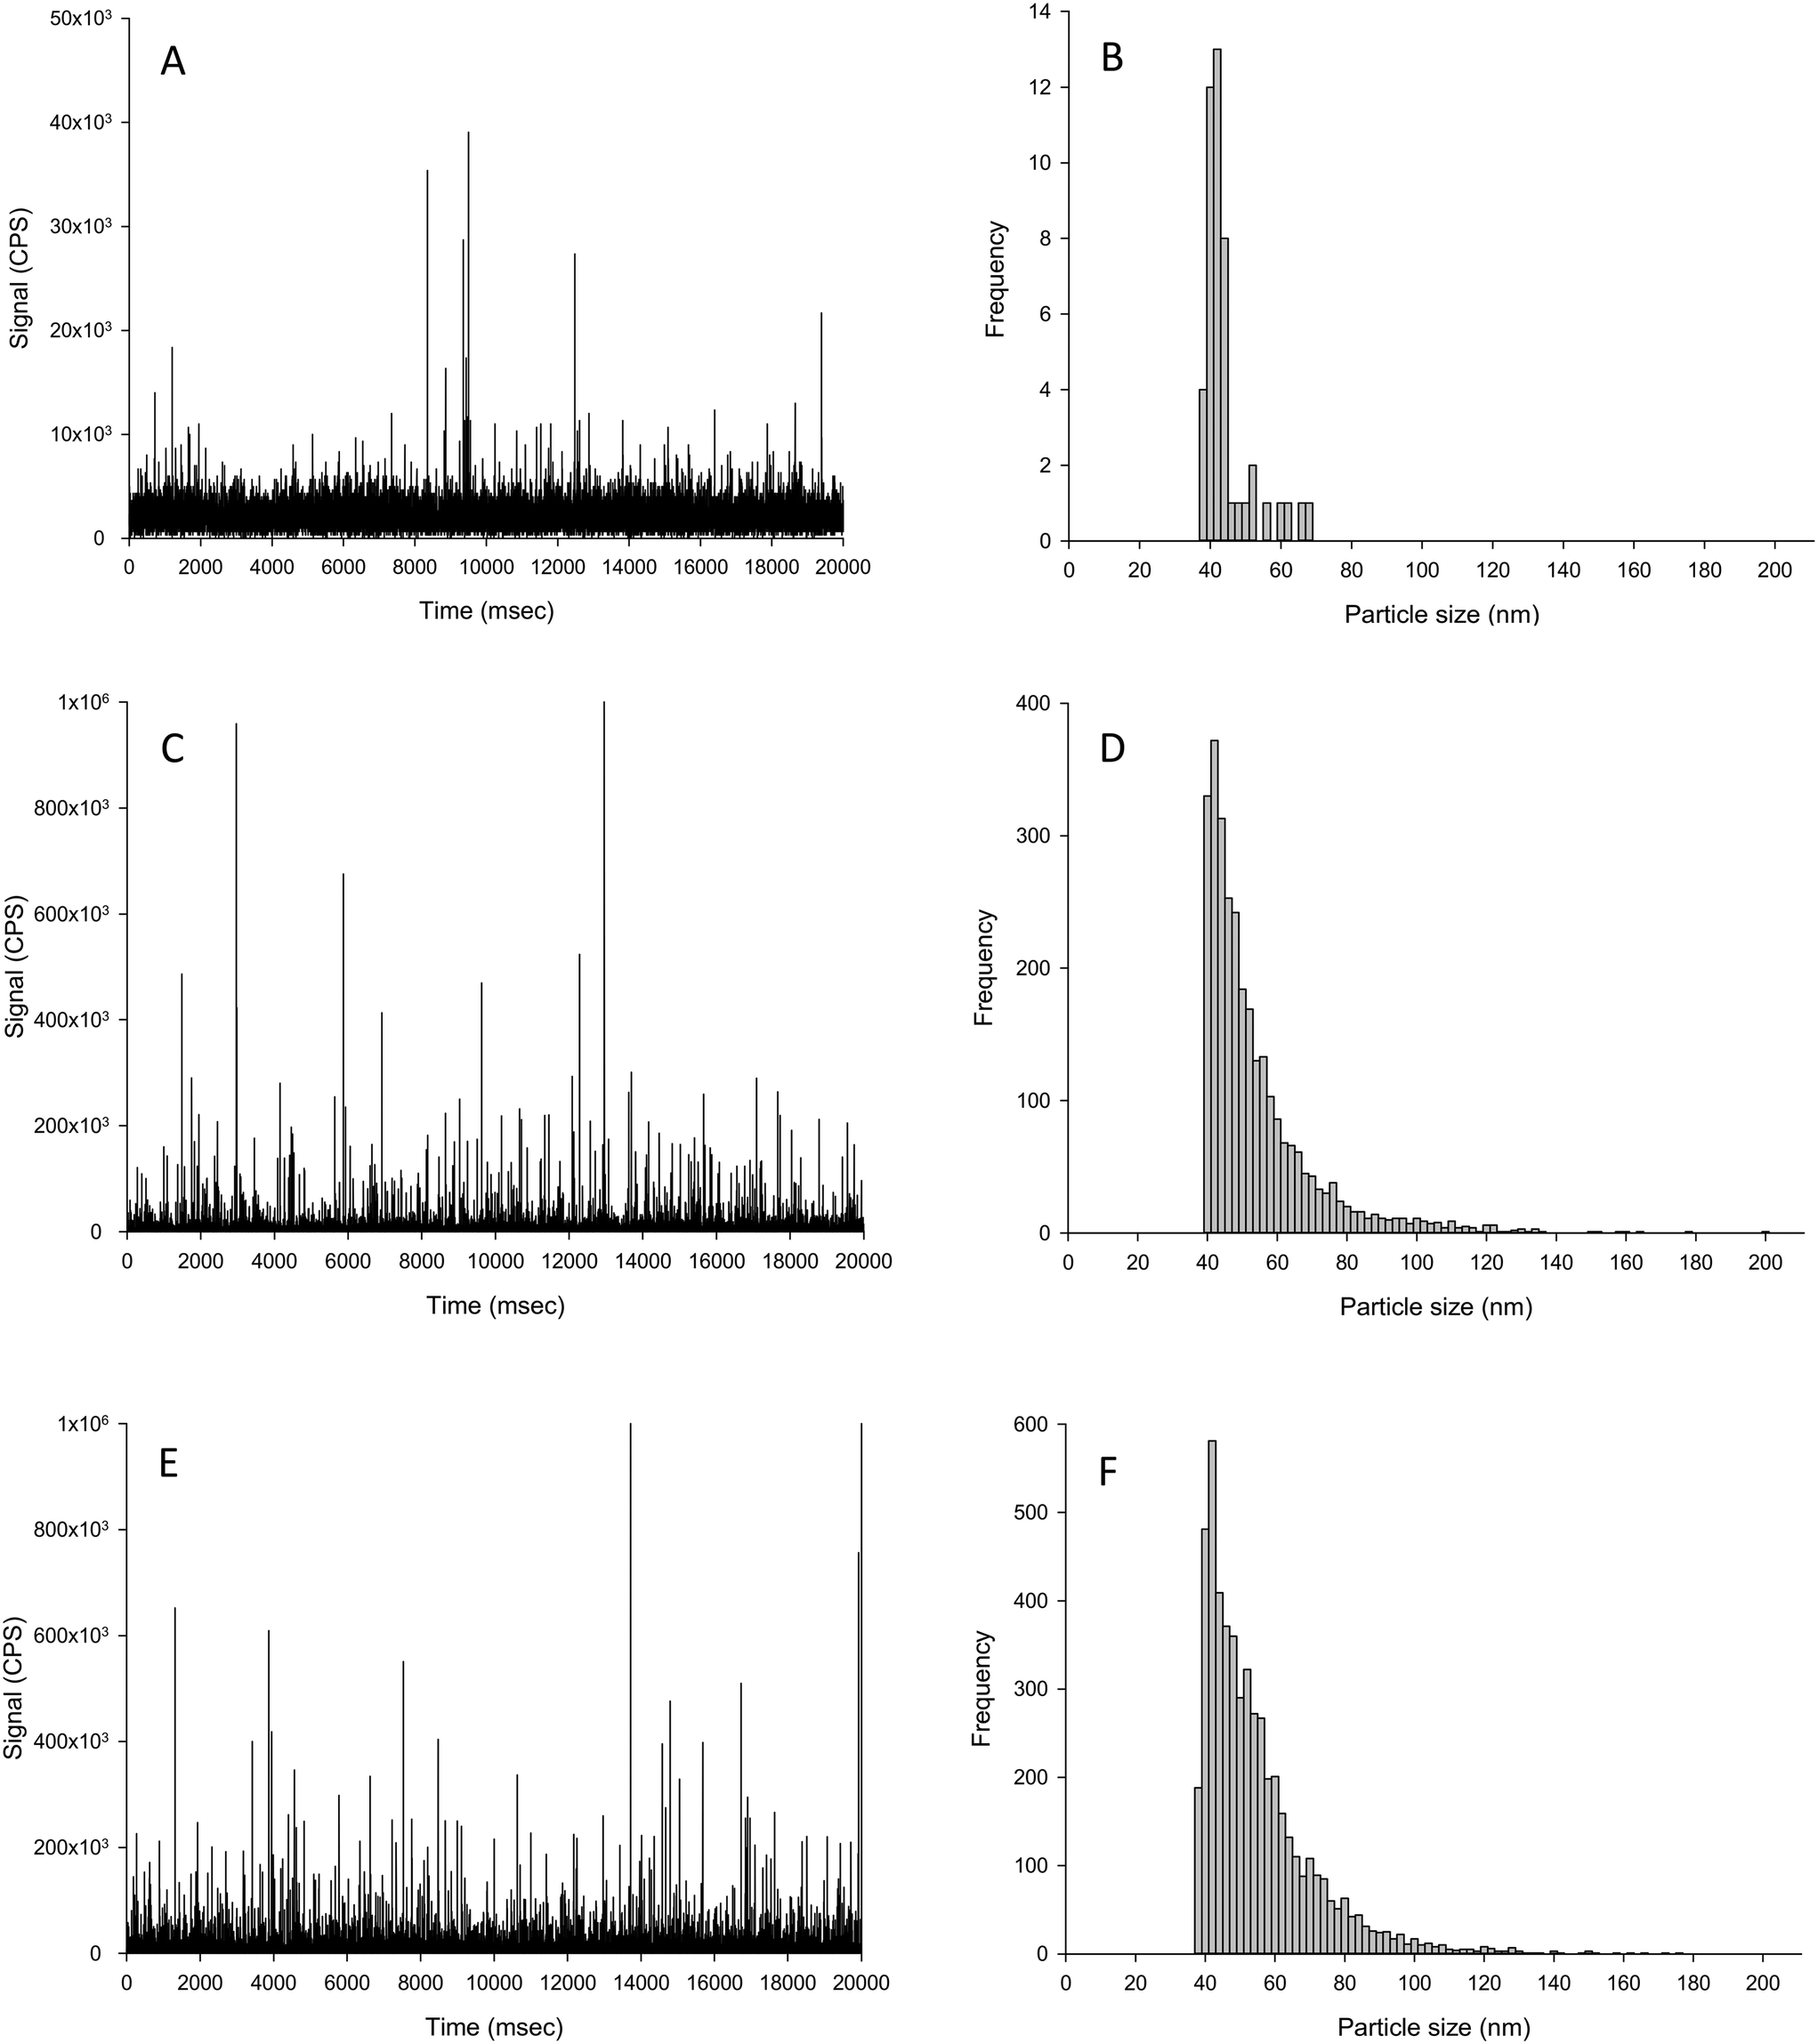 | ||
| Fig. 4 Example time scan (left panels) and corresponding particle size distributions (right panels) of biologically incorporated Ag material extraction from the liver of fish exposed in vivo to either control (no added Ag; A and B), or 100 mg kg−1 Ag as AgNO3 (C and D) or Ag NPs (E and F) for 2 weeks in the diet. | ||
The particles found in the control livers did not significantly differ in mean size compared to both of the dietary Ag treatments (Table 3). But in the Ag NP treatment, there was a significantly elevated number of particles and particle mass concentration in the livers compared to that of the control fish (Fig. 4 and Table 3). The particles in the livers of fish from the dietary Ag NP treatment were very similar to those found in livers from the dietary AgNO3 treatment (Fig. 4), as there was no significant difference between any particle-based measurements between the two treatments (Table 3). The presence of Ag-containing particles in the liver of fish exposed to dietary AgNO3in vivo is interpreted as biogenic particle formation in the living tissue. The normal fish livers simply spiked with AgNO3 solution showed no particle formation (Table 2). Trout are known to form metal storage granules in vivo (e.g., dietary Cu exposures,31). Liver from humans exposed during silver mining also contain Ag granules.32 In fish it is also expected that metal homeostasis will inevitably vary between animals in vivo and around the homeostatic set point;33 and this is reflected in the relative standard deviation of the in vivo livers that were at least 6-fold higher compared to spike tests in the same matrix (Table 2) or in the presence of uncontaminated liver tissue (Table 3). If fish can synthesise biogenic Ag-containing particles from dissolved Ag exposure in vivo, then there is also the possibility that fish might also modify Ag NPs taken up in vivo. In the dietary study with fish here,24 all of the particle size distributions from the in vivo livers were significantly different from those of Ag NPs spiked into the matrix (Kolmogorov–Smirnov, P < 0.001, Tables 2 and 3); suggesting in vivo modification of the particles. Whether or not this modification occurred in the intestine during uptake or in the liver itself requires further investigation.
| Measurement | Treatment | Liver 1 | Liver 2 | Liver 3 | Liver 4 | Liver 5 | Liver 6 | Mean ± S.D | Coefficient of variation (%) |
|---|---|---|---|---|---|---|---|---|---|
| Data are n = 5/6. (*) denotes a significant outlier from Grubbs test and removed from further calculations. Different upper case letters denotes significant difference between treatments (columns; one-way ANOVA or Kruskal–Wallis). The LOD for particle number concentration was 1.5 × 10⁶ particles per g tissue dw. | |||||||||
| Tissue particle mass concentration (μg g−1 dw) | Control | 0.002 | 0.005 | 0.002 | 0.006 | 0.002 | 0.004 | 0.004 ± 0.002A | 50.3 |
| AgNO3 | 43.8 | 200.0 | 309.9 | 23.1 | 196.9 | 57.9 | 138.6 ± 114.3B | 82.5 | |
| Ag NP | 84.5 | 0.3* | 184.8 | 155.7 | 111.3 | 54.1 | 118.1 ± 52.8B | 44.7 | |
| Particle number concentration (×109 g−1 dw) | Control | 0.001 | 0.009 | 0.00 | 0.01 | 0.00 | 0.01 | 0.007 ± 0.004A | 60.9 |
| AgNO3 | 32.4 | 67.4 | 51.1 | 53.2 | 12.8 | 78.0 | 68.3 ± 33.1B | 48.4 | |
| Ag NP | 39.2 | 26.6 | 65.8 | 14.0 | 92.1 | 12.2 | 76.9 ± 51.6B | 67.0 | |
| Mean particle size (nm) | Control | 61.2 | 44.7 | 43.7 | 43.5 | 42.8 | 39.0 | 45.8 ± 7.8A | 17.0 |
| AgNO3 | 61.8 | 76.6 | 93.6 | 42.7 | 53.2 | 49.2 | 62.9 ± 19.1A | 30.4 | |
| Ag NP | 66.1 | 26.7 | 72.8 | 54.0 | 54.7 | 41.5 | 52.7 ± 16.7A | 31.7 | |
Conclusions and regulatory perspective
In conclusion, a suitable tissue digestion method followed by spICP-MS has been developed to determine the particle number concentration and mean size in livers from fish. The analytical method uses inexpensive reagents, and can generate samples within a few hours that can be analysed on a standard ICP-MS instrument. There is an urgent regulatory need for the routine detection of ENMs in fish tissue to support environmental risk assessments, especially with respect to the bioaccumulation testing strategy5 and fish liver is often the organ of choice for environmental monitoring of chemicals. The method here for the detection of ENMs is robust and repeatable with a coefficient of variation less than 10%, and with a detection limit relevant to wildlife. The method is able to detect Ag NPs in tissues from in vivo exposures and raises the possibility of biogenic Ag particle formation from AgNO3 exposures in fish. The next steps are to trial the method with a broader range of fish tissues and in different organisms for Ag NPs, and with further standardisation of the protocol and inter-laboratory testing to demonstrate/validate the protocols for regulatory use.Conflicts of interest
The authors declare no conflicts of interest.Acknowledgements
This work was supported by the EU H2020 NanoFase project, grant agreement no. 646002. The authors would like to thank Andrew Atfield and Dr. Will Vevers for technical support in biology and Dr. Andrew Fisher on analytical chemistry. Also the Plymouth Electron Microscopy Centre for assistance with TEM.References
- B. J. Shaw and R. D. Handy, Physiological effects of nanoparticles on fish: A comparison of nanometals versus metal ions, Environ. Int., 2011, 37, 1083–1097 CrossRef CAS PubMed.
- T. J. Baker, C. R. Tyler and T. S. Galloway, Impacts of metal and metal oxide nanoparticles on marine organisms, Environ. Pollut., 2014, 186, 257–271 CrossRef CAS PubMed.
- H. T. Ratte, Bioaccumulation and toxicity of silver compounds: a review, Environ. Toxicol. Chem., 1999, 18, 89–108 CrossRef CAS.
- S. J. Klaine, A. A. Koelmans, N. Horne, S. Carley, R. D. Handy, L. Kapustka, B. Nowack and F. von der Kammer, Paradigms to assess the environmental impact of manufactured nanomaterials, Environ. Toxicol. Chem., 2012, 31, 3–14 CrossRef CAS PubMed.
- R. D. Handy, J. Ahtiainen, J. M. Navas, G. Goss, E. A. Bleeker and F. von der Kammer, Proposal for a tiered dietary bioaccumulation testing strategy for engineered nanomaterials using fish, Environ. Sci.: Nano, 2018, 5, 2030–2046 RSC.
- R. D. Handy, G. Cornelis, T. Fernandes, O. Tsyusko, A. Decho, T. Sabo-Attwood, C. Metcalfe, J. A. Steevens, S. J. Klaine, A. A. Koelmans and N. Horne, Ecotoxicity test methods for engineered nanomaterials: Practical experiences and recommendations from the bench, Environ. Toxicol. Chem., 2012, 31, 15–31 CrossRef CAS PubMed.
- F. Von der Kammer, P. L. Ferguson, P. A. Holden, A. Masion, K. R. Rogers, S. J. Klaine, A. A. Koelmans, N. Horne and J. M. Unrine, Analysis of engineered nanomaterials in complex matrices (environment and biota): general considerations and conceptual case studies, Environ. Toxicol. Chem., 2012, 31, 32–49 CrossRef CAS PubMed.
- B. Meermann and V. Nischwitz, ICP-MS for the analysis at the nanoscale–a tutorial review, J. Anal. At. Spectrom., 2018, 33, 1432–1468 RSC.
- R. D. Handy, N. van den Brink, M. Chappell, M. Mühling, R. Behra, M. Dušinská, P. Simpson, J. Ahtiainen, A. N. Jha and J. Seiter, Practical considerations for conducting ecotoxicity test methods with manufactured nanomaterials: what have we learnt so far?, Ecotoxicology, 2012, 21, 933–972 CrossRef CAS PubMed.
- B. D. Johnston, T. M. Scown, J. Moger, S. A. Cumberland, M. Baalousha, K. Linge, R. van Aerle, K. Jarvis, J. R. Lead and C. R. Tyler, Bioavailability of nanoscale metal oxides TiO2, CeO2, and ZnO to fish, Environ. Sci. Technol., 2010, 44, 1144–1151 CrossRef CAS PubMed.
- K. Tervonen, G. Waissi, E. J. Petersen, J. Akkanen and J. V. K. Kukkonen, Analysis of fullerene C60 and kinetic measurements for its accumulation and depuration in Daphnia magna, Environ. Toxicol. Chem., 2010, 29, 1072–1078 CAS.
- B. J. Shaw, C. S. Ramsden, A. Turner and R. D. Handy, A simplified method for determining titanium from TiO2 nanoparticles in fish tissue with a concomitant multi-element analysis, Chemosphere, 2013, 92, 1136–1144 CrossRef CAS PubMed.
- M. D. Montaño, J. W. Olesik, A. G. Barber, K. Challis and J. F. Ranville, Single Particle ICP-MS: Advances toward routine analysis of nanomaterials, Anal. Bioanal. Chem., 2016, 408, 5053–5074 CrossRef PubMed.
- C. F. Degueldre, P.-Y. , Colloid analysis by single particle inductively coupled plasma-mass spectroscopy: a feasibility study, Colloids Surf., A, 2003, 217, 137–142 CrossRef CAS.
- F. Laborda, J. Jiménez-Lamana, E. Bolea and J. R. Castillo, Selective identification, characterization and determination of dissolved silver (I) and silver nanoparticles based on single particle detection by inductively coupled plasma mass spectrometry, J. Anal. At. Spectrom., 2011, 26, 1362–1371 RSC.
- Z. Gajdosechova and Z. Mester, Recent trends in analysis of nanoparticles in biological matrices, Anal. Bioanal. Chem., 2019, 411, 4277–4292 CrossRef CAS PubMed.
- Y. Dan, X. Ma, W. Zhang, K. Liu, C. Stephan and H. Shi, Single particle ICP-MS method development for the determination of plant uptake and accumulation of CeO2 nanoparticles, Anal. Bioanal. Chem., 2016, 408, 5157–5167 CrossRef CAS PubMed.
- Y. Deng, E. J. Petersen, K. E. Challis, S. A. Rabb, R. D. Holbrook, J. F. Ranville, B. C. Nelson and B. Xing, Multiple method analysis of TiO2 nanoparticle uptake in rice (Oryza sativa L.) plants, Environ. Sci. Technol., 2017, 51, 10615–10623 CrossRef CAS PubMed.
- E. P. Gray, J. G. Coleman, A. J. Bednar, A. J. Kennedy, J. F. Ranville and C. P. Higgins, Extraction and analysis of silver and gold nanoparticles from biological tissues using single particle inductively coupled plasma mass spectrometry, Environ. Sci. Technol., 2013, 47, 14315–14323 CrossRef CAS PubMed.
- R. J. Peters, Z. H. Rivera, G. van Bemmel, H. J. Marvin, S. Weigel and H. Bouwmeester, Development and validation of single particle ICP-MS for sizing and quantitative determination of nano-silver in chicken meat, Anal. Bioanal. Chem., 2014, 406, 3875–3885 CAS.
- M. Baccaro, A. K. Undas, J. de Vriendt, J. Van Den Berg, R. Peters and N. W. van den Brink, Ageing, dissolution and biogenic formation of nanoparticles: how do these factors affect the uptake kinetics of silver nanoparticles in earthworms?, Environ. Sci.: Nano, 2018, 5, 1107–1116 RSC.
- N. J. Clark, D. Boyle and R. D. Handy, An assessment of the dietary bioavailability of silver nanomaterials in rainbow trout using an ex vivo gut sac technique, Environ. Sci.: Nano, 2019, 6, 646–660 RSC.
- F. Galvez and C. M. Wood, Physiological effects of dietary silver sulfide exposure in rainbow trout, Environ. Toxicol. Chem., 1999, 18, 84–88 CrossRef CAS.
- N. J. Clark, D. Boyle, B. P. Eynon and R. D. Handy, Dietary exposure to silver nitrate compared to two forms of silver nanoparticles in rainbow trout: bioaccumulation potential with minimal physiological effects, Environ. Sci.: Nano, 2019, 6, 1393–1405 RSC.
- H. E. Pace, N. J. Rogers, C. Jarolimek, V. A. Coleman, C. P. Higgins and J. F. Ranville, Determining transport efficiency for the purpose of counting and sizing nanoparticles via single particle inductively coupled plasma mass spectrometry, Anal. Chem., 2011, 83, 9361–9369 CrossRef CAS PubMed.
- J. Jimenezlamana, I. Abadalvaro, K. Bierla, F. Laborda, J. Szpunar and R. Lobinski, Detection and characterization of biogenic selenium nanoparticles in selenium-rich yeast by single particle ICPMS, J. Anal. At. Spectrom., 2018, 33, 452–460 RSC.
- R. Grombe, G. Allmaier, J. Charoud-Got, A. Dudkiewicz, H. Emteborg, T. Hofmann, E. H. Larsen, A. Lehner, M. Llinàs and K. Loeschner, Feasibility of the development of reference materials for the detection of Ag nanoparticles in food: neat dispersions and spiked chicken meat, Accredit. Qual. Assur., 2015, 20, 3–16 CrossRef CAS.
- S. Weigel, R. Peters, K. Loeschner, R. Grombe and T. P. Linsinger, Results of an interlaboratory method performance study for the size determination and quantification of silver nanoparticles in chicken meat by single-particle inductively coupled plasma mass spectrometry (sp-ICP-MS), Anal. Bioanal. Chem., 2017, 409, 4839–4848 CrossRef CAS PubMed.
- J. F. Liu, J. B. Chao, R. Liu, Z. Q. Tan, Y. G. Yin, Y. Wu and G. B. Jiang, Cloud point extraction as an advantageous preconcentration approach for analysis of trace silver nanoparticles in environmental waters, Anal. Chem., 2009, 81, 6496–6502 CrossRef CAS.
- Y. Yang, L. Luo, H.-P. Li, Q. Wang, Z.-G. Yang and C.-L. Long, Separation and determination of silver nanoparticle in environmental water and the UV-induced photochemical transformations study of AgNPs by cloud point extraction combined ICP-MS, Talanta, 2016, 161, 342–349 CrossRef CAS PubMed.
- R. P. Lanno, B. Hicks and J. W. Hilton, Histological observations on intrahepatocytic copper-containing granules in rainbow trout reared on diets containing elevated levels of copper, Aquat. Toxicol., 1987, 10, 251–263 CrossRef CAS.
- A. Gettler, C. Rhoads and S. Weiss, A contribution to the pathology of generalized argyria with a discussion of the fate of silver in the human body, Am. J. Pathol., 1927, 3, 631 CAS.
- N. C. Bury and R. D. Handy, in Surface Chemistry, Bioavailability and Metal Homeostasis in Aquatic Organisms: An integrated approach, ed. N. C. Bury and R. D. Handy, Society for Experimental Biology Press, London, 2010, pp. 107–127 Search PubMed.
Footnote |
| † Electronic supplementary information (ESI) available. See DOI: 10.1039/c9en00547a |
| This journal is © The Royal Society of Chemistry 2019 |