 Open Access Article
Do graphene oxide nanostructured coatings mitigate bacterial adhesion?†
Karl
Wuolo-Journey‡
a,
Sara
BinAhmed‡
 a,
Elise
Linna
a and
Santiago
Romero-Vargas Castrillón
 *abc
*abc
aDepartment of Civil, Environmental, and Geo- Engineering, University of Minnesota, 500 Pillsbury Dr. SE, Minneapolis, MN 55455, USA. E-mail: Santiago@ed.ac.uk; sromerov@umn.edu; Tel: +44(0)131 651 3567
bInstitute for Infrastructure and Environment, School of Engineering, The University of Edinburgh, William Rankine Building, Thomas Bayes Road, Edinburgh, EH9 3FG UK
cInstitute for Materials and Processes, School of Engineering, The University of Edinburgh, Sanderson Building, Robert Stevenson Road, Edinburgh, EH9 3FB UK
First published on 26th July 2019
Abstract
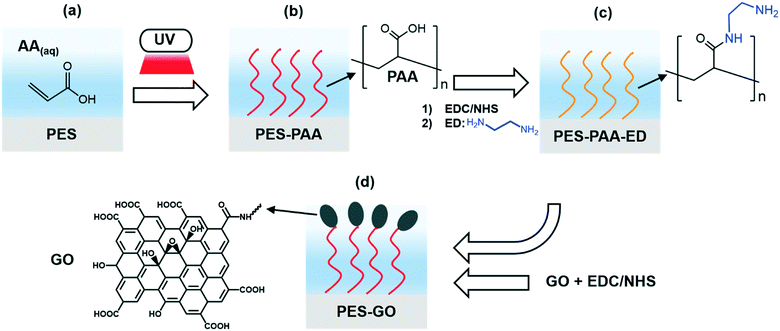
Given its potent biocidal properties, graphene oxide (GO) holds promise as a building block of anti-microbial surfaces, with numerous potential environmental applications. Nonetheless, the extent to which GO-based coatings decrease bacterial adhesion propensity, a necessary requirement of low-fouling surfaces, remains unclear. Here we use AFM-based single-cell force spectroscopy (SCFS) to show that coatings comprising GO nanosheets bonded to a hydrophilic polymer brush mitigate adhesion of Pseudomonas fluorescens cells. We demonstrate low-adhesion GO coatings by grafting poly(acrylic acid) (PAA) to polyethersulfone (PES) substrates via self-initiated UV polymerization, followed by edge-tethering of GO to the PAA chains through amine coupling. We characterize the chemistry and interfacial properties of the unmodified PES, PAA-modified (PES–PAA), and GO-modified (PES–GO) substrates using ATR-FTIR, Raman spectroscopy, contact angle goniometry, and AFM to confirm the presence of PAA and covalently bonded GO on the substrates. Using SCFS we show that peak adhesion force distributions for PES–PAA (with mean adhesion force ![[F with combining macron]](https://www.rsc.org/images/entities/i_char_0046_0304.gif) Peak = −0.13 nN) and PES–GO (
Peak = −0.13 nN) and PES–GO (![[F with combining macron]](https://www.rsc.org/images/entities/i_char_0046_0304.gif) Peak = −0.11 nN) substrates are skewed towards weaker values compared to the PES control (
Peak = −0.11 nN) substrates are skewed towards weaker values compared to the PES control (![[F with combining macron]](https://www.rsc.org/images/entities/i_char_0046_0304.gif) Peak = −0.18 nN). Our results show that weaker adhesion on PES–GO is due to a higher incidence of non-adhesive (repulsive) forces (45.9% compared to 22.2% over PES–PAA and 32.3% over PES), which result from steric repulsion afforded by the brush-like GO–PAA interface. Lastly, we show that attachment to the various substrates is due to interactions of proteinaceous adhesins whose force response is well described by the worm-like chain model of polymer elasticity.
Peak = −0.18 nN). Our results show that weaker adhesion on PES–GO is due to a higher incidence of non-adhesive (repulsive) forces (45.9% compared to 22.2% over PES–PAA and 32.3% over PES), which result from steric repulsion afforded by the brush-like GO–PAA interface. Lastly, we show that attachment to the various substrates is due to interactions of proteinaceous adhesins whose force response is well described by the worm-like chain model of polymer elasticity.
Environmental significanceWhile surface functionalization with graphene oxide (GO) is effective in bacterial inactivation, the modification of interfacial properties due to the nanomaterial coating may in fact increase the bioadhesion (and biofouling) propensity of a substrate. GO is biocidal; is it also anti-adhesive? Here we address this question using AFM-based bacterial adhesion force measurements. We show that coatings displaying low-bioadhesion properties can be formed by binding GO nanosheets to a hydrophilic polymer brush. Our work indicates that the underlying polymer layer enables a brush-like GO coating, which mitigates bacterial adhesion through steric repulsive forces. Conformational disorder (afforded by the polymer brush) is thus an important design variable for environmental interfaces (membranes, sorbents) seeking to exploit the antimicrobial properties of GO. |
1. Introduction
The discovery of graphenic nanomaterials (GNMs, such as graphene, graphene oxide and reduced graphene oxide)1 in 2004 unleashed a scientific revolution due to their unique physical and chemical properties, leading to numerous potential applications in water treatment and wastewater reuse.2 The high specific surface area (∼2630 m2 g−1)3 and single-atom-thickness of GNMs could enable them as membrane materials4–6 and adsorbents for the removal of water contaminants.7 Moreover, the thermal properties displayed by graphene (i.e., its ability to harvest sunlight and increase the local temperature above the boiling point of water8), and graphene's high electron mobility (up to 2 × 105 cm2 V−1 s−1),3 could enable electrochemical and solar-driven water purification and disinfection.The specific application addressed by the present work concerns graphene oxide (GO)-based biocidal coatings.9,10 Given their wide-spectrum antimicrobial activity,11–14 GO nanosheets are being explored as building blocks of antimicrobial surfaces, aiming to inactivate water-borne bacteria and mitigate biofilm formation. In recent studies, GO has been incorporated into the polymeric matrix of polyamide membranes,15–18 or covalently bonded to membrane surfaces.19,20 Nevertheless, the underlying mechanism of bacterial adhesion to GO-functionalized interfaces—the crucial first step of biofilm formation21—continues to be poorly understood. Moreover, recent studies have observed that GO functionalization of inorganic and polymeric substrates can increase their bio-adhesiveness.22,23 The possible adverse modification of interfacial properties challenges the notion of GO films as anti-biofouling coatings. This question needs to be addressed since the effectiveness of GO as a biocidal nanomaterial will be compromised if it increases the adhesiveness of a given substrate vis-à-vis bacterial cells.
In a recent study,22 we reported that the nanoscale morphology of GO coatings significantly influences bacterial adhesion, with edge-tethered GO showing weaker adhesion forces compared to immobilized layers of horizontally arranged GO nanosheets; spatial arrangement and conformational disorder of the GO building blocks thus seem essential to realize both biocidal activity and low adhesion propensity. Here, we investigate the extent to which GO coatings, comprising GO nanosheets edge-tethered to a polymer brush, are capable of mitigating bacterial adhesion. We surmise that the combination of hydrophilicity and conformational disorder afforded by the GO-functionalized polymer brush is essential to mitigate bioadhesion. To test this hypothesis, we use self-initiated UV polymerization of acrylic acid to graft poly(acrylic acid) (PAA) to polyethersulfone (PES) substrates, tethering GO nanosheets to the PAA chains. We then explore the interfacial properties of the GO coatings using atomic force microscopy (AFM)-based single-cell force spectroscopy,24 whereby a single Pseudomonas fluorescens cell (a Gram-negative, biofilm-forming bacterium25,26) is immobilized on an AFM cantilever, enabling investigation of bacterial adhesion with nanoscale resolution. We show that microbial adhesion to GO-functionalized substrates is weakened compared to the GO-free control substrates. Consistent with our AFM results, bacterial deposition experiments show that GO-functionalized substrates mitigate adhesion under dynamic conditions. Characterization of the surface interfacial properties suggests that weaker adhesion on GO-modified substrates is a consequence of steric repulsive forces derived from the GO layer, edge-tethered to PAA brushes.
This paper is organized as follows. In section 2 we describe the substrate modification protocols, and the techniques employed to characterize interfacial properties. Results and discussion are given in section 3. We close with concluding remarks in section 4.
2. Materials and methods
GO functionalization
Interfacial characterization techniques
3. Results and discussion
Interfacial characterization
We used an array of surface analytical techniques to characterize the chemistry and morphology of the various substrates.![[double bond, length as m-dash]](https://www.rsc.org/images/entities/char_e001.gif) O stretching vibration,39 and multiple bands in the 2500–3300 cm−1 range due to COO–H stretching.39 These peaks increase monotonically with irradiation time, in line with increasing degree of PAA grafting.37 In the remainder of the study we focus on substrates fabricated with a 10 s UV irradiation step, which resulted in materials with nanofiltration-like water permeability coefficient and divalent ion rejection (see ESI† for methods and results). Irradiation times > 10 s resulted in a dense PAA layer and a steep loss in water permeability.
O stretching vibration,39 and multiple bands in the 2500–3300 cm−1 range due to COO–H stretching.39 These peaks increase monotonically with irradiation time, in line with increasing degree of PAA grafting.37 In the remainder of the study we focus on substrates fabricated with a 10 s UV irradiation step, which resulted in materials with nanofiltration-like water permeability coefficient and divalent ion rejection (see ESI† for methods and results). Irradiation times > 10 s resulted in a dense PAA layer and a steep loss in water permeability.
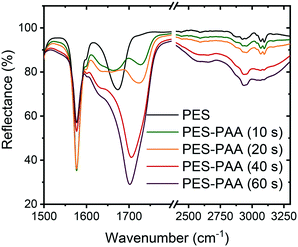 | ||
| Fig. 2 FTIR spectra of PES and poly(acrylic acid) (PAA)-functionalized PES substrates (PES–PAA, prepared with different UV irradiation times noted in the caption). | ||
The FTIR spectra of the PES, PES–PAA (10 s UV irradiation) and PES–GO substrates are presented in Fig. 3. The spectrum corresponding to PES–GO shows an increase in the COO–H stretching band at 3300 cm−1 relative to PES–PAA, which can be attributed to carboxylic acid functional groups present in the GO nanosheet edges.10 In addition, PES–GO presents a peak at ∼2900 cm−1 absent in the other substrates, which is likely an N–H stretching vibration band (typically observed at 3100–3500 cm−1![[thin space (1/6-em)]](https://www.rsc.org/images/entities/char_2009.gif) 39) due to primary amines that remain unreacted after GO modification.
39) due to primary amines that remain unreacted after GO modification.
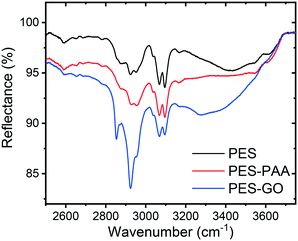 | ||
| Fig. 3 FTIR spectra of control (PES), poly(acrylic acid) (PAA)-functionalized PES (PES–PAA, 10 s UV irradiation), and GO-functionalized (PES–GO) substrates. | ||
We confirmed the presence of graphene oxide on the PES–GO substrates using Raman spectroscopy. The average of 1600 spectra scanned over a 20 × 20 μm2 area of each specimen is presented in Fig. 4. The PES–GO substrate prominently shows the G and D bands of graphene oxide,33 thus confirming functionalization of PES with GO. All substrates show similar chemical signatures due to polyethersulfone, e.g., peaks at 790, 1070, 1107, 1146, 1580 and 1601 cm−1.40
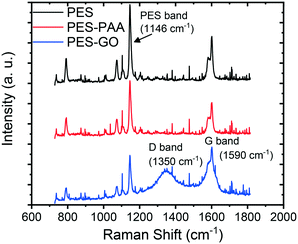 | ||
| Fig. 4 Raman spectra of pristine PES, poly(acrylic acid) (PAA)-functionalized PES (PES–PAA), and GO-modified PES (PES–GO) substrates. | ||
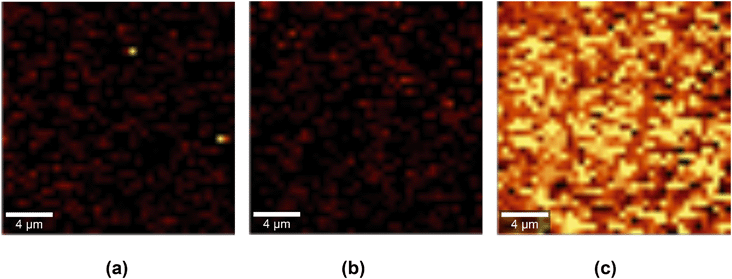
We used confocal Raman mapping to assess the spatial distribution of GO on the PES–GO substrates. The results are presented in Fig. 5. The PES–GO map (Fig. 5 (c)) exhibits high brightness regions indicative of the presence of GO nanosheets throughout the scanned area (the intensity of each pixel is proportional to the ratio of the area under the D peak of GO to that under the polyethersulfone peak at 1146 cm−1). Conversely, neither the PES nor the PES–PAA Raman maps (Fig. 5 (a and b)) exhibit signatures of GO. The data in Fig. 5 consequently show that the modification protocol enables the formation of uniform layers of tethered GO nanosheets on the PES substrates.
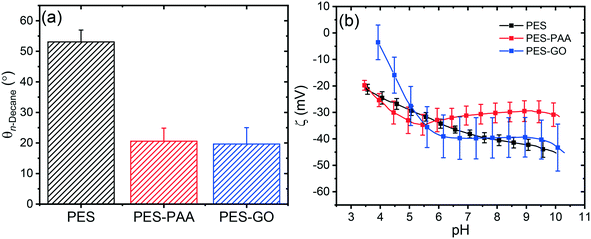
We characterized the surface charge of the substrates in terms of the ζ-potential as a function of pH. The results are presented in Fig. 6 (b). All substrates (including pristine PES43) exhibited negative zeta potentials over the pH range investigated. At pH 7.4, (i.e., the condition at which we characterized other interfacial properties such as surface roughness, and microbial adhesion), all specimens show a similar zeta potential value of ∼−30 to −40 mV, suggesting that surface functionalization does not significantly modify the charge of the interface at this pH. PES–PAA and PES–GO samples are negatively charged primarily due to deprotonation of carboxylic acid groups with increasing pH.10,32 While PES does not have acidic functional groups, its negative zeta potential is due to adsorption of hydroxyl ions.44
Surface roughness influences fouling, with rougher substrates exhibiting greater biofouling and colloidal fouling propensity.45–48 We determined the RMS roughness (RRMS) of the hydrated substrates using AFM. Representative 2 × 2 μm2 AFM scans along with average RRMS values are shown in Fig. 7. We observed a relatively smooth interface in the PES substrate with low surface roughness (RRMS = 2.51 ± 0.49 nm, cf.Fig. 7 (a)). On the other hand, the grafted PAA chains increase the RRMS of the PES–PAA substrate (RRMS = 5.74 ± 2.18 nm, cf.Fig. 7 (b)) compared to the PES control (p < 0.01). The negatively charged tethered PAA chains exist in a collapsed (i.e., non-extended) conformation given that the high ionic strength of PBS (162 mM) results in screening of electrostatic repulsions.49 PAA chain collapse yields the rough, peak-and-valley interfacial structure shown in Fig. 7 (b). Upon edge-tethering GO nanosheets to the PAA surface, we observe an interface with lower RRMS (RRMS = 3.63 ± 1.17 nm, cf.Fig. 7 (c)) compared to PES–PAA (p = 0.03). GO nanosheets appear to cover the rougher PAA interfacial features, thus decreasing RRMS. This “smoothing over” is possibly caused by GO nanosheets tethered to the PAA layer through multiple sites along the sheet periphery (effectively acting as a crosslinker of PAA chains).
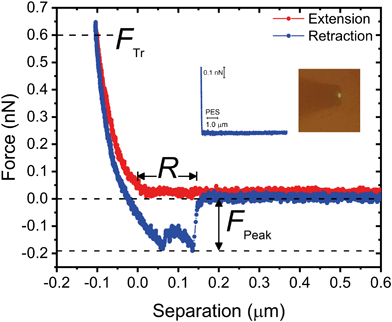
A representative force–distance curve, showing a typical extension–retraction force cycle, is presented in Fig. 8. For each retraction force curve, we recorded the peak adhesion force, FPeak, defined as the binding force with the highest magnitude, and the rupture separation, R, i.e., the separation at which cell–substrate forces vanish (cf.Fig. 8). We set the trigger force (FTr, defined as the force exerted on the bacterium when it contacts the substrate, cf.Fig. 8), to 600 pN; this value is of the same order of magnitude as the permeation drag force experienced by similarly-sized colloidal particles during low-pressure membrane filtration.52
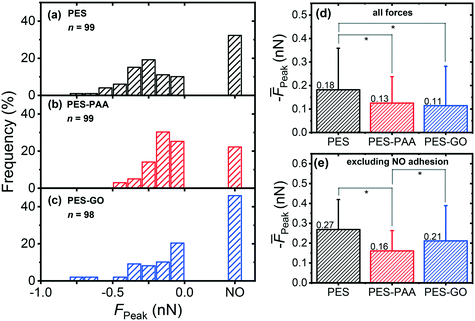
Fig. 9 (a–c) presents the distribution of P. fluorescens peak adhesion forces (FPeak) observed over the different substrates. The “NO” column in the histograms corresponds to measurements in which weak adhesion (< 30 pN, equivalent in magnitude to the noise level in the force) or no adhesion peaks were observed (see Fig. 8 (inset) for a representative non-adhesive force curve).
We observe a broad distribution of peak adhesion forces for all substrates (cf.Fig. 9 (a)–(c)), with the majority of adhesion events occurring in the ≈ 0 to 0.5 nN range, typical of bacterial adhesion.51 Further, we observe that adhesion forces are substrate-dependent. Among the surfaces studied, PES–GO exhibits the lowest probability of adhesion, with 45.9% of measurements showing no-adhesion events, compared to 22.2% for PES–PAA and 32.3% for PES. We observe three consecutive non-adhesive force curves in 15% (PES–PAA), 21% (PES), and 25% (PES–GO) of the loci probed, i.e., a similar trend to that of the probability of observing non-adhesive events across the whole surface. Consistent with the (quasi-static) AFM measurements, bacterial deposition experiments (Fig. S2†) show that the extent of irreversible adhesion is lowest on PES–GO. Fig. 9 (d), presenting the average of all forces (![[F with combining macron]](https://www.rsc.org/images/entities/i_char_0046_0304.gif) Peak), shows that adhesion is strongest on PES, while PES–GO displays the weakest mean adhesion:
Peak), shows that adhesion is strongest on PES, while PES–GO displays the weakest mean adhesion: ![[F with combining macron]](https://www.rsc.org/images/entities/i_char_0046_0304.gif) Peak = −0.11 (± 0.17) nN for PES–GO vs. −0.18 (± 0.18) nN for PES (p = 0.006). PES–PAA substrates also demonstrated weaker adhesions (
Peak = −0.11 (± 0.17) nN for PES–GO vs. −0.18 (± 0.18) nN for PES (p = 0.006). PES–PAA substrates also demonstrated weaker adhesions (![[F with combining macron]](https://www.rsc.org/images/entities/i_char_0046_0304.gif) Peak = −0.13 (± 0.11) nN) compared to PES (p = 0.008), while similar adhesiveness was displayed by PES–PAA and PES–GO (p = 0.6).
Peak = −0.13 (± 0.11) nN) compared to PES (p = 0.008), while similar adhesiveness was displayed by PES–PAA and PES–GO (p = 0.6).
A more nuanced adhesion behavior arises when we exclude the non-adhesive measurements from the calculation of the mean. The results, presented in Fig. 9 (e), show that PES substrates still reveal the strongest mean adhesion, i.e., ![[F with combining macron]](https://www.rsc.org/images/entities/i_char_0046_0304.gif) Peak = −0.27 (± 0.15) nN. On the other hand, PES–PAA exhibits the weakest mean adhesion forces with
Peak = −0.27 (± 0.15) nN. On the other hand, PES–PAA exhibits the weakest mean adhesion forces with ![[F with combining macron]](https://www.rsc.org/images/entities/i_char_0046_0304.gif) Peak = −0.16 (± 0.10) nN, compared to −0.21 (± 0.18) nN for PES–GO (p = 0.04). Consequently, Fig. 9 shows that, while PES–GO surfaces display the lowest probability of P. fluorescens attachment (i.e., highest incidence of non-adhesion events, as shown in Fig. 9 (c)), adhering bacteria engage the GO substrate with forces that are stronger than those observed over PES–PAA, and only somewhat weaker than those observed over PES (Fig. 9 (e)).
Peak = −0.16 (± 0.10) nN, compared to −0.21 (± 0.18) nN for PES–GO (p = 0.04). Consequently, Fig. 9 shows that, while PES–GO surfaces display the lowest probability of P. fluorescens attachment (i.e., highest incidence of non-adhesion events, as shown in Fig. 9 (c)), adhering bacteria engage the GO substrate with forces that are stronger than those observed over PES–PAA, and only somewhat weaker than those observed over PES (Fig. 9 (e)).
The picture emerging from Fig. 9 indicates that edge-tethering GO to a PAA coating decreases the mean adhesion force (![[F with combining macron]](https://www.rsc.org/images/entities/i_char_0046_0304.gif) Peak) of P. fluorescens compared to the unmodified PES surface (cf.Fig. 9 (d)). However, it is important to note that the lower
Peak) of P. fluorescens compared to the unmodified PES surface (cf.Fig. 9 (d)). However, it is important to note that the lower ![[F with combining macron]](https://www.rsc.org/images/entities/i_char_0046_0304.gif) Peak observed on PES–GO (Fig. 9 (d)) is due to a high incidence of non-adhesive events on the GO-functionalized substrate (cf.Fig. 9 (c)), which offsets the relatively strong adhesion forces exhibited by cells that do successfully adhere to the PES–GO surface (Fig. 9 (e)).
Peak observed on PES–GO (Fig. 9 (d)) is due to a high incidence of non-adhesive events on the GO-functionalized substrate (cf.Fig. 9 (c)), which offsets the relatively strong adhesion forces exhibited by cells that do successfully adhere to the PES–GO surface (Fig. 9 (e)).
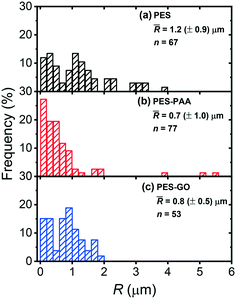
Fig. 10 presents the distribution of the rupture separation (R) over the different substrates. R is also distributed broadly, with mean values (![[R with combining macron]](https://www.rsc.org/images/entities/i_char_0052_0304.gif) ) around 1 μm that are a reflection of the adhesins, namely pili and flagella, that mediate P. fluorescens binding to substrates.53–55Fig. 10 further shows that longer ranged interactions are observed over PES (
) around 1 μm that are a reflection of the adhesins, namely pili and flagella, that mediate P. fluorescens binding to substrates.53–55Fig. 10 further shows that longer ranged interactions are observed over PES (![[R with combining macron]](https://www.rsc.org/images/entities/i_char_0052_0304.gif) = 1.2 (± 0.9 μm)) compared to PES–PAA (
= 1.2 (± 0.9 μm)) compared to PES–PAA (![[R with combining macron]](https://www.rsc.org/images/entities/i_char_0052_0304.gif) = 0.7 (± 1.0 μm), p = 0.002) and to PES–GO (
= 0.7 (± 1.0 μm), p = 0.002) and to PES–GO (![[R with combining macron]](https://www.rsc.org/images/entities/i_char_0052_0304.gif) = 0.8 (± 0.5 μm), p = 0.008), suggesting that more sites along individual adhesins bind to the PES substrate. It is also possible that higher
= 0.8 (± 0.5 μm), p = 0.008), suggesting that more sites along individual adhesins bind to the PES substrate. It is also possible that higher ![[R with combining macron]](https://www.rsc.org/images/entities/i_char_0052_0304.gif) observed on the PES substrate indicates that several adhesins of different contour length mediate attachment on PES.36R thus displays behavior in line with the adhesion forces reported in Fig. 9 (d), since longer ranged forces are observed on more adhesion-prone PES substrates. Moreover, in view of the lower
observed on the PES substrate indicates that several adhesins of different contour length mediate attachment on PES.36R thus displays behavior in line with the adhesion forces reported in Fig. 9 (d), since longer ranged forces are observed on more adhesion-prone PES substrates. Moreover, in view of the lower ![[R with combining macron]](https://www.rsc.org/images/entities/i_char_0052_0304.gif) observed over PES–GO and PES–PAA, Fig. 10 shows that the range of cell adhesion forces is determined by microbial adhesins, and that extension of poly(acrylic acid) chains during cell pull-off does not contribute significantly to R.
observed over PES–GO and PES–PAA, Fig. 10 shows that the range of cell adhesion forces is determined by microbial adhesins, and that extension of poly(acrylic acid) chains during cell pull-off does not contribute significantly to R.
We turn to the interfacial properties presented in Fig. 6 and 7 to explain the differences in adhesive behavior among the three substrate types. Weakening of cell–substrate forces in PES–PAA (cf.Fig. 9 (d and e)) compared to PES is due to the PAA coatings resulting in more hydrophilic substrates (cf.Fig. 6 (a)), which mitigate adhesion of P. fluorescens bacteria reliant on hydrophobic interactions.36,53,56 In addition, PAA chain compression results in a steric repulsive force that contributes to weaker bioadhesion.57,58 We note that long-range electrostatic repulsive forces, involving the negatively charged substrate (Fig. 6 (b)) and bacterium, are absent in PBS (Debye length = 0.75 nm). We observe two effects upon functionalization with GO. First, an increase in the frequency of non-adhesive events compared to PES and PES–PAA (cf. “NO” column in Fig. 9 (a–c)), which we attribute to the layer of GO nanosheets that is covalently tethered to PES–PAA; this GO coating lowers the roughness of the interface (cf.Fig. 7) thus decreasing adsorption surface area, and results in an additional steric barrier that limits binding of the microbe22 (similarly, higher surface roughness in PES–PAA explains its lower incidence of non-adhesive events compared to PES). Second, we observe an increase in the mean adhesion force relative to PES–PAA (as shown in Fig. 9 (e), which excludes non-adhesive observations). In view of the similar contact angles of PES–PAA and PES–GO (cf.Fig. 6 (a)), the stronger adhesion on the GO-coated substrate cannot be explained by a macroscopic view of hydrophobicity. At the nanoscale, however, GO is known to be amphiphilic, possessing hydrophilic sheet edges,10 and basal surfaces featuring hydrophobic graphenic domains.10,59 These nanoscale hydrophobic regions embedded in GO serve as sorption sites for hydrophobic molecules,60–62 and thus can bolster microbial adhesion through interactions with hydrophobic adhesins.54
 | (1) |
![[L with combining macron]](https://www.rsc.org/images/entities/i_char_004c_0304.gif) p ≈ 0.3 nm, in line with the persistence length of proteins,63,66,67 thus suggesting outer membrane proteins (such as LapA in P. fluorescens51) as the adhesins mediating microbial attachment.
p ≈ 0.3 nm, in line with the persistence length of proteins,63,66,67 thus suggesting outer membrane proteins (such as LapA in P. fluorescens51) as the adhesins mediating microbial attachment.
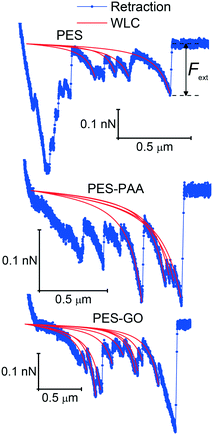 | ||
| Fig. 11 Enlarged view of retraction force curves, showing single-molecule extension events and corresponding worm-like chain (WLC) fits for various substrates, indicated in the caption. | ||
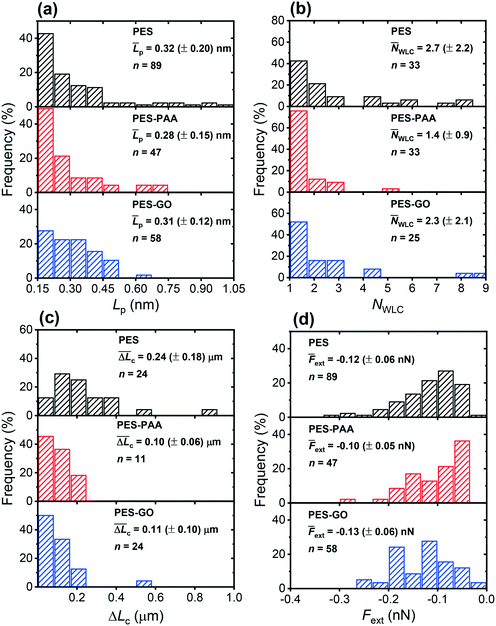 | ||
Fig. 12 (a) Distribution of best-fit persistence length values (Lp), obtained from WLC model fits on various substrates (see Fig. 11 for representative fits). (b) Distribution of the number of WLC single-molecule extension events per force curve (NWLC). (c) Distribution of ΔLc (the difference in contour length (Lc) between two consecutive WLC extension events). (d) Distribution of extension forces (Fext, the force measured at the each WLC extension peak). The caption of each figure indicates the substrate type, histogram average (![[L with combining macron]](https://www.rsc.org/images/entities/i_char_004c_0304.gif) p, p, ![[N with combining macron]](https://www.rsc.org/images/entities/i_char_004e_0304.gif) WLC, WLC,  , , ![[F with combining macron]](https://www.rsc.org/images/entities/i_char_0046_0304.gif) ext (± standard deviation)) and number of measurements (n). ext (± standard deviation)) and number of measurements (n). | ||
We further observe multiple WLC events in a single force measurement (cf.Fig. 11), allowing us to calculate the number of WLC extensions per force curve (NWLC), as shown in Fig. 12 (b). While WLC events are observed in fewer PES–GO force curves (26% compared to 33% for the other substrates), the mean values (![[N with combining macron]](https://www.rsc.org/images/entities/i_char_004e_0304.gif) WLC) are similar for PES–GO and PES, i.e., 2.3 ± 2.1 and 2.7 ± 2.2, respectively (p = 0.5). Further PES–PAA exhibits lower
WLC) are similar for PES–GO and PES, i.e., 2.3 ± 2.1 and 2.7 ± 2.2, respectively (p = 0.5). Further PES–PAA exhibits lower ![[N with combining macron]](https://www.rsc.org/images/entities/i_char_004e_0304.gif) WLC (1.4 ± 0.9) compared to PES and PES–GO (p < 0.05). Considering that NWLC is proportional to the number of adhesins that attach to the substrate, the values of
WLC (1.4 ± 0.9) compared to PES and PES–GO (p < 0.05). Considering that NWLC is proportional to the number of adhesins that attach to the substrate, the values of ![[N with combining macron]](https://www.rsc.org/images/entities/i_char_004e_0304.gif) WLC are consistent with the adhesion properties described previously in Fig. 9 (e), which showed that (provided non-adhesive events are excluded) PES and PES–GO showed similar mean adhesion forces.
WLC are consistent with the adhesion properties described previously in Fig. 9 (e), which showed that (provided non-adhesive events are excluded) PES and PES–GO showed similar mean adhesion forces.
The single-molecule extension events presented in Fig. 11 (along with corresponding WLC fits) show the occurrence of consecutive single-molecule extensions. This allows determination of the length scale of the extended biomolecule domains from ΔLc = Lc,i+1 − Lc,i, where Lc,i and Lc,i+1 denote the contour length of two consecutive WLC fits. As shown in Fig. 12 (c), ΔLc is narrowly distributed around mean values  of 0.10 (± 0.06) μm and 0.11 (± 0.10) μm for PES–PAA and PES–GO, respectively, whereas for PES we observe a much broader distribution with
  = 0.24 (± 0.18) μm. The tight distribution of ΔLc around ∼100 nm suggests that the WLC events observed on PES–GO and PES–PAA are likely due to proteinaceous adhesins whose domains unravel sequentially in pairs or triplets (the contour length of cell membrane and pilin proteins is 30–60 nm51,68), as was recently proposed for P. fluorescens adhesins.51 On the other hand, the much broader distribution observed over PES substrates could be the result of two distinct phenomena. Firstly, desorption of two different adhesin molecules of disparate lengths,53 resulting in two sequential WLC peaks characterized by a large ΔLc; the longer rupture separation observed on PES compared to the other two surfaces (see Fig. 10) supports this mechanism. Alternatively, the more hydrophobic character of PES substrates (Fig. 6 (a)) could lead to surface-induced partial unfolding of adhesin molecules,36 the corresponding change in protein conformation leading to a wider range of ΔLc values. Finally, Fig. 12 (d) presents the distribution of extension forces (Fext), defined as the force at each peak observed in a single-molecule extension event (cf.Fig. 11, top panel). The magnitude of the forces is in the range of 100–300 pN, in agreement with previous reports for unfolding forces of protein domains,51,63 with the average value (
![[F with combining macron]](https://www.rsc.org/images/entities/i_char_0046_0304.gif) ext) being similar for all substrates. This suggests that Fext is primarily due to the elastic response of adhesins to the external force, and that desorption from the substrate does not contribute significantly to the extension force.63
ext) being similar for all substrates. This suggests that Fext is primarily due to the elastic response of adhesins to the external force, and that desorption from the substrate does not contribute significantly to the extension force.63
4. Conclusions
While graphene oxide (GO) has shown strong biocidal activity,12,13,19,69 there have been conflicting reports as to whether GO can mitigate bacterial adhesion,22,23 the first step of biofilm formation and biofouling. This paper used single-cell force spectroscopy to show that edge-tethering GO nanosheets to poly(acrylic acid) (PAA) brushes produces GO coatings (formed on polyethersulfone (PES) substrates) characterized by low P. fluorescens adhesion forces. Our results show that lower mean adhesion forces observed on GO-functionalized coatings (designated PES–GO) are mainly due to the occurrence of cell–substrate repulsive (non-adhesive) forces; these are in turn derived from the hydrophilicity and steric repulsion afforded by the GO-functionalized PAA layer. A salient observation is that GO is not intrinsically anti-adhesive: its integration into a polymeric brush is essential to achieve a low-adhesion interface. GO-free PAA coatings (termed PES–PAA) also demonstrated lower bacterial adhesion due to their hydrophilicity. In the absence of PAA or GO, PES control substrates exhibited stronger bacterial adhesion due to their hydrophobicity. Analysis of the force spectroscopy data on all substrates shows that adhesion of P. fluorescens is driven by proteinaceous adhesins, whose elasticity is well described by the worm-like chain model.Our results highlight the importance of interfacial properties (e.g., surface roughness, hydrophilicity) in the formulation of GO-based antibacterial interfaces for environmental applications, pointing out possible directions for future study. In the context of water treatment systems, it is necessary to characterize bioadhesion to GO interfaces (such as those in membranes,19,20 spacers,23 and adsorbents7), under realistic hydrodynamic conditions.
Conflicts of interest
There are no conflicts of interest to declare.Acknowledgements
This work was supported by the Environment and Natural Resources Trust Fund, as recommended by the Legislative-Citizen Commission on Minnesota Resources. Portions of this work were carried out in the Characterization Facility at UMN, supported by NSF through award DMR-1420013, and at the Minnesota Nano Center, which receives partial support from NSF through the National NanoCoordinated Infrastructure Network (NNCI) (Award Number ECCS-1542202). SRVC is grateful to 3M Co. for a Non-Tenured Faculty Award.References
- K. S. Novoselov, A. K. Geim, S. V. Morozov, D. Jiang, Y. Zhang and S. V. Dubonos, et al. Electric field in atomically thin carbon films, Science, 2004, 306(5696), 666–669 CrossRef CAS PubMed.
- P. J. J. Alvarez, C. K. Chan, M. Elimelech, N. J. Halas and D. Villagrán, Emerging opportunities for nanotechnology to enhance water security, Nat. Nanotechnol., 2018, 13(8), 634–641 CrossRef CAS PubMed.
- Y. Zhu, S. Murali, W. Cai, X. Li, J. W. Suk and J. R. Potts, et al. Graphene and graphene oxide: Synthesis, properties, and applications, Adv. Mater., 2010, 22(35), 3906–3924 CrossRef CAS PubMed.
- R. K. Joshi, P. Carbone, F. C. Wang, V. G. Kravets, Y. Su and I. V. Grigorieva, et al. Precise and ultrafast molecular sieving through graphene oxide membranes, Science, 2014, 343(6172), 752–754 CrossRef CAS PubMed.
- S. C. O'Hern, M. S. H. Boutilier, J. C. Idrobo, Y. Song, J. Kong and T. Laoui, et al. Selective ionic transport through tunable subnanometer pores in single-layer graphene membranes, Nano Lett., 2014, 14(3), 1234–1241 CrossRef PubMed.
- M. Hu and B. Mi, Enabling graphene oxide nanosheets as water separation membranes, Environ. Sci. Technol., 2013, 47(8), 3715–3723 CrossRef CAS PubMed.
- N. Yousefi, X. Lu, M. Elimelech and N. Tufenkji, Environmental performance of graphene-based 3D macrostructures, Nat. Nanotechnol., 2019, 14(2), 107–119, DOI:10.1038/s41565-018-0325-6.
- Y. Yang, R. Zhao, T. Zhang, K. Zhao, P. Xiao and Y. Ma, et al. Graphene-Based Standalone Solar Energy Converter for Water Desalination and Purification, ACS Nano, 2018, 12(1), 829–835, DOI:10.1021/acsnano.7b08196.
- F. Perreault, A. Fonseca De Faria and M. Elimelech, Environmental applications of graphene-based nanomaterials, Chem. Soc. Rev., 2015, 44(16), 5861–5896 RSC.
- V. C. Sanchez, A. Jachak, R. H. Hurt and A. B. Kane, Biological interactions of graphene-family nanomaterials: An interdisciplinary review, Chem. Res. Toxicol., 2012, 25(1), 15–34 Search PubMed.
- J. Chen, H. Peng, X. Wang, F. Shao, Z. Yuan and H. Han, Graphene oxide exhibits broad-spectrum antimicrobial activity against bacterial phytopathogens and fungal conidia by intertwining and membrane perturbation, Nanoscale, 2014, 6(3), 1879–1889 RSC , Available from: http://xlink.rsc.org/?DOI=C3NR04941H.
- W. Hu, C. Peng, W. Luo, M. Lv, X. Li and D. Li, et al. Graphene-based antibacterial paper, ACS Nano, 2010, 4(7), 4317–4323 CrossRef CAS PubMed.
- F. Perreault, A. F. De Faria, S. Nejati and M. Elimelech, Antimicrobial Properties of Graphene Oxide Nanosheets: Why Size Matters, ACS Nano, 2015, 9(7), 7226–7236 CrossRef CAS PubMed.
- S. Gurunathan, J. W. Han, A. A. Dayem, V. Eppakayala and J. H. Kim, Oxidative stress-mediated antibacterial activity of graphene oxide and reduced graphene oxide in Pseudomonas aeruginosa, Int. J. Nanomed., 2012, 7, 5901–5914 CrossRef CAS PubMed.
- H. R. Chae, J. Lee, C. H. Lee, I. C. Kim and P. K. Park, Graphene oxide-embedded thin-film composite reverse osmosis membrane with high flux, anti-biofouling, and chlorine resistance, J. Membr. Sci., 2015, 483, 128–135 CrossRef CAS.
- M. E. A. Ali, L. Wang, X. Wang and X. Feng, Thin film composite membranes embedded with graphene oxide for water desalination, Desalination, 2016, 386, 67–76 CrossRef CAS.
- A. Inurria, P. Cay-Durgun, D. Rice, H. Zhang, D. K. Seo and M. L. Lind, et al. Polyamide thin-film nanocomposite membranes with graphene oxide nanosheets: Balancing membrane performance and fouling propensity, Desalination, 2018, 451, 139–147 CrossRef.
- X. Lu, X. Feng, X. Zhang, M. N. Chukwu, C. O. Osuji and M. Elimelech, Fabrication of a Desalination Membrane with Enhanced Microbial Resistance through Vertical Alignment of Graphene Oxide, Environ. Sci. Technol. Lett., 2018, 5(10), 614–620 CrossRef CAS.
- F. Perreault, M. E. Tousley and M. Elimelech, Thin-Film Composite Polyamide Membranes Functionalized with Biocidal Graphene Oxide Nanosheets, Environ. Sci. Technol. Lett., 2013, 1(1), 71–76 CrossRef.
- F. Perreault, H. Jaramillo, M. Xie, M. Ude, L. D. Nghiem and M. Elimelech, Biofouling Mitigation in Forward Osmosis Using Graphene Oxide Functionalized Thin-Film Composite Membranes, Environ. Sci. Technol., 2016, 50(11), 5840–5848 CrossRef CAS PubMed.
- Y. F. Dufrene, Sticky microbes: Forces in microbial cell adhesion, Trends Microbiol., 2015, 23(6), 376–382 CrossRef CAS PubMed.
- J. Xue, S. BinAhmed, Z. Wang, N. G. Karp, B. L. Stottrup and S. Romero-Vargas Castrillón, Bacterial Adhesion to Graphene Oxide (GO)-Functionalized Interfaces Is Determined by Hydrophobicity and GO Sheet Spatial Orientation, Environ. Sci. Technol. Lett., 2018, 5(1), 14–19 CrossRef CAS.
- D. Rice, A. C. Barrios, Z. Xiao, A. Bogler, E. Bar-Zeev and F. Perreault, Development of anti-biofouling feed spacers to improve performance of reverse osmosis modules, Water Res., 2018, 145, 599–607 CrossRef CAS PubMed.
- S. Kang and M. Elimelech, Bioinspired single bacterial cell force spectroscopy, Langmuir, 2009, 25(17), 9656–9659 CrossRef CAS PubMed.
- S. M. Hinsa, M. Espinosa-Urgel, J. L. Ramos and G. A. O'Toole, Transition from reversible to irreversible attachment during biofilm formation by Pseudomonas fluorescens WCS365 requires an ABC transporter and a large secreted protein, Mol. Microbiol., 2003, 49(4), 905–918 CrossRef CAS PubMed.
- I. E. Ivanov, C. D. Boyd, P. D. Newell, M. E. Schwartz, L. Turnbull and M. S. Johnson, et al. Atomic force and super-resolution microscopy support a role for LapA as a cell-surface biofilm adhesin of Pseudomonas fluorescens, Res. Microbiol., 2012, 163(9–10), 685–691 CrossRef CAS PubMed.
- H. Wang and H. R. Brown, Self-initiated photopolymerization and photografting of acrylic monomers, Macromol. Rapid Commun., 2004, 25(11), 1095–1099 CrossRef CAS.
- J. Deng, L. Wang, L. Liu and W. Yang, Developments and new applications of UV-induced surface graft polymerizations, Prog. Polym. Sci., 2009, 34(2), 156–193 CrossRef CAS.
- B. Van Der Bruggen, Chemical modification of polyethersulfone nanofiltration membranes: A review, J. Appl. Polym. Sci., 2009, 114(1), 630–642 CrossRef CAS.
- E. Igbinigun, Y. Fennell, R. Malaisamy, K. L. Jones and V. Morris, Graphene oxide functionalized polyethersulfone membrane to reduce organic fouling, J. Membr. Sci., 2016, 514, 518–526 CrossRef CAS.
- M. Homayoonfal, A. Akbari and M. R. Mehrnia, Preparation of polysulfone nanofiltration membranes by UV-assisted grafting polymerization for water softening, Desalination, 2010, 263(1–3), 217–225 CrossRef CAS.
- D. Li, M. B. Müller, S. Gilje, R. B. Kaner and G. G. Wallace, Processable aqueous dispersions of graphene nanosheets, Nat. Nanotechnol., 2008, 3(2), 101–105 CrossRef CAS PubMed , Available from: http://www.nature.com/doifinder/10.1038/nnano.2007.451.
- K. N. Kudin, B. Ozbas, H. C. Schniepp, R. K. Prud'homme, I. A. Aksay and R. Car, Raman spectra of graphite oxide and functionalized graphene sheets, Nano Lett., 2008, 8(1), 36–41 CrossRef CAS PubMed.
- Z. Grabarek and J. Gergely, Zero-length crosslinking procedure with the use of active esters, Anal. Biochem., 1990, 185(1), 131–135 CrossRef CAS PubMed.
- S. L. Walker, S. Bhattacharjee, E. M. V. Hoek and M. Elimelech, A novel asymmetric clamping cell for measuring streaming potential of flat surfaces, Langmuir, 2002, 18(6), 2193–2198 CrossRef CAS.
- S. Binahmed, A. Hasane, Z. Wang, A. Mansurov and S. Romero-Vargas Castrillón, Bacterial Adhesion to Ultrafiltration Membranes: Role of Hydrophilicity, Natural Organic Matter, and Cell-Surface Macromolecules, Environ. Sci. Technol., 2018, 52(1), 162–172 CrossRef CAS PubMed.
- H. Ma, R. H. Davis and C. N. Bowman, Novel sequential photoinduced living graft polymerization, Macromolecules, 2000, 33(2), 331–335 CrossRef CAS.
- C. Klaysom, B. P. Ladewig, G. Q. M. Lu and L. Wang, Preparation and characterization of sulfonated polyethersulfone for cation-exchange membranes, J. Membr. Sci., 2011, 368(1–2), 48–53 CrossRef CAS.
- E. Pretsch, P. Bühlmann and C. Affolter, Structure Determination of Organic Compounds, Springer, 3rd edn, 2000, p. 338 Search PubMed.
- L. Wang, X. Song, T. Wang, S. Wang, Z. Wang and C. Gao, Fabrication and characterization of polyethersulfone/carbon nanotubes (PES/CNTs) based mixed matrix membranes (MMMs) for nanofiltration application, Appl. Surf. Sci., 2015, 330, 118–125 CrossRef CAS.
- P. J. Evans, M. R. Bird, A. Pihlajamäki and M. Nyström, The influence of hydrophobicity, roughness and charge upon ultrafiltration membranes for black tea liquor clarification, J. Membr. Sci., 2008, 313(1–2), 250–262 CrossRef CAS.
- A. Weis, M. R. Bird, M. Nyström and C. Wright, The influence of morphology, hydrophobicity and charge upon the long-term performance of ultrafiltration membranes fouled with spent sulphite liquor, Desalination, 2005, 175(1 SPEC. ISS), 73–85 CrossRef CAS.
- H. Susanto and M. Ulbricht, Characteristics, performance and stability of polyethersulfone ultrafiltration membranes prepared by phase separation method using different macromolecular additives, J. Membr. Sci., 2009, 327(1–2), 125–135 CrossRef CAS.
- S. Kasemset, Z. He, D. J. Miller, B. D. Freeman and M. M. Sharma, Effect of polydopamine deposition conditions on polysulfone ultrafiltration membrane properties and threshold flux during oil/water emulsion filtration, Polymer, 2016, 97, 247–257 CrossRef CAS.
- N. Park, B. Kwon, I. S. Kim and J. Cho, Biofouling potential of various NF membranes with respect to bacteria and their soluble microbial products (SMP): Characterizations, flux decline, and transport parameters, J. Membr. Sci., 2005, 258(1–2), 43–54 CrossRef CAS.
- M. Pasmore, P. Todd, S. Smith, D. Baker, J. A. Silverstein and D. Coons, et al. Effects of ultrafiltration membrane surface properties on Pseudomonas aeruginosa biofilm initiation for the purpose of reducing biofouling, J. Membr. Sci., 2001, 194(1), 15–32 CrossRef CAS.
- E. M. Vrijenhoek, S. Hong and M. Elimelech, Influence of membrane surface properties on initial rate of colloidal fouling of reverse osmosis and nanofiltration membranes, J. Membr. Sci., 2001, 188(1), 115–128 CrossRef CAS.
- M. Elimelech, X. Zhu, A. E. Childress and S. Hong, Role of membrane surface morphology in colloidal fouling of cellulose acetate and composite aromatic polyamide reverse osmosis membranes, J. Membr. Sci., 1997, 127(1), 101–109 CrossRef CAS.
- T. Wu, P. Gong, I. Szleifer, P. Vlček, V. Šubr and J. Genzer, Behavior of surface-anchored poly(acrylic acid) brushes with grafting density gradients on solid substrates: 1. Experiment, Macromolecules, 2007, 40(24), 8756–8764 CrossRef CAS.
- T. A. Camesano, Y. Liu and M. Datta, Measuring bacterial adhesion at environmental interfaces with single-cell and single-molecule techniques, Adv. Water Resour., 2007, 30(6–7), 1470–1491 CrossRef CAS.
- S. El-Kirat-Chatel, A. Beaussart, C. D. Boyd, G. A. O'Toole and Y. F. Dufrêne, Single-cell and single-molecule analysis deciphers the localization, adhesion, and mechanics of the biofilm adhesin LapA, ACS Chem. Biol., 2014, 9(2), 485–494 CrossRef CAS PubMed.
- A. Ronen, W. Duan, I. Wheeldon, S. Walker and D. Jassby, Microbial Attachment Inhibition through Low-Voltage Electrochemical Reactions on Electrically Conducting Membranes, Environ. Sci. Technol., 2015, 49(21), 12741–12750 CrossRef CAS PubMed.
- G. Zeng, T. Müller and R. L. Meyer, Single-cell force spectroscopy of bacteria enabled by naturally derived proteins, Langmuir, 2014, 30(14), 4019–4025 CrossRef CAS PubMed.
- S. J. Vesper, Production of Pili (Fimbriae) by Pseudomonas fluorescens and Correlation with Attachment to Corn Roots, Appl. Environ. Microbiol., 1987, 53(7), 1397–1405 CAS , Available from: http://www.ncbi.nlm.nih.gov/pubmed/16347370%5Cnhttp://www.pubmedcentral.nih.gov/articlerender.fcgi?artid=PMC203883.
- N. Dasgupta, S. K. Arora and R. Ramphal, The Flagellar System of Pseudomonas aeruginosa BT - Pseudomonas: Volume 1 Genomics, Life Style and Molecular Architecture, ed. J.-L. Ramos, Springer US, Boston, MA, 2004, pp. 675–698, DOI:10.1007/978-1-4419-9086-0_22.
- Y. L. Ong, A. Razatos, G. Georgiou and M. M. Sharma, Adhesion forces between E. coli bacteria and biomaterial surfaces, Langmuir, 1999, 15(8), 2719–2725 CrossRef CAS.
- S. Pasche, M. Textor, L. Meagher, N. D. Spencer and H. J. Griesser, Relationship between interfacial forces measured by colloid-probe atomic force microscopy and protein resistance of poly(ethylene glycol)-grafted poly(L-lysine) adlayers on niobia surfaces, Langmuir, 2005, 21(14), 6508–6520 CrossRef CAS PubMed.
- S. Gon, K. N. Kumar, K. Nüsslein and M. M. Santore, How bacteria adhere to brushy PEG surfaces: Clinging to flaws and compressing the brush, Macromolecules, 2012, 45(20), 8373–8381 CrossRef CAS PubMed.
- K. Erickson, R. Erni, Z. Lee, N. Alem, W. Gannett and A. Zettl, Determination of the local chemical structure of graphene oxide and reduced graphene oxide, Adv. Mater., 2010, 22(40), 4467–4472 CrossRef CAS PubMed.
- L. J. Cote, J. Kim, V. C. Tung, J. Luo, F. Kim and J. Huang, Graphene oxide as surfactant sheets, Pure Appl. Chem., 2010, 83(1), 95–110 Search PubMed , Available from: https://www.degruyter.com/view/j/pac.2011.83.issue-1/pac-con-10-10-25/pac-con-10-10-25.xml.
- J. Kim, L. J. Cote, F. Kim, W. Yuan, K. R. Shull and J. Huang, Graphene oxide sheets at interfaces, J. Am. Chem. Soc., 2010, 132(23), 8180–8186 CrossRef CAS PubMed.
- Z. Liu, J. T. Robinson, X. Sun and H. Dai, PEGylated nanographene oxide for delivery of water-insoluble cancer drugs, J. Am. Chem. Soc., 2008, 130(33), 10876–10877 CrossRef CAS PubMed.
- M. Rief, M. Gautel, F. Oesterhelt, J. M. Fernandez and H. E. Gaub, Reversible Unfolding of Individual Titin Immunoglobulin Domains by AFM, Science, 1997, 276(5315), 1109–1112, DOI:10.1126/science.276.5315.1109.
- G. Francius, D. Alsteens, V. Dupres, S. Lebeer, S. De Keersmaecker and J. Vanderleyden, et al. Stretching polysaccharides on live cells using single molecule force spectroscopy, Nat. Protoc., 2009, 4(6), 939–946 CrossRef CAS PubMed.
- H. Li, B. Liu, X. Zhang, C. Gao, J. Shen and G. Zou, Single-molecule force spectroscopy on poly(acrylic acid) by AFM, Langmuir, 1999, 15(6), 2120–2124 CrossRef CAS.
- G. Stirnemann, D. Giganti, J. M. Fernandez and B. J. Berne, Elasticity, structure, and relaxation of extended proteins under force, Proc. Natl. Acad. Sci. U. S. A., 2013, 110(10), 3847–3852, DOI:10.1073/pnas.1300596110.
- M. Carrion-Vazquez, A. F. Oberhauser, S. B. Fowler, P. E. Marszalek, S. E. Broedel and J. Clarke, et al. Mechanical and chemical unfolding of a single protein: a comparison, Proc. Natl. Acad. Sci. U. S. A., 1999, 96(7), 3694–3699 CrossRef CAS PubMed , Available from: http://www.ncbi.nlm.nih.gov/pubmed/10097099%0Ahttp://www.pubmedcentral.nih.gov/articlerender.fcgi?artid=PMC22356.
- A. Filloux, S. de Bentzmann, M. Aurouze, A. Lazdunski and I. Vallet, Fimbrial Genes in Pseudomonas Aeruginosa and Pseudomonas Putida, in Pseudomonas, ed. J. L. Ramos, 2004, pp. 721–748 Search PubMed.
- O. Akhavan and E. Ghaderi, Toxicity of graphene and graphene oxide nanowalls against bacteria, ACS Nano, 2010, 4(10), 5731–5736 CrossRef CAS PubMed.
Footnotes |
| † Electronic supplementary information (ESI) available. See DOI: 10.1039/c9en00499h |
| ‡ These authors contributed equally to this work. |
| This journal is © The Royal Society of Chemistry 2019 |

