 Open Access Article
Creative Commons Attribution 3.0 Unported Licence
Impact of freeze–thaw weathering on integrity, internal structure and particle release from micro- and nanostructured cement composites†
Birgit
Funk
 a,
Daniel
Göhler
 b,
Bernhard
Sachsenhauser
c,
Michael
Stintz
 b,
Burkhard
Stahlmecke
 d,
Blake A.
Johnson
e and
Wendel
Wohlleben
 *e
*e
aZoz GmbH, D-57482 Wenden, Germany
bResearch Group Mechanical Process Engineering, Institute of Process Engineering and Environmental Technology, Technische Universität Dresden, D-01062 Dresden, Germany
cBASF Construction Solutions GmbH, D-83308 Trostberg, Germany
dInstitute of Energy and Environmental Technology e.V. (IUTA), D-47229 Duisburg, Germany
eAdvanced Materials Research, Department of Material Physics, BASF SE, D-67056 Ludwigshafen, Germany. E-mail: Wendel.Wohlleben@basf.com
First published on 13th March 2019
Abstract
Nowadays, both micro- and nanomaterials are processed in cement to improve application properties or reduce cement consumption in concrete. The present study deals with the impact of nanostructured SiO2, TiO2 and milled slags in cement composites on material properties, aging resilience and release behaviour into the environment. In this context, hydrated and hardened cement pastes were weathered artificially by means of the standardised capillary suction of de-icing solution and repeated freeze–thaw cycle test method. Mineralogical, physical, mechanical and chemical properties as well as hydration products were analysed by electron microscopy, mercury intrusion porosimetry, thermogravimetry as well as differential scanning calorimetry and ultrasonic propagation analysis. Release characterisation was performed concerning weathering-induced fragment release into the liquid phase by gravimetry and sanding-induced particle release into the air by gravimetry, differential electrical mobility analyses, time of flight spectrometry, condensation nuclei counting and electron microscopy. Freeze–thaw weathering led for all cement composites to considerable but different progressed deteriorations. The worst material performance was observed for pure cement and the cement composite with state of the art ground granulated slag. The cement composites with nanostructured SiO2 and activated ground granulated slag showed a higher durability and less deteriorations. These effects could be explained by structure density, porosimetry and the formed hydration products. Furthermore, it was shown that weathering-induced changes in the material properties lead to significant changes concerning sanding-induced particle release into air. In summary, this study investigated the consequences of (nano)-materials, which modulate the recrystallization during hardening of cement pastes to a solid, internally nanostructured material, on multi-structural release. In this context, critical stress scenarios, which are encountered during intended use, were simulated. The transforming synthesis differentiates this case study from almost all other release studies for nanomaterials, which typically assess polymer nanocomposites, where nanomaterials act as additives, pigments or fillers in an otherwise unchanged matrix.
Environmental significanceEnvironmental impacts can change substantially the material properties of nanoenabled products and thus the release behaviour into the environment. In this context, the study addresses cements composites that have the potential to improve sustainably the construction material concrete. Results of a comprehensive testing program provide a mechanistic insight concerning the impact of freeze–thaw weathering on integrity, internal structure and particle release behaviour of micro- and nanostructured cement composites. Since nanomaterial use in cements is accompanied by a transforming synthesis (recrystallization during hardening), the consequence of nanomaterial use in cements was investigated that differentiate this study from almost all others release studies. It is shown that nanomaterial additives have the potential to modulate the release behaviour over the lifecycle of cement composites. |
1. Introduction
Based on the advantageous mechanical properties and excellent processability, Portland cement concrete is one of the most important construction materials all over the world. In most cases, cement is the basic component of concrete and serves therein after the addition of mixing water as binder material due to its chemical transformation into a solid continuous phase. The high demand on concrete requires also huge amounts of cement that lead to a current worldwide cement production volume of around 4 billion tonnes per year.1Beside the benefits of concrete, one global challenge is the considerable carbon dioxide emission (approx. 5 wt-% of global anthropogenic CO2 emissions)1 accompanying the production of cement (e.g. 0.562 tCO2/tcement in Germany in 2015);2 especially due to limestone decalcification and clinker burning. Approaches to reduce emissions deal with improved cement compositions or the development of advanced concretes. One possibility is the substitution by suitable latent hydraulic materials (i.e., activator-based material that cured chemically with water in water) like fly ash or ground granulated blastfurnace slag (GGBS).3 Another way is the use of high or ultrahigh performance concrete, which contain specific fillers or functional additives like hydraulic micrometre-sized silica,4 nanostructured silica,4–11 carbon nanotubes12,13 or carbon fibres.14
During the lifetime of concrete, the material ages due to temperature changes and attack of aggressive media like acid rain, saline solutions from de-icing salt, sewage or carbon dioxide and sulphur oxide as gaseous pollutants. Deterioration of concrete increases the probability of fragmentation, and the probability of molecular or particulate additives to leach into the surrounding environment. The processes and consequences of such deterioration have to be evaluated and quantified. Especially nanomaterials are associated with a higher uncertainty of environment, health and safety considerations in comparison to more conventional materials, the increasing application of nanomaterials as filler or functional additive in cements and concretes demands also an appropriate risk assessment. The nanoform of a substance may have a lower threshold of adverse effects than the non-nanoform of the same substance, especially due to the increased specific surface area, which in turn is a prerequisite for the nanomaterial's performance as a binder.
In recent years, several experimental studies concerning release into air or water from solid nanocomposites, especially for the plastic, paint and coating industry, were performed,15–17 whereof some dealt also with the impact of the materials life cycle,18–25i.e., the effect on release by the change of material properties due to aging. An increasing number of studies concerning the release or exposure characterisation emerges for concretes26–32 or hardened cement pastes,19,33–35 but rarely differentiate the influence of nanomaterial additives.
The effect of artificially weathering on the release behaviour into air from cement nanocomposites (containing 2 wt-% of carbon nanotubes resp. 1 wt-% nanosized calcium silicate hydrates) was previously analysed by simulated weathering based on a method that was standardised for plastics/coatings (ISO 4892-2:2006 (ref. 36)).19 Neither the surface characterisation concerning morphology and chemistry nor the performed release analyses for weak (abrasion) and moderate (sanding) mechanical stress showed significant differences between the aged samples and their unaged counterparts. However, the aging by UV irradiation with or without rain may not have tested the most relevant mechanism of degradation for cementitious systems. Hirth et al. analysed in detail sanding-induced fragments from CNT-containing cements concerning CNT protrusions.33 Further release analyses by mechanical shear (sonication) during immersion in water showed a high fragment release rate that was slightly reduced by embedded CNT fillers,34 and where recently followed up by high-throughput ecotoxicity screening of the hazards of released fragments.37 A high fragment release was also observed during leaching (7 d, ultrapure water, stirring) of photocatalytic cement nanocomposites (approx. 2.85 wt-% photocatalytic TiO2).35 Bossa et al. showed furthermore that the release quantities increase with increasing surface porosity, which accompany with higher water to cement ratios (w/c) or longer leaching time.
The present work, which deals with the effects on the binder matrix of cementitious materials (i.e., hardened cement pastes), advances from less intense processes such as leaching or UV irradiation to a more aggressive weathering that was especially designed for concrete – the standardised capillary suction of de-icing solution and freeze thaw test (CDF) according to CEN/TS 12390-9:2016.38 To characterise the impact of this weathering procedure on integrity, internal structure and particle release from micro- and nanostructured cement composites, a comprehensive test program was performed before, during and after CDF. In this context, the modulation of fragmentation and release by different materials, which are used to optimize the commercial value of concrete by reducing embodied energy, is considered comparatively.
2. Experimental details
2.1 Samples systems and sample preparation
Overall five types of cement composites (Table 1) based on high purity Portland cement with low iron content (CEM I 52.5R, HeidelbergCement AG, Heidelberg, Germany) and four different additives were analysed in this study. The solely hydrated cement (CEM_hyd) served therefore as reference material to study the impact of the additives. In order to compare also the release behaviour of the cement composites with the ones of concrete, analyses were also performed for a high performance concrete (FuturBeton), which contains beside CEM and HKP-GGBS as clinker substitute also sand and coarse grain in different sizes.| ID of compositea [−] | ID of additive [−] | Formulation for preparation additive/water/superplasticizer/others [wt-% related to cement] | Dry composite density [g cm−3] |
|---|---|---|---|
| a Note: IDs are supplemented by a star, when weathered samples are discussed. b Glenium® ACE 431, BASF Construction Solutions GmbH, Trostberg, Germany: PCE-content: 30% (only for these concrete samples used). | |||
| CEM_hyd | — | 0.00/40.0/0.0/0.0 | 1.82 |
| CEM_GGBS | GGBS | 42.9/57.1/0.0/0.0 | 1.70 |
| CEM_HKP-GGBS | HKP-GGBS | 42.9/57.1/0.0/0.0 | 1.81 |
| CEM_SiO2 | SiO2_nano | 1.0/40.0/0.6/0.0 | 1.65 |
| CEM_TiO2 | TiO2_nano | 1.0/40.0/0.6/0.0 | 1.81 |
| FuturBeton | HKP-GGBS | 42.9/43.0/0.52b/643.1 | 2.34 |
The additives GGBS and HKP-GGBS (High Kinetic Processing-GGBS) were produced based on processing of a commercial granulated blastfurnace slag (GBS, ThyssenKrupp Steel Europe AG, Duisburg, Germany). Therefore, 5 kg of GBS were dried at 60 °C and ball milled (drum mill Comb03-A03, Zoz GmbH, Wenden, Germany) with 44 kg corundum balls (ball diameter between 5/4′′ and 7/8′′, total filling level of 66.7 vol-%) at 50 rpm for 4 h to obtain GGBS. Afterwards, GGBS was processed to HKP-GGBS by high energy milling (Simoloyer® CM08-8lm, Zoz GmbH, Wenden, Germany). More details concerning the production of HKP-GGBS are provided by Funk et al.39 Beside the two modifications of blastfurnace slag, two commercial nanomaterials, i.e., synthetic amorphous silica (SiO2_nano, CAS 112945-52-5, primary particle diameter of 26 nm, corresponds to NM203 of the JRC repository)40 and titanium dioxide (TiO2_nano, CAS 13463-67-7, primary particle diameter of 21 nm, corresponds to NM105 of the JRC repository)41 were chosen for cement composite preparation. Data on the elemental composition and the mass-specific surface area for each of the processed raw materials are provided in Table S1.†
As it can be deduced from the formulation data in Table 1, the cement pastes preparation was performed with technical relevant amounts of additives and a constant water to cement ratio (w/c) of 0.4 according to DIN 1045-2:2008 (ref. 42) to i) ensure complete hydration and hardening and ii) prevent incomplete binding (as typical for w/c > 0.4). In order to receive a suitable processability, the components of each composite were stirred with mixing water at room temperature for at least 2 min. In the case of the blast furnace slag composites (CEM_GGBS, CEM_HKP-GGBS), the slag additive and the cement were mixed in advance by a continuous ploughshare mixer (Ploughshare® Food Mixer, Gebrüder Lödige Maschinenbau GmbH, Paderborn, Germany). For the preparation of the nanomaterial-containing cements pastes (CEM_SiO2, CEM_TiO2), SiO2_nano and TiO2_nano respectively were dispersed homogenously in the mixing water with the addition of a superplasticizer (MasterGlenium® SKY 592, BASF Construction Solutions GmbH, Trostberg, Germany) by means of a dissolver prior the addition of cement.
Three different types of test specimens were casted based on the prepared cement/concrete pastes: i) 100 × 100 × 100 mm3 cubes according to EN 12390-2:2009 (ref. 43) for the standardised artificial freeze–thaw weathering, ii) non-standardised discs with a nominal diameter of 110 mm (bottom side diameter of 115.36 mm, bevelling of 15°, height of 10 mm) for release experiments on unaged samples and iii) standardised (mortar standards) 40 × 40 × 160 mm3 prisms. To achieve comparable curing conditions, all test specimens were stored according to DIN EN 196-1:2016 (ref. 44) for at least 28 days under wet conditions at room temperature prior to any analysis.
2.2 Sample conditioning by artificial freeze–thaw weathering (CDF)
The cubes of the cement composites CEM_hyd, CEM_GGBS, CEM_HKP-GGBS and CEM_SiO2 were artificially weathered by means of the CDF method according to CEN/TS 12390-9:2016 (ref. 38) that was developed to simulate aggressive environmental conditions for geographic regions where both freeze–thaw-cycles and seawater or de-icing salt does matter. Therefore, 5 afore casted and defined stored (i.e., 1 d in covered casting mould, 6 d in water bath, 20 d in climate chamber) test specimens per cement composite were sealed on their side facades and partly submerged (approx. 5 mm) in a 3 wt-% aqueous NaCl solution for 7 d (within a test container with (10 ± 1) mm solution level and (5 ± 1) mm sample distance pieces). After gravimetrical determination of the amount of penetrated NaCl solution, the still submerged samples underwent 28 repeated freeze–thaw cycles. Each freeze–thaw cycle (FTC) based on 4 h successive cooling from 20 °C to −20 °C, resting at −20 °C for 3 h, successive reheating from −20 to 20 °C for 4 h and resting at 20 °C for 1 h.2.3 Material characterisation
The cement composites were characterised before, during (i.e., between single freeze–thaw cycles) and after freeze–thaw weathering concerning surface structure and hydration products by scanning electron microscopy (SEM), water absorption by gravimetry (GM), water content by simultaneous thermal analyses (STA), porosity by mercury intrusion porosimetry (MIP) and the relative dynamic E-modulus (RDM) by ultrasonic propagation analyses. In the cases of SEM, STA and MIP, analyses were performed on the base of fragments taken from the inner side of the cubes to avoid artefacts, which can originate from mechanical-induced densification of outer regions.Surface structure analyses, especially for the evaluation of the hydration progress and for the identification of hydration products, were performed on the base of a gentle beam SEM (JSM-7500F, JEOL Ltd., Tokyo, Japan).
Water absorption analyses by gravimetry were performed before, during and after the 7 d lasting storage in the NaCl solution (i.e., prior the freeze–thaw weathering procedure). For this purpose, the samples were removed from the test container and placed on an analytical balance.
Water content analyses were conducted within a nitrogen atmosphere by simultaneous thermal analyses (STA 449 F1 Jupiter® with platinum furnace, NETZSCH-Gerätebau GmbH, Selb, Germany), which comprises both thermogravimetry (TG) and differential scanning calorimetry (DSC). Prior to the analyses, all samples were dried at 35 °C to constant weight and grinded by pestle and mortar. The employed crucibles and sample holders were made of a platinum–rhodium alloy. The temperature gradient was chosen to be 10 K min−1 within a temperature range of 30–1000 °C, while measurement data were evaluated with commercial analytical software (Proteus®, NETZSCH-Gerätebau GmbH, Selb, Germany).
Pore size analyses were realised by MIP (Autopore 9600, Micromeritics®, Aachen, Germany) over a pressure range between 0.10 psia and 61![[thin space (1/6-em)]](https://www.rsc.org/images/entities/char_2009.gif) 000 psia (sample quantity 2.5 g ± 0.2 g), while data evaluation was performed with commercial software (MicroActive, Micromeritics®, Aachen, Germany).
000 psia (sample quantity 2.5 g ± 0.2 g), while data evaluation was performed with commercial software (MicroActive, Micromeritics®, Aachen, Germany).
Ultrasonic propagation analyses, i.e., transit time analyses, for the determination of the RDMs were performed for five times (i.e., for the FTCs 0, 4, 8, 16, 28). Analyses were performed after each of the mentioned FTCs in the wake of fragment release characterisation (see chapter 2.4) and sample mass characterisation by placing the samples between ultrasonic transmitter and receiver.
2.4 Release characterisation
Release characterisation was performed for weathering-induced fragment release into water and sanding-induced release into air prior and after freeze–thaw weathering.Weathering-induced fragment release into water was characterised according to the non-size-selective CDF method of CEN/TS 12390-9:2016,38 which probes rather the coarse particle fraction, for five times (i.e., for the FTCs 0, 4, 8, 16, 28). After each of the mentioned FTCs, the test container, which contained sample and NaCl solution, was transferred to an ultrasonic bath and treated for 3 minutes. Afterwards, the NaCl solution was filtrated (folded filter, particle retention 8–10 μm, Sartorius™ FT-4-303-270, Sartorius AG, Göttingen, Germany) and the release quantities determined gravimetrically. According to CEN/TS 12390-9:2016,38 the results of the first FTC were discarded.
Sanding-induced particle release into air was simulated according to ISO/DIS 21683:2018(E)45 by means of a sanding apparatus that was design to mimic professional sanding processes (similar to other release processes accompanied with moderate mechanical stress on surfaces like driving on highways) on the base of single short-term testing (i.e., <10 s) under clean room conditions.46 The sanding apparatus contains a vertical aligned revolution-controlled rotatory sander (Model Dremel 400 Series Digital Dremel Europe, Breda, The Netherlands), which interacts due to gravity with the sample surface that is supplied horizontally beneath the sanding tool. Sanding procedures were performed in analogy to Göhler et al.21 with P600 sanding paper (WPF P600, Mirka GmbH, Sulzbach, Germany), a contact force of 0.5 N and a cutting velocity of 1.8 m s−1 that results in a cutting power of 1.3 W. Released airborne particles were characterised by time of flight spectrometry (TOF, Model APS 3321, TSI Inc. Shoreview, USA), differential electrical mobility analyses (DEMA, Model EEPS 3090, TSI Inc., Shoreview, USA), condensation nuclei counting (CNC, Model CPC 3775 and Model CPC 3022, TSI Inc. Shoreview, USA) and by SEM (Gemini 982, Carl Zeiss AG, Jena, Germany) after electrostatic deposition (electrostatic precipitator according to Dixkens & Fissan,47 Prototype of Model NAS 3089, TSI-Inc., Shoreview, USA). Area specific particle release numbers were calculated according to Göhler et al.21 on the base of measured particle size distributions (total size range 5.6 nm−20 μm) and particle number concentrations as well as realised experimental conditions. To enable sanding with the given apparatus, the sample specimens were converted at first into practicable forms. The dish-shaped samples of the non-weathered cement composites were cut by a table saw into ashlar-formed subsamples (20 mm × 70 mm × 10 mm), while adequate fragments of the destructed cuboids were fixated within a silicon elastomer to receive a plane-parallel sample surface for testing. Furthermore, the at least 28 d cured cement/concrete samples were prior the analyses thermal equilibrated, i.e., the samples were dried for ≥24 h at 45 °C and subsequently cooled to room temperature within desiccators.
3. Results and discussion
As mentioned before, this study deals with the effects on the binder matrix of cementitious materials. Accordingly, most of the following results apply solely for hardened cement pastes (solely cement, water and additives) that must not be confused with mortar (contains additionally sand) or concrete (contains mortar and gravel).3.1 Material properties
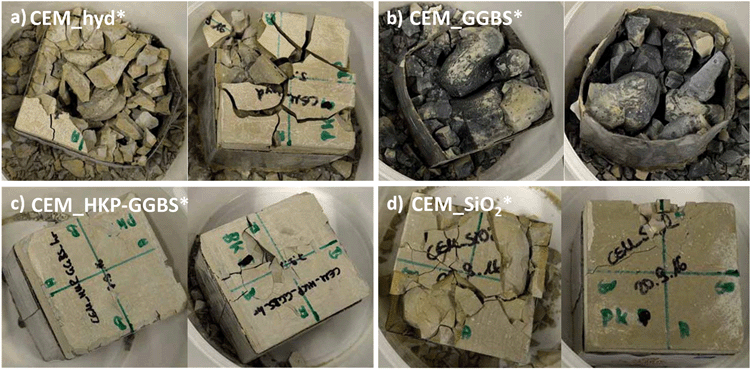 | ||
| Fig. 1 Test specimens of a) CEM_hyd*, b) CEM_GGBS*, c) CEM_HKP-GGBS* and d) CEM_SiO2* after artificial freeze–thaw weathering. | ||
Crack formation and fragment spalling are mainly attributed to the volume expansion of water from residual moisture during freezing that pushes the cement matrix apart if there is lack for compensation due to low porosity. Likewise, a crack formation is also possible due to shrinkage during hydration. The availability of water within the samples based typically on residual moisture from sample preparation (w/z ratio of 0.4) prior freeze–thaw weathering and water absorption by capillary suction after sample curing during freeze–thaw weathering.
It is believed that CEM_GGBS contained the highest residual moisture due to its composition, which causes a high internal pressure during freezing and lead to high deteriorations. The water absorption by capillary suction of CEM_GGBS should be lower than for CEM_hyd since it is assumed that CEM_GGBS has a denser surface due to filler presence. The reduced deterioration of the samples CEM_SiO2* and CEM_HKP-GGBS* is attributed to their filler-induced high surface density that should go along with a reduced water absorption by capillary suction.
Beside the volume expansion of water from residual moisture during freezing, hydration products (see below) can also contribute to crack formation, for example due to the formation of voluminous ettringite structures (sulphate attack) that can be attributed to increased proportions of tricalcium aluminate in the processed cement.
![[s with combining macron]](https://www.rsc.org/images/entities/char_0073_0304.gif) ), lead to the formation of different hydration products like calcium silicate hydrates (CSH, C–S–H: flakes, dendrites, gel), calcium hydroxide (Ca(OH)2, portlandite, CH: plates) and hydrous calcium aluminium sulphate (Ca6Al2(SO4)3(OH)12·26H2O, ettringite, C3A·3C
), lead to the formation of different hydration products like calcium silicate hydrates (CSH, C–S–H: flakes, dendrites, gel), calcium hydroxide (Ca(OH)2, portlandite, CH: plates) and hydrous calcium aluminium sulphate (Ca6Al2(SO4)3(OH)12·26H2O, ettringite, C3A·3C![[s with combining macron]](https://www.rsc.org/images/entities/char_0073_0304.gif) ·H32, AFt: acicular, striated prismatic). The mentioned hydration products were observed for both the non-weathered and the artificially weathered cement/concrete samples.
·H32, AFt: acicular, striated prismatic). The mentioned hydration products were observed for both the non-weathered and the artificially weathered cement/concrete samples.
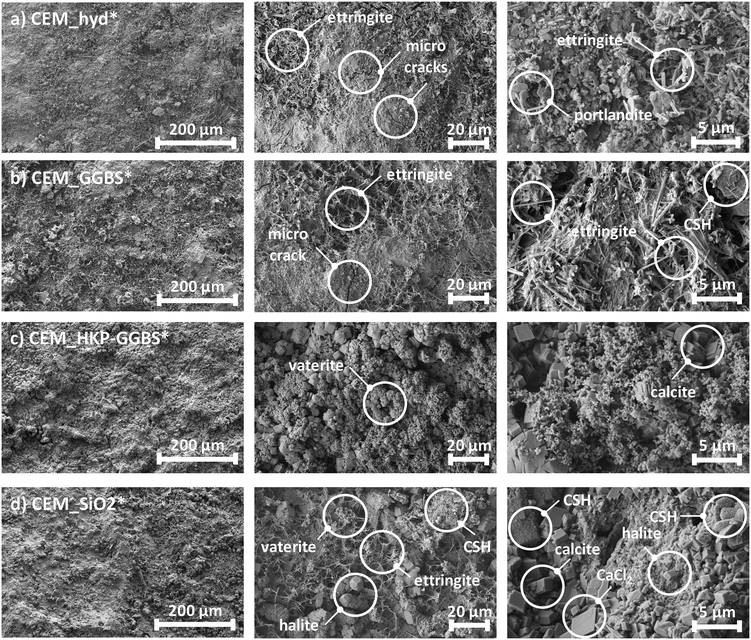
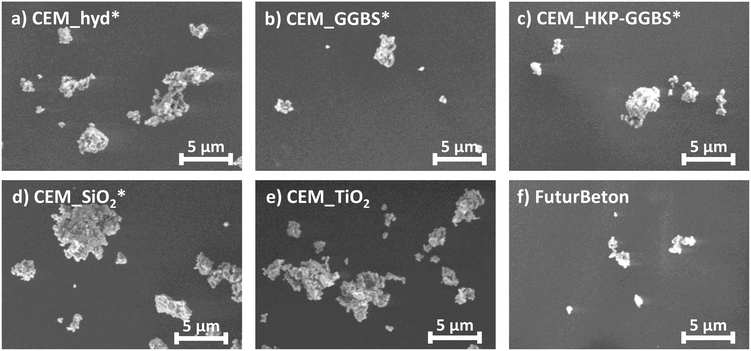
In this context, Fig. 2 shows selected SEM-images regarding surface structure and hydration products on the example of the weathered cement composites. In contrast to CEM_hyd*, SEM-images show that CEM_GGBS*, CEM_HKP-GGBS*, CEM_SiO2* and CEM_TiO2 have a denser cement stone, which is attributed to different phenomena. The activation of HKP-GGBS increases significantly its reactivity that lead to a denser matrix.48 A similar if not the same effect can be attributed to the increased pozzolanic reaction in the case of CEM_SiO2, where silica reacts with portlandite to additional CSH structures. Furthermore, slag-containing cements form denser phases at the end of strength development than Portland cements.48 Moreover, the denser cement stone is also attributed to the physical filler effect, whereof fine particles can fill the voids between coarser particles.
Furthermore, SEM-images based on artificially weathered cement composites showed also the formation of unwanted calcium carbonate structures (CaCO3, calcite as well as vaterite), which grow during the weathering procedure due to the contact of portlandite with carbon dioxide (CO2) from the environmental atmosphere. The later ones could be observed especially for CEM_HKP-GGBS* and CEM_SiO2* and are attributed to the high surface area reactivity of the processed additives. For CEM_SiO2*, this is due to the pozzolanic reaction of silica. In the case of CEM_HKP-GGBS* it is caused by mechanochemically modified phases of GGBS and the resulting changed reactivity. Since different phases are formed in CEM_GGBS* and CEM_HKP-GGBS*, the changed reactivity of HKP-GGBS by tribochemistry is obvious. Additionally, voluminous halite (NaCl) structures, whose formation is attributed to the de-icing saline solution and which could lead to a higher porosity by matrix displacement could be observed for CEM_SiO2*.
Beside hydration products, SEM-images of artificially weathered samples showed also the presence of micro-cracks, whose formation is already discussed in the previous subchapter.
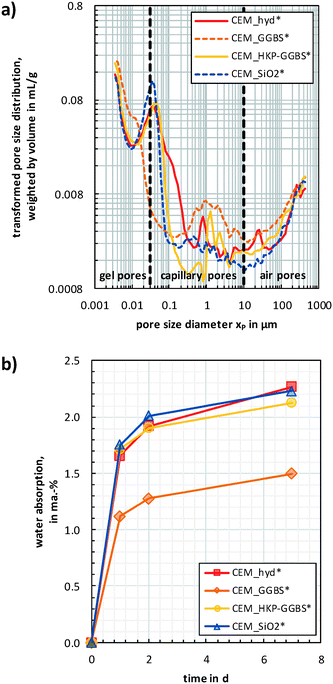 | ||
| Fig. 3 Pore size distributions (a) and water absorption behaviour (b) of the artificial freeze–thaw weathered cement composites. | ||
The lowest total pore volume was determined for CEM_hyd* (81.6 μL g−1), whereas slightly higher values result for CEM_HKP-GGBS* (82.9 μL g−1), CEM_GGBS* (83.3 μL g−1) and CEM_SiO2* (83.9 μL g−1). CEM_GGBS* showed the highest content of air pores (9.9 vol-%), followed by CEM_HKP-GGBS* (8.0 vol-%), CEM_hyd* (7.6 vol-%) and CEM_SiO2* (7.0 vol-%). The highest amount of capillary pores was determined for CEM_hyd* (34.4 vol-%), followed by CEM_HKP-GGBS* (29.1 vol-%) and CEM_SiO2* (27.7 vol-%). Despite a high content of 1.0 μm pores, CEM_GGBS* showed the lowest amount (12.3 vol-%) of capillary pores. In contrast, CEM_GGBS* showed the highest gel pore volume (77.8 vol-%), followed by CEM_SiO2* (65.3 vol-%), CEM_HKP-GGBS* (62.9 vol-%) and CEM_hyd* (58.0 vol-%).
The results of both porosity and water absorption (Fig. 3) are in line with the presumptions based on the phenomenological observations (Fig. 1) for the cement composites after artificial freeze–thaw weathering. CEM_GGBS* showed the highest deteriorations of all samples, which are attributed mainly to the volume expansion of freezing residual water and low compensation volume. This is consistent with the findings that CEM_GGBS* contains in comparison to the other samples the lowest content of capillary pores (as well as the lowest water absorption behaviour) and the highest content of gel pores. The structural different and less pronounced deteriorations identified for CEM_hyd*, CEM_SiO2* and CEM_HKP-GGBS* were attributed to be caused mainly by freezing-induced volume expansion of water absorbed by capillary suction during artificial weathering. CEM_hyd* contained the highest amount of capillary pores that explains also its more progressed deterioration in comparison to CEM_SiO2* and CEM_HKP-GGBS*. Despite a slightly lower capillary pore volume, the weathering-induced deteriorations of CEM_SiO2* were more progressed than for CEM_HKP-GGBS*. This can maybe attributed to the slightly higher content of gel pores in CEM_SiO2* that accompany with a superposition of residual water based deteriorations.
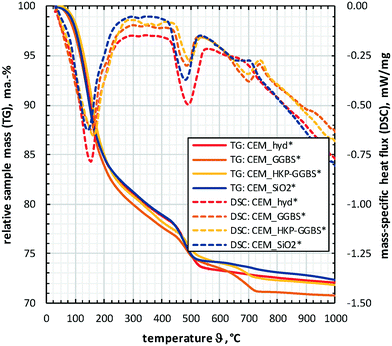
The results obtained by STA are consistent with the ones of third parties.50–52 Within the analysed temperature range (30–1000 °C), the DSC data show three characteristic peaks (100–200 °C, 450–550 °C, 650–750 °C), which correlate to significant gradations of the TG-curves. The first DSC-peak (100–200 °C) is based on the dehydration of both free water and chemically bound water from CSH. The second DSC-peak (450–550 °C) originates from the dehydroxylation of chemically bound water of portlandite (Ca(OH)2), while the third DSC-peak (650–750 °C) is based on the decarbonation of calcium carbonate (CaCO3, calcite).
The TG-curves in Fig. 4 and the values in Table S3† show that CEM_GGBS* has the highest content of both pore water and chemically bound water in CSH (mass change until 400 °C). In contrast, the lowest content was determined for CEM_SiO2* that is attributed to chemically bound water in silanol groups, which are formed due to the presence of the additive SiO2_nano during hydration. The highest content of portlandite (mass change between 400–600 °C) was determined for CEM_hyd*, followed by CEM_SiO2*. The highest carbonate content (mass change between 600–800 °C) were observed for CEM_GGBS*, followed by CEM_HKP-GGBS*.
The results of STA (Fig. 4) confirm i) the presumptions based on the phenomenological observations (Fig. 1), ii) the observed hydration products (Fig. 2) and iii) the findings concerning porosity and water absorption (Fig. 3). For example, the advanced crack formation and fragment spalling of CEM_hyd* due to freeze–thaw weathering is attributed to the increased freeze-expansion of the high content of free water caused by the high content of capillary pores.
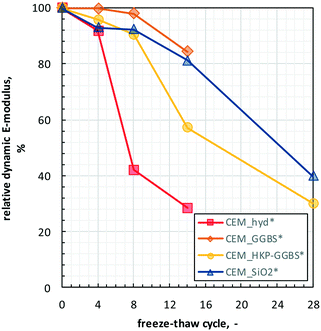 | ||
| Fig. 5 RDM-change of the cement composites over selected freeze–thaw cycles (i.e., FTC 0, 4, 8, 14, 28) of the artificial freeze–thaw weathering. | ||
Over all samples, the RDMs decrease steadily with increasing weathering cycle, but with different slope. The RDMs of CEM_SiO2* and CEM_HKP-GGBS decrease successively from 100% to 35–40% until the end of artificial freeze–thaw weathering. Due to the considerable deteriorations of CEM_GGBS* and CEM_hyd* no RDM analyses could be performed after the last cycle of artificial freeze–thaw weathering. At FTC 14, the highest RDM-changes were observed for CEM_hyd*, followed by CEM_HKP-GGBS* and CEM_SiO2*, while CEM_hyd* shows the lowest ones.
3.2 Release behaviour
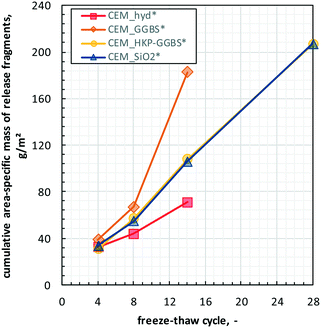 | ||
| Fig. 6 Cumulative mass of released fragments during artificially weathering of the cement composites over the freeze–thaw cycles. | ||
Similar to the RDM analyses, weathering-induced fragment release into water of CEM_GGBS* and CEM_hyd* could solely characterised until FTC 14, since the structural deteriorations of these samples did not allow the performance of further analyses.
However, the cumulative fragment release increases with increasing freeze–thaw cycle over all cements. CEM_HKP-GGBS* and CEM-SiO2* showed a very similar release behaviour to each other with quasi-uniform slope (i.e., quasi-uniform release quantity per cycle) over the whole weathering procedure. The fragment release behaviour of CEM_hyd* and CEM_GGBS* differ significantly from the ones of CEM_HKP-GGBS* and CEM_SiO2*, i.e., CEM_GGBS* shows a higher slope and CEM_hyd* a lower one. At FTC 14, CEM_GGBS* showed the highest cumulative fragment release (183 g m−2), followed by CEM_HKP-GGBS* (108 g m−2) and CEM_SiO2* (106 g m−2), while CEM_hyd showed the lowest one (71 g m−2).
Interestingly, the behaviour of weathering-induced fragment release into water correlate well with the RDM results given in Fig. 5. This circumstance becomes even more obvious by replacing the cumulative mass of fragments by the cumulative volume of fragments using the dry densities of the cement composites as provided in Table 1.
Finally yet importantly, result for fragment release based on freeze–thaw weathering show in contrast to UV/rain weathering34 an increased release. This highlights that release testing should be performed with methods that are specific to the material and its susceptibility to the stresses that match the intended use. Roughly generalised, UV irradiation is critical for polymers as well as coatings, whereas freeze–thaw weathering is decisive for cements. Such guidances are implemented in the stepwise decision tree for release testing as developed by ISO TC229, PG29.
The effect of the performed thermal sample equilibration on the relative surface humidity of the samples as well as the relative content of evaporated substances is shown in the supplement (Fig. S1†). The relative surface humidity of the non-equilibrated cement samples varied between 0.6 wt-% and 1.1 wt-% (0.95 wt-% ± 0.22 wt-%; RSD = 23.1%), whereof the values for the non-weathered cement composites varied between 0.7 wt-% and 1.1 wt-% (1.00 wt-% ± 0.19 wt-%, RSD = 19.4%). This is significantly higher than 0.6–0.8 wt-% (0.69 wt-% ± 0.10 wt-%, RSD = 15.0%) determined for the weathered samples. The relative surface humidity over all cement composites varied after thermal equilibration between 0.3 wt-% and 0.6 wt-% with a significant reduced spreading (0.53 wt-% ± 0.07 wt-%; RSD = 13.9%).
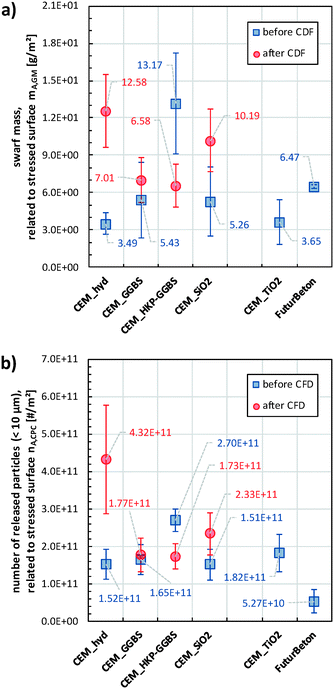
Fig. 7a) provides the sanding-induced area-specific swarf mass determined by gravimetric analyses of the whole sample specimens and comprises therefore the release of both airborne particles and coarse non-airborne fragments, while Fig. 7b) provides solely the area-specific number of released airborne particles. Considering at first the data before freeze–thaw weathering in Fig. 7a), neither the addition of SiO2_nano nor the addition of TiO2_nano showed a significant impact on the area-specific swarf mass as emanating from the comparison between CEM_hyd, CEM_TiO2 and CEM_SiO2. In contrast, the slag containing samples CEM_GGBS (resp. CEM_HKP-GGBS) show a slight (resp. considerably) higher area-specific swarf mass than CEM_hyd. Furthermore, the area-specific swarf mass of FuturBeton is similar to the ones of CEM_GGBS and CEM_SiO2. The freeze–thaw weathered samples CEM_hyd* and CEM_SiO2* showed in comparison to their non-weathered counterparts an increase in the area-specific swarf mass, whereas quasi no changes were observed for CEM_GGBS and a decrease in the case of CEM_HKP-GGBS. After freeze–thaw weathering, CEM_hyd* and CEM_SiO2* showed the highest area-specific swarf mass. The ratios between the mean area-specific swarf mass of the weathered cement composites and their non-weathered counterparts, i.e., the weathering-induced increase or decrease factor, are determined to be 0.50 for CEM_HKP-GGBS, 1.29 for CEM_GGBS, 1.94 for CEM_SiO2 and 3.61 for CEM_hyd.
Fig. 7b) provides the results of airborne particle release characterisation, i.e., the determined release quantities based on condensation nuclei counting (CNC). The area-specific number of released particles correlate in most cases well with the above-discussed results concerning the area-specific swarf mass (see Fig. S3†). The area-specific number of released particles varied before CFD weathering between 2 × 10¹⁰ #/m2–4 × 1011 #/m2 and after CFD weathering between 1 × 10¹¹ #/m2–7 × 1011 #/m2. The ratios between the mean area-specific numbers of released particles of the weathered cement composites and their non-weathered counterparts are determined to be 0.64 for CEM_HKP-GGBS, 1.07 for CEM_GGBS, 1.54 for CEM_SiO2 and 2.84 for CEM_hyd. This is exactly the same order with similar weathering-induced release ratios as determined for the area-specific swarf mass rate. In contrast to the cement/concrete swarf mass ratios (0.5–2.0), the cement/concrete particle release ratios varied from 2.9 up to 5.1, i.e., the concrete FuturBeton released significant less particles than the cement composites. All these findings are in line with the release data determined by TOF, which cover a nominal size range of 0.5–20 μm, as shown in the supplement (Fig. S2†).
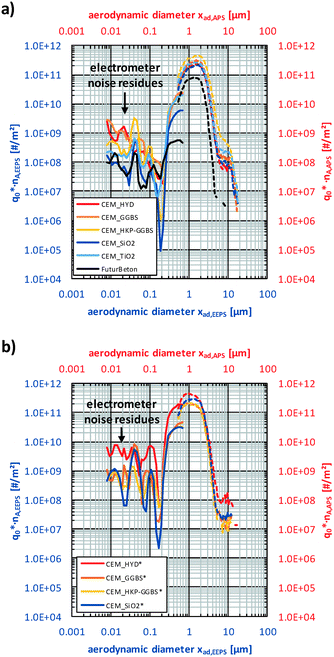
Fig. 8 shows the mean non-normalised particle size distributions (PSD) of the released airborne particles over the aerodynamic equivalent diameter based on DEMA and TOF for all analysed samples on logarithmic-graduated ordinate, while corresponding PSDs with linear-graduated ordinate are provided in the supplement (Fig. S5†). The supplement contains also additional notes on the performed correction and conversion procedures for the given PSDs.
However, Fig. 8 shows at first that the number-weighted PSDs determined by DEMA supplement well the ones of TOF, whereby the highest amounts (i.e., >50%) of released particles were detected within the measurement range of TOF (see also parity plot in Fig. S4†). Furthermore, the PSDs show nearly no release quantities below 200 nm. Excepting the PSD of FuturBeton, all PSDs contain a characteristic peak around 10 μm. The comparison of the central peak positions before and after freeze–thaw weathering of the cement composites show a slight weathering-induced shift towards finer particles. Since there are nearly no differences in the normalised PSDs between the different non-weathered cement composites (CEM_i) and between the different weathered ones (CEM_i*), Fig. 9 provides the mean number-weighted PSDs based on TOF for CEM_i, CEM_i* in comparison to FuturBeton. Here, the shift towards lower sizes of the weathered cement composites CEM_i* in comparison to their non-weathered counterparts became more visible. Additionally, Fig. 9 provides TOF-PSDs determined during workplace measurements based on real professional sanding (diamond based sanding machine DG150, Hilti) of carbon concrete composites as reported by Bienkowski et al.,31 which are very similar to the ones determined in this study. Bienkowski et al. showed furthermore that the given size distributions correlate also well with the ones determined for professional stemming, cutting and drilling (core drilling, solid drilling), which are not shown here.
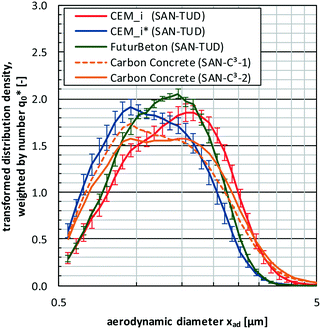 | ||
| Fig. 9 Averaged normalised size distributions with standard deviation based on TOF over all non-weathered cement composites (CEM_i; n = 8 analyses × 5 composites = 40), weathered cement composites (CEM_i*; n = 8 analyses × 4 composites = 32) and FuturBeton (n = 8 analyses) in comparison to workplace measurements data of high-strength, double-layered carbon concrete determined by Bienkowski et al.31 | ||
SEM-images of contemporaneous electrostatically precipitated airborne particles, as exemplarily shown in Fig. 10 for the different cement/concrete composites, confirm the findings from DEMA and TOF, i.e., mean geometric size of released particle between 200 nm and 5 μm. For the purpose of comparison, it should be noted here that the ratio between geometric particle diameter and aerodynamic diameter amounts to appr. 0.7.
4. Conclusion
To characterise the impact of weathering on integrity, internal structure and particle release from micro- and nanostructured cement composites (not to be confused with mortar or concrete), a comprehensive testing program was performed before, during and after standardised freeze–thaw weathering (CDF). Cement paste composite samples with different additives have been manufactured with non-compository cement paste samples as reference.Freeze–thaw cycling caused considerable deteriorations, which were significantly modulated by the different additives via changes of the cement micromorphology. The susceptibility to freeze–thaw deterioration decreased in the order: CEM_GGBS > CEM_hyd (no additive control) ≫ CEM_SiO2 > CEM_HKP-GGBS. The deteriorations are attributed to residual moisture and capillary sucked water in the pores that expands by freezing, and thus lead to crack formation and spalling. For CEM_GGBS, the action by residual water dominated, whereas for CEM_hyd the suction into capillary pores dominated. CEM_SiO2 and CEM_HKP-GGBS were more resilient due to their moderate content of either gel or capillary pores and because their residual water content, which was reduced by the characteristic hydration products formed with the SiO2 and HKP-GGBS additives. The loss of bulk mechanical integrity ranked in a different order: CEM_hyd > CEM_HKP-GGBS > CEM_GGBS > CEM_SiO2. Since the relative dynamic E-modulus describes a relative change with regard to the initial conditions of a material, it cannot predict micro- and nano-scale fragment release quantities.
Instead, the form, identity and rate of release were assessed directly. The highest fragment release into water was observed for CEM_GGBS, as expected from the macroscopic deterioration. Released fragments were sharp-edged from CEM_GGBS, but rounded-edged from the other materials. The sanding-induced airborne particle release was assessed prior and after freeze–thaw weathering, and were benchmarked against a cement containing TiO2_nano and against a high performance concrete (FuturBeton). Before freeze–thaw weathering, no modulation of airborne particle release quantities by the nanomaterial additives was observed, but the micron-scale GGBS additive induced a significant increase. In general, all the cements showed a significantly higher release than the tested concrete and then other materials such as coatings or plastics tested previously in the same setup.21 Comparing the weathered samples to their non-weathered controls, the release by sanding shifted towards finer particles, and scaled in quantity by a factor of 0.6 (decrease: CEM_HKP-GGBS); 1.1 (quasi no change: CEM_GGBS); 1.5 (increase: CEM_SiO2); 2.8 (increase: CEM_hyd).
Beyond the above structure–property–activity relationships, that are specific to cement, we contributed here a case study on degradation processes of minerals that induce the release of fragments at the micro- and nanoscale, contributing to the environmental background of geogenic, biogenic and anthropogenic fragments at the micro- and nanoscale.53 Nanomaterial additives had the potential to modulate the release rates, but the order of magnitude was primarily determined by the combination of degradation process and matrix.
Authors' contributions
All authors discussed the initial outline of the manuscript. First literature collection was based on the field of research separately for each author.BF (ZOZ) performed sample preparation, laboratory analyses, data interpretation, drafting and critical revision for important intellectual content concerning cement pastes and concretes. DG (TUD) performed airborne particle release analyses, data evaluation, data interpretation, drafting and critical revision of the manuscript. MS (TUD) performed data interpretation and critical revision for important intellectual content of the manuscript. BS (IUTA) performed data interpretation and critical revision for important intellectual content of the manuscript. BS (BASF) performed CDF testing and associated analyses. WW (BASF) conducted study design, supervision of the study, data interpretation, drafting and critical revision of the manuscript.
Endnotes
Wording and definitions of this article is based on the ISO/TS 80004 series of standards54 and the recommendation of the European Commission55 concerning the definition of nanomaterials. The graphical representation, the used symbols as well as the vocabulary to describe particle size distributions are in line with ISO 9276 series56 and ISO 26824:2013.57 In the case of transformed size distributions, the logarithm to the base of 10 was operated to calculate logarithmic class widths.Abbreviations
| APS | Aerodynamic particle sizer |
| BET | Mass-specific surface area based on Brunauer–Emmett–Teller theory |
| CEM_i | Collective designation for all non-weathered cement composites |
| CEM_i* | Collective designation for all weathered cement composites |
| CDF | Capillary suction of de-icing solution and freeze thaw |
| CNC | Condensation nuclei counting |
| CPC | Condensation particle counter |
| CSH | Calcium silicate hydrates |
| DEMA | Differential electrical mobility analysis |
| DSC | Differential scanning calorimetry |
| EEPS | Engine exhaust particle sizer |
| FTC | Freeze–thaw cycle |
| GBS | Granulated blastfurnace slag |
| GGBS | Ground granulated blastfurnace slag |
| GM | Gravimetry |
| HKP | High kinetic processing |
| MIP | Mercury intrusion porosimetry |
| PSD | Particle/pore size distribution |
| RDM | Relative dynamic E-modulus |
| RSD | Relative standard deviation |
| SEM | Scanning electron microscopy |
| STA | Simultaneous thermal analysis |
| TG | Thermogravimetry |
| TOF | Time of flight spectrometry |
| XRF | X-ray fluorescence |
Conflicts of interest
The authors declare that they have no competing interest, neither in financial nor in non-financial regard.Acknowledgements
This work was supported by the German Federal Ministry of Education and Research (BMBF) under grant 03XP0002.References
- Statista 2017. Cement production globally and in the U.S. from 2010 to 2016, https://www.statista.com/statistics/219343/cement-production-worldwide/, (accessed 2017-08-30).
- VDZ 2016. Environmental Data of the German Cement Industry 2015, Verein Deutscher Zementwerke e.V., 2016 Search PubMed.
- A. Ehrenberg, Granulated blast furnace slag - From laboratory into practice, Proceedings of the 14th International Congress on the Chemistry of Cement (ICCC), Beijing, 2015 Search PubMed.
- M. Nili, A. Ehsani and K. Shabani, Influence of Nano-SiO2 and Microsilica on Concrete Performance, 2nd International Conference on Sustainable Construction Materials and Technologies, Acona, Italy, 2010, ISBN 978-1-4507-1488-4 Search PubMed.
- D. Mitchell, I. Hinczak and R. Day, Interaction of silica fume with calcium hydroxide solutions and hydrated cement pastes, Cem. Concr. Res., 1998, 28, 1571–1584, DOI:10.1016/S0008-8846(98)00133-1.
- G. Li, Properties of high-volume fly ash concrete incorporating nano-SiO2, Cem. Concr. Res., 2004, 34, 1043–1049, DOI:10.1016/j.cemconres.2003.11.013.
- T. Ji, Preliminary study on the water permeability and microstructure of concrete incorporating nano-SiO2, Cem. Concr. Res., 2005, 35, 1943–1947, DOI:10.1016/j.cemconres.2005.07.004.
- Y. Qing, Z. Zenan, K. Deyu and C. Rongshen, Influence of nano-SiO2 addition on properties of hardened cement paste as compared with silica fume, Constr. Build. Mater., 2007, 21, 539–545, DOI:10.1016/j.conbuildmat.2005.09.001.
- H. Du, S. Du and X. Liu, Durability performances of concrete with nano-silica, Constr. Build. Mater., 2014, 73, 705–712, DOI:10.1016/j.conbuildmat.2014.10.014.
- M. Collepardi, S. Collepardi, U. Skarp and R. Troli, Optimization of Silica Fume, Fly Ash and Amorphous Nano-Silica in Superplasticized High-Performance Concretes, Proceedings of 8th CANMET/ACI International Conference on Fly Ash, Silica Fume, Slag and Natural Pozzolans in Concrete, SP-221, Las Vegas, 2004, pp. 495–506 Search PubMed.
- R. Yu, P. Spiesz and H. Brouwers, Effect of nano-silica on the hydration and microstructure development of Ultra-High Performance Concrete (UHPC) with a low binder amount, Constr. Build. Mater., 2014, 65, 140–150, DOI:10.1016/j.conbuildmat.2014.04.063.
- G. Y. Li, P. M. Wang and X. Zhao, Mechanical behavior and microstructure of cement composites incorporating surface-treated multi-walled carbon nanotubes, Carbon, 2005, 43, 1239–1245, DOI:10.1016/j.carbon.2004.12.017.
- B. Weitzel, M. R. Hansen, T. L. Kowald, T. Müller, H. W. Spiess and H. F. R. Trettin, Spectroscopic Studies of the Influence of Multi-Walled Carbon Nanotubes on the Hydration of Tricalcium Silicate and Microstructure of Calcium Silicate Hydrate Phases, Proceedings of the 10th International Congress for Applied Mineralogy (ICAM), 2012 Search PubMed.
- X. Fu and D. Chung, Submicron-diameter-carbon-filament cement-matrix composites, Carbon, 1998, 36, 459–462, DOI:10.1016/S0008-6223(98)90017-3.
- T. A. J. Kuhlbusch, C. Asbach, H. Fissan, D. Göhler and M. Stintz, Nanoparticle exposure at nanotechnology workplaces: A review, Part. Fibre Toxicol., 2011, 8, 22, DOI:10.1186/1743-8977-8-22.
- S. J. Froggett, S. F. Clancy, D. R. Boverhof and R. A. Canady, A review and perspective of existing research on the release of nanomaterials from solid nanocomposites, Part. Fibre Toxicol., 2014, 11, 17, DOI:10.1186/1743-8977-11-17.
- A. J. Koivisto, A. C. O. Jensen, K. I. Kling, A. Nørgaard, A. Brinch, F. Christensen and K. A. Jensen, Quantitative material releases from products and articles containing manufactured nanomaterials: Towards a release library, NanoImpact, 2017, 5, 119–132, DOI:10.1016/j.impact.2017.02.001.
- R. Kaegi, A. Ulrich, B. Sinnet, R. Vonbank, A. Wichser, S. Zuleeg, H. Simmler, S. Brunner, H. Vonmont, M. Burkhardt and M. Boller, Synthetic TiO2 nanoparticle emission from exterior facades into the aquatic environment, Environ. Pollut., 2008, 156(2), 233–239, DOI:10.1016/j.envpol.2008.08.004.
- W. Wohlleben, S. Brill, M. W. Meier, M. Mertler, G. Cox, S. Hirth, B. von Vacano, V. Strauss, S. Treumann, K. Wiench, L. Ma-Hock and R. Landsiedel, On the lifecycle of nanocomposites: comparing released fragments and their in-vivo hazards from three release mechanisms and four nanocomposites, Small, 2011, 7, 2384–2395, DOI:10.1002/smll.201002054.
- T. Nguyen, B. Pellegrin, C. Bernard, S. Rabb, P. Stuztman, J. Gorham, X. Gu, L. Yu and J. Chin, Characterization of Surface Accumulation and Release of Nanosilica During Irradiation of Polymer Nanocomposites by Ultraviolet Light, J. Nanosci. Nanotechnol., 2012, 12(8), 6202–6215, DOI:10.1166/jnn.2012.6442.
- D. Göhler, A. Nogowski, P. Fiala and M. Stintz, Nanoparticle release from nanocomposites due to mechanical treatment at two stages of the life-cycle, J. Phys.: Conf. Ser., 2013, 429, 012045, DOI:10.1088/1742-6596/429/1/012045.
- W. Wohlleben, M. W. Meier, S. Vogel, R. Landsiedel, G. Cox, S. Hirth and Ž. Tomovic, Elastic CNT–polyurethane nanocomposite: synthesis, performance and assessment of fragments released during use, Nanoscale, 2013, 5(1), 369–380, 10.1039/C2NR32711B.
- W. Wohlleben, G. Vilar, E. Fernández-Rosas, D. González-Gálvez, C. Gabriel, S. Hirth, T. Frechen, D. Stanley, J. Gorham, L.-P. Sung, H.-C. Hsueh, Y.-F. Chuang, T. Nguyen and S. Vazquez-Campos, A pilot interlaboratory comparison of protocols that simulate aging of nanocomposites and detect released fragments, Environ. Chem., 2014, 11(4), 402–418, DOI:10.1071/EN14072.
- S. Harper, W. Wohlleben, M. Doa, B. Nowack, S. Clancy, R. Canady and A. Maynard, Measuring Nanomaterial Release from Carbon Nanotube Composites: Review of the State of the Science, J. Phys.: Conf. Ser., 2015, 617(1), 01226, DOI:10.1088/1742-6596/617/1/012026.
- N. Shandilya, O. Le Bihan, C. Bressot and M. Morgeneyer, Emission of Titanium Dioxide Nanoparticles from Building Materials to the Environment by Wear and Weather, Environ. Sci. Technol., 2015, 49, 2163–2170, DOI:10.1021/es504710p.
- M. E. Flanagan, C. Loewenherz and G. Kuhn, Indoor Wet Concrete Cutting and Coring Exposure Evaluation, Appl. Occup. Environ. Hyg., 2001, 16, 1097–1100, DOI:10.1080/10473220127408.
- F. Akbar-Khanzadeh and R. L. Brillhart, Respirable Crystalline Silica Dust Exposure During Concrete Finishing (Grinding) Using Hand-held Grinders in the Construction Industry, Ann. Occup. Hyg., 2002, 46, 341–346, DOI:10.1093/annhyg/mef043.
- J.-C. Soo, P.-J. Tsai, C.-H. Chen, M.-R. Chen, H.-I. Hsu and T.-N. Wu, Influence of compressive strength and applied force in concrete on particles exposure concentrations during cutting processes, Sci. Total Environ., 2011, 409(17), 3124–3128, DOI:10.1016/j.scitotenv.2011.05.016.
- P. Kumar, M. Mulheron and C. Som, Release of ultrafine particles from three simulated building processes, J. Nanopart. Res., 2012, 14, 771, DOI:10.1007/s11051-012-0771-2.
- F. Azarmi, P. Kumar and M. Mulheron, The exposure to coarse, fine and ultrafine particle emissions from concrete mixing, drilling and cutting activities, J. Hazard. Mater., 2014, 279, 268–279, DOI:10.1016/j.jhazmat.2014.07.003.
- N. Bienkowski, L. Hillemann, T. Streibel, J. Kortmann, F. Kopf, R. Zimmermann and P. Jehle, Bearbeitung von Carbonbeton - eine bauverfahrenstechnische und medizinische Betrachtung, Bauingenieur, 2017, Jahresausgabe 2017/2018, pp. 110–118 Search PubMed.
- L. Hillemann, M. Stintz, T. Streibel, R. Zimmermann, S. Öder, S. Kasurinen, S. di Bucchianico, T. Kanashova, G. Dittmar, D. Konzack, S. Große, A. Rudolph, M. Berger, T. Krebs, M. Saraji-Bozorgzad and A. Walte, Charakterisierung von Partikelemissionen aus dem Trennschleifprozess von kohlefaserverstärktem Beton (Carbonbeton), Gefahrstoffe – Reinhalt. Luft, 2018, 78(6), 230–240 CAS.
- S. Hirth, L. Cena, G. Cox, Ž. Tomovic, T. Peters and W. Wohlleben, Scenarios and methods that induce protruding or released CNTs after degradation of nanocomposite materials, J. Nanopart. Res., 2013, 15, 1504, DOI:10.1007/s11051-013-1504-x.
- W. Wohlleben and N. Neubauer, Quantitative rates of release from weathered nanocomposites are determined across 5 orders of magnitude by the matrix, modulated by the embedded nanomaterial, NanoImpact, 2016, 1, 39–45, DOI:10.1016/j.impact.2016.01.001.
- N. Bossa, P. Chaurand, C. Levard, D. Borschneck, H. Miche, J. Vicente, C. Geantet, O. Aguerre-Chariol, F. M. Michel and J. Rose, Environmental exposure to TiO2 nanomaterials incorporated in building material, Environ. Pollut., 2017, 220, 1160–1170, DOI:10.1016/j.envpol.2016.11.019.
- ISO 4892-2:2006. Plastics - Methods of exposure to laboratory light sources - Part 2: Xenon-arc lamps.
- M. J. Amorim, S. Lin, K. Schlich, J. M. Navas, A. Brunelli, N. Neubauer, K. Vilsmeier, A. L. Costa, A. Gondikas, T. Xia, L. Galbis, E. Badetti, A. Marcomini, D. Hristozov, F. von der Kammer, K. Hund-Rinke, J. J. Scott-Fordsmand, A. Nel and W. Wohlleben, Environmental Impacts by Fragments Released from Nanoenabled Products: A Multiassay, Multimaterial Exploration by the SUN Approach, Environ. Sci. Technol., 2018, 52(3), 1514–1524, DOI:10.1021/acs.est.7b04122.
- CEN/TS 12390-9:2016. Testing hardened concrete - Part 9: Freeze-thaw resistance with de-icing salts – Scaling.
- B. Funk, R. Trettin and H. Zoz, From slag to high performance concrete – Manufacturing FuturBeton, Mater. Today: Proc., 2017, 4(S2), S81–S86, DOI:10.1016/j.matpr.2017.09.171.
- K. Rasmussen, A. Mech, J. Mast, P.-J. de Temmerman, N. Waegeneers, F. Van Steen, J. C. Pizzolon, L. de Temmerman, E. Van Doren, K. A. Jensen, R. Birkedal, M. Levin, S. H. Nielsen, I. K. Koponen, P. A. Clausen, Y. Kembouche, N. Thieriet, O. Spalla, C. Giuot, D. Rousset, O. Witschger, S. Bau, B. Bianchi, B. Shivachev, D. Gilliland, F. Pianella, G. Ceccone, G. Cotogno, H. Rauscher, N. Gibson and H. Stamm, Synthetic Amorphous Silicon Dioxide (NM-200, NM-201, NM-202, NM-203, NM-204): Characterisation and Physico-Chemical Properties, European Commission, JRC Science and Policy Reports, 2013, EUR 26046 EN, DOI:10.2788/57989.
- K. Rasmussen, J. Mast, P.-J. de Temmerman, E. Verleysen, N. Waegeneers, F. Van Steen, J. C. Pizzolon, L. de Temmerman, E. Van Doren, K. A. Jensen, R. Birkedal, M. Levin, S. H. Nielsen, I. K. Koponen, P. A. Clausen, V. Kofoed-Sorensen, Y. Kembouche, N. Thieriet, O. Spalla, C. Guiot, D. Rousset, O. Witschger, S. Bau, B. Bianchi, C. Motzkus, B. Shivachev, L. Dimowa, R. Nikolova, D. Nihtianova, M. Tarassov, O. Petrov, S. Bakardjieva, D. Gilliland, F. Pianella, G. Ceccone, V. Spampinato, G. Cotogno, N. Gibson, C. Gailllard and A. Mech, Titanium Dioxide, NM-100, NM-101, NM-102, NM-103, NM-104, NM-105: Characterisation and Physico-Chemical Properties, European Commission, JRC Science and Policy Reports, 2014, EUR 26637 EN, DOI:10.2788/79554.
- DIN 1045-2:2008. Concrete, reinforced and prestressed concrete structures – Part 2: Concrete – Specification, properties production and conformity – Application rules for DIN EN 206-1.
- EN 12390-2:2009. Testing hardened concrete – Part 2: Making and curing specimens for strength tests.
- DIN EN 196-1:2016. Methods of testing cements – Part 1: Determination of strength; German version EN196-1:2016.
- ISO/DIS 21683:2018(E). Pigments and extenders – Determination of experimentally simulated nano-object release from paints, varnishes and pigmented plastics.
- D. Göhler, M. Stintz, L. Hillemann and M. Vorbau, Characterization of nanoparticle release from surface coatings by the simulation of a sanding process, Ann. Occup. Hyg., 2010, 54, 615–624, DOI:10.1093/annhyg/meq053.
- J. Dixkens and H. Fissan, Development of an electrostatic precipitator for off-line particle analysis, Aerosol Sci. Technol., 1999, 30(5), 438–453, DOI:10.1080/027868299304480.
- M. Moranville-Regourd, Cements Made From Blastfurnace Slag, in Lea's Chemistry of Cement and Concrete, ed. P. C. Hewlett, Butterworth-Heinemann, Oxford, 4th edn, 1998, ch. 11, p. 1092, DOI:10.1016/B978-0-7506-6256-7.X5007-3.
- H.-G. Smolczyk and H. Romberg, Der Einfluß der Nachbehandlung und der Lagerung auf die Nacherhärtung und Porenverteilung von Beton, Tonindustriezeitung, 1976, 100(10), 349–390 CAS.
- C. Fordham and I. Smalley, A simple thermogravimetric study of hydrated cement, Cem. Concr. Res., 1985, 15(1), 141–144, DOI:10.1016/0008-8846(85)90019-5.
- S. Tsivilis, G. Kakali, E. Chaniotakis and A. Souvaridou, A Study on the Hydration of Portland Limestone Cement by Means of TG, J. Therm. Anal. Calorim., 1998, 52(3), 863–870, DOI:10.1023/A:1010139312958.
- A. E. Feuzicana de Souza Almeida and E. P. Sichieri, Thermogravimetric analyses and mineralogical study of polymer modified mortar with silica fume, Mater. Res., 2006, 9(3), 321–326, DOI:10.1590/S1516-14392006000300012.
- C. Buzea, I. I. Pacheco and K. Robbie, Nanomaterials and nanoparticles: Sources and toxicity, Biointerphases, 2007, 2(4), MR17–MR71, DOI:10.1116/1.2815690.
- ISO/TS 80004 series. Nanotechnology – Vocabulary.
- European Commission, Commission recommendation of 18 October 2011 on the definition of nanomaterial (2011/696/EU), Off. J. Eur. Union, 2011, 54(L275), 38–40 Search PubMed.
- ISO 9276 series. Representation of results of particle size analysis.
- ISO 26824:2013. Particle characterization of particulate systems – vocabulary.
Footnote |
| † Electronic supplementary information (ESI) available. See DOI: 10.1039/c8en01397g |
| This journal is © The Royal Society of Chemistry 2019 |

