 Open Access Article
Creative Commons Attribution 3.0 Unported Licence
Updated and validated solar irradiance reference spectra for estimating environmental photodegradation rates†
Jennifer N.
Apell
 and
Kristopher
McNeill
 *
*
Institute for Biogeochemistry and Pollutant Dynamics, ETH Zurich, Universitaetstrasse 16, 8092 Zurich, Switzerland. E-mail: kris.mcneill@env.ethz.ch
First published on 4th February 2019
Abstract
Irradiance reference spectra are used to calculate environmentally relevant photodegradation half-lives, but the currently used spectra were originally published in the 1980s with limited validation. The goal of this work is to provide updated irradiance reference spectra using the Simple Model of the Atmospheric Radiative Transfer of Sunshine (SMARTS). The SMARTS irradiance spectra were validated against measurements from several high-resolution spectroradiometers, and the updated irradiance reference spectra use current measurements for atmospheric species that can affect the irradiance that reaches the Earth's surface. These updated irradiance spectra are provided in 1 nm increments from 280 to 800 nm for 0° to 70° latitude at 10° increments in both the northern and southern hemisphere. Lastly, the influence of the input parameters on the modeled irradiance spectra was investigated. This work will allow users to calculate more accurate photodegradation half-lives using the updated irradiance reference spectra, and it also provides insight for users to calculate their own location- and time-specific irradiance spectra using SMARTS.
Environmental significanceSolar irradiance spectra are necessary for calculating environmentally relevant photodegradation half-lives of chemicals. This manuscript provides updated solar irradiance spectra, which were validated against high-resolution spectroradiometer measurements. These updated irradiances should be used to calculate more accurate photodegradation half-lives in the natural environment. |
1 Introduction
Pollutants can be degraded or transformed by photochemical reactions in the aquatic environment.1–5 These reactions can either proceed through direct photodegradation, where the pollutant absorbs light and undergoes reaction, or through indirect photoreaction, where other chemical species absorb light and subsequently undergo reaction with the pollutant.6–8 In both cases, the rate of pollutant degradation or transformation is dependent on the flux of photons that reach Earth's surface, which is called the solar irradiance or the photon fluence rate.In laboratory studies, the photodegradation of chemicals is usually investigated using a well-characterized light source. The irradiance of a light source can be measured using a spectroradiometer, which has been calibrated beforehand with an independent light source of known spectral irradiance. Otherwise, the relative irradiance can be measured using an uncalibrated spectroradiometer or obtained from the literature, and a chemical actinometer can be used to determine the photon flux into the test solution. In contrast to laboratory conditions, the irradiance that reaches the surface of the Earth can vary substantially based on the geographic location, altitude, time of day, time of year, and the concentration of atmospheric gases and particles.
Because of this variability in irradiance in the environment, reference solar irradiance spectra are typically used to calculate environmentally relevant photochemical half-lives for chemicals in surface waters. Both the EPA guideline (OPPTS 835.2210)9 and the OECD guideline (316)10 recommend using the day-averaged solar irradiance values for a clear sky (i.e., cloudless) day originally published in The Kinetics of Environmental Aquatic Photochemistry by Leifer (1988).11 These values, denoted as Lλ, represent the irradiance averaged over a 24 hour day and were an extension of the irradiance values previously published by Zepp and Cline (1977), which were for solar noon and denoted as either Wλ or Zλ.12
The previously reported Lλ,Wλ, and Zλ values have several shortcomings that make the calculation of new irradiance values desirable. First, the irradiances are reported in increments of 2.5–50 nm from 296.2 nm to 800 nm. These increments are often inconvenient to work with. More importantly, this discretization can lead to errors in photodegradation calculations. In the ultraviolet-B (UVB) range (280–315 nm), the irradiance substantially increases as the wavelength increases, and for many chemicals of interest the molar absorptivity also substantially decreases in this wavelength range. Therefore, their product (ελI0λ) is sensitive to averaging and truncating in this region, which can hinder the calculation of the quantum yield (e.g., clofibric acid13). Second, the documentation is not thorough enough to replicate the irradiance values or is hard to obtain. For example, the atmospheric ozone concentrations to compute values of Lλ are not given, so it is difficult to say how accurate these irradiances are in the UVB region. Additionally, ref. 11, where the Lλ values were published, is currently out of print. Lastly, Zepp and Cline (1977) originally validated the Zλ values by measuring the degradation of chemicals with relatively short photodegradation half-lives.12 This, however, only considers ranges of irradiance values as a whole instead of individual wavelengths, and a validation for the Lλ values could not be found in the literature.
The purpose of this article is to provide updated solar irradiance reference spectra at solar noon as well as day-averaged values. These irradiance values were calculated using the Simple Model of the Atmospheric Radiative Transfer of Sunshine (SMARTS)14 at 1 nm increments from 280 to 800 nm, which fully encompasses the 290 to 800 nm wavelength range suggested in the OECD guidelines.10 The modeled irradiances from SMARTS were then compared to measurements from several high resolution spectroradiometers to validate the reference spectra. Finally, a sensitivity analysis on the input parameters for SMARTS was performed to determine (a) which parameters had the largest influence and (b) the variability of solar irradiance values that could be expected in the environment depending on local atmospheric conditions.
1.1 Theory and history
The general form of the equation typically used to describe the pseudo first order photoreaction, using a monochromatic light source of a given wavelength (λ), is:11 | (1) |
![[small script l]](https://www.rsc.org/images/entities/char_e146.gif) is the pathlength of the light in the water [cm], and Δλ is the wavelength interval of the light [nm]. These units are consistent because of conversions from mmol to mol and cm3 to L that cancel. The first term of the equation, Φ, is the fraction of molecules that undergo reaction of those that absorb a photon. The second term, which is the irradiance divided by the pathlength, gives the incident light intensity per unit volume. The third term describes the fraction of photons at a given wavelength that is absorbed by the system over the pathlength
is the pathlength of the light in the water [cm], and Δλ is the wavelength interval of the light [nm]. These units are consistent because of conversions from mmol to mol and cm3 to L that cancel. The first term of the equation, Φ, is the fraction of molecules that undergo reaction of those that absorb a photon. The second term, which is the irradiance divided by the pathlength, gives the incident light intensity per unit volume. The third term describes the fraction of photons at a given wavelength that is absorbed by the system over the pathlength ![[small script l]](https://www.rsc.org/images/entities/char_e146.gif) , which is from the Beer–Lambert Law. Finally, the last term is the fraction of photons absorbed by the solution that were absorbed by the chemical of interest.
, which is from the Beer–Lambert Law. Finally, the last term is the fraction of photons absorbed by the solution that were absorbed by the chemical of interest.
There are already several assumptions present in eqn (1) that should be acknowledged. First, the Φ is typically assumed to be independent of wavelength. Second, the concentration of chemical species and the light intensity are assumed to be homogenous over the pathlength ![[small script l]](https://www.rsc.org/images/entities/char_e146.gif) .15 In addition, in order to use the published Lλ values, the absorbance over the pathlength needs to be <0.02 (i.e., (αλ + ελC)
.15 In addition, in order to use the published Lλ values, the absorbance over the pathlength needs to be <0.02 (i.e., (αλ + ελC)![[small script l]](https://www.rsc.org/images/entities/char_e146.gif) < 0.02) according to OECD guidelines or <0.05 according to EPA guidelines. When this is true, the values (1–10−(αλ+ελC)
< 0.02) according to OECD guidelines or <0.05 according to EPA guidelines. When this is true, the values (1–10−(αλ+ελC)![[small script l]](https://www.rsc.org/images/entities/char_e146.gif) ) ≈ 2.303(αλ + ελC)
) ≈ 2.303(αλ + ελC)![[small script l]](https://www.rsc.org/images/entities/char_e146.gif) . When (αλ + ελC)
. When (αλ + ελC)![[small script l]](https://www.rsc.org/images/entities/char_e146.gif) = 0.02, this simplification overestimates the photons absorbed by the system by 2%, and when (αλ + ελC)
= 0.02, this simplification overestimates the photons absorbed by the system by 2%, and when (αλ + ελC)![[small script l]](https://www.rsc.org/images/entities/char_e146.gif) = 0.05, the overestimation is 6%. Yet, this simplification allows us to rewrite eqn (1) into a form that can be easily integrated (eqn (2)). Finally, if a polychromatic light source is used, the rate at each wavelength (kλ) must be summed to obtain the observed overall rate constant (k) (eqn (3)).
= 0.05, the overestimation is 6%. Yet, this simplification allows us to rewrite eqn (1) into a form that can be easily integrated (eqn (2)). Finally, if a polychromatic light source is used, the rate at each wavelength (kλ) must be summed to obtain the observed overall rate constant (k) (eqn (3)).
 | (2) |
 | (3) |
In the above equations, ![[small script l]](https://www.rsc.org/images/entities/char_e146.gif) /z is the ratio of the pathlength of a photon (
/z is the ratio of the pathlength of a photon (![[small script l]](https://www.rsc.org/images/entities/char_e146.gif) ) and the vertical depth of the water (z). In a laboratory experimental setup,
) and the vertical depth of the water (z). In a laboratory experimental setup, ![[small script l]](https://www.rsc.org/images/entities/char_e146.gif) and z are assumed to be equal. In the environment,
and z are assumed to be equal. In the environment, ![[small script l]](https://www.rsc.org/images/entities/char_e146.gif) can be longer than z because (a) the incident light usually does not enter the water surface at a perpendicular angle (i.e., zenith angle of 0), and therefore photons do not travel vertically in the water column, and (b) the presence of particles can scatter photons making their pathlengths longer. In non-turbid water, which is assumed in the derivation of eqn (2),
can be longer than z because (a) the incident light usually does not enter the water surface at a perpendicular angle (i.e., zenith angle of 0), and therefore photons do not travel vertically in the water column, and (b) the presence of particles can scatter photons making their pathlengths longer. In non-turbid water, which is assumed in the derivation of eqn (2), ![[small script l]](https://www.rsc.org/images/entities/char_e146.gif) /z is typically between 1.05 and 1.3.16
/z is typically between 1.05 and 1.3.16
In eqn (2), the solar irradiance, denoted as I0λ, is the global horizontal irradiance. The global horizontal irradiance is the sum of direct beam and diffuse (also known as sky) irradiance that intercept a plane that is horizontal to the Earth's surface. However, both Zepp and Cline (1977) and Leifer (1988) adjusted the global horizontal irradiance for reflectance off the water surface and the increased pathlength within the water column (Fig. 1). This was done by correcting the direct beam and diffuse sunlight separately.
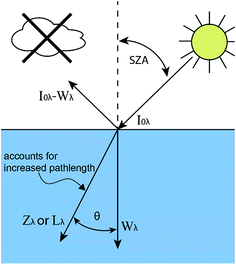 | ||
| Fig. 1 Diagram showing the relationship between I0λ, Wλ, Zλ, and Lλ where SZA is the solar zenith angle (for direct beam sunlight) and θ is the angle of refraction of light within the water column. | ||
The reflected fraction for both was calculated using the Fresnel equations and assuming a refractivity index of water of 1.34. For diffuse sunlight, the reflected fraction was calculated by Zepp and Cline to be 7% on average assuming a uniformly bright sky (i.e., isotropic light scattering without circumsolar or horizon brightening scattered components).12 For direct beam sunlight, the reflected fraction is <5% up to a solar zenith angle (SZA) of 57° but increases quickly at larger values of SZA. For example, 10% of sunlight is reflected at SZA = 67°, 20% is reflected at SZA = 74°, 40% is reflected at SZA = 81°, and 60% is reflected at SZA = 85°. Zepp and Cline (1977) subtracted the reflected fraction of light to get the solar irradiance values they denote as Wλ.12
The increased pathlength in the water column was calculated using Snell's law to determine the angle of refraction. Again assuming a refractive index of 1.34 for water, Zepp and Cline calculated that the pathlength for diffuse sunlight would be 1.2 times longer on average at mid-latitudes.12 For direct sunlight, the increased pathlength is calculated using z![[thin space (1/6-em)]](https://www.rsc.org/images/entities/char_2009.gif) sec(θ) where θ is the angle of refraction. The pathlength will be longer for higher values of the SZA. For a SZA = 85°, θ = 48° and the pathlength increases by 50%.
sec(θ) where θ is the angle of refraction. The pathlength will be longer for higher values of the SZA. For a SZA = 85°, θ = 48° and the pathlength increases by 50%.
When including the adjustments for the reflected fraction and the increased pathlength, the calculated solar irradiance is now denoted as Zλ for solar noon values, which is the time of day when the SZA is at its minimum (eqn (4)).12 Since the increased pathlength is incorporated into the solar irradiance values, then ![[small script l]](https://www.rsc.org/images/entities/char_e146.gif) /z should be set to one in eqn (3). For 40°N latitude during midseason summer and at solar noon, the SZA = 20°. Therefore, ≈2.1% of the direct beam sunlight is reflected and the pathlength is increased by ≈3.4%. On a clear sky day, approximately 90% of the global horizontal irradiance is direct beam sunlight at solar noon (40°N); therefore, there should be only a minor adjustment between I0λ and Zλ values (≈2% increase) and between Wλ and Zλ values (≈5% increase).
/z should be set to one in eqn (3). For 40°N latitude during midseason summer and at solar noon, the SZA = 20°. Therefore, ≈2.1% of the direct beam sunlight is reflected and the pathlength is increased by ≈3.4%. On a clear sky day, approximately 90% of the global horizontal irradiance is direct beam sunlight at solar noon (40°N); therefore, there should be only a minor adjustment between I0λ and Zλ values (≈2% increase) and between Wλ and Zλ values (≈5% increase).
Zλ = I0,direct(1 − fraction reflected)sec![[thin space (1/6-em)]](https://www.rsc.org/images/entities/char_2009.gif) θ + 1.2I0,diffuse(1 − 0.07) θ + 1.2I0,diffuse(1 − 0.07) | (4) |
Lastly, there are two important differences between the Zλ reported by Zepp and Cline and the Lλ reported by Leifer that are used to calculate environmental photochemical half-lives. The first is that Zλ values are for solar noon while Lλ values are day-averaged; therefore, the Lλ values are more appropriate to use when half-lives are >1 day. The second important difference is that Lλ values have the factor of 2.303 incorporated into the reported solar irradiance (eqn (5a)–(5c)). The actual calculated solar irradiance values are a factor of 2.303 lower, so Lλ values must be used carefully.
 | (5a) |
 | (5b) |
 | (5c) |
2 Methods
2.1 Data sources
2.2 Simple model of the atmospheric radiative transfer of sunshine (SMARTS) and tropospheric ultraviolet and visible (TUV) radiation model
SMARTS was developed by Dr Christian Gueymard at NREL for use in the U.S. Department of Energy's Solar Energy Technologies Program.14 This radiative transfer model can calculate clear sky spectral irradiances in the ultraviolet and visible range with a resolution of 0.5–1 nm. This work used version 2.9.5 installed on a PC with Windows 10 operating system. SMARTS is available for download free of charge from the NREL website and has an Excel-based user interface.Calculated irradiances depend on ten parameters that are specified in the SMARTS program, and the values used for data comparison are in Table 1. Specific values for each spectroradiometer site are in Tables S1–S3.† Water vapor, specified as precipitable water, was available in the AERONET data alongside the aerosol optical depth (at 500 nm), and daily total column ozone data were available from remote sensing data; therefore, site and day-specific data were used for each of these parameters in the SMARTS model. A CO2 concentration of 407 ppm was chosen based on recent measurements by NOAA at the Mauna Loa station.24 For the gaseous absorption and aerosol model, the ‘light pollution’ and the ‘Shettle & Fenn rural’ options were chosen based on the example configurations provided with SMARTS and previous literature of model and data comparisons.25 The average total solar irradiance was set to 1361 W m−2, and the most recent extraterrestrial spectrum (Gueymard 2004) was chosen.26–28 The albedo can be specified in SMARTS, but it was set to zero (no albedo) for the data comparison and reference spectra.
| Parameter | Value |
|---|---|
| Site pressure | Calculated based on latitude and altitude |
| Atmosphere | Appropriate selection of reference atmosphere based on site latitude and season |
| Water vapor | Variable (in cm, from AERONET data) or calculated from reference atmosphere |
| Ozone | Variable (from AERONET data) or 0.1 |
| Gaseous absorption | Light pollution |
| Carbon dioxide | 407 ppm |
| Extraterrestrial spectrum | 1361 W m−2 Gueymard 2004 |
| Aerosol model | Shettle & Fenn rural model30 |
| Turbidity | Variable (from AERONET data) or 0.1 |
| Albedo | None |
The TUV model is available through the National Center for Atmospheric Research (NCAR) website.29 The web interface allows for the calculation of spectral irradiance based on the location and date or the solar zenith angle. The altitude, ozone concentration, and aerosol properties can also be specified. In addition, a single cloud layer can be accounted for in the web interface. For the comparison to the SMARTS model, the noontime spectral irradiances were compared for the two NSF sites and for the NREL and NOAA data from March, June, September, and December.
2.3 Reference spectral irradiance
Updated reference spectra were also calculated using the values in Table 1. For aerosol optical depth and ozone, average values were used, which were 0.1 for aerosol optical depth31 and latitude-specific averages for ozone (Table S4 and Fig. S1–S8†). Water vapor pressures were calculated from the chosen reference atmosphere.Global horizontal spectral irradiance was calculated for each solar hour during daylight. The irradiances were summed and divided by 24 to obtain a daily average solar irradiance. Daily average and solar noon values were calculated at 0°, 10°, 20°, 30°, 40°, 50°, 60°, and 70° latitude in both the northern and southern hemisphere.
2.4 SMARTS sensitivity analysis
Although reference spectra are sufficient for many applications, it may be desirable to calculate spectral irradiance values specific to location and time as well as to understand the error that can be introduced by using a reference spectrum. To ascertain which input parameters were the most influential on the spectral irradiance output, a sensitivity analysis was performed.Water vapor was adjusted from 0.5 to 4 cm based on the range observed in the AERONET dataset. Total column ozone varies substantially depending on location and time of year with values typically in the range of 250–450 Dobson units (DU, equivalent to 0.01 mm pathlength in ozone).32 From the AERONET data, the aerosol optical depth varied from approximately 0.005 to 0.5 (measured at 500 nm). Carbon dioxide absorbs infrared radiation, but does not absorb radiation below 2700 nm, so it has no effect on these spectra. Other gaseous species that absorb ultraviolet and visible light can be designated in the gaseous absorption menu. The impact of four trace gases (SO2, NO2, O3, H2O) on the spectral output was determined by changing the air pollution input between pristine, light, moderate, or severe.
3 Results and discussion
3.1 Comparison of current reference spectra (Lλ) to SMARTS outputs
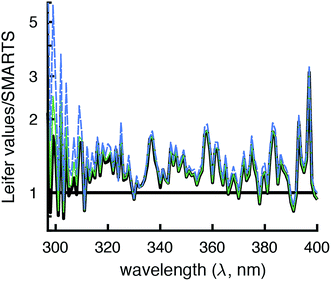
The modeled SMARTS output values were first compared to the reported Lλ values at 0°N, 40°N, and 70°N.11 These latitudes were chosen because ozone concentrations were given in Zepp and Cline (Fig. 8 caption in ref. 12), presumably for summer conditions, and were assumed to also be used to calculate Lλ values. To put the Lλ values on the same basis for comparison as the SMARTS output values, the wavelength range of each value was set to 1 nm using interpolation and the factor of 2.303 was removed by dividing by this value. The corrected Lλ values were generally higher than the I0λ values calculated by SMARTS (Fig. 2 and 3).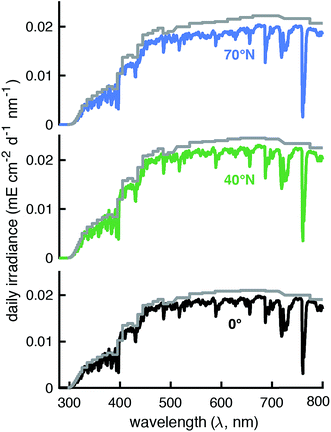 | ||
| Fig. 2 Comparison of day-averaged solar irradiance published in Leifer (Lλ, 1988)11 divided by 2.303 and the wavelength range (grey lines) and modeled by SMARTS for day-averaged midseason summer (July 24th, solar angle of declination = 20°) at 0° (black line), 40°N (green line), and 70°N (blue line). | ||
To compare the total irradiance in the UVB (280–315 nm), UVA (315–400 nm), and photosynthetically active region (PAR, 400–700 nm), irradiances were converted to units of W m−2 and summed across the designated wavelengths. The total irradiance values derived from Lλ values were 17–23% higher in the UVB region, 22–29% higher in the UVA region, and 7–12% higher in the PAR region compared to the SMARTS irradiance values. Some of this difference may be due to accounting for the increased pathlength in water that is done with Lλ values, but this should be at least partially offset by accounting for the fraction of light that is reflected off the water surface. Another potential reason for these differences is that SMARTS also accounts for more gaseous species that can absorb light before it reaches the Earth's surface (e.g., SO2 and NO2).
3.2 Validation of SMARTS solar irradiance spectra
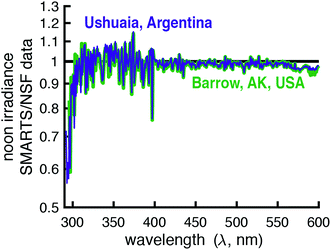
To assess the accuracy of SMARTS, the modeled irradiances were compared to data from four spectroradiometers maintained by three U.S. government agencies (Table 2). These spectroradiometers measured global horizontal irradiances over differing wavelength ranges and resolutions and were located at four separate monitoring facilities. It was hoped that by comparing measured and modeled irradiances across all of these instruments and measurement sites, we could assess the accuracy of the calculated day-averaged and solar noon irradiances.| Site location | Latitude | Longitude | Elevation (m) |
|---|---|---|---|
| Golden, CO, USA (NREL) | 39.742 N | 105.18 W | 1829 |
| Boulder, CO, USA (NOAA) | 39.99 N | 105.26 W | 1628 |
| Barrow, AK, USA (NSF) | 71.3167 N | 156.6833 W | 8 |
| Ushuaia, Argentina (NSF) | 54.8167 S | 68.3167 W | 18 |
It should also be noted that the resolution of the SMARTS model and the spectroradiometers differ. The SMARTS program has an option to smooth the irradiance signal, which is typically done when comparing measurements to the model, but this was not used in the comparisons presented.25 Therefore, the ratio of modeled and measured irradiances was expected to vary around the value of one, even in the case of perfect agreement.
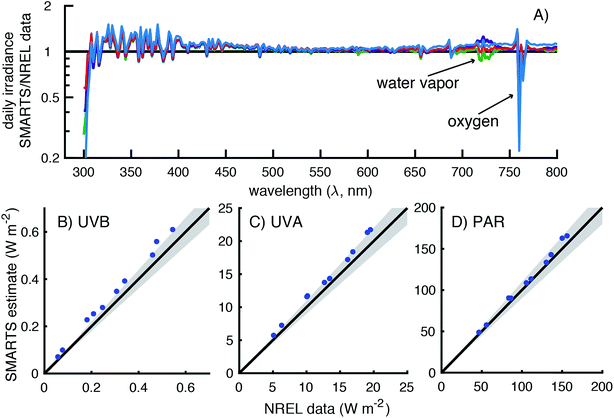
There is a sharp decrease and recovery of the modeled-to-measured ratio at 760 nm due to light absorption by oxygen.33 This is because (1) SMARTS restricts the light absorption of oxygen to 10 nm band, but the spectroradiometer measurements are over affected over ≈16 nm and (2) the decrease in irradiance due to O2 is higher in SMARTS than in the measurements (90% vs. 40% decrease, respectively). Between 715 and 735 nm (and 685–705 nm to a lesser extent), inaccurate characterization of water vapor leads to the deviations observed. Lastly, at the lower end of the spectrum (300–306 nm), the measured irradiances exceeded the SMARTS modeled irradiances. However, this is likely due to the lower resolution of this spectroradiometer (6 nm bandwidth) and the sharp decline in irradiance in this range, so even a small percentage of longer wavelength photons (>306 nm) being attributed to shorter wavelengths (<306 nm) can have a significant effect.
Broadband measurements (i.e., UVB, UVA, and PAR) were also compared for 10 days during 2014 (Fig. 4B–D). SMARTS modeled irradiances over-predicted the measured irradiances by 9–29% in the UVB region (300–315 nm), 7–15% in the UVA region (315–400 nm), and 2–9% in the PAR region (400–700 nm). UVB and UVA modeled irradiances showed the greatest deviations from October to February, but there was no apparent pattern with season for the PAR irradiance.
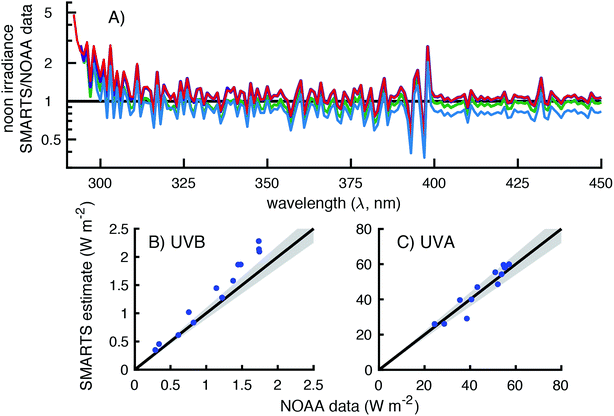
Because of this bias at wavelengths <310 nm, the comparison of UVB broadband irradiances were worse for the NOAA data than the NREL data with modeled irradiances being 0–35% higher than the measurements (Fig. 5B). This deviation may be smaller than expected based on Fig. 5B, but that is because there are 300 times fewer photons at 295 nm than at 310 nm, so the largest deviations have a relatively small contribution to the broadband UVB measurement. In contrast, the comparison of measured and modeled UVA irradiance values were scattered around the 1![[thin space (1/6-em)]](https://www.rsc.org/images/entities/char_2009.gif) :
:![[thin space (1/6-em)]](https://www.rsc.org/images/entities/char_2009.gif) 1 line with modeled irradiances being 75–112% of the measurements (Fig. 5C). Additionally, the largest deviation, which was from November 18, 2016, appears to be a measurement error. The irradiance measured on this day (38 W m−2) was higher than any other clear sky day in November or October (Fig. S9†). On another clear sky day (November 12th), the UVA irradiance was measured to be 28 W m−2, which is in better agreement to the SMARTS modeled value of 29 W m−2.
1 line with modeled irradiances being 75–112% of the measurements (Fig. 5C). Additionally, the largest deviation, which was from November 18, 2016, appears to be a measurement error. The irradiance measured on this day (38 W m−2) was higher than any other clear sky day in November or October (Fig. S9†). On another clear sky day (November 12th), the UVA irradiance was measured to be 28 W m−2, which is in better agreement to the SMARTS modeled value of 29 W m−2.
3.3 Comparison of SMARTS and the TUV calculator
The spectral irradiances modeled by SMARTS were compared to those using the TUV calculator, which is typically used in the atmospheric research community. Overall, there was very good agreement between the two models with <6.1% difference in the UVB, UVA, and PAR regions (Fig. S11†). TUV modeled irradiances were mostly higher than SMARTS for two apparent reasons (Table S5†). In SMARTS, the selection of “light pollution” adds 23 ppbv ground-level O3, which lowers the irradiance in the UVB region slightly. It also appears that the TUV calculator does not account for light absorption by water vapor in the same manner as SMARTS, which resulted in higher PAR irradiances when using the TUV calculator. The use of either model should give similar photodegradation half-lives; however, since SMARTS already tends to overestimate the irradiances measured by spectroradiometers and it provides the flexibility to specifying trace gas concentrations, the SMARTS irradiances are expected to be more accurate than the TUV irradiances.3.4 Updated reference spectra
Reference irradiance spectra are provided as ESI† for solar noon and as day-averaged (24 h) values for 0° to 70° in 10° increments in both the northern and southern hemisphere and at four times of year when the equinoxes (solar declination = 0°, approximately June 21st and December 22nd) and solstices (solar declination = ±23.4°, approximately March 20th and September 22nd) occur. The irradiance values for the northern and southern hemisphere are not equal or mirrored because (a) the Earth's distance to the sun varies throughout the year with the sun being ≈5 million km closer in early January compared to early July and (b) ozone concentrations differ in the northern and southern hemisphere (Table S2†).Reference spectra were calculated using the SMARTS inputs outlined in Table 1. For the aerosol optical depth, a typical value of 0.1 (measured at 500 nm) was used.31 Water vapor pressures (in cm of water) were calculated from the reference atmosphere chosen. Since the irradiances in the UVB region were sensitive to the ozone concentration chosen, data from the OMI satellite, averaged across all longitudes, were retrieved for the last eight years from the Giovanni website (giovanni.gsfc.nasa.gov) and median concentrations were used for calculation of the reference spectra (Table S4 and Fig. S1–S8†).
These reference spectra are useful for calculating typical photodegradation half-lives (e.g., for pesticide registration applications) and for reporting environmentally relevant half-lives in the literature. It should be emphasized that these irradiance values are representative of the sunlight that reaches the surface of the Earth at sea level. They have not been adjusted for reflection off the water's surface or increased pathlength within the water column like Zλ and Lλ values. The decision to not adjust the irradiance values was made because these adjustments tend to increase the magnitude of the irradiance, and several other assumptions made (e.g., no competing absorbance from organic matter, no decrease in irradiance through the water depth, no clouds, and no shading) already make the unadjusted irradiance values a “best-case scenario” when determining the rate of photodegradation. SMARTS, however, does provide the flexibility to output direct and diffuse horizontal irradiances separately that can then be adjusted as previously described.12
3.5 Influence of input parameters on the solar irradiance
While the reference spectra are useful in many cases, it may be desirable to determine spatially and temporally specific irradiances when conducting field studies in which case SMARTS can be used to calculate new irradiance spectra. In addition to location and time, SMARTS also allows users to input values for several other parameters (see Table 1). Therefore, the influence of the input parameters was investigated to determine which parameters have the largest effect and in which region(s) of the irradiance spectrum. With this information, users can decide which input parameters should be prioritized for obtaining site-specific information as well as what magnitude of variability should be expected when choosing a generic value.Aerosol properties had relatively minor effect on irradiance in most conditions investigated. The Shettle and Fenn rural aerosol model at an AOD of 0.1 was used to calculate the reference spectrum. If one of the urban aerosol models was selected instead, then the irradiance would decrease by 1–9% depending on the wavelength, and if the maritime aerosol model was selected the irradiance would increase by up to 2% (Fig. S12†). Changing the AOD also affects the irradiance at all wavelengths. With the baseline Shettle and Fenn rural aerosol model, going from an AOD of 0.005 to 1.0 decreases irradiance by 50% at 300 nm but only 20–30% in the visible light range (Fig. S12†).30 However, an AOD of 1.0 represents a high aerosol load (i.e., a severe pollution event or dust storm). At a more common AOD of 0.5 the irradiance would decrease <20%, and at typical value of 0.1 irradiance decreases by <10% compared to an AOD of 0.005.
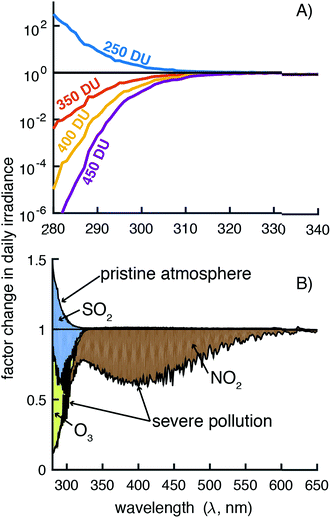
Ozone has a strong absorption band in the UVB region and a minor absorption band in the 500–700 nm range, and satellite-based ozone measurements are available (giovanni.gsfc.nasa.gov). The global average for ozone concentration is 300 DU, but it can vary by as much as 200 DU depending on the location and time of year.32,36 These ozone concentration variations can lead to order of magnitude differences in irradiance depending on the wavelength (Fig. 7A and S13†). For the total UVB irradiance (280–315 nm), a decrease of 50 DU increases the irradiance by 16% and an increase in 100 DU decreases the irradiance by 24%; however, the larger changes at the lower wavelengths can have a significant effect on the photodegradation of organic pollutants that absorb light only in this range (<300 nm). For the minor absorption band, irradiance changes <5% going from 300 to 450 DU.
In the gaseous absorption menu, 4 pre-loaded pollution scenarios are available. Light pollution was chosen for the reference spectra, but the selection of a pristine or severe pollution atmosphere can have a large influence on irradiance (Fig. 7B and S13†). This selection actually changes the concentrations of 10 atmospheric gases, but only three were found to be responsible for the changes in irradiance (Fig. 7B and S13†). As seen previously, ozone concentrations had a large influence in the UVB region but so did sulfur dioxide (SO2) concentrations (Fig. S12†). Nitrogen dioxide (NO2) also had a large influence in the UVB, UVA, and visible regions (Fig. 7B and S12†). Concentrations of ozone, SO2, and NO2 concentrations can all be obtained from satellite-based measurements (giovanni.gsfc.nasa.gov).23
Water vapor can be calculated from the chosen reference atmosphere or a measurement can be inputted by the user. There are several absorption bands for water vapor starting at 500 nm, but the largest bands are 690–750 nm. Changing the precipitable water from 0.5 cm to 4 cm (tropical climate) can decrease irradiance by up to 50% depending on the wavelength (Fig. S14†). However, since all of water vapor's absorption bands are in the visible region, it is not expected that changing water vapor values will have a significant impact on the photodegradation of chemicals in aquatic systems, which typically absorb light in the ultraviolet region.
SMARTS has many choices for albedo, which is the proportion of photons that are reflected off a surface. However, since SMARTS was originally designed for use in the solar power industry, adding an albedo selection only increases the calculated irradiance. The albedo was set to zero for the calculation of the reference spectra. The selection of an albedo, however, will only have a minor effect in most cases. For example, the calm ocean, coastal ocean, or grazing field selection will increase the irradiance by <3% at any given wavelength. In contrast, the selection of a snow covering does have a significant effect, especially in the ultraviolet region, with increases up to 70% for wavelengths around 320 nm (Fig. S14†). Therefore, on clear sky days in waterbodies located next to snow cover, photodegradation rates will be faster than those predicted by using the reference irradiance values.
4 Conclusions
In this work, the solar irradiance spectra currently used for calculating photodegradation half-lives, as specified in the EPA and OECD guidelines (originally from Leifer 1988), were compared to the irradiance calculated by the SMARTS and TUV models. The currently used irradiances were consistently higher than SMARTS and TUV values; therefore, irradiances from all three models were compared to measurements from high-resolution spectroradiometers. The best agreement with measured data was observed for SMARTS irradiances. Yet, SMARTS-modeled irradiances still tended to be biased high, particularly in the UVB region where O3 and SO2 absorb, showing the importance of using accurate concentrations of light-absorbing species. Updated solar irradiance reference spectra were calculated using current values of light-absorbing gaseous species and aerosols for both the northern and southern hemispheres. It is recommended that these updated and validated reference spectra should be used in the calculation of photodegradation half-lives. This will result in longer calculated half-lives, but the relative increase in the calculated half-life will depend on the absorption spectra of the chemical of interest.Conflicts of interest
There are no conflicts to declare.Acknowledgements
Horizontal global irradiance data were provided by the NREL's Solar Radiation Research Laboratory Baseline Measurement System, by Patrick Disterhoft at NOAA's Earth System Research Laboratory, and by Dr Germar Bernhard from Biospherical Instruments, which maintained NSF's Polar Program UV Monitoring Network. The authors would like to acknowledge Nicholas Pflug (ETH Zurich) for his comments on the manuscript. We would also like to acknowledge all of the people who developed, deployed, maintained the instruments whose data were used in this study (OMI instrument and AERONET) as well as NASA for making the data publicly available.References
- D. E. Latch, J. L. Packer, W. A. Arnold and K. McNeill, J. Photochem. Photobiol., A, 2003, 158, 63–66 CrossRef CAS.
- K. M. Parker and W. A. Mitch, Proc. Natl. Acad. Sci. U. S. A., 2016, 113, 5868–5873 CrossRef CAS PubMed.
- K. P. Mangalgiri and L. Blaney, Environ. Sci. Technol., 2017, 51, 12310–12320 CrossRef CAS PubMed.
- N. C. Pflug, M. K. Hankard, S. M. Berg, M. O'Connor, J. B. Gloer, E. P. Kolodziej, D. M. Cwiertny and K. H. Wammer, Environ. Sci.: Processes Impacts, 2017, 19, 1414–1426 RSC.
- J. K. Challis, M. L. Hanson, K. J. Friesen and C. S. Wong, Environ. Sci.: Processes Impacts, 2014, 16, 672–696 RSC.
- K. McNeill and S. Canonica, Environ. Sci.: Processes Impacts, 2016, 18, 1381–1399 RSC.
- C. K. Remucal, Environ. Sci.: Processes Impacts, 2014, 16, 628–653 RSC.
- C. M. Glover, S. P. Mezyk, K. G. Linden and F. L. Rosario-Ortiz, Chemosphere, 2014, 111, 596–602 CrossRef CAS PubMed.
- U.S. EPA, Fate Transport, and Transformation Test Guidelines: 835.2210 Direct Photolysis Rate in Water by Sunlight, Report EPA 712-C-98-060, 1998 Search PubMed.
- OECD, Test No. 316, Phototransformation of Chemicals in Water – Direct Photolysis, 2008 Search PubMed.
- A. Leifer, The kinetics of environmental aquatic photochemistry: theory and practice, American Chemical Society, 1988 Search PubMed.
- R. G. Zepp and D. M. Cline, Environ. Sci. Technol., 1977, 11, 359–366 CrossRef CAS.
- J. L. Packer, J. J. Werner, D. E. Latch, K. McNeill and W. A. Arnold, Aquat. Sci., 2003, 65, 342–351 CrossRef CAS.
- NREL, SMARTS: Simple Model of the Atmospheric Radiative Transfer of Sunshine, https://www.nrel.gov/grid/solar-resource/smarts.html, accessed November 29, 2018.
- J. M. Parnis and K. B. Oldham, J. Photochem. Photobiol., A, 2013, 267, 6–10 CrossRef CAS.
- R. G. Zepp, in Dynamics, exposure and hazard assessment of toxic chemicals, ed. R. Haque, Ann Arbor Science, Ann Arbor, 1980, ch. 9, pp. 69–110 Search PubMed.
- A. Andreas and T. Stoffel, NREL Solar Radiation Research Laboratory (SRRL): Baseline Measurement System (BMS); Golden, Colorado (Data), Report DA-5500-56488, National Renewable Energy Lab.(NREL), Golden, CO (United States), 1981 Search PubMed.
- NREL, Solar Radiation Research Laboratory Baseline Measurement System, http://midcdmz.nrel.gov/srrl_bms/, accessed November 29, 2018, DOI:10.5439/1052221.
- A. Habte, A. Andreas, L. Ottoson, C. Gueymard, G. Fedor, S. Fowler, J. Peterson, E. Naranen, T. Kobashi, A. Akiyama and S. Takagi, Indoor and Outdoor Spectroradiometer Intercomparison for Spectral Irradiance Measurement, Report NREL/TP-5D00-61476, 2014 Search PubMed.
- NOAA Earth System Reasearch Laboratory Global Monitoring Division, ESRL/GMD FTP Data Finder, https://www.esrl.noaa.gov/gmd/dv/data/, accessed November 29, 2018.
- Goddard Space Flight Center, AERONET Aerosol Robotic Network, https://aeronet.gsfc.nasa.gov/, accessed November 29, 2018.
- S. Wuttke, G. Seckmeyer, G. Bernhard, J. Ehramjian, R. McKenzie, P. Johnston and M. O'Neill, J. Atmospheric Ocean. Technol., 2006, 23, 241–251 CrossRef.
- P. F. Levelt, J. Joiner, J. Tamminen, J. P. Veefkind, P. K. Bhartia, D. C. Stein Zweers, B. N. Duncan, D. G. Streets, H. Eskes, R. van der A, C. McLinden, V. Fioletov, S. Carn, J. de Laat, M. DeLand, S. Marchenko, R. McPeters, J. Ziemke, D. Fu, X. Liu, K. Pickering, A. Apituley, G. González Abad, A. Arola, F. Boersma, C. Chan Miller, K. Chance, M. de Graaf, J. Hakkarainen, S. Hassinen, I. Ialongo, Q. Kleipool, N. Krotkov, C. Li, L. Lamsal, P. Newman, C. Nowlan, R. Suleiman, L. G. Tilstra, O. Torres, H. Wang and K. Wargan, Atmos. Chem. Phys., 2018, 18, 5699–5745 CrossRef CAS.
- NOAA Global Greenhouse Gas Reference Network, Trends in Atmospheric Carbon Dioxide, https://www.esrl.noaa.gov/gmd/ccgg/trends/weekly.html, accessed May 30, 2018.
- C. A. Gueymard, Sol. Energy, 2008, 82, 260–271 CrossRef.
- NASA Goddard Media Studios, Solar Variability and Total Solar Irradiance (TSI), https://svs.gsfc.nasa.gov/10396, accessed May 30, 2018.
- O. Coddington, J. L. Lean, P. Pilewskie, M. Snow and D. Lindholm, Bull. Am. Meteorol. Soc., 2016, 97, 1265–1282 CrossRef.
- C. A. Gueymard, Sol. Energy, 2004, 76, 423–453 CrossRef.
- National Center for Atmospheric Research, Quick TUV Calculator, http://cprm.acom.ucar.edu/Models/TUV/Interactive_TUV/, accessed November 29, 2018.
- E. P. Shettle and R. W. Fenn, Models for the aerosols of the lower atmosphere and the effects of humidity variations on their optical properties, Air Force Geophysics Lab Hanscom Afb Ma, 1979 Search PubMed.
- NASA Goddard Media Studios, Aerosol Optical Thickness, MODIS, 2000–2016, https://svs.gsfc.nasa.gov/12302, accessed July 14, 2018.
- M. Kroon, J. P. Veefkind, M. Sneep, R. D. McPeters, P. K. Bhartia and P. F. Levelt, J. Geophys. Res.: Atmos., 2008, 113, D16S28 Search PubMed.
- C. Hill and R. L. Jones, J. Geophys. Res.: Atmos., 2000, 105, 9421–9428 CrossRef CAS.
- J. Kim, J. Kim, H. K. Cho, J. Herman, S. S. Park, H. K. Lim, J. H. Kim, K. Miyagawa and Y. G. Lee, Atmos. Meas. Tech., 2017, 10, 3661–3676 CrossRef CAS.
- H. Bibi, K. Alam, F. Chishtie, S. Bibi, I. Shahid and T. Blaschke, Atmos. Environ., 2015, 111, 113–126 CrossRef CAS.
- NASA Gooddard Space Flight Center, NASA Ozone Watch, https://ozonewatch.gsfc.nasa.gov/facts/dobson.html, accessed May 30, 2018.
Footnote |
| † Electronic supplementary information (ESI) available. See DOI: 10.1039/c8em00478a |
| This journal is © The Royal Society of Chemistry 2019 |

