 Open Access Article
Creative Commons Attribution 3.0 Unported Licence
Correction: Understanding cation effects in electrochemical CO2 reduction
Stefan
Ringe†
*ab,
Ezra L.
Clark†
cd,
Joaquin
Resasco
e,
Amber
Walton
c,
Brian
Seger
d,
Alexis T.
Bell
c and
Karen
Chan
*f
aSUNCAT Center for Interface Science and Catalysis, Department of Chemical Engineering, Stanford University, Stanford, California 94305, USA. E-mail: sringe@stanford.edu
bSUNCAT Center for Interface Science and Catalysis, SLAC National Accelerator Laboratory, Menlo Park, California, 94025, USA
cJoint Center for Artificial Photosynthesis, Lawrence Berkeley National Laboratory, Berkeley, CA 94720, USA
dSurface Physics & Catalysis (SurfCat), Department of Physics Technical University of Denmark, Denmark
eDepartment of Chemical Engineering, University of California, Santa Barbara, California 93117, USA
fCatTheory Center, Department of Physics, Technical University of Denmark, Kongens Lyngby 2800, Denmark. E-mail: kchan@fysik.dtu.dk
First published on 8th November 2019
Abstract
Correction for ‘Understanding cation effects in electrochemical CO2 reduction’ by Stefan Ringe et al., Energy Environ. Sci., 2019, 12, 3001–3014.
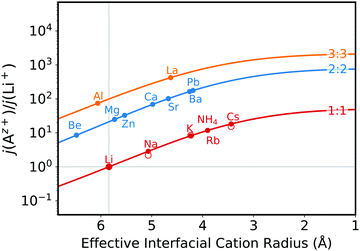
In the original version of the manuscript, the fit function presented in the caption of Fig. 7 for the hydrated ions was wrong. The correct function was −2.2x + 7.2 (change highlighted in bold). Therefore the x-axis positions of the different cations in Fig. S17 which were obtained from this correlation function were also wrong. The correct Figure is as follows:
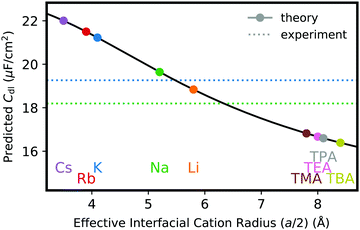
In addition, Fig. 6a used the wrong cation sizes for the organic cation data points. The updated Figure is given below:
 | ||
| Fig. 2 (a) Double layer capacitance at the Au(111) single-crystal electrode using a 0.05 M KHCO3 or NaHCO3 electrolyte. (a) Potential-dependence of the double layer capacitance obtained from fitting a RC circuit to the impedance data. Filled circles denote the data points, the solid gray line the difference in surface charge density between both experiments under the assumption of the same PZC of 0.97 V vs. RHE.1 | ||
Previous studies electrodeposited a Ag monolayer on Pt or Au and found the PZC to be up to 0.25 V more positive compared to Ag(111).2
The Royal Society of Chemistry apologises for these errors and any consequent inconvenience to authors and readers.
References
- S. Trasatti and E. Lust in Modern Aspects of Electrochemistry, ed. J. O'M. Bockris, B. E. Conway and R. E. White, Kluwer Academic/Plenum Publishers, New York, 1999, vol. 33 Search PubMed.
- K. A. Soliman and L. A. Kibler, Variation of the potential of zero charge for a silver monolayer deposited onto various noble metal single crystal surfaces, Electrochim. Acta, 2007, 52(18), 5654–5658 CrossRef CAS.
Footnote |
| † These authors contributed equally. |
| This journal is © The Royal Society of Chemistry 2019 |


![[thin space (1/6-em)]](https://www.rsc.org/images/entities/char_2009.gif) :
: