 Open Access Article
Creative Commons Attribution 3.0 Unported Licence
Correction: Powering sustainable development within planetary boundaries
Ibrahim M.
Algunaibet
 a,
Carlos
Pozo
 a,
Ángel
Galán-Martín
 a,
Mark A. J.
Huijbregts
 b,
Niall
Mac Dowell
 ac and
Gonzalo
Guillén-Gosálbez
 *ad
*ad
aCentre for Process Systems Engineering, Department of Chemical Engineering, Imperial College London, South Kensington Campus, London SW7 2AZ, UK
bDepartment of Environmental Science, Institute for Water and Wetland Research, Radboud University, P.O. Box 9010, NL-6500, GL, Nijmegen, The Netherlands
cCentre for Environmental Policy, Imperial College London, South Kensington Campus, London SW7 1NA, UK
dInstitute for Chemical and Bioengineering, Department of Chemistry and Applied Biosciences, ETH Zürich, Vladimir-Prelog-Weg 1, 8093 Zürich, Switzerland. E-mail: gonzalo.guillen.gosalbez@chem.ethz.ch
First published on 19th November 2019
Abstract
Correction for ‘Powering sustainable development within planetary boundaries’ by Ibrahim M. Algunaibet et al., Energy Environ. Sci., 2019, 12, 1890–1900.
We followed Ryberg et al.1 in the original manuscript and characterized the nitrogen (N) flow by considering both intended and unintended N fixation, while the planetary boundary for N flow, as based on the works by Steffen et al.2 and De Vries et al.,3 only includes intended biological and chemical N fixation. Therefore, to be fully consistent with the original works by Steffen et al.2 and De Vries et al.,3 unintended N fixation caused by other sectors, e.g., NOx from the power sector, should not be included. Consequently, we here adjusted the N flow calculations by considering only the intended chemical N fixation by fertilizers—from the agriculture sector only—embodied in the life cycle of the generation of 1 kW h of electricity.
As the life cycle inventory database Ecoinvent,4 used in the calculations, does not provide explicitly ‘intended biological N fixation,’ this component needs to be excluded from our N flow calculations accordingly. Since the planetary boundary on N flow, i.e., 62 Tg N per annum, considers both intended biological and chemical fixation, we here adjusted the N flow planetary boundary by taking the portion relevant to intended chemical fixation only. According to Steffen et al.,2 the current value of N flow is 150 Tg N per annum, out of which 96 Tg N per annum (64%) is attributed to chemical fixation by fertilizers.5 Therefore, we reduced the N flow planetary boundary from 62 to 39.7 Tg N per annum to consider industrial fixation only, assuming such share would remain constant.
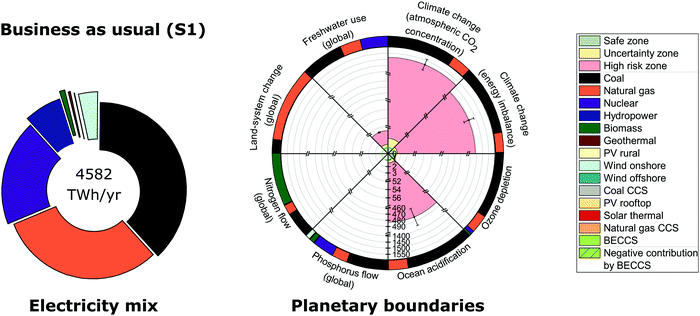
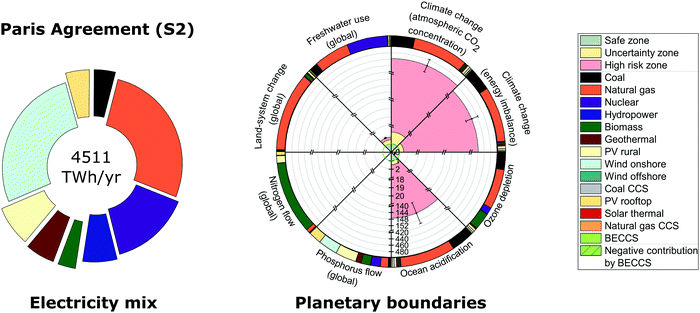
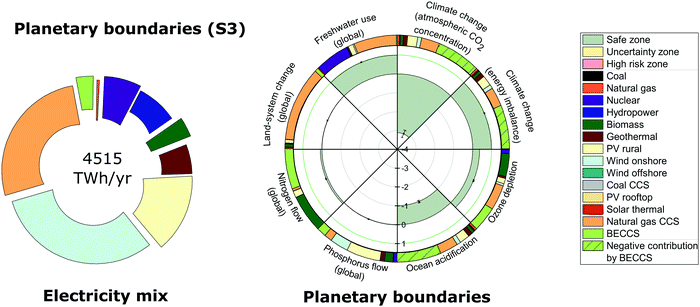
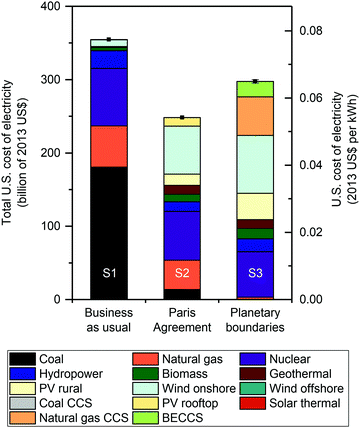
These changes make all scenarios meet the planetary boundary on N flow. The mix, cost and performance in the remaining boundaries remain the same in the Business as Usual Scenario (S1) that assumes the current mix is kept until 2030 (Fig. 2), and in the Paris Agreement scenario (S2), which minimizes costs subject to meeting a target on greenhouse gas emissions in 2030 (Fig. 3). This happens because the mathematical formulation employed to produce these two solutions is not constrained by planetary boundaries. The planetary boundary constrained scenario (S3) meets all planetary boundaries concurrently at a lower cost (Fig. 4 and 5). For readers' convenience, here we show Fig. 2–5 again with the new results.
The following corrections should also be made:
In the abstract, the section “Taking the United States as a testbed, we found that the least cost energy mix that would meet the Paris Agreement 2 degrees Celsius target still transgresses five out of eight planetary boundaries. It is possible to meet seven out of eight planetary boundaries concurrently by incurring a doubling of the cost compared to the least cost energy mix solution (1.3% of the United States gross domestic product in 2017). Due to the stringent downscaled planetary boundary on biogeochemical nitrogen flow, there is no energy mix in the United States capable of satisfying all planetary boundaries concurrently.” should be replaced with “Taking the United States as a testbed, we found that the least cost energy mix that would meet the Paris Agreement 2 degrees Celsius target, still transgresses four out of eight planetary boundaries. It is possible to meet all planetary boundaries concurrently by incurring a 20% additional cost compared to the least cost energy mix solution (0.3% of the United States gross domestic product in 2017).”
On page 1891, left column, lines 29–49, the section “We found that the Business as Usual (BAU) energy mix, i.e., the US 2012 default developments in the power sector required to meet the 2030 electricity demand, transgresses six out of the eight PBs considered, including the climate change PBs. Furthermore, the least cost energy mix, which is in line with the 2 degrees Celsius (°C) target governed by the Paris Agreement (the Paris Agreement solution henceforth), transgresses five out of the eight PBs, including those on climate change, though in this solution the magnitude of the transgression is lower. Our model could not identify any single mix satisfying all the shares of PBs assigned to the US power sector concurrently, yet seven of the eight PBs could be met simultaneously with an energy mix relying on wind (both onshore and offshore), natural gas with Carbon Capture and Storage (CCS), hydropower and Bio-energy with CCS (BECCS). This mix would incur an extra cost of 40% compared to the BAU solution (or 0.8% of the US Gross Domestic Product (GDP) in 2017), while doubling the cost of the Paris Agreement solution (or an extra cost equal to 1.3% of the US GDP in 2017). This extra cost needed to improve the performance of the mix in terms of PBs would be associated with mandatory investments in relatively expensive electricity technologies, such as wind offshore, natural gas with CCS and BECCS.” should be replaced with “We found that the Business as Usual (BAU) energy mix, i.e., the US 2012 default developments in the power sector required to meet the 2030 electricity demand, transgresses five out of the eight PBs considered, including the climate change PBs. Furthermore, the least cost energy mix, which is in line with the 2 degrees Celsius (°C) target governed by the Paris Agreement (the Paris Agreement solution henceforth), transgresses four out of the eight PBs, including those on climate change, though in this solution the magnitude of the transgression is lower. Our model could identify a mix satisfying all the shares of PBs assigned to the US power sector concurrently, with an energy mix relying on wind onshore, natural gas with Carbon Capture and Storage (CCS), PV rural and Bio-energy with CCS (BECCS). This mix would incur an extra cost of 20% compared to the Paris Agreement solution (or an extra cost equal to 0.3% of the US GDP in 2017). This extra cost needed to improve the performance of the mix in terms of PBs would be associated with mandatory investments in relatively expensive electricity technologies, such as natural gas with CCS and BECCS.”
In Table 1, the value of “Assigned share of safe operating space to the US power sector (aSUSpower = 0.062%)” for “Biogeochemical nitrogen flow (global)” should be 0.025 Tg N year−1 rather than 0.038 Tg N year−1.
On page 1893, right column, lines 1–2, “biogeochemical N flow is obtained from NOx and NH3 to air, N-tot and NO3− to freshwater and NO3− to groundwater” should be replaced with “biogeochemical N flow is obtained from life cycle nitrogen fertilizers demanded by the agriculture sector only”.
On page 1894, right column, lines 37–43 and page 1895, left column, lines 1–2, the section “We found that six out of the eight PBs considered are transgressed in solution (S1), including atmospheric CO2 concentration, energy imbalance at top-of-atmosphere, ocean acidification, biogeochemical N flow, freshwater use and stratospheric ozone depletion (Fig. 2), which raises significant concerns about our future ability to deliver sustainable energy without altering the current status quo. Only two PBs would hence be satisfied, namely biogeochemical P flow and land-system change.” should be replaced with “We found that five out of the eight PBs considered are transgressed in solution (S1), including atmospheric CO2 concentration, energy imbalance at top-of-atmosphere, ocean acidification, freshwater use and stratospheric ozone depletion (Fig. 2), which raises significant concerns about our future ability to deliver sustainable energy without altering the current status quo. Only three PBs would hence be satisfied, namely biogeochemical P flow, biogeochemical N flow and land-system change.”
On page 1895, left column, lines 17–20, the sentence “At a lesser transgression extent, the global PB on biogeochemical N flow is surpassed by 55 times above the limit, mainly due to the reliance on coal power plants.” should be deleted.
On page 1895, right column, lines 11–15, the section “five out of the eight PBs considered would still be transgressed. The transgressed PBs in solution S2 include both PBs on climate change, as well as PBs on ocean acidification, biogeochemical N flow and freshwater use.” should be replaced with “four out of the eight PBs considered would still be transgressed. The transgressed PBs in solution S2 include both PBs on climate change, as well as PBs on ocean acidification and freshwater use.”
On page 1895, right column, lines 28–30, the sentence “Furthermore, solution S2 transgresses the PB on biogeochemical N flow by 20 times above the limit due to the deployment of coal, biomass and PV plants.” should be deleted.
From page 1896, right column, line 3 to page 1897, left column, line 4, the section “We found that no energy mix exists that can meet all of the PBs concurrently. More precisely, no single energy mix can satisfy the global biogeochemical N flow PB, noting that in this PB, solution S3 lies in the high risk zone (red area in Fig. 4).” should be replaced with “We found an energy mix that can meet all of the PBs concurrently.”
On page 1897, left column, lines 5–7, “The mix in solution S3 reduces the number of coal and natural gas plants while deploying BECCS, wind onshore and offshore and natural gas with CCS power plants” should be replaced with “The mix in solution S3 reduces the number of coal and natural gas plants while deploying BECCS, wind onshore, PV rural and natural gas with CCS power plants”.
On page 1897, left column, lines 22–28, the section “Furthermore, the deployment of hydropower and wind onshore and offshore plants reduces the transgression of the global biogeochemical N flow PB by 49% compared to the Paris Agreement mix (S2) and 81% compared to the BAU mix (S1). In solution S3, this transgression is mainly due to the deployment of BECCS and natural gas with CCS plants as well as the presence of nuclear plants.” should be deleted.
On page 1897, left column, lines 42–50, the section “The least cost solution that minimizes the transgression of PBs (S3) has the drawback of increasing the cost of electricity by 40% compared to the BAU mix (S1) while doubling the cost compared to the Paris Agreement mix (S2) (Fig. 5). The differences in costs incurred by solution S3 in contrast to the BAU (S1) and Paris Agreement (S2) mixes constitute 0.8% and 1.3%, respectively, of the US GDP in 2017. This extra cost is mainly due to the deployment of wind offshore, natural gas with CCS and BECCS…” should be replaced with “The least cost solution that minimizes the transgression of PBs (S3) decreases the cost of electricity by 16% compared to the BAU mix (S1) while increases the cost by 20% compared to the Paris Agreement mix (S2) (Fig. 5). The differences in costs incurred by solution S3 in contrast to the BAU (S1) and Paris Agreement (S2) mixes constitute −0.3% and 0.3%, respectively, of the US GDP in 2017. This extra cost is mainly due to the deployment of natural gas with CCS and BECCS…”.
On page 1897, right column, lines 4–5, “We note that emerging technologies are found to be necessary by ERCOM-PB to meet seven PBs concurrently” should be replaced with “We note that emerging technologies are found to be necessary by ERCOM-PB to meet all PBs concurrently”.
On page 1898, left column, lines 17–18, “Wind onshore and offshore, natural gas with CCS and BECCS play a key role in meeting concurrently seven of the eight PBs” should be replaced with “Wind onshore, PV rural, natural gas with CCS and BECCS play a key role in meeting all PBs concurrently”.
On page 1898, left column, lines 26–34, the section “Nonetheless, with the current technological landscape in the US power sector, meeting the global biogeochemical N flow seems unattainable; this is due to the limited potential of those technologies that are competitive across all PBs, such as hydropower and wind technologies. Pathways that could improve the current potential and reliability of hydropower and wind technologies through, for example, the deployment of more affordable storage facilities45,46 could aid meeting all of the PBs concurrently.” should be deleted.
On page 1898, left column, lines 38–39, “For example, the poor performance of energy systems in terms of biogeochemical N flow could be offset…” should be replaced with “For example, the performance of energy systems in terms of freshwater use could be offset…”.
On page 1898, left column, lines 42–46, “Particularly, the power sector could exert a net negative contribution towards atmospheric CO2 concentration and ocean acidification by deploying BECCS, which would allow the sector to ‘trade’ shares of other PBs, mainly biogeochemical N flow, with other sectors.” should be replaced with “Particularly, the power sector could exert a net negative contribution towards atmospheric CO2 concentration and ocean acidification by deploying BECCS, which would allow the power sector to ‘trade’ shares of other PBs with other sectors.”
From page 1898, left column, line 50 to page 1898, right column, line 4, the section “The reliance on expensive technologies (e.g., wind offshore, natural gas with CCS and BECCS) needed to meet seven of the eight PBs while minimizing the transgression of the biogeochemical N flow PB would increase the cost of electricity generation, 40% relative to the BAU solution and 100% relative to the Paris Agreement solution. These additional costs relative to the BAU and Paris Agreement mixes would constitute 0.8% and 1.3% of the US GDP in 2017, respectively.” should be replaced with “The reliance on expensive technologies (e.g., natural gas with CCS and BECCS) needed to meet all PBs concurrently would increase the cost of electricity generation, 20% relative to the Paris Agreement solution; such additional cost would constitute 0.3% of the US GDP in 2017.”
The Royal Society of Chemistry apologises for these errors and any consequent inconvenience to authors and readers.
References
- M. W. Ryberg, M. Owsianiak, K. Richardson and M. Z. Hauschild, Ecol. Indic., 2018, 88, 250–262 CrossRef.
- W. Steffen, K. Richardson, J. Rockstrom, S. E. Cornell, I. Fetzer, E. M. Bennett, R. Biggs, S. R. Carpenter, W. de Vries, C. A. de Wit, C. Folke, D. Gerten, J. Heinke, G. M. Mace, L. M. Persson, V. Ramanathan, B. Reyers and S. Sorlin, Science, 2015, 347, 1259855 CrossRef PubMed.
- W. De Vries, J. Kros, C. Kroeze and S. P. Seitzinger, Curr. Opin. Environ. Sustainability, 2013, 5, 392–402 CrossRef.
- T. Nemecek, T. Kägi and S. Blaser, Final report ecoinvent v2.0, 2007 Search PubMed.
- D. Fowler, M. Coyle, U. Skiba, M. A. Sutton, J. N. Cape, S. Reis, L. J. Sheppard, A. Jenkins, B. Grizzetti and J. N. Galloway, Philos. Trans. R. Soc., B, 2013, 368, 20130164 CrossRef PubMed.
| This journal is © The Royal Society of Chemistry 2019 |


