
 Open Access Article
 This Open Access Article is licensed under a
 Creative Commons Attribution 3.0 Unported Licence
Vulnerability of existing and planned coal-fired power plants in Developing Asia to changes in climate and water resources†
Yaoping
Wang‡
 *ab,
Edward
Byers
b,
Simon
Parkinson
bc,
Niko
Wanders
d,
Yoshihide
Wada
b,
Jiafu
Mao
e and
Jeffrey M.
Bielicki
afg
*ab,
Edward
Byers
b,
Simon
Parkinson
bc,
Niko
Wanders
d,
Yoshihide
Wada
b,
Jiafu
Mao
e and
Jeffrey M.
Bielicki
afg
aEnvironmental Science Graduate Program, The Ohio State University, USA
bInternational Institute for Applied Systems Analysis, Laxenburg, Austria
cInstitute for Integrated Energy Systems, University of Victoria, Victoria, Canada
dDepartment of Physical Geography, Utrecht University, The Netherlands
eEnvironmental Sciences Division and Climate Change Science Institute, Oak Ridge National Laboratory, USA
fDepartment of Civil, Environmental, and Geodetic Engineering, The Ohio State University, USA
gJohn Glenn College of Public Affairs, The Ohio State University, USA
First published on 20th September 2019
Abstract
Coal power generation dominates electricity supply in Developing Asia, and more than 400 gigawatts (GW) of new coal-fired capacity is planned for operation by 2030. Past studies on thermal electricity-water nexus have not accounted for this new capacity, and use coarse spatial and temporal resolutions in the assessment of long-term power system reliability. Here, high-resolution hydro-climatic simulations and asset-level power plant water use models are integrated to quantify water constraints on coal-fired power plants in Developing Asia, for different scenarios of future climate change, cooling system choice, and capacity expansion. Future climate change and capacity expansion decrease the annual usable capacity factor (UF) of coal power generation in Mongolia, Southeast Asia, and parts of India and China. The negative impacts are lessened by widening the geographic areas of aggregation. Under near-term mitigation scenarios with high penetrations of CO2 capture technology, the regional average water withdrawal intensity of coal power generation is 50–80% higher than current conditions. With careful siting, the increased water withdrawal intensity does not necessarily constrain future electricity production on annual or monthly time scales, but decreases system reliability by increasing the probability of low UF at daily time scale. Our findings highlight the unaccounted-for-risk in Developing Asia's long-term power plan featuring coal power generation. Regional capacity expansion should consider the reliability of future thermal power assets under long-term hydroclimate change using high-resolution models and multiple scenarios.
Broader contextMany aspects of modern energy systems rely on the availability of water. Planning for energy infrastructure must consider this availability in order to minimize conflicts with other demands for water (e.g., industry, ecosystems). The study investigates the electricity planning problem in Developing Asia, where rapid expansion of coal-fired power plants and low water availability co-exist with interdependencies that evolve with the makeup of the energy system and with the climate. Using high-resolution hydro-climate simulations and datasets of the existing and planned power plants, the water constraints on coal-fired electricity generation were quantified at the power-plant level under various climate and energy planning scenarios. Coal-fired power plants in Mongolia, Southeast Asia, and parts of India and China are projected to confront substantially greater water constraints under current capacity expansion plans, regardless of the implementation of CO2 capture technology that requires additional water. The results suggest three strategies to mitigate water limitations: (1) selectively reducing the existing/planned power plants in water-scarce regions; (2) integrating electricity markets so that interregional electricity transmission can compensate for local water stress; and (3) widely adopting dry cooling in northern Asia where the technology does not incur high losses in thermal efficiency. |
1 Introduction
Thermal power plants (e.g. natural gas, nuclear, and coal) accounted for 75% of the global net electricity generation in 2017.1 Many of these power plants use water for cooling, which is increasingly constraining their electricity output because of low water availability or high intake water temperatures – sometimes both.2–6 Changes in streamflow and water temperature due to climate change could exacerbate these constraints,7–13 and previous studies have suggested that the usable capacity of thermal power generation could decrease by 1.6–16% in the United States, 6.3–19% in Europe, and 8–16% on average globally by the middle of the 21st century.7–10Power plants in Asia account for approximately 37% of the global electricity generation and 41% of CO2 emissions, because 64% of their electricity is generated from coal.14,15 Population growth and economic development continue to increasingly drive water scarcity and electricity demand in Asia.15,16 Some existing regional regulations seek to address the environmental impacts of current and future coal-fired power plants by banning the use of groundwater for cooling, limiting the construction of new power plants, and mandating the use of wet cooling towers.17–19 Still, about 490 GW of new coal-fired power generation is under planning or construction in the rapidly developing countries of Asia (hereafter referred to as Developing Asia) for operation before 2030, including 168 GW in China and 110 GW in India.20 This planned capacity adds 30% more to the existing coal-fired generation capacity, and will engender substantial water requirements and amounts of pollutants that can exacerbate global climate change and regional air pollution.21 Although there have been much discussion about incentivizing wider use of CCS to mitigate the CO2 emissions, current amine-based post-combustion CO2 capture technology will increase the water requirements of coal-fired power plants even further.22–24 As such, there is an urgent need to understand the water requirements of coal-fired capacity expansion in Developing Asia, and whether water scarcity may reduce the availability of thermal power capacity and impede the ability to reliably provide the energy services that are motivating addition of coal capacity.
There have been many previous assessments of the interactions between thermal electricity generation and water, but the unique situation of Developing Asia, and the fact that water availability and water requirements have considerable small-scale spatial and temporal variability that can change over time, remain largely unaddressed. One group of studies examined the impact of water constraints on the usable capacity of thermal power generation,7–13,25,26 most of which focused on existing power plants in developed countries (e.g., Europe, United States) that have much lower population density and expect much less growth in electricity demand than Developing Asia.7–10,12,13,25 A second group examined the water requirements of thermal power production under historical and future electricity demand, capacity changes, and climate conditions, and sometimes included the associated impacts on water quality and scarcity.24,27–43 Some of these studies focused on China and India, but only considered present conditions, or have calculated water requirements at low spatial and temporal resolutions using scenarios of future electricity demand from integrated assessment models (IAMs) or policy outlooks.24,29–31,37–39,41–43 A third group of studies incorporated water constraints into power systems models or IAMs, but these studies are also for existing capacity or are at coarse spatial and temporal resolutions.44–46 As such, the third and fourth group of studies use either of two assumptions: (1) the water availability and the water requirements of power plants remain the same as historical conditions, or (2) the water availability and requirements are evenly distributed over a large region. The first assumption cannot deal with a situation like the rapid capacity expansion in Developing Asia. The second assumption can miss ‘hotspots’ of water scarcity that may coincide with large power plants that require much water, and fails to account for low- or high-temperature and streamflow events. A fourth group of studies investigated the feasibility and costs of adaptations to climate and hydrologic variability, such as the transition to renewable energy technologies,47 alternative water sources,48,49 and cooling systems with low water requirements.48,49
This study assesses the impacts of future water constraints on the usable capacity of coal-fired power generation in Developing Asia. In contrast to prior studies, that have used IAM-projected scenarios to assess the thermal electricity-water nexus under capacity expansion,29–31,37,50 this study integrates asset-level geospatial databases describing the location, type and capacity of existing and future coal power generation20 with high-resolution hydrological projections at 5 arcmin (∼10 km at the equator). The analysis reveals local and daily variations in the water constraints on thermal power generation. To simulate future hydrological conditions, we used climate scenarios that correspond to 1.5 °C, 2 °C, and 3 °C increase in global temperature above pre-industrial levels. The 1.5 °C and 2 °C warming are consistent with the temperature and mitigation targets in the Paris Agreement,51 while 3 °C (or higher) warming is likely to happen if current trajectory of greenhouse gas emissions continues.52 We further implemented different scenarios of cooling system choice, evolution of the power generation fleet, and the deployment of CO2 capture and storage (CCS) technologies, that are consistent with 1.5 °C, 2 °C, and 3 °C warming in order to understand the potential impacts of adaptation to water scarcity and CO2 emissions mitigation. The analysis here promotes understanding of the energy-water nexus by filling the knowledge gap for an important region (Developing Asia) in the global energy system, and by substantially enhancing the spatial and temporal resolution at which the water implications of future capacity expansion are studied. The analysis also gives valuable insight into planning future power generation investments in Developing Asia.
2 Data and methods
2.1 Climate change and hydrological modeling
We based our analysis on 30 year time series that represent future climate conditions consistent with 1.5, 2 and 3 °C global mean temperature change above pre-industrial levels.53 The 30 year periods are derived from the original outputs of five global climate models (GCMs) forced by the Representative Concentration Pathway 6.0 (RCP 6.0) emission scenario in the Coupled Model Intercomparison Project Phase 5 (CMIP5)53 (Table 1 below). We used the 0.5° × 0.5° downscaled and bias-corrected meteorological data (air temperature, relative humidity, and surface air pressure) of the five GCMs from the Inter-Sectoral Impact Model Intercomparison (ISI-MIP) Project54 as meteorological inputs for our hydrological and cooling water withdrawal simulations.We used the global hydrological model, PCRaster Global Water Balance model version 2 (PCR-GLOBWB 2)55 to simulate streamflow and water temperature at 5 arcmin (∼10 km at the equator) spatial resolution and daily temporal resolution for Asia. The water temperature module is an improvement of a previous energy balance model.56,57 We conducted the simulations consecutively for the historical period (1950–2005) and the future period under RCP6.0 scenario (2006–2100). The PCR-GLOBWB 2 model considers the impacts of water demands from the irrigation, livestock, industry, and household sectors, and the impact of reservoir management on streamflow under the “Middle of the Road” Shared Socioeconomic Pathway (SSP2).55 By including upstream demand we ensure that the simulated streamflow reflects the streamflow that can be withdrawn for thermal power generation after removal of the demands of other users.
2.2 Existing and planned coal-fired power plants
The publicly available Global Coal Plant Tracker (GCPT17) dataset20 provides the location, capacity, status, heat rate, combustion technology, and vintage for 3456 existing and 751 planned (under construction, permitted, or pre-permitted for operation before the year 2030) coal-fired power plants that are within the spatial extent of the analysis for the following countries that comprise Developing Asia: Bangladesh, Cambodia, China, India, Laos, Myanmar, Pakistan, Sri Lanka, Thailand, Vietnam, and South Korea (see Fig. S1 and S2 in the ESI†).20 We verified and supplemented these data with the cooling system types and a second set of heat rates for the existing coal-fired power plants from a geo-referenced dataset of global thermal power plants.28,582.3 Usable capacity and usable capacity factor of the coal-fired power plants
As in previous studies,8,10,59 we defined the usable capacity (UCt, where t is the day) of a coal-fired power plant with nameplate capacity (C), to be the maximum amount of power that can be generated under water constraints: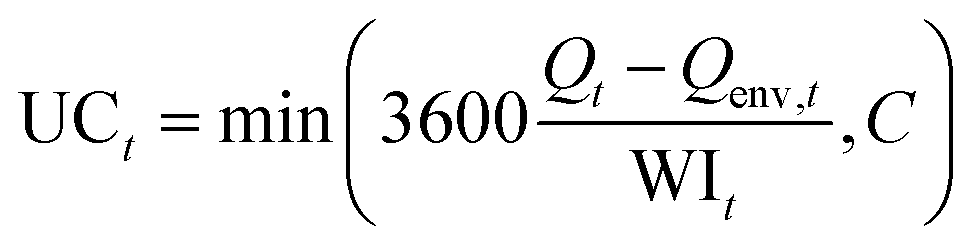 | (1) |
We calculated the water withdrawal intensity at each power plant as the sum of cooling water withdrawal intensity and the water withdrawal intensities of three major non-cooling processes (CO2 capture, flue-gas desulfurization, and wet ash handling). We estimated the cooling water withdrawal intensities of once-through cooling and wet cooling tower systems with heat and water balance models from prior work,10 and set to zero the cooling water withdrawal of combined heat-and-power plants, power plants that use dry cooling, or power plants that use once-through cooling with ocean water. For CO2 capture, we assumed that the technology will be post-combustion amine-based CO2 capture, which is the only currently commercially available capture technology for coal-fired power plants.23 We calculated the water withdrawal intensities of CO2 capture as the difference between the median water withdrawal intensities of subcritical, supercritical, and integrated gasification combined cycle coal power plants with and without CO2 capture that were reported in a widely-accepted review.61 These calculated water withdrawal intensities are very similar to the values reported by more recent simulation studies for Asian coal-fired power plants.24,62,63 The review61 does not provide the water withdrawal intensities of CO2 capture for circulation-with-fluidized-bed and ultra-supercritical power plants.61 So we used the withdrawal intensities of CO2 capture for subcritical and supercritical power plants for each, respectively. We used data from the literature for flue-gas desulfurization64,65 and developed and implemented a material balance method for wet ash handling. Detailed formulas, sensitivity analyses, and validation against previously reported water withdrawal intensities are provided in Sections S3 and S4 of the ESI.†
For Qenv,t, we compared three environmental flow methods that have been previously applied at large scale: the annual flow quantiles method (Q90_Q50), the variable monthly flow method (VMF), and the shifted flow-duration-curve method (ShiftFDC).60,66,67 We selected the ShiftFDC method with environmental management class “C” because it provides medium-level estimates for environmental flow among the three environmental flow methods. Sensitivity analysis on the environmental flow methods are in Section S5 of the ESI.†
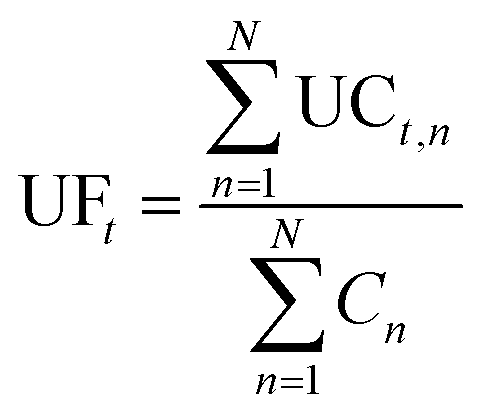
The UC increases linearly with the nameplate capacity of the power plant until the constraint of available streamflow (eqn (1)). To better compare between regions and scenarios with different amounts of total installed nameplate capacity, we defined the Usable capacity factor (UFt) of one or more power plants to be the ratio of UCt and the total nameplate capacity of the power plant(s):
 | (2) |
A thermal electricity generation unit cannot operate effectively with a UFt below a minimum load level, which is typically 20–50% depending on the design of the generation process.68 We set the UFt (and the associated UCt) of each generation unit in each power plant to zero if the UFt is below 20%, which results in optimistic estimates of UFt at power plant and regional levels. Sensitivity analyses on the minimum load level are in Section S5 of the ESI.†
Since UF is relative to the total nameplate capacity of the plant(s), we used UF as the metric to compare individual coal-fired power plants that differ in nameplate capacities, and between regions and scenarios that do not have the same amount of coal-fired power plants. We calculated UC and UF at daily time step for the coal-fired power plants for every combination of climate change scenario and capacity retirement case, and later averaged them to annual or monthly levels.
Multiple coal-fired power plants often occupied the same 5 arcmin grid cell that was simulated by PCR-GLOBWB 2. To account for competition between power plants for limited water resources, we allocated the available streamflow (Qt − Qenv,t) in each grid-cell level to each power plant in proportion to their nameplate capacities.
2.4 Future coal-fired power plant capacity
Since the evolution of power plant capacity is uncertain, we investigated four cases of capacity expansion for the coal-fired power plants under each scenario of climate change (1.5 °C, 2 °C, and 3 °C increase in global mean temperature above pre-industrial level):1. Existing capacity – assumes that only existing coal-fired power plants will operate in the future.
2. Expanded capacity – assumes that all existing and planned coal-fired power plants will operate in the future.
3. Capacity retirement – similar to the expanded capacity case, but the existing coal-fired power plants are retired based on when the plants became operational in six ten year batches beginning 1970, and following the common practice of retiring older plants first.69,70
4. Regional transformation – explores possible spatial distributions of coal-fired power plants that are consistent with climate policies under 1.5 °C, 2 °C, or 3 °C climate goals.51 While the other three scenarios assume zero use of CO2 capture except at the two power plants indicated in the GCPT17 dataset,20 this scenario allows any power plant to use CO2 capture. We used a combination of convergence downscaling, proportional downscaling, and random sampling techniques to translate future projections of regional coal consumption in Asia into power plant-level binary decisions between operation and retirement (or cancellation) and between the use or not of CO2 capture. The Asia regional coal consumptions are from global-IAM simulations that use SSP2 drivers and achieve approximately 1.5 °C, 2 °C, and 3 °C climate goals.71 The binary decisions consider the age of the power plant and local water availability in such a way that newer power plants and the power plants at more water-abundant locations are more likely to be operational, but no power plants are absolutely excluded. It should be noted that the simulations that achieve the 3 °C climate goal do not require the use of CCS. Details of the downscaling procedure are in Section S6 of the ESI.†
Table 2 displays the total number and capacity of coal-fired power plants for each case of capacity expansion. Table S1 of the ESI† provides the distribution of capacities at disaggregated administrative unit levels.
| Number of power plants | Total capacity (GW) | ||
|---|---|---|---|
| Existing capacity | 3456 | 1041 | |
| Expanded capacity | 4207 | 1454 | |
| Capacity retirement (decade before which the retired plants became operational) | 1970 | 4111 | 1447 |
| 1980 | 4036 | 1437 | |
| 1990 | 3783 | 1386 | |
| 2000 | 3325 | 1281 | |
| 2010 | 1988 | 899 | |
| 2020 | 751 | 413 | |
| Regional transformation (% of which CCS) | SSP2 1.5 °C | 1691 (84.6%) | 623 (76.6%) |
| SSP2 2 °C | 1741 (66.4%) | 640 (54.3%) | |
| SSP2 3 °C | 2876 (0%) | 1005 (0%) | |
2.5 Cooling systems: planned coal-fired power plants
Since the cooling systems for the planned coal-fired power plants are not publicly available, we investigated four cases of the choice of cooling system for the planned capacity:1. Freshwater once-through – all the planned coal-fired power plants implement once-through cooling systems using freshwater.
2. Freshwater cooling tower – all the planned coal-fired power plants implement wet cooling towers using freshwater.
3. Business-as-usual (BAU) – unless otherwise required by legislation, each planned power plant uses the same type of cooling system as the nearest existing power plant. In the study region, most of the existing inland coal-fired power plants use wet cooling towers with freshwater and most of the existing coastal coal-fired power plants use once-through cooling with sea water cooling (see Fig. S1 and S2 of the ESI†).
4. Adaptation – assumes that each coal-fired power plant (a) that uses once-through cooling systems with freshwater in the BAU case will switch to wet cooling towers, and (b) that uses wet cooling towers in the BAU case will implement dry cooling if the power plant has low UF under a combination of climate change scenario and case of capacity expansion. Low UF means that the annual average UF of the power plant, further averaged across the five GCMs and the random samples (for the regional transformation cases of capacity expansion), is below the historical average capacity factor of coal-fired power plants of the country, province (for China), or state (for India). The historical average capacity factors are shown in Table S2 of the ESI.†
For the adaptation case, we also investigated the trade-offs between a higher UF and the loss in thermal efficiency due to the use of dry cooling instead of a wet cooling tower. To do so, we used an approach developed by the U.S. Environmental Protection Agency72 to estimate the loss in thermal efficiency for switching from a wet cooling tower to a dry cooling system as a function of ambient temperature (see Section S7 of the ESI†). We calculated the changes in UF and losses in thermal efficiency for annual and summer (June–August) averages.
3 Results
3.1 Future changes in streamflow and water temperature
Across the ensemble of climate change scenarios, the results from PCR-GLOBWB 2 in Fig. 1 suggest that annual mean streamflow will decrease in southeastern China, Southeast Asia, part of Pakistan and western India, and increase in most of India and central China. Variations between the different climate models are shown in Fig. S3–S7 of the ESI.† Relative to the historical level of annual mean streamflow, the majority (defined to be between the 25th and 75th percentile) of the decreases are between −7% and −20%, and the majority of the increases are between 10% and 50% for the 2 °C scenario of climate change (see Fig. S8 of the ESI†). In the 1.5 °C and 3 °C scenarios, the increases in streamflow are slightly less and more widespread, respectively, but the overall spatial patterns are similar. These streamflow changes will impact the UF of the coal-fired power plants that use once-through cooling and wet cooling towers. The results also suggest that water temperatures will increase throughout Asia. For the most part, increases in water temperature will reduce the UF of the coal-fired power plants that use once-through cooling systems, because the water withdrawal intensity of once-through cooling systems is highly sensitive to the inlet water temperature, whereas the water withdrawal intensity of wet tower cooling systems is much less sensitive (see Section S3 of the ESI† for the relevant equations). Because far fewer power plants use once-through cooling than wet cooling towers in the study region, the impacts of changes in streamflow will be greater than the impacts of water temperature on the regional UF.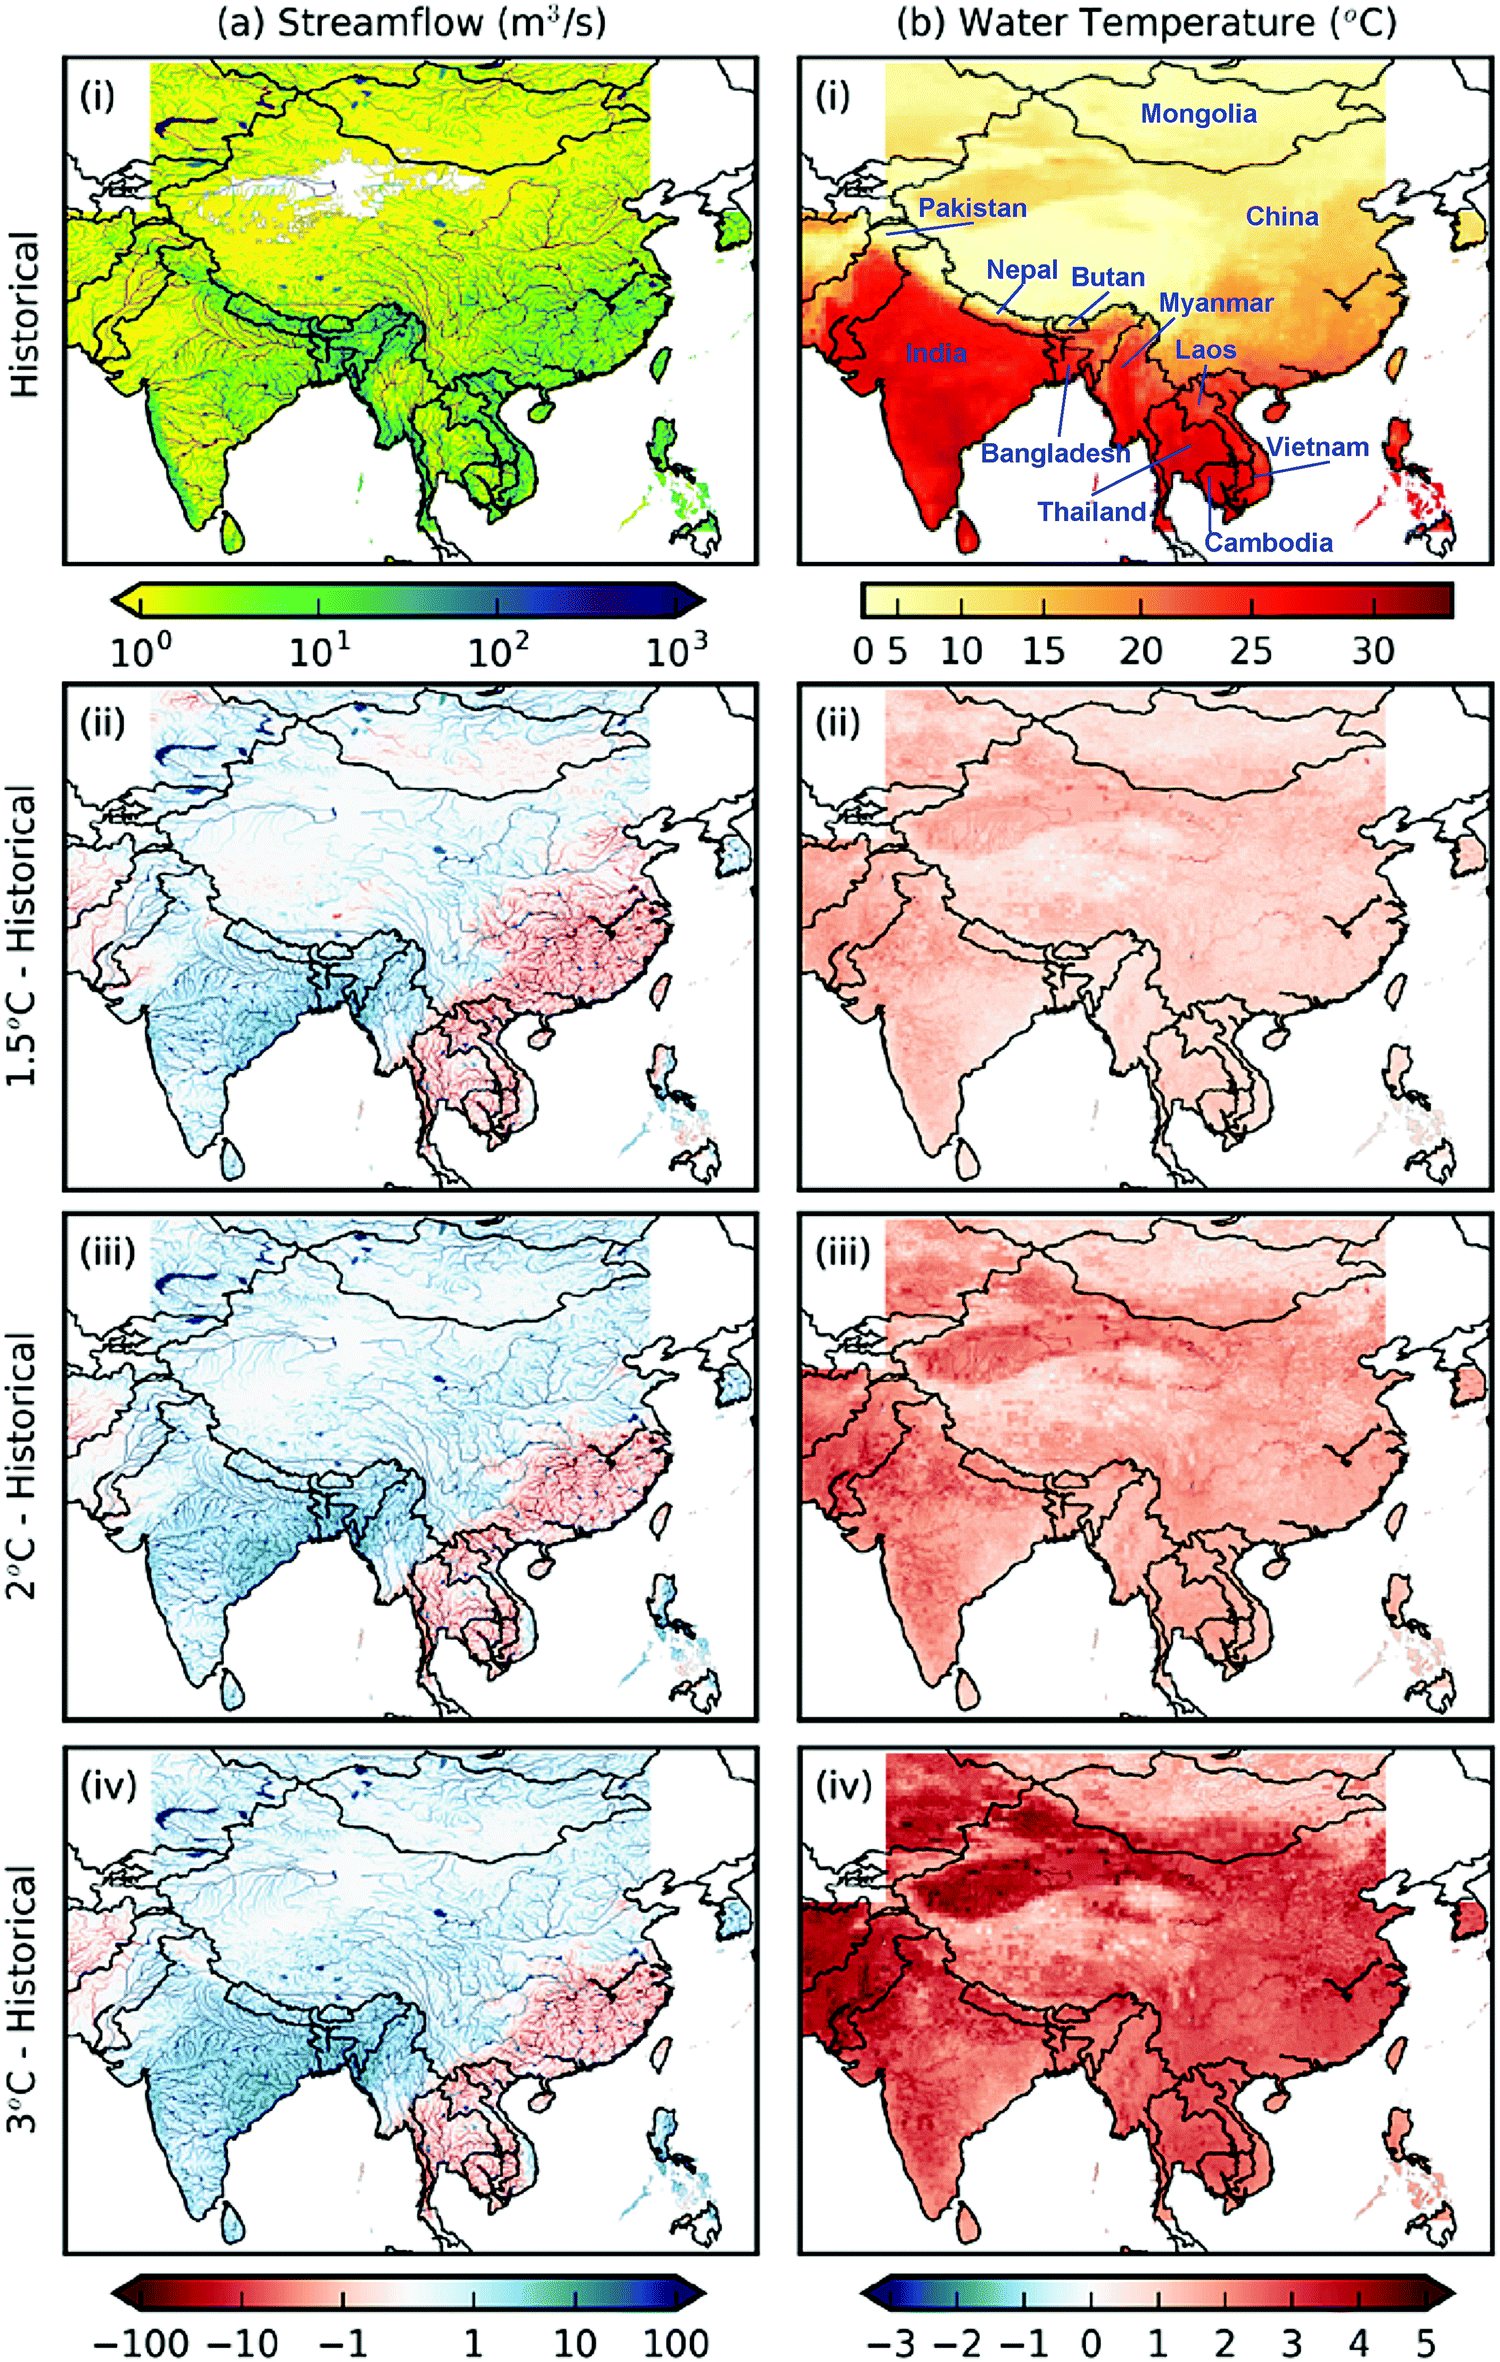 | ||
| Fig. 1 Impacts of climate change on water availability and temperature in Developing Asia. (a) Annual mean streamflow, and (b) annual mean water temperature. Results are from PCR-GLOBWB 2 simulations, averaged over the five GCMs. (i) Historical baseline (1961–1990), and the differences between the (ii) 1.5 °C, (iii) 2 °C, and (iv) 3 °C scenarios of climate change and the historical baseline. | ||
3.2 Water constraints on annual average UC and UF in the study region
The total annual average UC of the coal-fired power plants is highest in the 3 °C climate change scenario, followed by the 2 °C scenario, and lowest in the 1.5 °C scenario, regardless of the case of capacity expansion or cooling system choice (Fig. 2a). This overall increase in UC occurs because of the increases in streamflow in most locations. For each climate change scenario, the freshwater once-through cooling system case consistently has lower UC than the freshwater cooling tower case (Fig. 2a). Both cases have consistently lower UC than the BAU case (Fig. 2a), which is due to the many power plants that use ocean water for cooling or dry cooling systems in the BAU case (see Fig. S1 in the ESI†). The uncertainties due to different climate projections of the GCMs, and random sampling for the regional transformation cases, in the total annual average UC are relatively small compared with the differences across cooling system scenarios.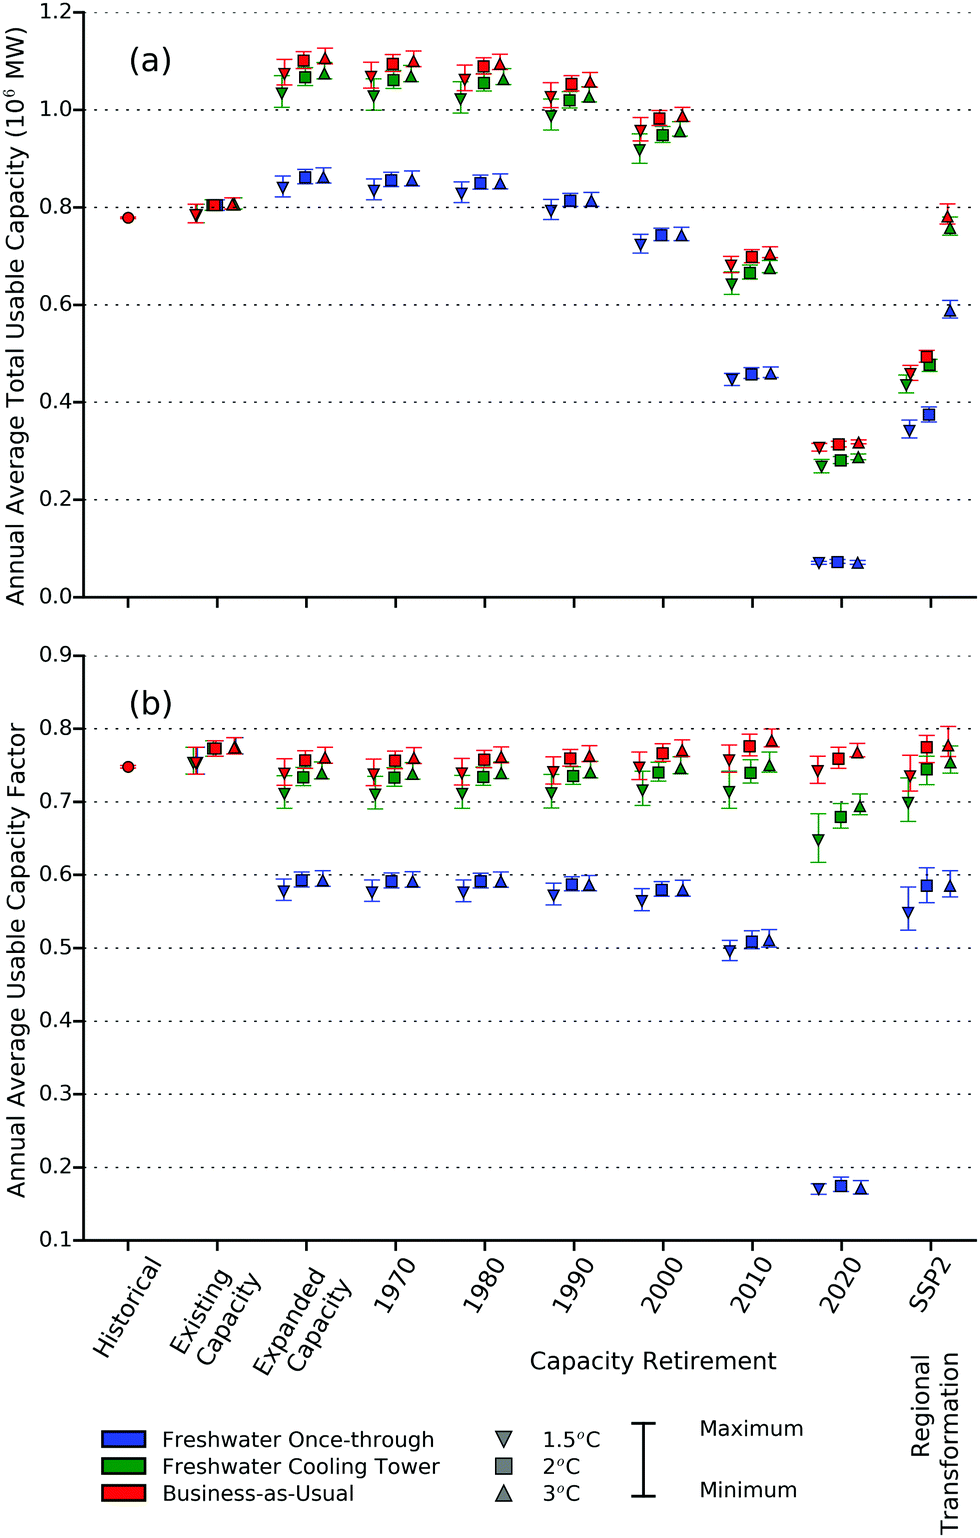 | ||
| Fig. 2 Annual average (a) total usable capacity (b) usable capacity factor of the coal-fired power plants in Developing Asia. The error bars indicate the range between the five GCMs, and (for the regional transformation cases of capacity expansion) random samples. | ||
In Fig. 2a, the total annual average UC increases by about 25% from the existing capacity case to the expanded capacity case in the freshwater cooling tower and BAU cases of cooling system choice, which suggests that the planned power plants can access streamflow resources that are not used by the existing plants. In contrast, there is only a small increase in the total annual average UF for the freshwater once-through case, suggesting that nearly all of the streamflow resources would have been used by the existing plants, if they used once-through cooling.
The total annual average UC in each capacity expansion case is always higher with higher total nameplate capacities (Fig. 2a and Table 2), which is confirmed by the mostly small changes in the regional annual average UF between the different cases of capacity expansion (Fig. 2b). But the UC and UF decrease between the capacity retirement 2010 and 2020 cases of capacity expansion for all cooling system choices, with the largest decrease occurring for the freshwater once-through case, and the smallest decrease for the BAU case (Fig. 2). These decreases occur because the planned plants are in locations with lower streamflow than the existing plants. When a capacity expansion case has a higher percentage of planned power plants, a lower fraction of the power plants are at locations with streamflow of 100 m3 s−1 to 1000 m3 s−1, and a higher fraction at locations with ∼1 m3 s−1 streamflow (Fig. 3). This phenomenon applies to all the GCMs and scenarios of climate change (Fig. S9 of the ESI†). The typical water withdrawal intensity of power plants with once-through cooling systems is around 100 m3 MW−1 h−1 (see Section S4 of the ESI†). Therefore, water availability constraints will be especially limiting for the planned power plants in the freshwater once-through case.
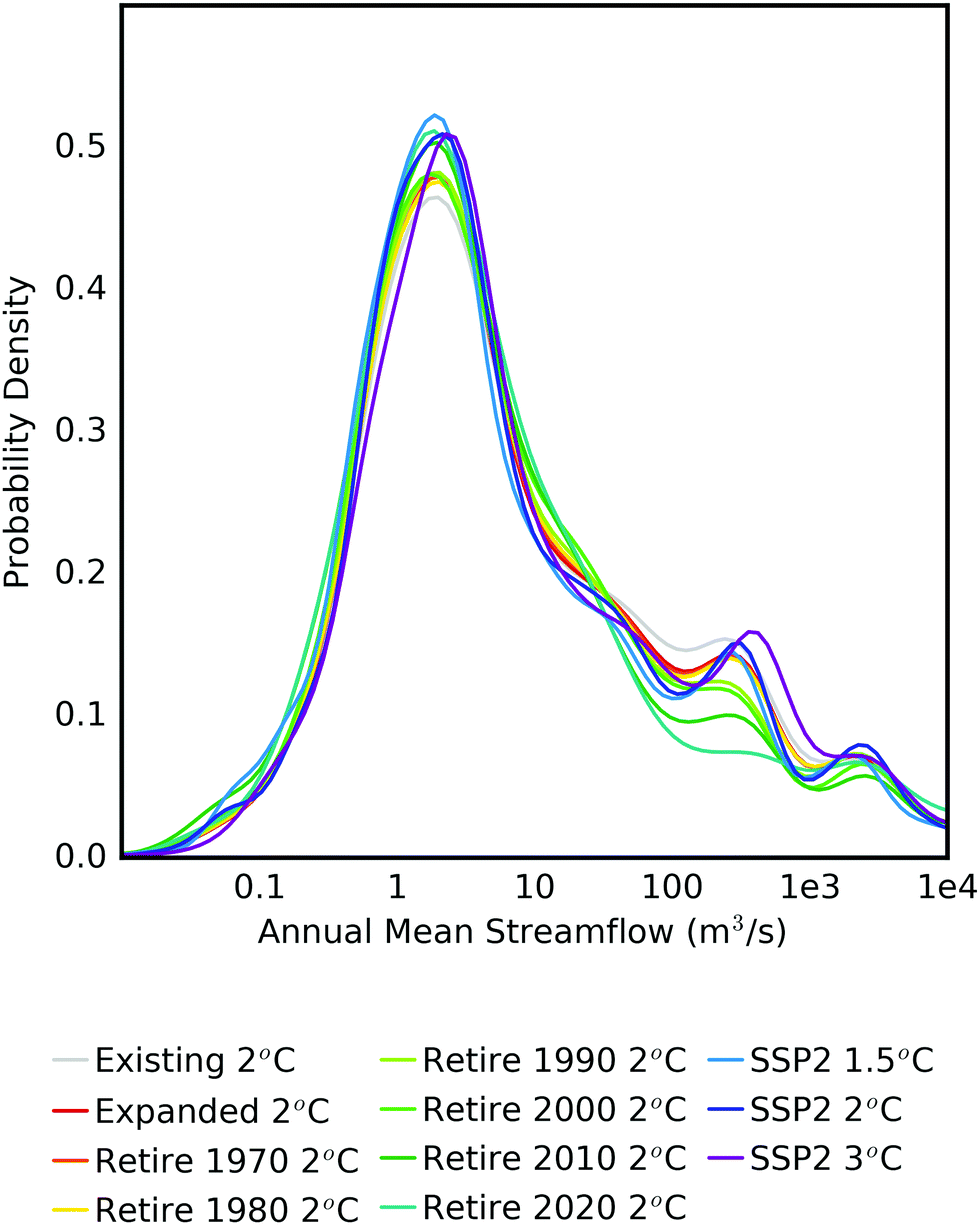 | ||
| Fig. 3 Nameplate capacity-weighted probability density distribution of the annual mean streamflow at the grid cells occupied by coal-fired power plants, for selected scenarios of climate change and all cases of capacity expansion. The annual mean streamflow were pooled across the five GCMs and (for the regional transformation cases of capacity expansion) random samples. The displayed probability density distributions were smoothed by kernel density estimation for better readability. | ||
Focusing on the BAU case of cooling system choice, the expanded capacity case and capacity retirement cases mainly have lower UF than the existing capacity case, while the retirement 2010 case has a similar UF. These differences arise from the interactions between local water availability and the competition between power plants for water. For most capacity retirement cases, the power plants are distributed at locations with lower streamflow than the existing capacity case (Fig. 3), which would lead to lower UF. The competition between power plants, which is measured by the percent of power plants that occupy a grid cell with at least one other power plant, is similar between most capacity retirement cases and the existing capacity case (∼97%, Table S3 of the ESI†). The retirement 2010 case also has low water availability (Fig. 3), but lower competition than the existing capacity case (∼94%, Table S3 of the ESI†), which implies that there is more available water for each individual power plant. The retirement 2020 case has very low water availability (Fig. 3).
Compared to the existing capacity case, the regional transformation-1.5 °C case have lower UF, while the regional transformation-2 °C and -3 °C cases have similar UF. Due to the use of CCS in the regional transformation-1.5 °C and -2 °C cases, their regional average water withdrawal intensity of the power plants are considerably higher than the other capacity expansion cases (Table S4 of the ESI†), which implies lower regional average UF and is likely the main reason why the regional transformation-1.5 °C case has lower UF. On the other hand, all three regional transformation cases have much lower competition between the power plants (72–88%, Table S3 of the ESI†) than the existing capacity case, which implies higher regional average UF. The direction of the effect of local water availability on the regional transformation cases is ambiguous, because there are more power plants in the grid cells with streamflow at the ends of the distributions (very low and very high), and fewer in the grid cells with streamflow between the extremes, than the existing capacity case (Fig. 3). But the regional transformation-2 °C and -3 °C cases have more power plants in the grid cells with high streamflow than the regional transformation-1.5 °C case (Fig. 3), which explains the higher regional UF of the former two cases than the last one.
3.3 Spatial and temporal distribution of the impacts of climate change and capacity expansion
The following sections explore the future changes in UF for the BAU cooling system choice, and the existing capacity, expanded capacity, retirement 2020, and regional transformation cases of capacity expansion in more detail. We focused on these cases due to a few reasons. The BAU case for cooling system choice considers existing cooling system choices. The case has the highest regional UF because of the wide use of ocean cooling near the coastlines and some use of dry cooling in land, although we did not consider the effects of climate change on coastal ocean water temperatures. The existing capacity, expanded capacity, and retirement 2020 cases serve as references that reflect, respectively, the pure effect of climate change, the compound effect of climate change and partial shift in power plant locations (i.e. from existing to existing + planned), and the compound effect of climate change and complete shift in power plant locations (i.e. from existing to planned). The regional transformation cases explore the potential effects of carbon emission mitigation policies. It should be emphasized that the spatial distribution of power plants in the regional transformation cases only consider the influences of age and water availability on siting, which are consistent with past literature but do not capture the full range of siting factors.73 Therefore, these cases illustrate the influence of considering these siting factors in capacity expansion and the deployment of CO2 capture on UF, but are not intended to represent likely future distribution of coal-fired power plants.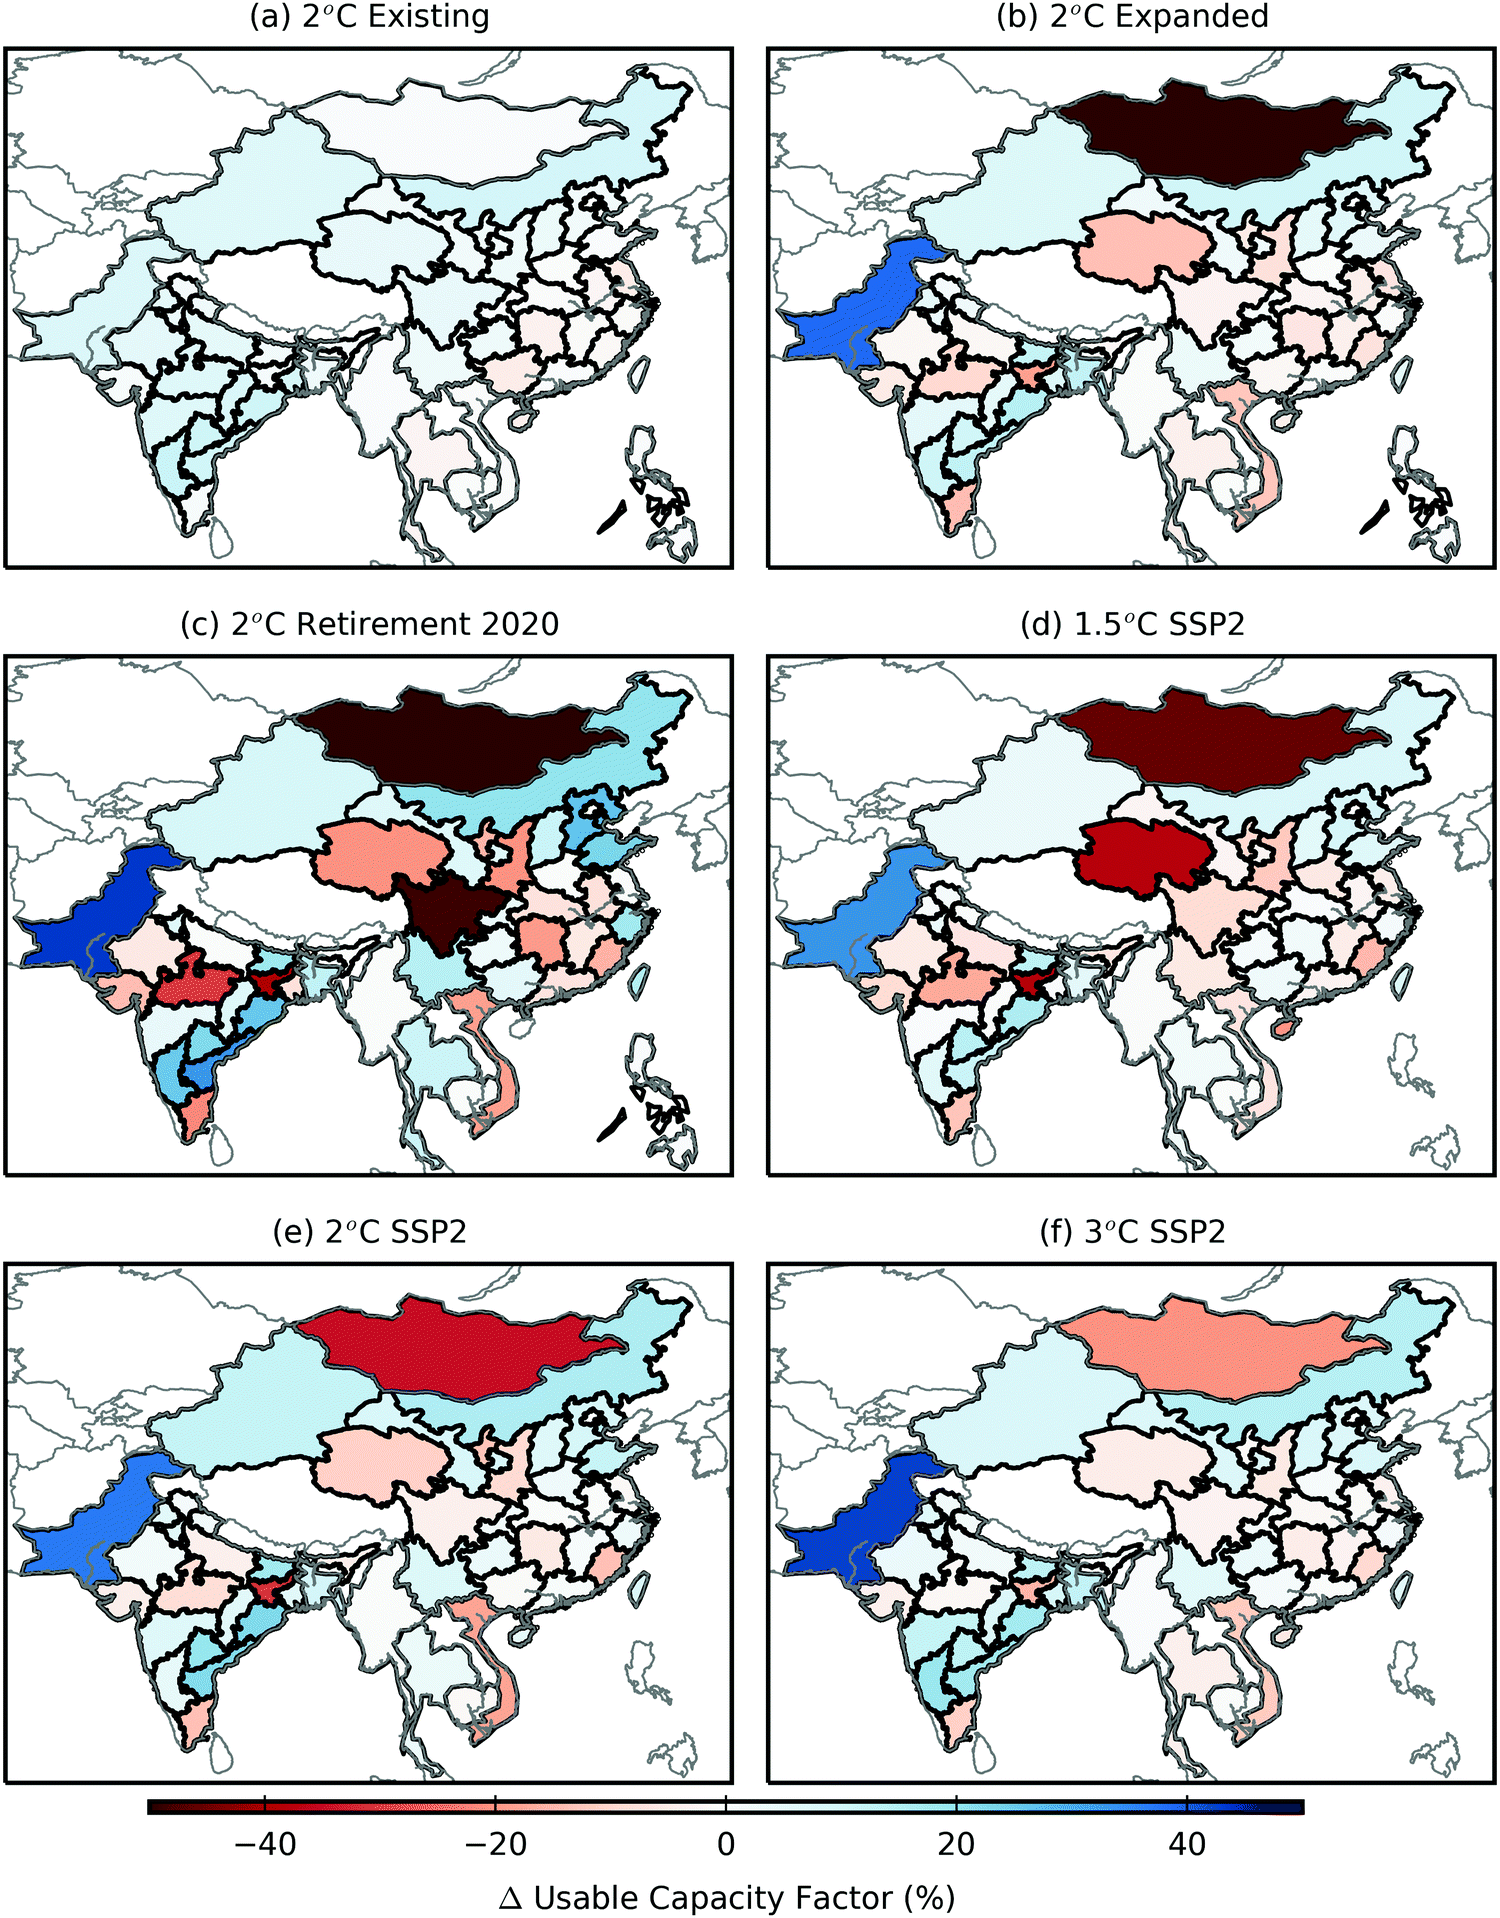 | ||
| Fig. 4 Average changes in the annual average usable capacity factors (UF) from the historical baseline (1961–1990, the existing capacity case) to selected climate change scenarios and cases of capacity expansion. “Average”: the values displayed in the maps are based on the average of the state-level (India), province-level (China), or country-level (the other Asian countries) UF's across the GCMs and (for the regional transformation cases of capacity expansion) random samples. | ||
Changes in the power generation fleet in other cases of capacity expansion lead to considerable changes in the annual average UF's, and in many places the effects outweigh the impact of climate change on annual average UF's (Fig. 4b–f). The broad spatial patterns in Fig. 4b–f are similar: decreases in the UF in Mongolia, central to southeastern China, Southeast Asia, northern India, and southernmost India, and increases in the UF in northern China, Pakistan, and central India. The historical annual average UF is lower in eastern China than the other parts of China (Fig. S10 of the ESI†), and the results in Fig. 4 suggest that the combination of climate change and capacity expansion will further decrease this low UF. In Pakistan where the historical UF is low (Fig. S10 of the ESI†), climate change and capacity expansion will increase the low UF. Although Fig. 4 mostly shows the results of the 2 °C climate change scenario, the signs and magnitudes of the results for the 1.5 °C and 3 °C climate change scenarios are nearly the same (Fig. S13 of the ESI†). The two additional capacity retirement cases shown in Fig. S13 of the ESI† also confirm that the capacity expansion and retirement 2020 cases are generally representative of the changes in the UF for all the capacity retirement cases.
The similarity in spatial patterns between the capacity expansion and regional transformation cases, and the retirement 2020 case in Fig. 4 suggest that the difference in local water availability between the existing and planned power plants (Fig. 3) plays a dominant role in the changes in UF at administrative unit-levels. As in the changes at the regional level (Section S3.2), the various differences between Fig. 4b–f are due to competition by power plants for water, the local availability of that water, and the intensities of withdrawal of that water. In the capacity expansion case, various power plants have a lower UF than they would if only the existing or planned power plants operate in the region (Fig. 5a and Fig. S14a of the ESI†). In all three of the regional transformation cases, some power plants have lower UF than if only the existing or planned power plants operate in the region, but some have higher UF (Fig. 5b, c and Fig. S14b and c of the ESI†). The higher UF runs counter to the increase in water intensity due to the use of CO2 capture, or to the higher installed capacities that the regional transformation cases usually have in each administrative unit than the retirement 2020 cases (Table S1 of the ESI†). Therefore, the higher UF is likely attributable to the random sampling approach that was used to create the regional transformation cases, which leads to a more spatially-diverse expansion plan compared to the age-based retirement scenario. Geographic diversification decreases the competition by power plants for the local water (Table S3 of the ESI†), and reduces the aggregate effects of temporal streamflow variability across the study region. Importantly, the benefits of geographic diversification are only realized through the integration of regional electricity markets.
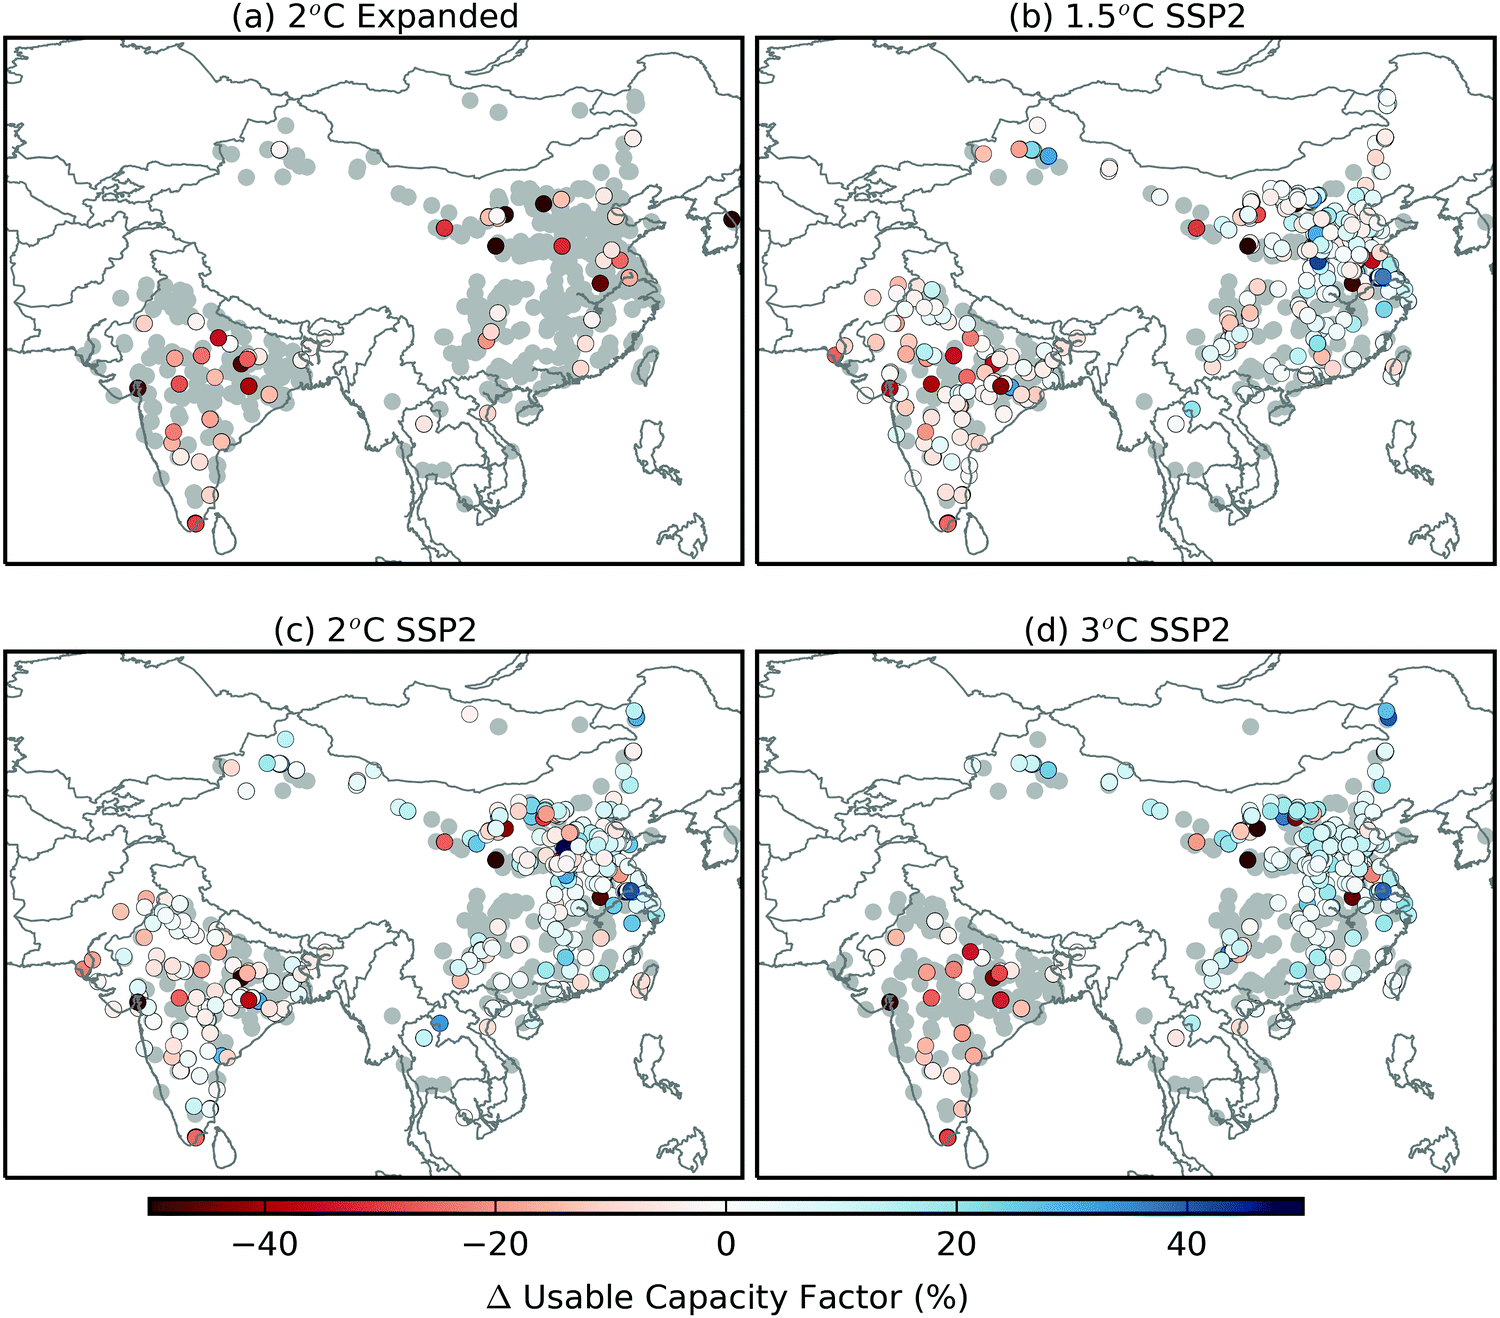 | ||
| Fig. 5 Changes in the usable capacity factors of individual coal-fired power plants that are in the existing fleet between the historical baseline (1961–1990, the existing case) and selected future climate scenarios and cases of capacity expansion. Gray dots indicate where the changes are within ±1% of the nameplate capacity. The values are averages across the GCMs and (for the regional transformation cases of capacity expansion) random samples. | ||
The power-grid level UF's have substantial changes and seasonal variations for some regional grids (North China, East Region India, South Region India, Vietnam), and inconsistent changes between the GCMs and cases of capacity expansion for other regional grids (Central China, Northwest China, East China, North Region India, West Region India, North East Region India) (Fig. 6). In the North China grid, the largest positive changes occur in summer in the existing capacity case, but occurs in winter in the capacity retirement 2020 case. This contrast suggests that the existing and planned power plants in the North China grid have such spatial separation as to cause them to experience different climate change signals. The power-grid level changes in UF smooth out some local variability at administrative unit-level. For example, although the South Region India grid generally has positive changes in UF, the southernmost state of India has negative changes in UF (Fig. 4). This cancellation of negative changes suggests that regional electricity market integration can reduce the vulnerability of electricity supply to water scarcity. Still, the negative changes in UF at administrative unit-level persists into the power-grid level in the East China grid, and small countries like Vietnam may not have enough sub-national variability in climatic conditions to balance out local negative changes (Fig. 4 and 6). If all the power plants in the study region are inter-connected, the resulting regional-level changes in monthly UF are positive for all the climate change scenarios and cases of capacity expansions in Fig. 6.
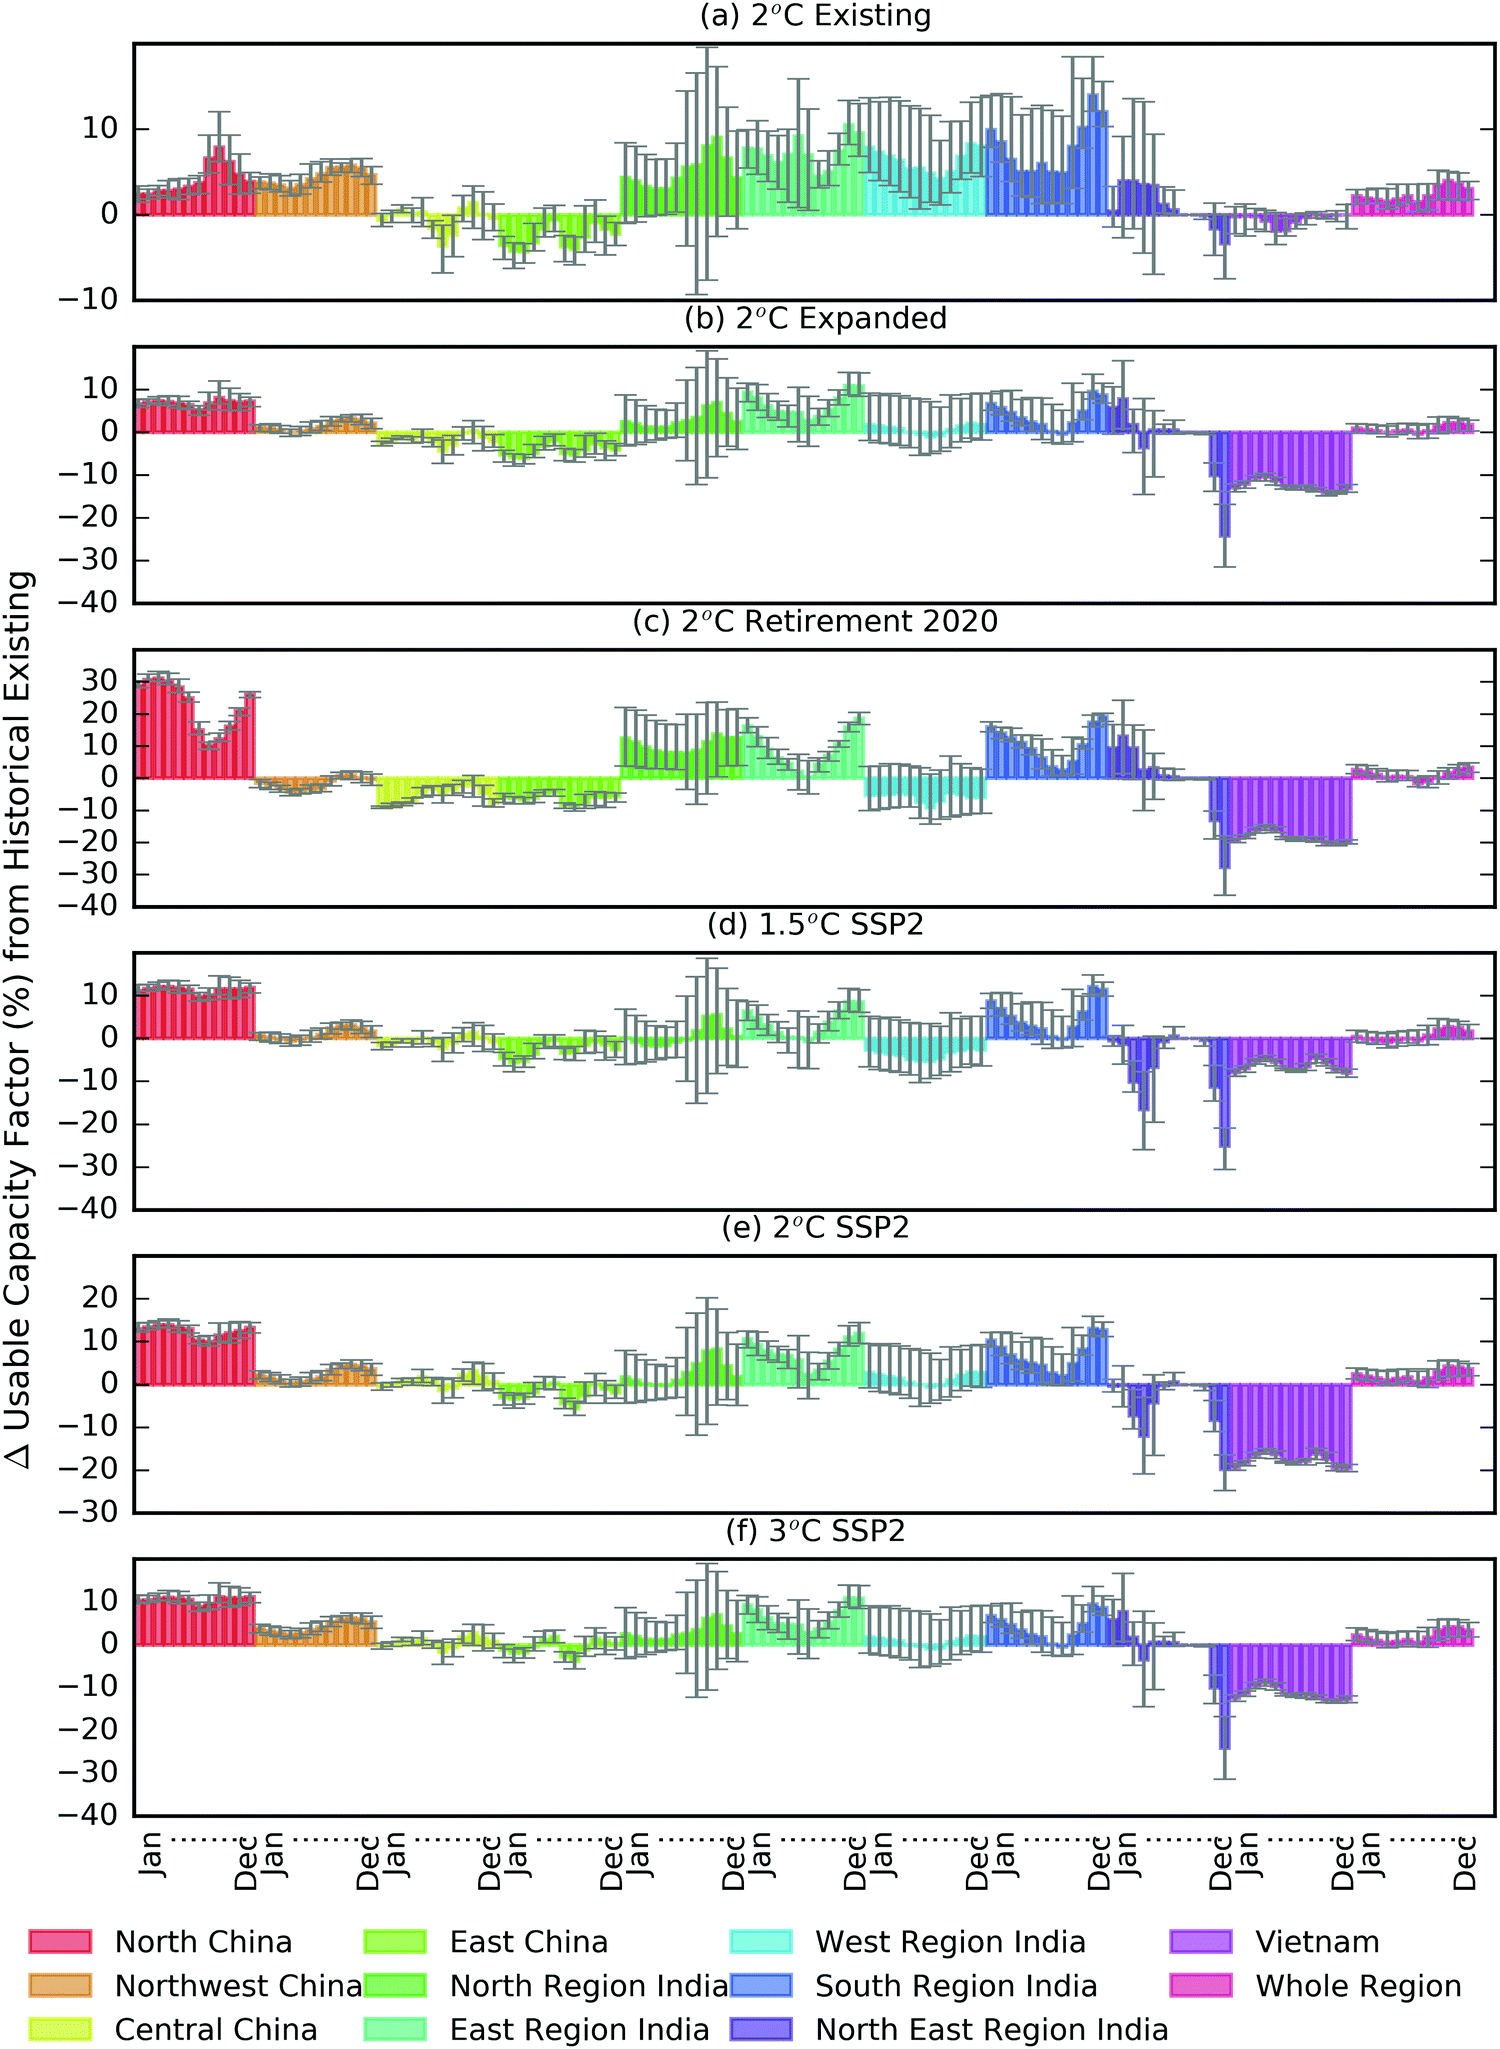 | ||
| Fig. 6 Monthly variations in the changes in usable capacity factor at power grid level between the existing capacity case under historical conditions and various cases of capacity expansion under the 2 °C scenario of climate change: (a) the existing capacity case; (b) the expanded capacity case; (c) the capacity retirement 2020 case; (d) the regional transformation 1.5 °C case; (e) the regional transformation 2 °C case; (f) the regional transformation 3 °C case. The whiskers show the maximum and minimum across the GCMs. | ||
Considerable day-to-day variability exists in power-grid level UF, and the changes in the probability distributions of daily UF (hereafter referred to as the pdf) provide information that may not be present in the changes in the mean UF (Fig. 7). For example, in the Northwest China power grid, the monthly mean UF of all the cases of capacity expansion increase compared to the historical baseline (Fig. 6), but both the mode of the pdf of the capacity retirement 2020 case and the left tail of the pdf of the regional transformation 1.5 °C case shift left, suggesting a greater possibility of water shortage for power generation (Fig. 7). Similar situations exist for the Central China, East Region India, West Region India, and South Region India grids, where the mean changes are insignificant or positive in various cases of capacity expansion, but changes in the mode or left tail of the pdf of the same cases are negative (Fig. 7).
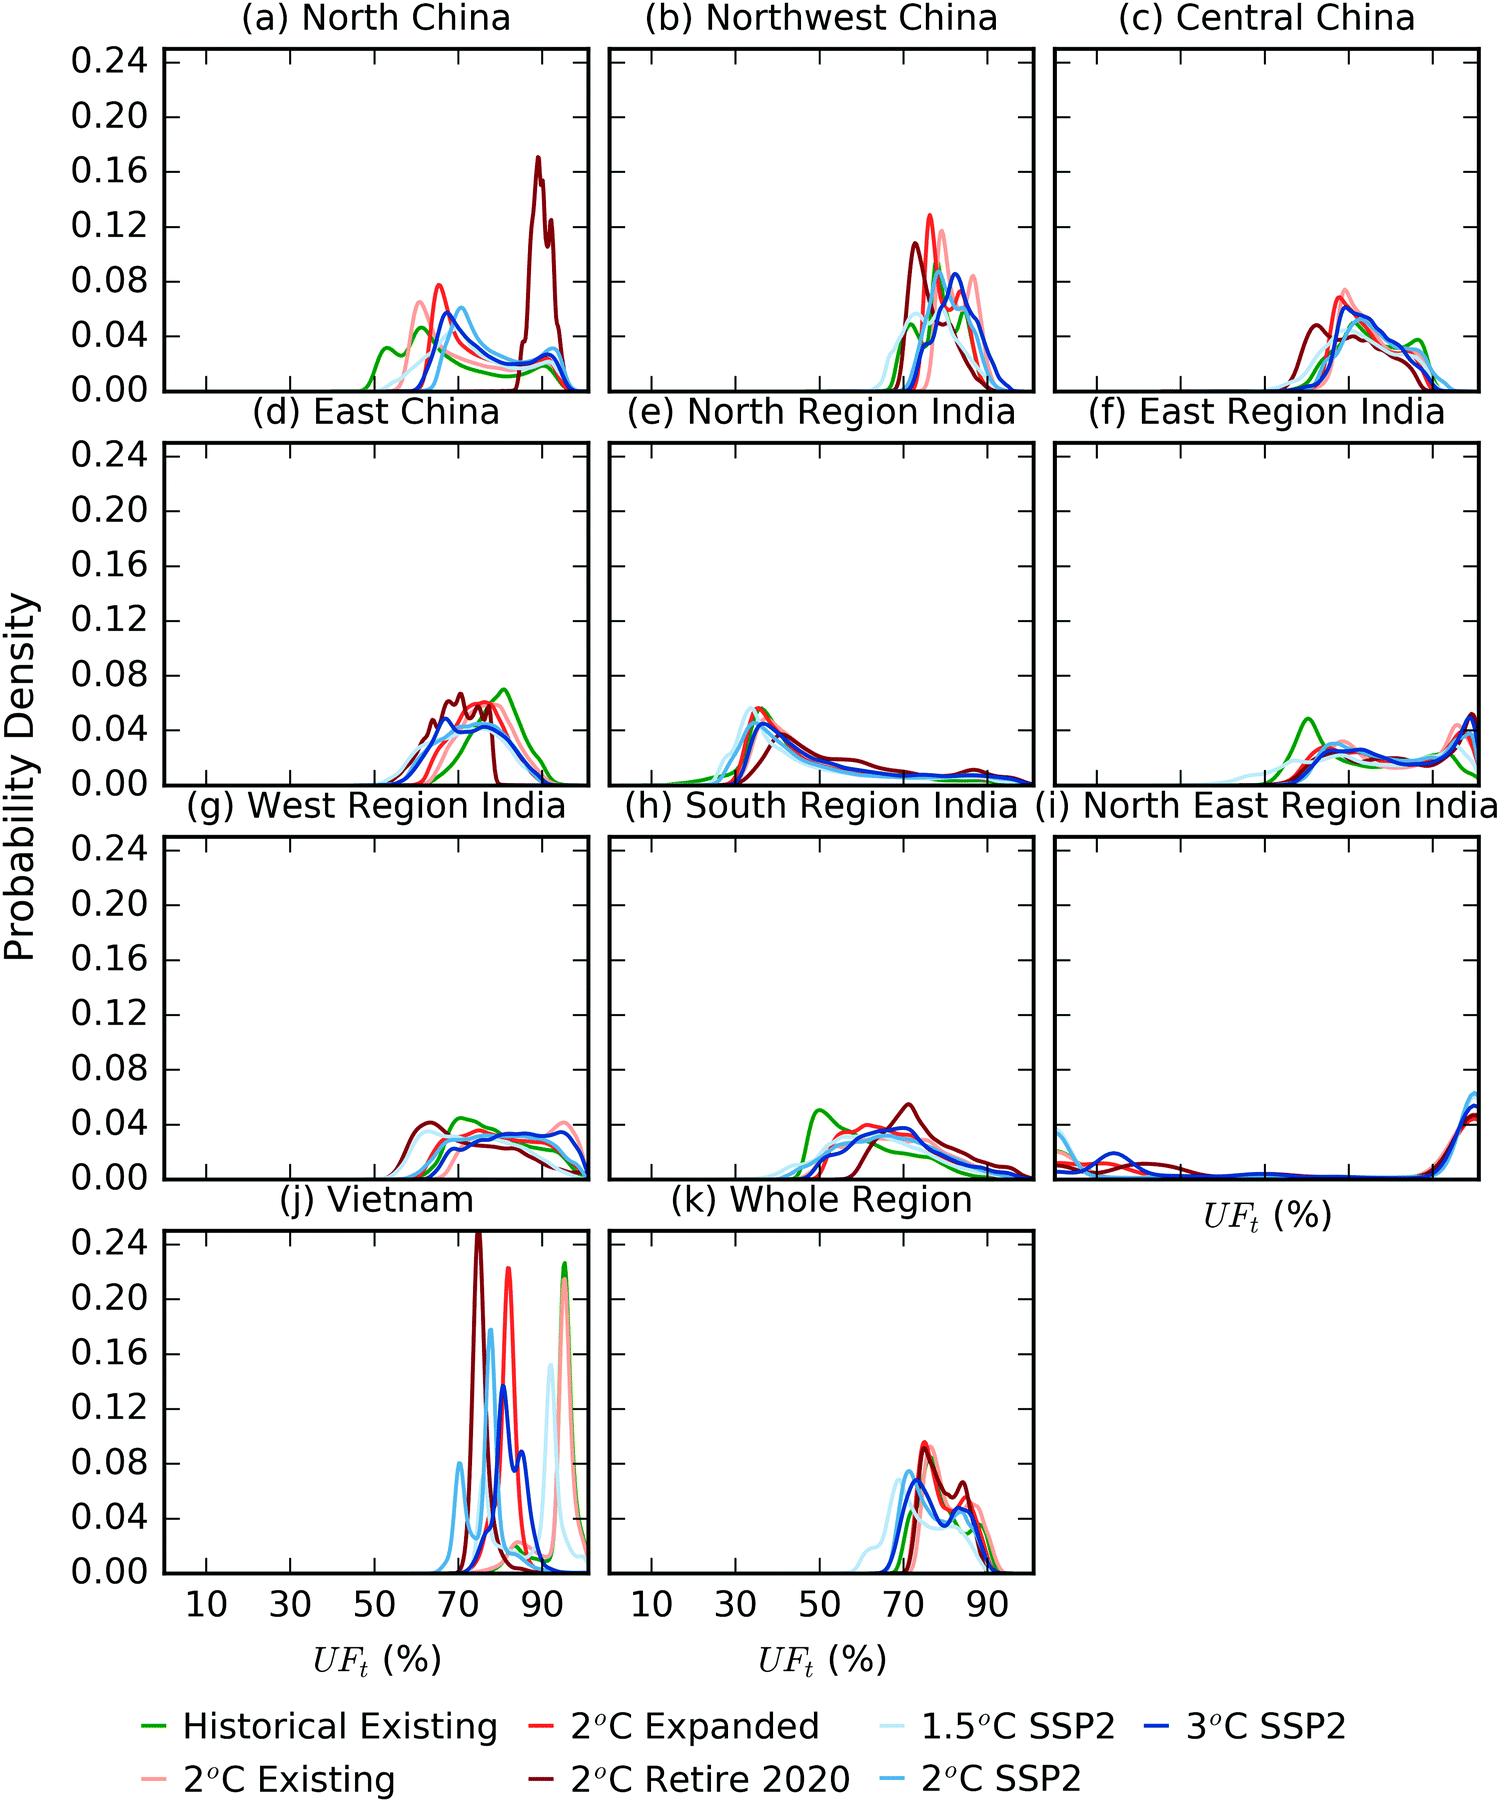 | ||
| Fig. 7 Probability distributions of daily usable capacity factor (UF) at the power grid level. The probability density distributions were pooled over the five GCMs and (for the regional transformation cases of capacity expansion) random samples for each power grid, scenario of climate change, and case of capacity expansion. The displayed probability density distributions were smoothed by kernel density estimation for better readability. | ||
The regional transformation cases do not necessarily have systematically lower daily UF than the existing capacity, expanded capacity, and capacity retirement cases (red colors). The modes of the regional transformation cases (blue colors) are generally in-between or similar to the latter three cases (red colors) (Fig. 7). The regional transformation cases also have left tails that are in-between or similar to the latter three cases in some of the power grids (Fig. 7). But in the Central China, East China, East Region India, and South Region India grids, the regional transformation 1.5 °C case has the heaviest left tail among all the displayed cases, which suggests the highest possibility of water shortage (Fig. 7). The regional transformation 2 °C has the heaviest left tail among all the displayed cases in Vietnam (Fig. 7). These phenomena suggest that using CO2 capture has some negative impact on the water availability for power supply, but the negative impact is not universal. At the regional level, the regional transformation cases have higher possibilities of water shortage than the other cases of capacity expansion (Fig. 7k and 6), but the possibilities of water shortage are generally smaller at the regional level than the individual power grids.
3.4 Adaptation to climate change through cooling system changes
In our results, the power plants that switch from once-through cooling to wet cooling towers are mainly near the Yangtze River, while the power plants that switch from wet cooling towers are in northern China and throughout India (Fig. S16, ESI†). Switching to wet cooling towers and to dry cooling can increase the UC and UF of the power plants: (1) directly for those that switch, and (2) indirectly for those that are near the plants that switch, because there is less competition for water. In our results, the indirect effects are negligible (Fig. 8 and Fig. S17, S18 of the ESI†), although this may be because our study allocates the available water proportional to the nameplate capacities of the plants in a grid cell. Plants that share a grid cell and have the same cooling system in the BAU case will have identical UF's, so that all or none will switch their cooling systems in the adaptation case based on our criteria (see Section S2.5).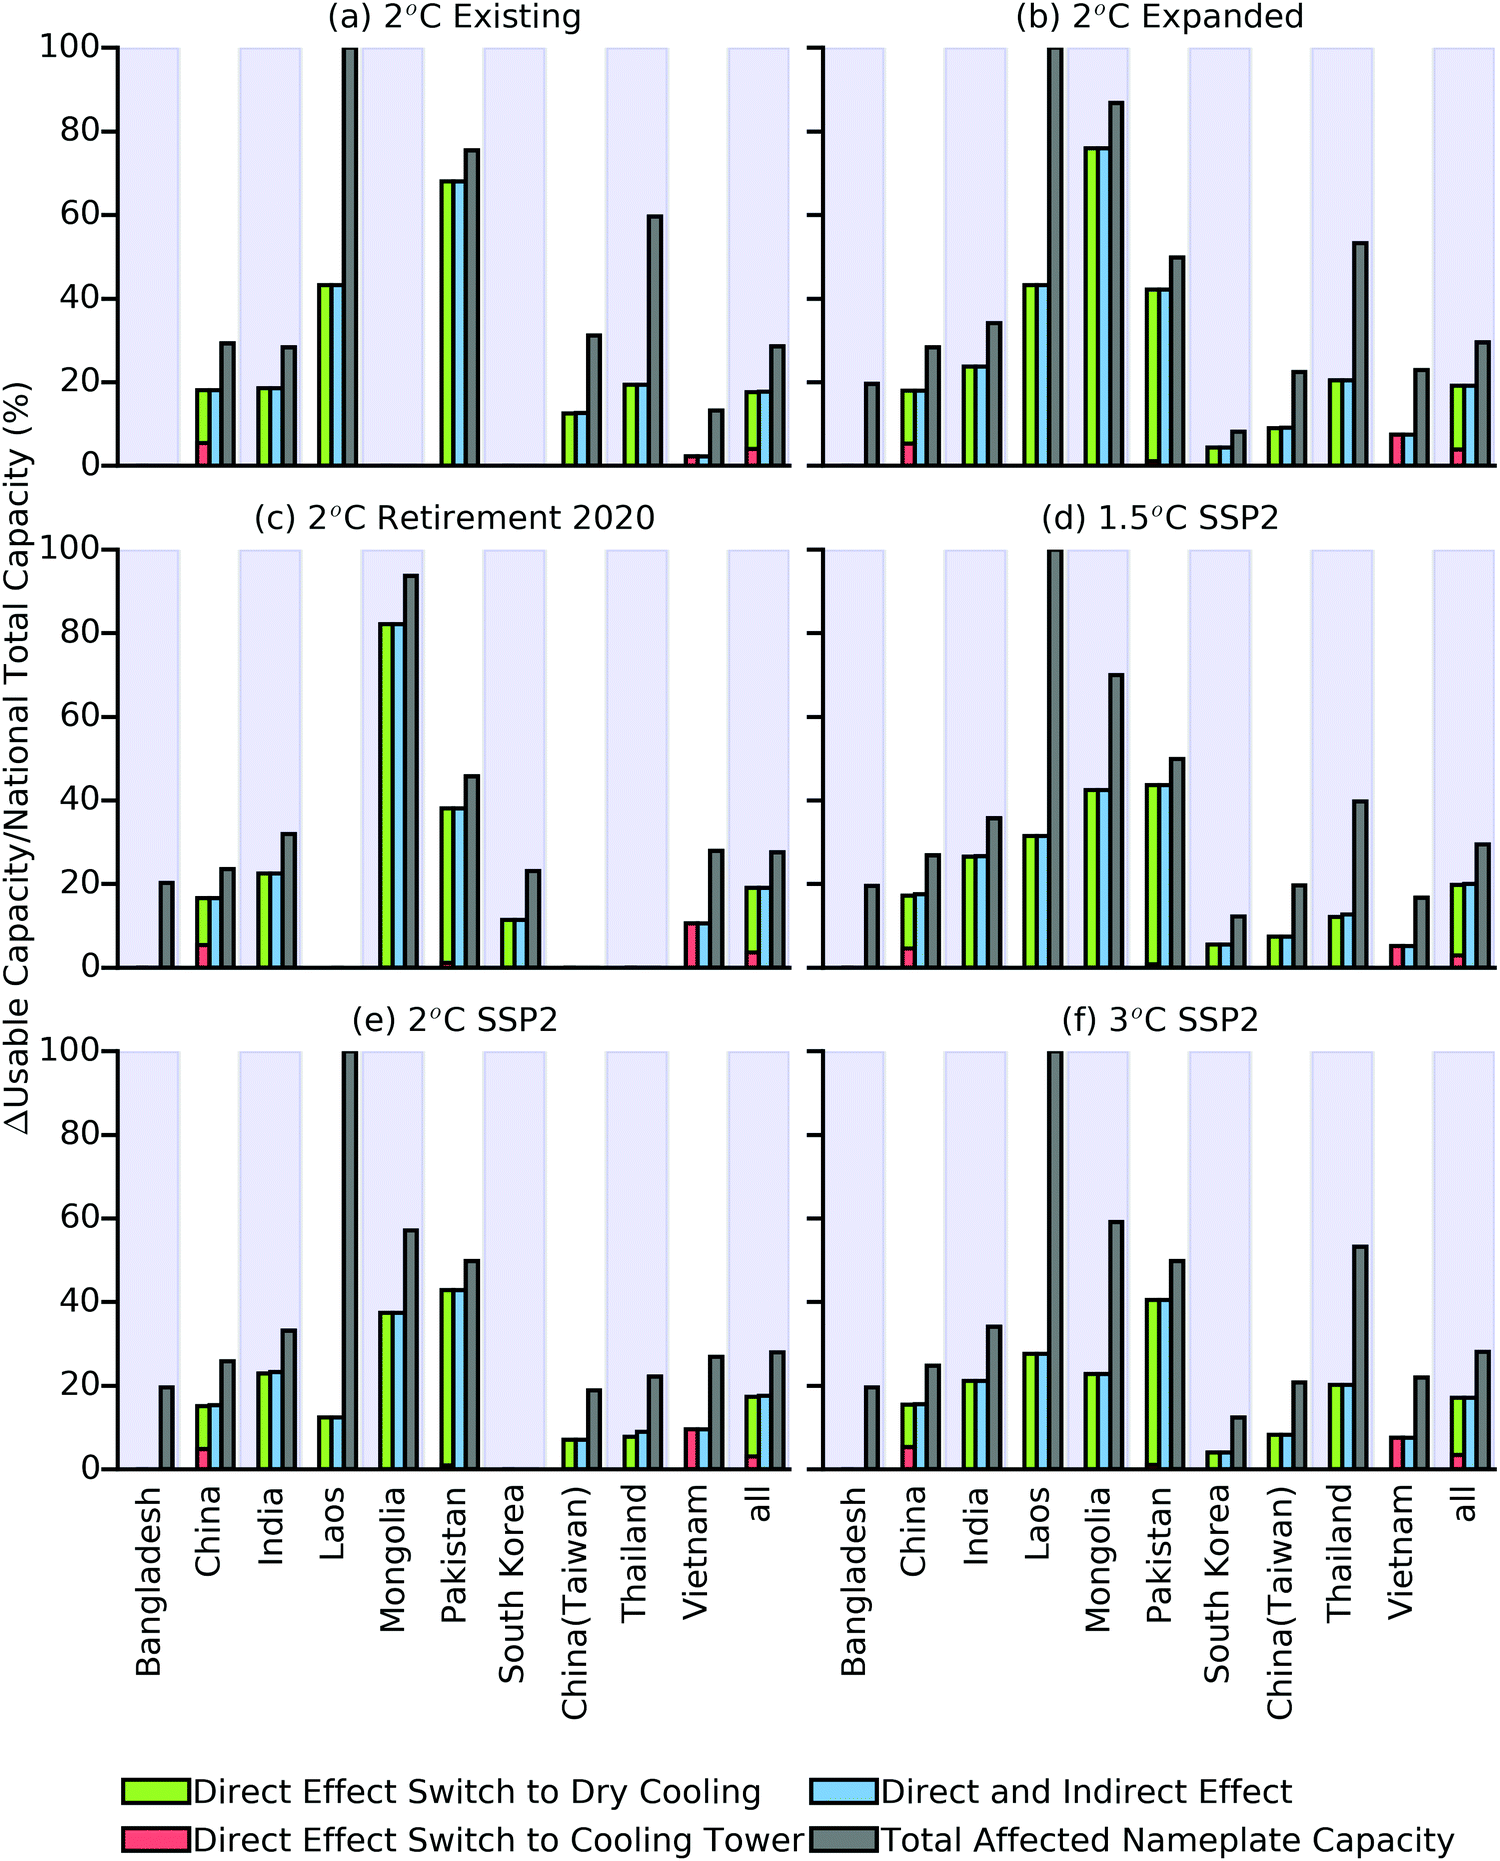 | ||
| Fig. 8 Effects of switching to wet cooling tower and dry cooling systems on the national-level UC. | ||
The total increases in UC from the BAU case to the adaptation case are broadly proportional to the total nameplate capacity of the power plants that switch (i.e. “total affected nameplate capacity” in Fig. 8). About 25% of the total capacity in the study region switches to less water-dependent cooling systems, and the total increase in UC amounts to nearly 20% of the total capacity (Fig. 8 and Fig. S17, S18, ESI†). The total affected capacity comprise a higher portion of the total regional capacity in the existing capacity, expanded capacity, and retirement 2020 cases than in the regional transformation cases, which suggests that the former three cases are more constrained by water availability than the regional transformation cases. For the power plants that switch cooling systems, the increase in UC is highest for China, India, Mongolia, and Pakistan, lower for Laos, Thailand, Vietnam, Taiwan, and South Korea, and negligible for Bangladesh, which implies different levels of benefit per unit investment on dry cooling.
The changes in national UF from the BAU to the adaptation case of cooling system choice (Fig. 8 and Fig. S17, S18, ESI†) suggest that wider use of dry cooling can have considerable benefit on the reliability of electricity supply of some countries in the study region. But dry cooling also induces an energy penalty due to higher turbine backpressure than in cooling systems that use water.77 Here, we measured the energy penalty using the relative loss in thermal efficiency (%) if a power plant switches from wet cooling tower to dry cooling. Based on the projected air temperature under 2 °C warming, the estimated losses in thermal efficiency in western India and Pakistan are more than 12% on annual average and 15–20% in the summer. These losses are only slightly lower under 1.5 °C warming and slightly higher under 3 °C warming (Fig. 9).
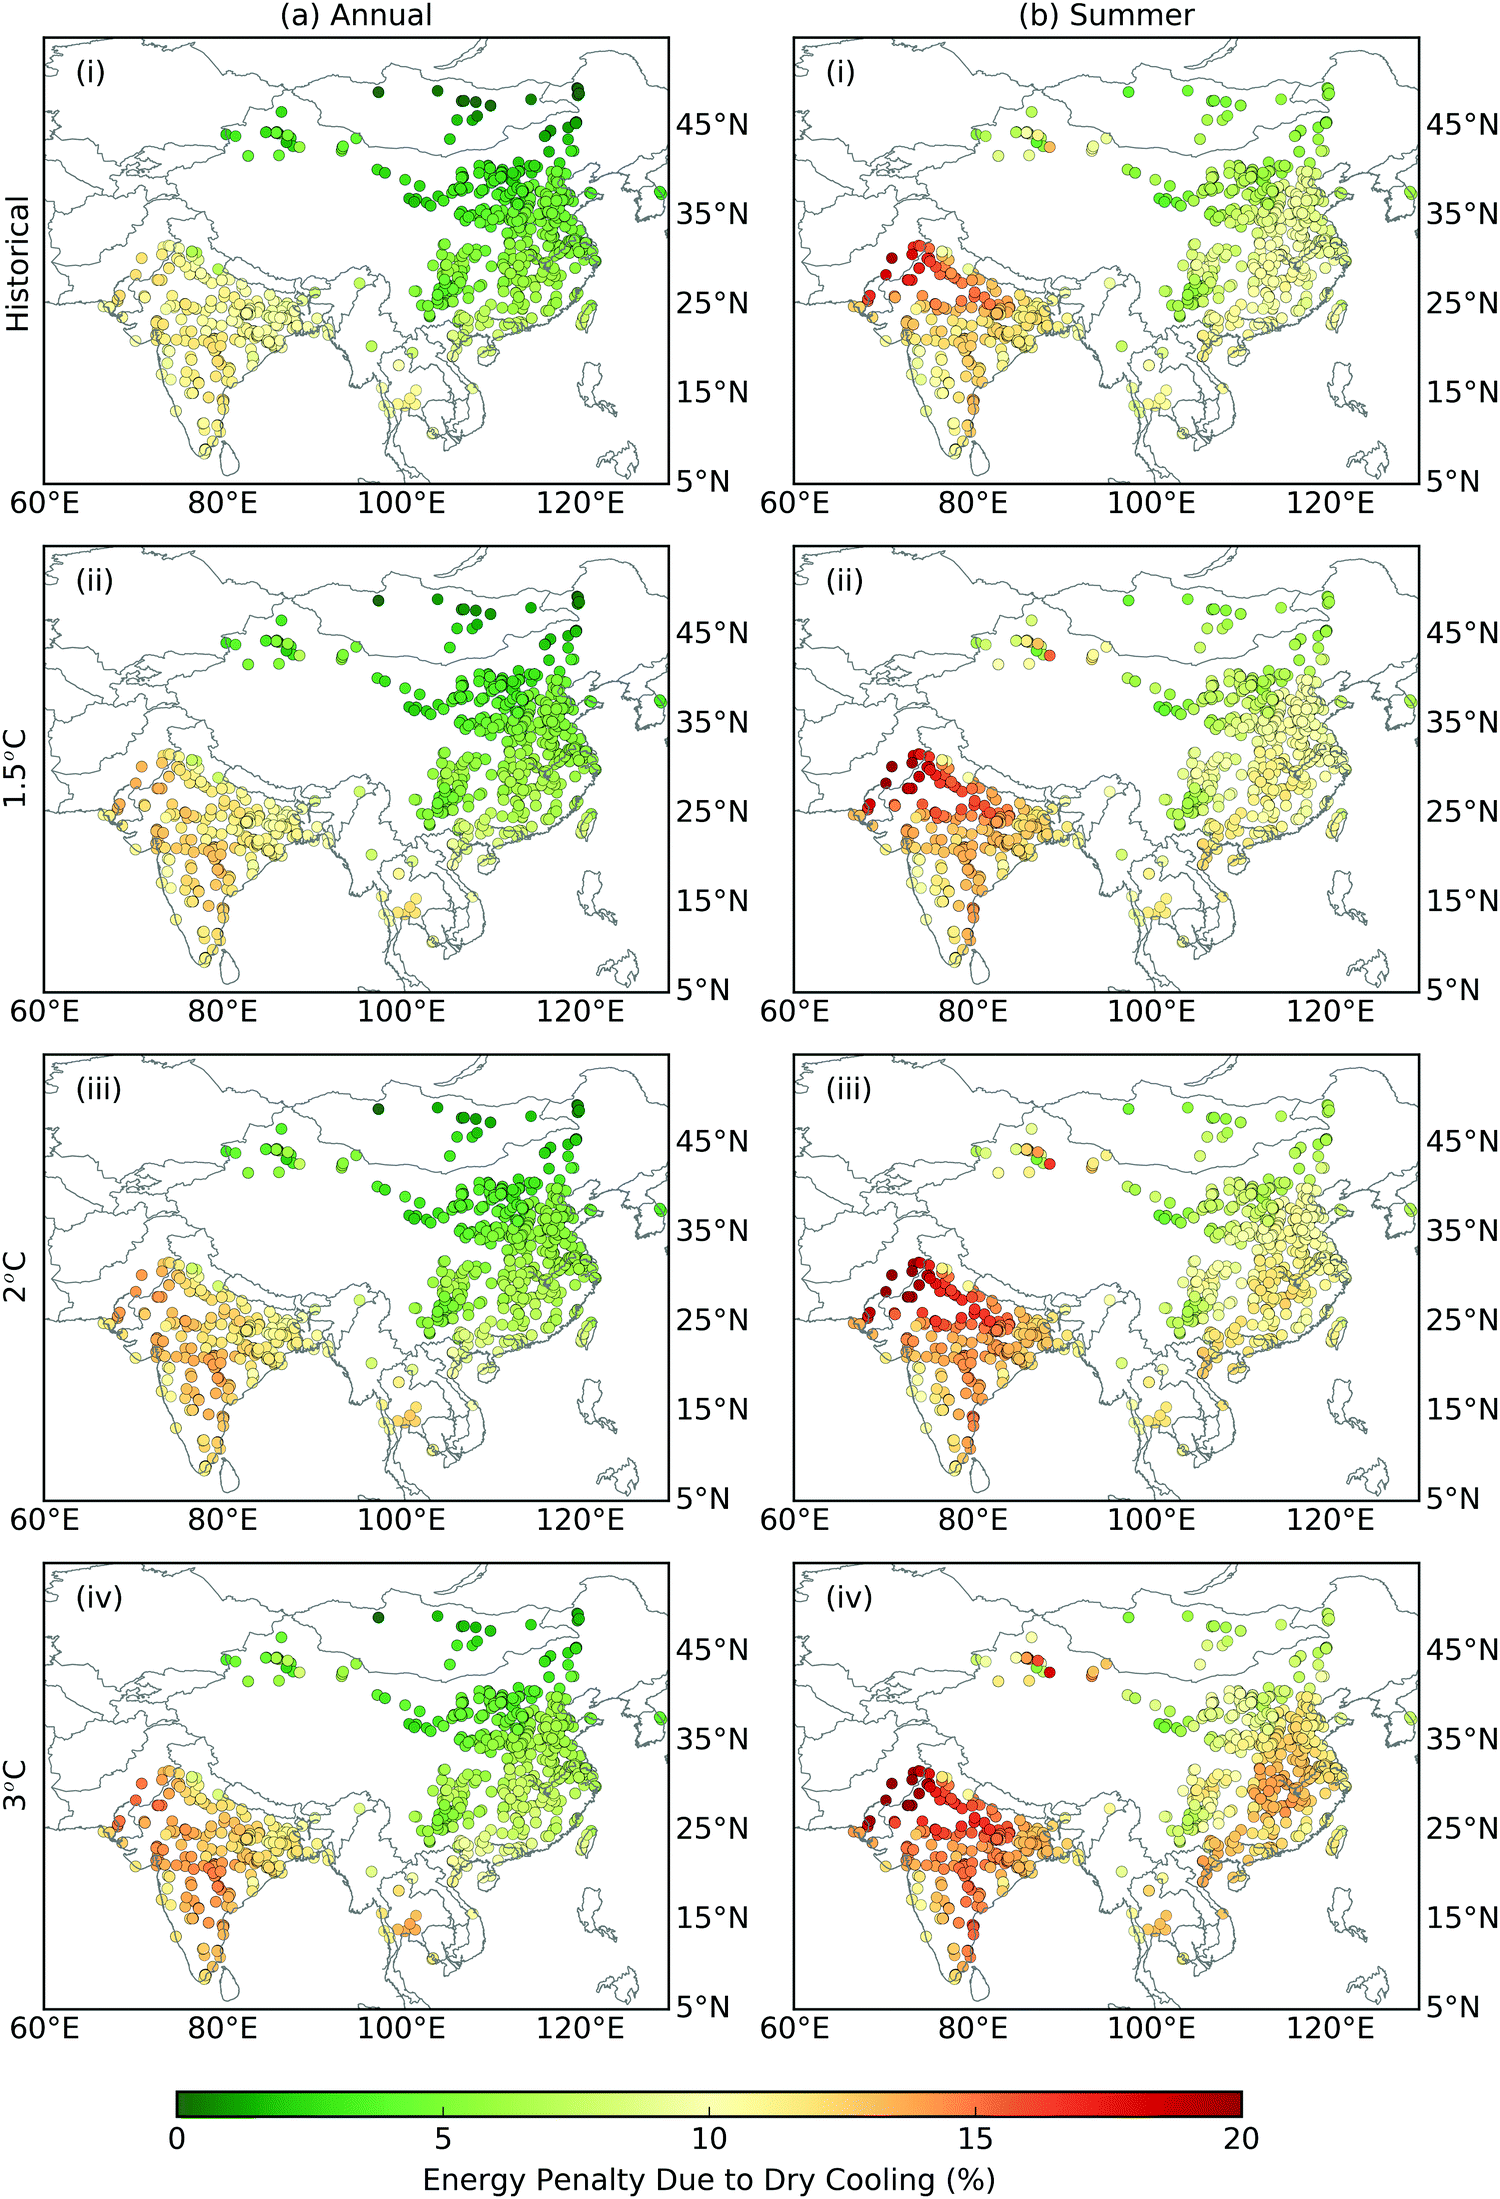 | ||
| Fig. 9 The spatial distribution of annual average and summer average dry cooling penalty at all the existing and planned power plants and for all the climate scenarios. The energy penalties are averaged over the GCMs. | ||
The regional average decrease in thermal efficiency at the power plants that switch to dry cooling under the adaptation case is significant (7.71% to 9.65%, Table 3). Consistent with the general spatial distribution of the losses in thermal efficiency (Fig. 9), the highest losses occur in India (11.79% to 12.92%), Pakistan (12.82% to 15.13%), and Thailand (10.86% to 12.10%), while the lowest losses occur in Mongolia (0.74% to 3.29%) (Table 3). The high decreases in thermal efficiency suggest that adaptation to dry cooling may challenge the economic feasibility of dry-cooled coal-fired power plants for India, Pakistan, and Thailand, while also increasing CO2 emissions. On the other hand, dry cooling can be valuable for securing power supply under low water availability in Mongolia, northern China, and South Korea.
| Unit: % | Country | 2 °C existing | 2 °C expanded | 2 °C retirement 2010 | 1.5 °C SSP2 | 2 °C SSP2 | 3 °C SSP2 |
|---|---|---|---|---|---|---|---|
| Annual | All | 7.28 | 7.71 | 8.11 | 8.13 | 8.91 | 9.65 |
| China | 4.86 | 4.75 | 4.41 | 4.47 | 4.73 | 5.43 | |
| India | 12.38 | 12.37 | 12.36 | 11.79 | 12.26 | 12.92 | |
| Laos | 8.96 | 8.96 | 8.96 | 8.62 | 8.96 | 9.77 | |
| Mongolia | — | 1.89 | 1.89 | 0.74 | 2.70 | 3.29 | |
| Pakistan | 13.41 | 13.42 | 13.42 | 12.82 | 13.42 | 15.13 | |
| South Korea | — | 3.70 | 3.70 | 3.49 | — | 4.12 | |
| Taiwan | 8.84 | 8.84 | — | 8.55 | 8.83 | 9.23 | |
| Thailand | 11.27 | 11.27 | — | 10.86 | 11.27 | 12.10 | |
| Summer | All | 11.20 | 11.41 | 11.70 | 11.45 | 12.29 | 13.11 |
| China | 9.69 | 9.53 | 9.25 | 9.02 | 9.44 | 10.78 | |
| India | 14.48 | 14.42 | 14.45 | 13.73 | 14.36 | 14.93 | |
| Laos | 9.88 | 9.88 | 9.88 | 9.53 | 9.88 | 10.72 | |
| Mongolia | — | 6.81 | 6.81 | 5.45 | 7.72 | 8.66 | |
| Pakistan | 20.65 | 18.59 | 18.59 | 17.80 | 18.59 | 20.66 | |
| South Korea | — | 6.96 | 6.96 | 6.68 | — | 7.68 | |
| Taiwan | 11.14 | 11.14 | — | 10.88 | 11.15 | 11.56 | |
| Thailand | 11.44 | 11.44 | — | 11.11 | 11.44 | 12.36 | |
4 Discussion and conclusions
Growing populations and economies engender more demand for electricity and stress on water resources. Planning for the future thermal generation capacity requires reliable water resources. We investigated the impacts of climate change, the addition and retirement of coal-fired power plants under different age-based and climate change mitigation scenarios, and different cooling system choices on the usable capacity (UC) and usable capacity factor (UF) of coal power production in Developing Asia. The main findings are:(1) If the use of dry cooling remains at present-day levels, the planned expansion of coal-fired power plants in Developing Asia will increase the regional UC, which increases the amount of electricity that can be supplied. But this capacity expansion also decreases the UF, which implies more severe water constraints on electricity generation. Wide deployment of CCS for achieving the 1.5 °C and 2 °C climate goals have small impacts on regional annual or monthly mean UF, but leads to higher probability of low regional average UF on the daily time scale. Climate change will lead to slight increases and decreases in streamflow that also affect UC and UF, but the impacts are smaller than capacity expansion.
(2) Location choices of individual coal-fired power plants can affect the UF at aggregated spatial levels, because of the uneven distribution of local streamflow and the competition between the power plants for local water. In some parts of the study region, the cases of capacity expansion that use CO2 capture have similar or even higher annual average UF than the cases that do not. This counterintuitive result is because the cases that use CO2 capture explore diverse deployment patterns that favor locations with higher water availability, whereas the cases that do not use CO2 capture use simple age-based retirement. Nonetheless, CO2 capture increases the possibility of water shortage for coal-fired electricity generation on the daily time scale.
(3) At administrative-unit level (provinces for China, states for India, and countries elsewhere), regions that expect the most negative impact from climate change and capacity expansion are Mongolia (20–74% decreases in UF), central China (up to 74%), Southeast Asia (up to 65% decreases), central India (up to 40% decreases), southeastern China (up to 20% decreases), and southern India (11–14% decreases) (Fig. 4).
(4) At power-grid level (covering 1–7 administrative units), the changes in UF tend to be less negative than the changes at individual administrative units within the grid-region, because local positive and negative changes cancel out each other. Considerable seasonal and day-to-day variability exist in the UF at power-grid level. It is possible for a case of capacity expansion to lead to higher annual and monthly mean UF than the historical baseline, and yet higher probability of low UF at the daily time scale, for the same power grid.
(5) Wider deployment of dry cooling can considerably increase the UC and UF within the study region. But dry cooling has high energy penalty in South Asia, which can challenge its economic feasibility and counteract future efforts to reduce CO2 emissions.
Our findings advance understanding of the global energy-water nexus in a few ways. First, past studies that consider capacity expansion are often at coarse spatial scales and annual level,29–31,37,41,43–46 but this study shows that water constraints on thermal power generation have considerable spatial and temporal variability, and that the variability at finer spatial scales can affect water constraints at coarser spatial scales. One case illustrated in this study is the deployment of CO2 for CCS. When one assumes that water availability is uniform in a large region, wider use of CO2 capture naturally increases water constraints on thermal power generation due to higher water requirements.13,43,45,46 But when one considers local variability, wider use of CO2 capture at water-abundant locations may not increase the regional water constraint on thermal power generation, whereas wider deployment at water-scarce locations will. Second, the finding that climate change has mixed impacts on UC and UF in Developing Asia contrasts with past findings for Europe and United States, where the impacts of climate change are likely negative.9–12,78 This contrast is partly due to regional differences in the impacts of climate change on the hydrological cycle. The increases in streamflow in South Asia and large parts of East Asia are consistent with the expected increase in Monsoon rainfall under global warming,79,80 and may also reflect some influences from increased glacier melt.81 Another potential reason for the contrast is that human-related withdrawals (i.e. irrigation, industrial, municipal) are expected to increase substantially in Asia in the future and will lead to lower streamflow.82 Third, some previous studies have noted that the shift in thermal power plants towards the more water-scarce west in China will have negative effect on water resources.30,42 This study provides a similar finding for the broader Developing Asia – the planned power plants tend to be located at more water-scarce locations than the existing power plants, for the broader Developing Asia, and quantitatively explores the potential effects of this shift under diverse scenarios of climate change and cases of capacity expansion.
Our findings also have implications for future studies on energy systems modeling and for energy planning in Developing Asia. Current optimization studies on power systems or energy planning rarely consider changes in nameplate capacity at high spatial resolution.44–46 Model development activities toward higher spatio-temporal resolutions may reveal new synergistic pathways for joint water management, energy planning, and CO2 emissions mitigation. Although some water-saving policies already exist for the electricity sector in China and India,19,83 our findings suggest that policy makers can achieve more sustainable short-term and long-term power planning by considering the abundance of, and competition for, local water resources in the dispatch of electricity, the approval of new power plants, use of CO2 capture, and the management of regional transmission corridors. Economic concerns may incentivize the building of large CCS clusters where power plants share CO2 compression and transport infrastructure,13 but large clusters will also lead to high local water demands by the power plants. Thus, it will be important to consider the cost-water availability trade-off in designing CCS networks. As the electricity market becomes more integrated in Asia,84 regional cooperation in the electricity markets may provide opportunities to reduce the vulnerability of thermal power generation to water constraints. This study shows that pooling together the coal-fired power plants for the whole region results in positive changes in UF for the different cases of capacity expansion in general, and reduces the temporal variability in UF, thus reducing the possibility of water shortages for power generation. Although past studies have noted that dry cooling is a potential option to de-couple electricity generation from water availability,11,83 this studies shows that dry cooling may lead to high losses in thermal efficiency, equivalent to 12–15% of the generated electricity, in South Asia due to higher air temperatures and humidity.
Finally, we note a few opportunities for future investigations that build upon this work. Although we designed the regional transformation scenarios by downscaling from regional energy pathways that lead to 1.5 °C, 2 °C, and 3 °C warming, the scenarios are random samples, and the regional energy pathways are not the only available options for Asia or Asian countries.29,37,71 Therefore, the regional transformation cases are meant to be illustrative, rather than representative of future capacity expansion and CCS deployment at local resolution. Second, the hydrological model, water withdrawal intensities, environmental flow, and real-world rules of water allocation between power plants are also important sources of uncertainty that should continue to be investigated.85–89 Recent work shows that CO2 capture at the plant-level can be better optimized for water use,88 which can lead to lower water withdrawal requirements than in the regional transformation cases in this study. There are also continuous developments in dry cooling technology to reduce the energy penalty.90 Future work can develop more robust local scenarios by adding dynamic capacity into power systems models, adding meteorological impacts on demand and capacity-dispatch, increasing the resolution of energy planning models, considering more advanced generation, CO2 capture, and cooling technologies, and considering feedbacks between hydrological flows and water for energy.
Conflicts of interest
There are no conflicts of interest to declare.Acknowledgements
The authors thank funding support from the Young Scientists Summer Program (U.S. National Member Organization) and the Peccei Award of the International Institute for Applied Systems Analysis, and the U.S. National Science Foundation Innovations at the Nexus of Food, Energy, and Water Systems (INFEWS) (Grant #1739909). The authors also thank anonymous reviewers for their comments and suggestions.References
- BP, Electricity – BP Statistical Review of World Energy 2018 – 67th edition, 2018.
- E. Spanger-Siegfried, If You Can’t Take the Heat: How Summer 2012 Strained U.S. Power Plants.
- C. Singh, Z. Knight and V. Mitchell, India's Water Stress, HSBC Climate Change, 2014.
- J. Jowit and J. Espinoza, Heatwave Shuts down Nuclear Power Plants, https://www.theguardian.com/environment/2006/jul/30/energy.weather.
- International Commission for the Protection of the Danube River, Droughts.
- H. Förster and J. Lilliestam, Reg. Environ. Change, 2010, 10, 327–338 CrossRef.
- M. T. H. van Vliet, J. R. Yearsley, F. Ludwig, S. Vögele, D. P. Lettenmaier and P. Kabat, Nat. Clim. Change, 2012, 2, 676–681 CrossRef.
- M. T. H. van Vliet, D. Wiberg, S. Leduc and K. Riahi, Nat. Clim. Change, 2016, 6, 375–380 CrossRef.
- L. Liu, M. Hejazi, H. Li, B. Forman and X. Zhang, Nat. Energy, 2017, 2, 17109 CrossRef.
- M. D. Bartos and M. V. Chester, Nat. Clim. Change, 2015, 5, 748–752 CrossRef.
- P. Behrens, M. T. H. van Vliet, T. Nanninga, B. Walsh and J. F. D. Rodrigues, Nat. Energy, 2017, 2, 17114 CrossRef.
- A. Miara, J. E. Macknick, C. J. Vörösmarty, V. C. Tidwell, R. Newmark and B. Fekete, Nat. Clim. Change, 2017, 7, 793 CrossRef.
- E. A. Byers, J. W. Hall, J. M. Amezaga, G. M. O’Donnell and A. Leathard, Environ. Res. Lett., 2016, 11, 24011 CrossRef.
- International Energy Agency, Key World Energy Statistics 2018, 2018.
- International Energy Agency, Statistics Search Report (Topic: Electricity and Heat), http://www.iea.org/statistics/statisticssearch/.
- K. Frenken, L. R. Khan, P. B. S. Sarma, Y. Syaukat, S. Ahmad, R. Concepcion, S. Sethaputra and P. Nguyen, Irrigation in Southern and Eastern Asia in figures AQUASTAT Survey – 2011, Rome, Italy, 2012.
- X. Liao, J. W. Hall and N. Eyre, Glob. Environ. Change, 2016, 41, 142–152 CrossRef.
- General Office of the State Council, Notice of the General Office of the State Council on Issuing the Air Pollution Prevention and Control Action Plan (No. 37 [2013] of the General Office of the State Council) (in Chinese), http://www.gov.cn/zwgk/2013-09/12/content_2486773.htm.
- Central Pollution Control Board, Pollution Control Implementation Division - II Thermal Power Plants, 2016.
- CoalSwarm, Global Coal Plant Tracker, http://endcoal.org/tracker/.
- M. González-Eguino, A. Olabe and T. Ribera, Sustainable, 2017, 9, 2015–2018 CrossRef.
- X. Wang and H. Zhang, Greenhouse Gases: Sci. Technol., 2018, 8, 863–875 CrossRef.
- M. Bui, C. S. Adjiman, A. Bardow, E. J. Anthony, A. Boston, S. Brown, P. S. Fennell, S. Fuss, A. Galindo, L. A. Hackett, J. P. Hallett, H. J. Herzog, G. Jackson, J. Kemper, S. Krevor, G. C. Maitland, M. Matuszewski, I. S. Metcalfe, C. Petit, G. Puxty, J. Reimer, D. M. Reiner, E. S. Rubin, S. A. Scott, N. Shah, B. Smit, J. P. M. Trusler, P. Webley, J. Wilcox and N. Mac Dowell, Energy Environ. Sci., 2018, 11, 1062–1176 RSC.
- N. Sharma and S. S. Mahapatra, Environ. Technol. Innov., 2018, 9, 51–62 CrossRef.
- B. Tarroja, F. Chiang, A. AghaKouchak and S. Samuelsen, Appl. Energy, 2018, 226, 49–60 CrossRef.
- Y. Yao, Z. Li, T. Wang, A. Chen, X. Wang, M. Du, G. Jia, Y. Li, H. Li, W. Luo, Y. Ma, Y. Tang, H. Wang, Z. Wu, J. Yan, X. Zhang, Y. Y. Zhang, Y. Y. Zhang, G. Zhou and S. Piao, Agric. For. Meteorol., 2018, 253–254, 84–93 CrossRef.
- E. Grubert and K. T. Sanders, Environ. Sci. Technol., 2018, 52, 6695–6703 CrossRef CAS PubMed.
- C. E. Raptis, M. T. H. van Vliet and S. Pfister, Environ. Res. Lett., 2016, 11, 104011 CrossRef.
- S. Srinivasan, N. Kholod, V. Chaturvedi, P. P. Ghosh, R. Mathur, L. Clarke, M. Evans, M. Hejazi, A. Kanudia, P. N. Koti, B. Liu, K. S. Parikh, M. S. Ali and K. Sharma, Appl. Energy, 2018, 210, 673–684 CrossRef.
- L. Lin and D. Y. Chen, Sustainability, 2018, 10, 30 CrossRef.
- M. Li, H. Dai, Y. Xie, Y. Tao, L. Bregnbaek and K. Sandholt, Appl. Energy, 2017, 208, 580–591 CrossRef.
- R. Wang, J. B. Zimmerman, C. Wang, D. Font Vivanco and E. G. Hertwich, Environ. Sci. Technol., 2017, 51, 9899–9910 CrossRef CAS PubMed.
- E. A. Byers, J. W. Hall and J. M. Amezaga, Glob. Environ. Change, 2014, 25, 16–30 CrossRef.
- I. Mouratiadou, M. Bevione, D. L. Bijl, L. Drouet, M. Hejazi, S. Mima, M. Pehl and G. Luderer, Clim. Change, 2018, 147, 91–106 CrossRef CAS.
- O. Fricko, S. C. Parkinson, N. Johnson, M. Strubegger, M. T. H. van Vliet and K. Riahi, Environ. Res. Lett., 2016, 11, 34011 CrossRef.
- X. Zhang, J. Liu, Y. Tang, X. Zhao, H. Yang, P. W. Gerbens-Leenes, M. T. H. van Vliet and J. Yan, J. Cleaner Prod., 2017, 161, 1171–1179 CrossRef.
- X. Zheng, C. Wang, W. Cai, M. Kummu and O. Varis, Appl. Energy, 2016, 171, 444–455 CrossRef.
- C. Zhang, L. Zhong, X. Fu, J. Wang and Z. Wu, Environ. Sci. Technol., 2016, 50, 1642–1652 CrossRef CAS PubMed.
- X. D. Wu and G. Q. Chen, Appl. Energy, 2017, 195, 125–136 CrossRef.
- L. Liu, M. Hejazi, P. Patel, P. Kyle, E. Davies, Y. Zhou, L. Clarke and J. Edmonds, Technol. Forecast. Soc. Change, 2015, 94, 318–334 CrossRef.
- Y. Zhou, H. Li, K. Wang and J. Bi, Glob. Environ. Change, 2016, 40, 92–100 CrossRef.
- C. Zhang, L. Zhong and J. Wang, Nat. Energy, 2018, 3, 792–799 CrossRef.
- Q. Zhou, N. Hanasaki, S. Fujimori, S. Yoshikawa, S. Kanae and T. Okadera, Water, 2018, 10, 870 CrossRef.
- R. Payet-Burin, F. Bertoni, C. Davidsen and P. Bauer-Gottwein, Energy, 2018, 155, 484–494 CrossRef.
- R. Y. Cui, K. Calvin, L. Clarke, M. Hejazi, S. Kim, P. Kyle, P. Patel, S. Turner and M. Wise, Environ. Res. Lett., 2018, 13, 094006 CrossRef.
- L. Liu, M. Hejazi, G. Iyer and B. A. Forman, Nat. Sustainable, 2019, 2, 206–213 CrossRef.
- X. Y. Lim, D. C. Y. Foo and R. R. Tan, J. Cleaner Prod., 2018, 180, 11–19 CrossRef.
- V. C. Tidwell, J. Macknick, K. Zemlick, J. Sanchez and T. Woldeyesus, Appl. Energy, 2014, 131, 508–516 CrossRef.
- T. A. DeNooyer, J. M. Peschel, Z. Zhang and A. S. Stillwell, Appl. Energy, 2016, 162, 363–371 CrossRef.
- E. G. R. Davies, P. Kyle and J. A. Edmonds, Adv. Water Resour., 2013, 52, 296–313 CrossRef.
- United Nations Framework Convention on Climate Change, Decision 1/CP.21 Adoption of the Paris Agreement (FCCC/CP/2015/10/Add.1), 2015.
- T. Sanford, P. C. Frumhoff, A. Luers and J. Gulledge, Nat. Clim. Change, 2014, 4, 164 CrossRef.
- K. Taylor, R. Stouffer and G. Meehl, World Clim. Res. Prog., 2011, 1–33 Search PubMed.
- S. Hempel, K. Frieler, L. Warszawski, J. Schewe and F. Piontek, Earth Syst. Dyn., 2013, 4, 219–236 CrossRef.
- E. H. Sutanudjaja, R. van Beek, N. Wanders, Y. Wada, J. H. C. Bosmans, N. Drost, R. J. van der Ent, I. E. M. de Graaf, J. M. Hoch, K. de Jong, D. Karssenberg, P. López López, S. Peßenteiner, O. Schmitz, M. W. Straatsma, E. Vannametee, D. Wisser and M. F. P. Bierkens, Geosci. Model Dev., 2018, 11, 2429–2453 CrossRef.
- L. P. H. van Beek, T. Eikelboom, M. T. H. van Vliet and M. F. P. Bierkens, Water Resour. Res., 2012, 48, W09530 CrossRef.
- N. Wanders, M. T. H. van Vliet, Y. Wada, M. F. P. Bierkens and L. P. H. Rens van Beek, Water Resour. Res., 2019, 55, 1–19 CrossRef.
- C. E. Raptis and S. Pfister, Energy, 2016, 97, 46–57 CrossRef.
- L. Liu, Y. Hong, J. E. Hocker, M. A. Shafer, L. M. Carter, J. J. Gourley, C. N. Bednarczyk, B. Yong and P. Adhikari, Theor. Appl. Climatol., 2012, 109, 345–360 CrossRef.
- V. Smakhtin and M. Anputhas, An Assessment of Environmental Flow Requirements of Indian River Basins (Research Report 107), Colombo, Sri Lanka, 2006.
- J. Macknick, R. Newmark, G. Heath and K. C. Hallett, Environ. Res. Lett., 2012, 7, 045802 CrossRef.
- Y. Ou, H. Zhai and E. S. Rubin, Int. J. Greenhouse Gas Control, 2016, 44, 249–261 CrossRef CAS.
- Q. Cui, H. Lu, C. Li, S. Singh, L. Ba, X. Zhao and A. Y. Ku, Int. J. Greenhouse Gas Control, 2018, 78, 37–47 CrossRef CAS.
- National Energy Technology Laboratory, Cost and Performance Baseline for Fossil Energy Plants Volume 1: Bituminous Coal and Natural Gas to Electricity, 2013.
- National Energy Technology Laboratory, Quality Guidelines for Energy System Studies – Detailed Coal Specifications (DOE/NETL-401/012111), 2012.
- A. V. Pastor, F. Ludwig, H. Biemans, H. Hoff and P. Kabat, Hydrol. Earth Syst. Sci., 2014, 18, 5041–5059 CrossRef.
- K. M. Salik, M. Z. ur R. Hashmi, S. Ishfaq and W. ul Z. Zahdi, Reg. Stud. Mar. Sci., 2016, 7, 185–195 CrossRef.
- A. Schröder, F. Kunz, J. Meiss, R. Mendelevitch and C. von Hirschhausen, Current and Prospective Costs of Electricity Generation until 2050 (Data Documentation), Berlin, Germany, 2013.
- H. Koch and S. Vögele, Ecol. Econ., 2009, 68, 2031–2039 CrossRef.
- F. Ackerman and J. Fisher, Energy Policy, 2013, 59, 235–241 CrossRef.
- International Institute for Applied Systems Analysis, SSP Database (Shared Socioeconomic Pathways) – Version 1.1, https://tntcat.iiasa.ac.at/SspDb/dsd?Action=htmlpage&page=about.
- Environmental Protection Agency, Technical Development Document for the Final Regulations Addressing Cooling Water Intake Structures for New Facilities (EPA-821-R-01-036), 2001.
- A. N. Mays, G. T. Belles, R. J. Blevins, B. R. Hadley, S. W. Harrison, T. J. Jochem, W. C. Neish, B. S. Omitaomu and O. A. Rose, Application of Spatial Data Modeling and Geographical Information Systems (GIS) for Identification of Potential Siting Options for Various Electrical Generation Sources, Oak Ridge, TN, USA, 2012.
- Indian Energy Exchange, Day-Ahead Market Bid Areas, http://www.iexindia.com/bidareas.aspx?id=31&mid=2.
- Global Energy Network Institute, Vietnam Energy Map 2010, http://www.geni.org/globalenergy/library/national_energy_grid/vietman/vietnamesenationalelectricitygrid.shtml.
- Global Energy Network Institute, National Electricity Transmission Grid of China, http://www.geni.org/globalenergy/library/national_energy_grid/china/chinesenationallectricitygrid.shtml.
- H. Zhai and E. S. Rubin, Energy Policy, 2010, 38, 5653–5660 CrossRef.
- M. T. H. van Vliet, S. Vögele and D. Rübbelke, Environ. Res. Lett., 2013, 8, 035010 CrossRef.
- A. Menon, A. Levermann, J. Schewe, J. Lehmann and K. Frieler, Earth Syst. Dyn., 2013, 4, 287–300 CrossRef.
- O. Seok-Geun, P. Ju-Hee, L. Sang-Hyun and S. Myoung-Seok, J. Geophys. Res.: Atmos., 2014, 119, 2913–2927 Search PubMed.
- A. Kääb, E. Berthier, C. Nuth, J. Gardelle and Y. Arnaud, Nature, 2012, 488, 495 CrossRef PubMed.
- Y. Satoh, K. Taher, B. Edward, B. Peter, F. Günther, T. Sylvia, G. Peter, F. Martina, E. Stephanie, H. Naota, M. Piotr, N. L. Fabiola, C. William, L. Simon and W. Yoshihide, Earth's Future, 2017, 5, 823–852 CrossRef.
- Y. Qin, E. Curmi, G. M. Kopec, J. M. Allwood and K. S. Richards, Energy Policy, 2015, 82, 131–143 CrossRef.
- Y. Wu, Energy Strategy Rev., 2013, 2, 138–145 CrossRef.
- J. Chen, C. Gao, X. Zeng, M. Xiong, Y. Wang, C. Jing, V. Krysanova, J. Huang, N. Zhao and B. Su, Quat. Int., 2017, 453, 63–73 CrossRef.
- M. T. H. van Vliet, L. P. H. van Beek, S. Eisner, M. Flörke, Y. Wada and M. F. P. Bierkens, Glob. Environ. Change, 2016, 40, 156–170 CrossRef.
- T. H. Diehl and M. A. Harris, Withdrawal and Consumption of Water by Thermoelectric Power Plants in the United States, 2010: U.S. Geological Survey Scientific Investigations Report 2014–5184, 2014.
- P. Brandl, S. M. Soltani, P. S. Fennell and N. Mac Dowell, Chem. Eng. Res. Des., 2017, 122, 1–10 CrossRef CAS.
- K. Z. House, C. F. Harvey, M. J. Aziz and D. P. Schrag, Energy Environ. Sci., 2009, 2, 193–205 RSC.
- J. G. Bustamante, A. S. Rattner and S. Garimella, Appl. Therm. Eng., 2016, 105, 362–371 CrossRef.
Footnotes |
| † Electronic supplementary information (ESI) available. See DOI: 10.1039/c9ee02058f |
| ‡ Current address: Institute for a Secure and Sustainable Environment, University of Tennessee, USA. E-mail: ywang254@utk.edu |
| This journal is © The Royal Society of Chemistry 2019 |