
 Open Access Article
 This Open Access Article is licensed under a Creative Commons Attribution-Non Commercial 3.0 Unported Licence
Real-time imaging of activation and degradation of carbon supported octahedral Pt–Ni alloy fuel cell catalysts at the nanoscale using in situ electrochemical liquid cell STEM†
Vera
Beermann‡
a,
Megan E.
Holtz‡
b,
Elliot
Padgett
 b,
Jorge Ferreira
de Araujo
a,
David A.
Muller
*bc and
Peter
Strasser
*a
b,
Jorge Ferreira
de Araujo
a,
David A.
Muller
*bc and
Peter
Strasser
*a
aElectrochemical Energy, Catalysis and Material Science Laboratory, Department of Chemistry, Technical University Berlin, 10623 Berlin, Germany. E-mail: pstrasser@tu-berlin.de
bSchool of Applied and Engineering Physics, Cornell University, Ithaca, NY 14850, USA. E-mail: david.a.muller@cornell.edu
cKavli Institute at Cornell for Nanoscale Science, Cornell University, Ithaca, NY 14850, USA
First published on 20th May 2019
Abstract
Octahedrally shaped Pt–Ni alloy nanoparticles on carbon supports have demonstrated unprecedented electrocatalytic activity for the oxygen reduction reaction (ORR), sparking interest as catalysts for low-temperature fuel cell cathodes. However, deterioration of the octahedral shape that gives the catalyst its superior activity currently prohibits the use of shaped catalysts in fuel cell devices, while the structural dynamics of the overall catalyst degradation are largely unknown. We investigate the time-resolved degradation pathways of such a Pt–Ni alloy catalyst supported on carbon during cycling and startup/shutdown conditions using an in situ STEM electrochemical liquid cell, which allows us to track changes happening over seconds. Thereby we can precisely correlate the applied electrochemical potential with the microstructural response of the catalyst. We observe changes of the nanocatalysts’ structure, monitor particle motion and coalescence at potentials that corrode carbon, and investigate the dissolution and redeposition processes of the nanocatalyst under working conditions. Carbon support motion, particle motion, and particle coalescence were observed as the main microstructural responses to potential cycling and holds in regimes where carbon corrosion happens. Catalyst motion happened more severely during high potential holds and sudden potential changes than during cyclic potential sweeps, despite carbon corrosion happening during both, as suggested by ex situ DEMS results. During an extremely high potential excursion, the shaped nanoparticles became mobile on the carbon support and agglomerated facet-to-facet within 10 seconds. These experiments suggest that startup/shutdown potential treatments may cause catalyst coarsening on a much shorter time scale than full collapse of the carbon support. Additionally, the varying degrees of attachment of particles on the carbon support indicates that there is a distribution of interaction strengths, which in the future should be optimized for shaped particles. We further track the dissolution of Ni nanoparticles and determine the dissolution rate as a function of time for an individual nanoparticle – which occurs over the course of a few potential cycles for each particle. This study provides new visual understanding of the fundamental structural dynamics of nanocatalysts during fuel cell operation and highlights the need for better catalyst-support anchoring and morphology for allowing these highly active shaped catalysts to become useful in PEM fuel cell applications.
Broader contextIn situ and operando electrochemical liquid cell scanning transmission electron microscopy (E-chem STEM) offers previously unavailable insight into the evolution of the morphology and structure, as well as the composition and electronic structure, of nanoscale electrocatalysts under operating environments. While conventional ex situ STEM or identical location STEM present before/after images, and environmental TEM is largely limited to low-pressure environments, E-chem STEM is able to perform operando imaging of the physico-chemical transformations at electrified solid–liquid interfaces in real-time. In this contribution, E-chem STEM is used to track the microstructural events during the degradation of carbon-supported octahedrally-shaped PtNi fuel cell nanocatalysts during potential cycling and potential holds in real time, revealing carbon support motion, particle motion, and rapid particle coalescence within seconds. This suggests that fuel cell startup/shutdown conditions can cause catalyst coarsening on a much shorter time scale than previously assumed and call for better catalyst-support anchoring. Tracking the activation and degradation of PtNi alloy nanocatalysts provides a clear and visual understanding of their fundamental structural dynamics during fuel cell operation. |
Introduction
Heightened interest in alternative renewable power sources has increased technological and scientific focus on fuel cell technologies. A large part of such research and development is focused on novel cathode catalyst materials for the oxygen reduction reaction (ORR) where efficiency losses have remained high. New catalyst systems based on alloying Pt with transition metals like Fe, Co, Ni, and Cu in unshaped alloy nanoparticles have led to improved ORR activities.1,2 At least an order of magnitude improvement in catalytic ORR activity over these conventional alloy nanoparticles has been reported for shape-controlled octahedral Pt–Ni alloy particles, because they exclusively expose highly active {111} Pt–Ni facets.3–6 While unshaped Pt–M alloy fuel cell catalysts are beginning to be deployed in commercial applications,7,8 shape-controlled particles still face challenges in terms of stability, especially in the final MEA (Membrane electrode assembly) device.7,9 Shaped Pt–Ni nanoparticles have been observed to quickly lose their shape after cycling, in part due to nickel dissolution.10,11 The detailed degradation processes of octahedral Pt–Ni particles on carbon supports have remained elusive. Hence, better understanding of their structural behavior and degradation is critically required before these high-activity catalysts can be deployed in commercial applications.Many physical characterization methods have been used to gain a better understanding of the morphology and composition of fuel cell catalyst materials before and after degradation. Most of the work to date has relied on ex situ characterization techniques, often involving scattering from X-ray, light or electrons to describe the initial or post mortem material. For fuel cell catalyst nanoparticles, transmission electron microscopy (TEM) is a popular method to determine the particle shape and distribution on the support material, as well as elemental distribution and stability. Identical location TEM (IL TEM) has been used extensively for some Pt-based nanoparticle materials to track and study changes of identical particles or catalyst parts before and after electrochemical treatment.12–16 In addition to ex situ techniques, there has been a recent surge of interest and capability in in situ and operando methods that enable probing the material under working conditions, garnering valuable understanding of material operation and degradation.17–29 Lately, several groups reported in situ electrochemical TEM investigations on fuel cell materials30,31 and lithium ion battery materials.18,32–39 These experiments typically use liquid-cell systems in conventional TEMs with SiN windows on chips encapsulating a thin liquid layer. Using this powerful tool, it is possible to perform conventional electrochemistry and electrocatalysis while imaging the reactive particles of interest in real time on the nanometer scale, obtaining operando information about the nanocatalyst at work.
In this study, we investigate the degradation of carbon-supported octahedral shaped Pt–Ni alloy nanoparticle catalysts for advanced fuel cell cathodes. We use an in situ electrochemical liquid-cell and scanning transmission electron microscopy (STEM) to track the nanoscale changes to the catalyst under electrochemical conditions that arise or are applied at the cathode. We monitor the translational, structural, and – thanks to atomic number contrast in high angle annular dark field (HAADF) STEM – compositional dynamics and evolution of individual nanoparticles as well as ensembles of nanoparticles in real time and with nanometer-scale resolution and support findings regarding carbon corrosion with DEMS. This study gives new insight into how initially shape-controlled nano-octahedra transform into unshaped and partially agglomerated particle clusters, and provides visualization of how the degradation of the carbon support affects the catalyst material.
Results and discussion
We investigated ∼8 nm octahedral Pt–Ni nanoparticles that were supported on Vulcan carbon supports (Fig. 1a). These supported Pt–Ni/C particles showed electrochemical ORR activity that was about 25× greater than commercial Pt/C, and, from a more practical perspective, were large enough to be imaged in an in situ TEM liquid environment at low beam doses. They exhibit an average composition of Pt62Ni38 and a Pt enriched surface, and were carefully washed with ethanol in order to remove remaining surfactants from the synthesis.40 In addition to octahedral Pt–Ni nanoparticles, the catalyst also contained a minor alloy phase consisting of 20–50 nm Ni-rich particles, which enabled study of rapid electrochemical dissolution processes of undesired alloy phases during catalyst activation. These Ni-rich particles consist of a Pt-rich core which is encased by a thick Ni shell resulting in an overall composition of Pt5Ni95.40Fig. 1a shows the catalyst particles ex situ as synthesized: the initial octahedral shape is evident from the faceting of the particles, which are homogeneously distributed on the carbon support. After ex situ voltammetric stability tests in perchloric acid, the octahedral particles lost their sharp faceting and showed agglomeration (shown in Fig. 1b). The particles display slightly concave edges and facets suggesting that the facets are relatively Ni-rich and are therefore etched more quickly during acid and electrochemical treatments, leaving behind a Pt-rich skin. After treatment, we observe an average composition of Pt69Ni31, reflecting the relative loss of Ni.40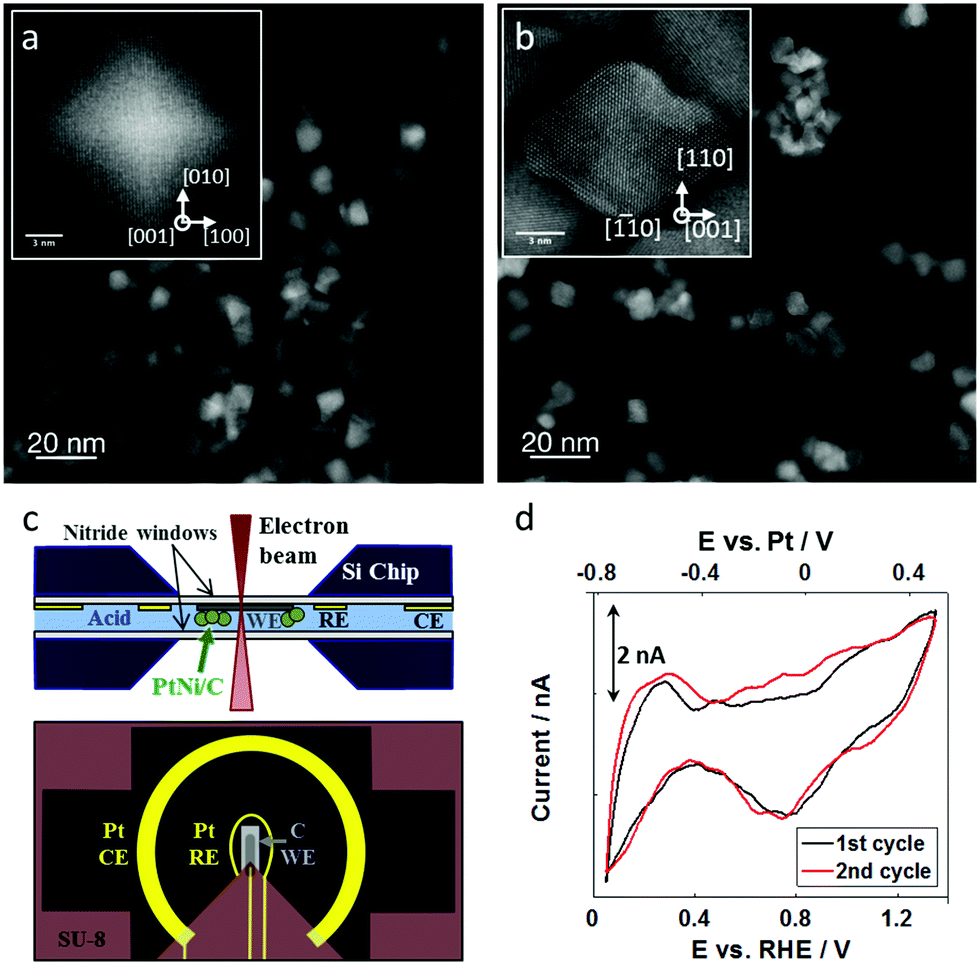 | ||
| Fig. 1 Preliminary characterization and in situ TEM chip design. (a) Initial particles ex situ after synthesis, showing octahedral shape with strong faceting in the {111} planes (see inset) and (b) ex situ after electrochemical potential cycling for 40 cyclic voltammograms, where facets are curved and particles are agglomerated (see inset). (c) Overview of electrochemical cell setup, with a cross section of the liquid cell holder on the top and view of the electrodes on the bottom. (d) Cyclic voltammogram of Pt–Ni nanoparticles on the carbon working electrode inside the electrochemical cell in 0.1 M HClO4 with a sweep rate of 100 mV s−1. | ||
To better understand this degradation, we perform an in situ study of the real time nanometer-scale evolution of the carbon supported, octahedral Pt–Ni fuel cell catalysts.
The in situ TEM experiments were carried out in a Protochips Poseidon holder and a flow cell chip equipped with a silicon nitride window. The cross section and top view of the chip are illustrated in Fig. 1c showing the carbon working electrode and the Pt reference and counter electrodes.18,29 The platinum reference electrode was calibrated in 0.1 M perchloric acid using the well-known characteristics of the hydrogen underpotential deposition region of platinum-based materials, as shown in Fig. 1d. With that, 0.0 VRHE was correlated to −0.8 VPt. All further potentials are reported against the reversible hydrogen electrode (RHE) based on this calibration to allow better comparability to the literature. The cell had a liquid thickness of 300 nm, as estimated by electron energy loss spectroscopy.41
Prior to the in situ TEM electrochemical investigations, we identified a suitable beam dose that did not visibly affect the octahedral particles in the electrolyte for the duration of the applied electrode potential. Even though the beam alone may not influence the particles, the combination of beam and electrochemical cycling may have an effect. To account for this, we compared the final state (after electrode potential cycling) of the particles that were imaged during the in situ experiment to other particles that were not continuously imaged in the electrochemical cell, to crosscheck for similar transformations. We further compared particles that were on the electrode to those that were not on the electrode to ensure that the effects were electrochemical rather than chemical inside the liquid cell (Fig. S1, ESI†). As a final check, we qualitatively compared the data from in situ experiments to those of ex situ experiments. Overall, we found that the electrochemical effects observed were not driven by the electron beam, nor from the chemical environment in the cell. However, the in situ experiments appeared to be harsher on the particles due to the additional effects of the electron beam.
We performed in situ electrochemical STEM investigations using different electrochemical electrode potential cycling protocols resembling those routinely applied to single fuel cells to electrochemically activate and stress-test their catalysts,42,43 cycle in standard operating ranges, and cycle under extreme potentials to simulate startup/shutdown conditions – which may occur in a PEMFC, reaching values of up to 1.6 VRHE, due to oxygen and hydrogen present at the anode side.
First, the catalyst on the working electrode was cycled 20 times inside a potential range between 0.0 and +1.0 VRHE with 100 mV s−1 to mimic an activation procedure. Fig. 2a shows the applied potential profile with selected marked time points corresponding to the STEM images shown in Fig. 2b–g. The selected field of view displays a collection of octahedral nanoparticles surrounding a larger Ni rich particle. During the electrochemical treatment, there were no discernible changes in the octahedral particle structure. While surface Ni may dissolve, the relatively high Pt content in the alloy passivates the surface preventing further dissolution. However, the large Ni-rich particle marked by the arrow in Fig. 2b–g gradually dissolved according to Ni0 → Ni2+ + 2e− (E0 = 0.26 V44) during the applied potential cycling. After 10 cycles (Fig. 2c) the particle started to lose mass as observed by first a change in the overall HAADF intensity and eventually by a change in the particle diameter. The dissolution process took place over several cycles, and after 15 cycles (Fig. 2f) only a small fraction remained. Because the HAADF intensity began to drop before the diameter of the particle shrank, and because the intensity of the particle became modulated (Fig. 2c) compared to its initial state (Fig. 2b), we expect the particle first became less dense, possibly becoming sponge-like and porous, before it disappeared completely.60 In our corresponding ex situ experiment discussed below, we also observed a Ni-rich particle that had modulations in the ADF intensity (Fig. S2e, ESI†), further suggesting that the particles do not dissolve radially inward. The dissolved Ni-rich particle left behind an octahedral particle, which may have been contained inside the Ni-rich phase, evidenced by the bright contrast in the center (see Fig. 2b). The dissolution of another Ni-rich particle was observed between Fig. 2b (where it is a fractional particle already) and Fig. 2c in the central lower part of the frame. After the first 20 cycles, there were still Ni-rich particles remaining in areas outside of the region imaged in Fig. 2, and after an additional 20 cycles (total of 40 cycles), the remaining Ni-rich particles elsewhere on the electrode also disappeared. The real-time imaging of the catalyst during electrochemical cycling with the animated potential profile corresponding to the data in Fig. 2b–g is shown in Movie S1 of the ESI.†
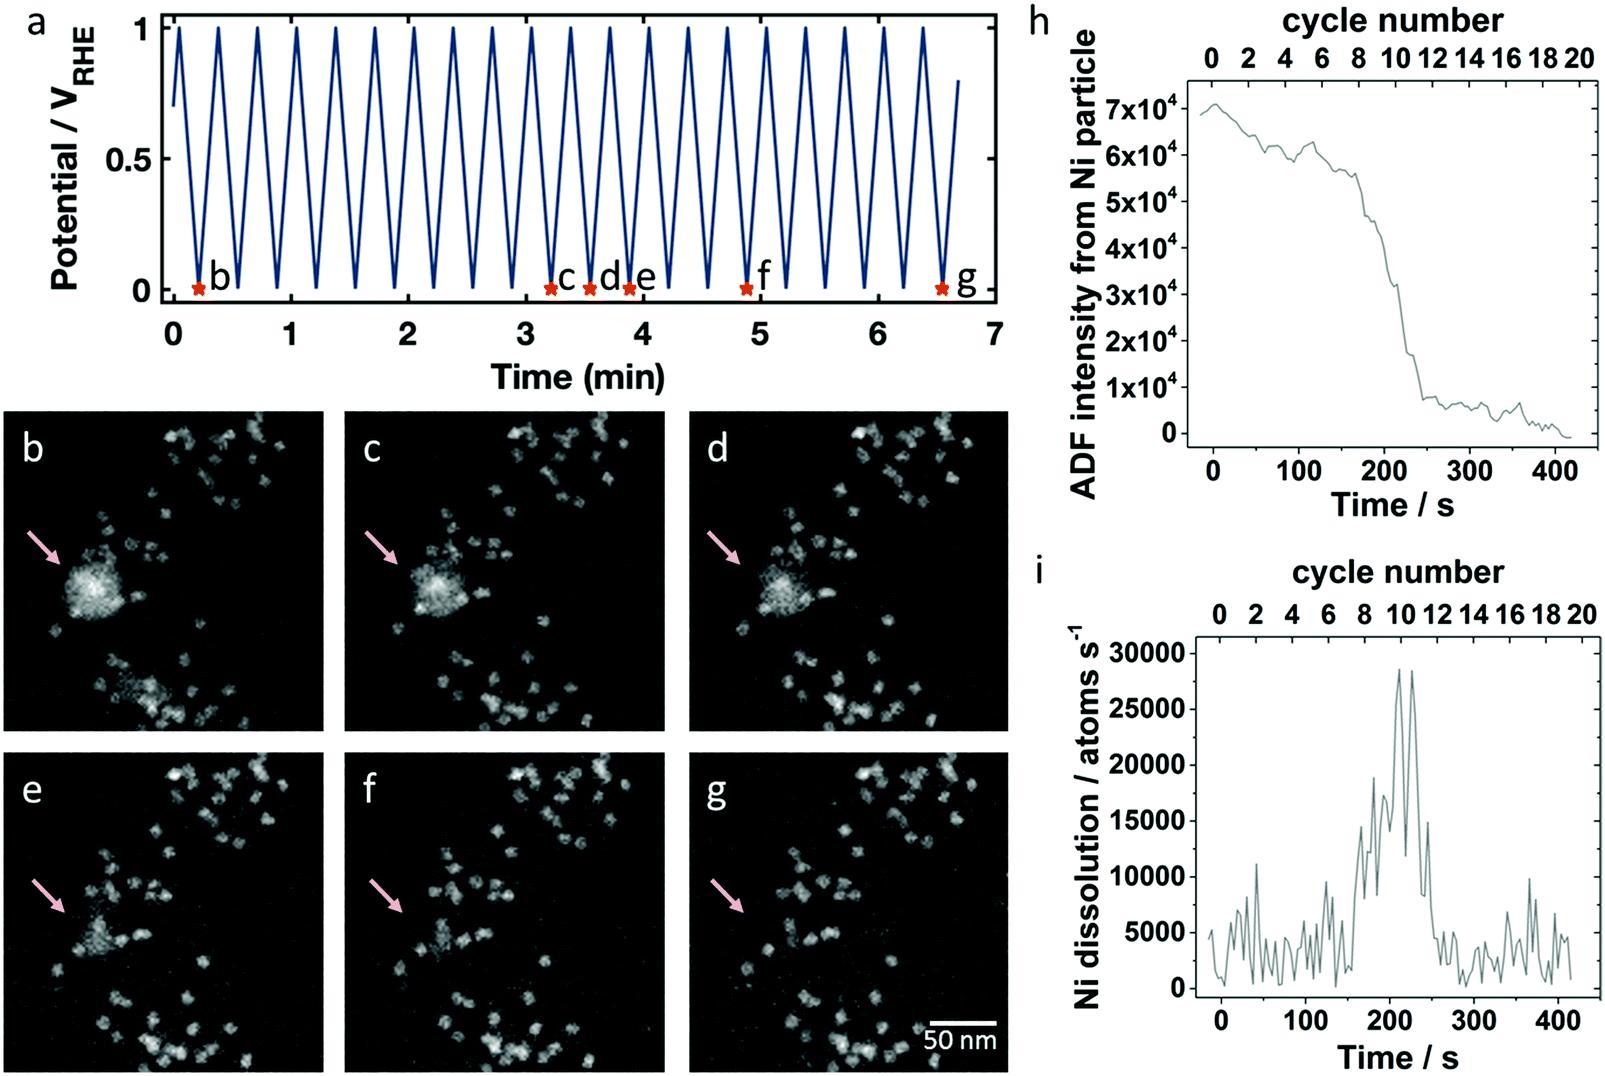 | ||
| Fig. 2 HAADF STEM in situ imaging of the catalyst structure during electrochemical potential cycling between 0.0 and +1.0 VRHE in 0.1 M HClO4 for 20 CV with 100 mV s−1 sweep rate. (a) Potential profile over time with marked points corresponding to the images in (b–g). A Ni-rich particle marked by the arrow disappears during cycling, first becoming less dense, then spongy, and finally dissolving completely. (h) ADF intensities of the Ni-rich particles over time during potential cycling and (i) the resulting Ni dissolution rate. | ||
The opportunity to image the Ni dissolution process in real time allows us to estimate a dissolution rate for an individual Ni particle. Annular dark field (ADF) intensities of the Ni particle were obtained by integrating over a region containing the Ni particle, subtracting off the background intensity from a neighboring region to account for liquid thickness variation, and subtracting off the average intensity of the last 5 frames, when the Ni particle had fully disappeared. In Fig. 2h, we first see a gradual decrease in ADF intensity, which corresponds in the image to the particle becoming less dense. Then, the particle dissolves rapidly, decreasing in size drastically between cycle 9 and 13. While we expect Ni dissolution above 0.26 VRHE, we do not observe periodic changes in the dissolution rate with the potential in each cycle. Although we expect Ni dissolution to be a thermodynamically driven process, the sudden dissolution may happen due to an increase of surface area as it becomes spongy, with exposure of a fresh, unpassivated surface. From the background subtracted ADF intensity of the Ni-rich particle, we can calculate its dissolution rate because the ADF intensity is proportional to the mass present. We assume that the initial ADF intensity corresponds to the number of nickel atoms in a solid, spherical shell of nickel that has the inner and outer diameters as measured in the ADF image. The derivative of the ADF intensity which is scaled to number of Ni atoms present then gives the dissolution rate in atoms per s. This dissolution rate, plotted in Fig. 2i, reaches values of around 10![[thin space (1/6-em)]](https://www.rsc.org/images/entities/char_2009.gif) 000 to 30000 atoms per second during cycles 9 through 13. Assuming a perfectly round Ni particle with a diameter of 10 nm, the number of initial particle surface atoms would be around 4500 Ni atoms. Thus, a dissolution rate of 1000 atoms per s corresponds to one monolayer every 4.5 seconds (for this 10 nm diameter particle). Assuming it is etching along the 111 direction of Ni which has a 2 Å spacing, that corresponds to an etching rate of about 27 nm min−1 – whereas typical etch rates for bulk Ni-materials are on the order of 10 nm min−1.45 So, for a nanoparticle system where the geometry, chemistry and local potential can be quite different, we believe this is a reasonable etch rate for Ni.
000 to 30000 atoms per second during cycles 9 through 13. Assuming a perfectly round Ni particle with a diameter of 10 nm, the number of initial particle surface atoms would be around 4500 Ni atoms. Thus, a dissolution rate of 1000 atoms per s corresponds to one monolayer every 4.5 seconds (for this 10 nm diameter particle). Assuming it is etching along the 111 direction of Ni which has a 2 Å spacing, that corresponds to an etching rate of about 27 nm min−1 – whereas typical etch rates for bulk Ni-materials are on the order of 10 nm min−1.45 So, for a nanoparticle system where the geometry, chemistry and local potential can be quite different, we believe this is a reasonable etch rate for Ni.
After the peak in dissolution, the remaining amount of Ni-rich particles slowly dissolve away – perhaps due to low surface area or Pt enrichment as Ni is selectively removed. This is the first quantitative observation of the nanometer-scale reaction dynamics of a selective Ni dissolution process during the disappearance of a Ni-rich alloy particle.
To compare the activation processes during the in situ experiments and corresponding ex situ treatments, ex situ experiments in a conventional three-electrode cell setup were carried out using identical protocols (Fig. S2, ESI†). The observed cyclic voltammetry current in the in situ cell may differ from an ex situ experiment for several reasons, including the small area of the working electrode, the electrolyte that has not been degassed, and the different diffusion geometry in the thin encapsulated cell. Nevertheless, some trends in the in situ cyclic voltammograms are noteworthy as they show the same processes as observed in the STEM images (Fig. S2b, ESI†). With increasing cycle number, the current at higher potentials due to Ni dissolution trails off, and the redox waves inside the Hupd region become sharper, which is consistent with generating a cleaner, more Pt-rich, and more facetted surface due to Ni dissolution and Pt diffusion.11,40,46,47 Unlike in situ, we noticed several residual large Ni-rich nanoparticles after 40 ex situ cycles (Fig. S2d and e, ESI†), some of which appeared to have experienced partial dissolution. Thus, we conclude that the in situ conditions were more corrosive than the ex situ conditions, possibly due to the confined liquid cell environment, electron beam effects, and the lower geometric Pt loading.
Our observations show that the typical electrochemical activation comprising cyclic voltammetry in liquid does not harm the shape or distribution of the Pt–Ni octahedra, validating the suitability of these commonly used activation procedures. Dissolution of nickel in the Pt–Ni octahedra was not possible to determine at the dose-limited resolution because the ADF intensity is largely dominated by the large Pt signal and insensitive to small changes due to Ni dissolution. While the Pt–Ni octahedra are stable, the undesired Ni-rich clusters dissolve within minutes of the activation protocol. In all, we successfully imaged the activation dynamics of a shaped Pt alloy fuel cell catalyst by electrochemical dealloying and selective corrosion in real time.
Next, we studied the impact of sequential sets of potential cycles separated by periods with constant applied electrode potential, a frequently used test cycle motif for automotive or stationary PEM fuel cells. The potential versus time profile is given in Fig. 3a, again with marked time points for the snapshots shown in Fig. 3b–h, with two zoomed in smaller regions to track individual particles. An initial potential hold at +0.8 VRHE is followed by cyclic voltammetry with an upper potential of +1.2 VRHE with 100 mV s−1 sweep rate. Then, there is a subsequent fixed potential hold at +1.2 VRHE, followed by cyclic voltammetry to an upper potential of +1.4 VRHE at 100 mV s−1. This is finished with another fixed potential hold at +1.4 VRHE. For this experiment, we imaged a region of the Pt–Ni nanoparticles that was previously not immersed in the electrolyte, and did not show evidence of previous cycling. This was possible because the liquid cell was only partly full or had a small bubble over the working electrode, and as the liquid flowed over the course of the experiment, the liquid front gradually moved from one side to the other to cover the entire electrode region.
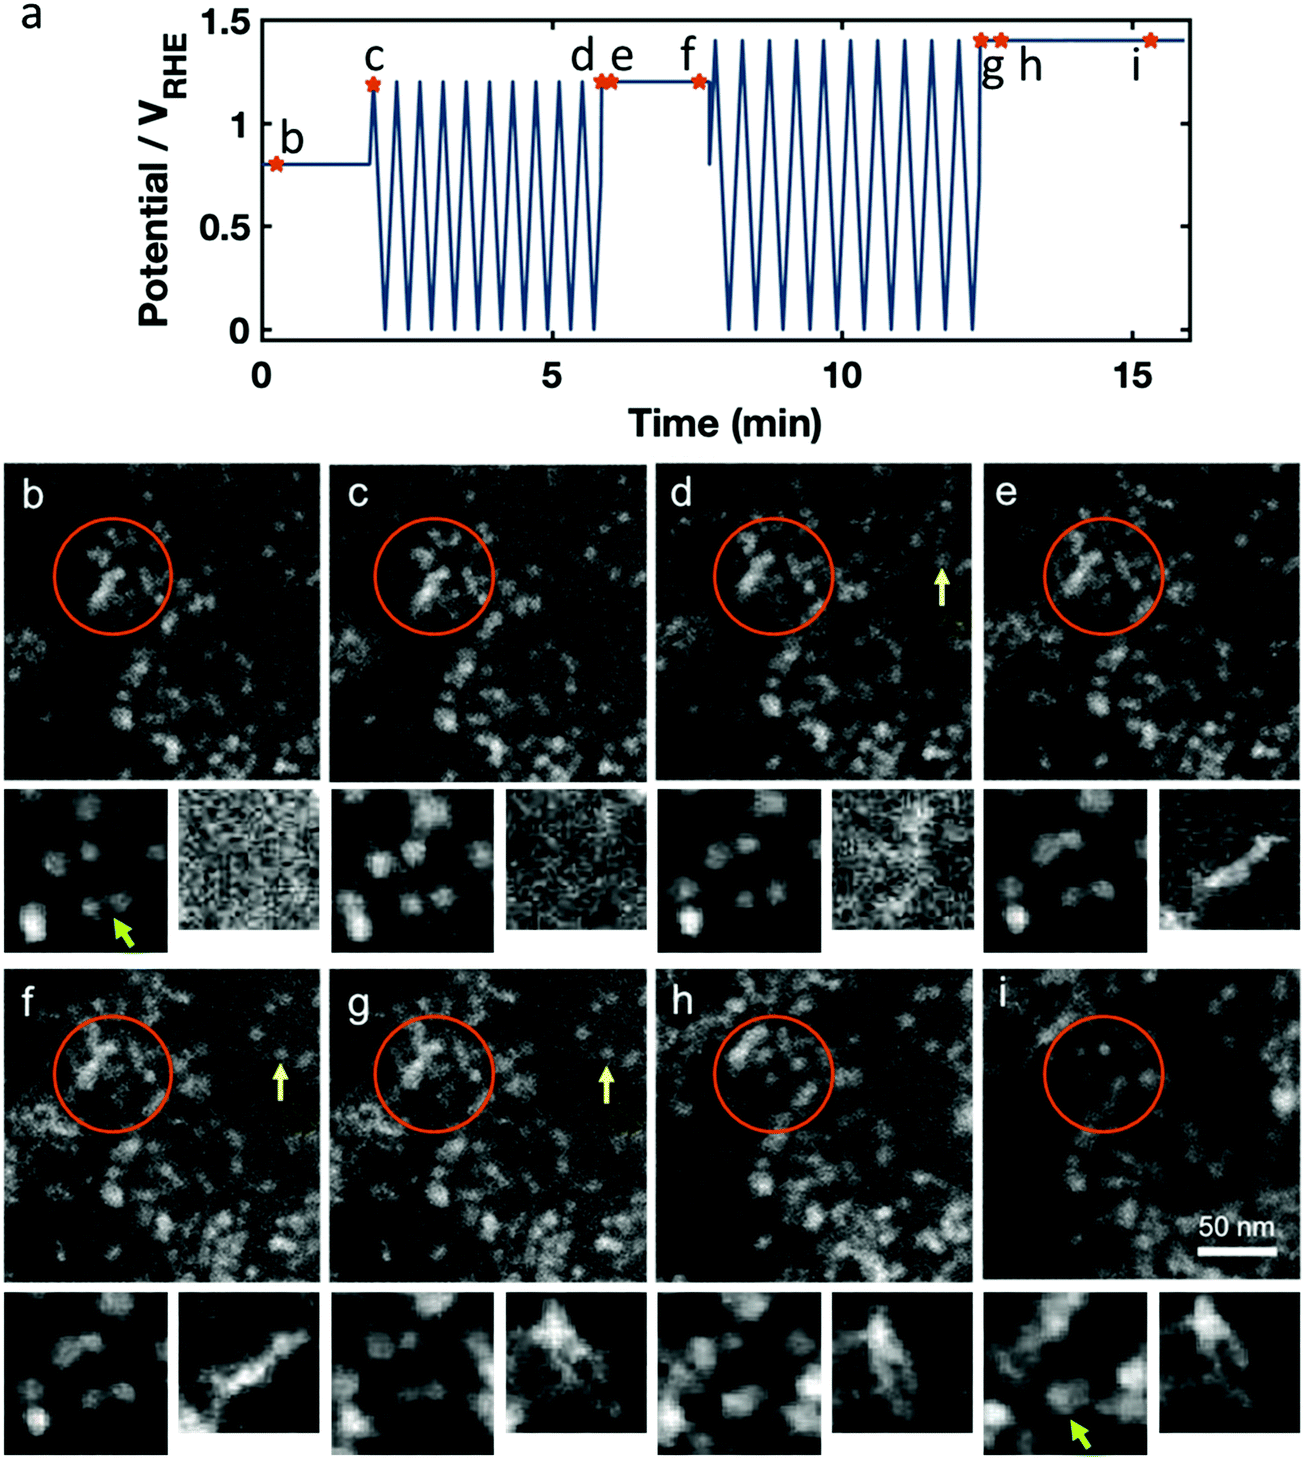 | ||
| Fig. 3 HAADF STEM in situ imaging of the impact on the catalyst structure of an electrochemical sequence consisting of electrochemical potential cycling between 0.0 to +1.2 VRHE and 0.0 to +1.4 VRHE for 10 CV with 100 mV s−1 and holding on different upper potentials in 0.1 M HClO4. (a) Potential profile over time with marked points for shown images. (b–i) Images taken at the marked potential and cycle number, with cutouts of small regions from other areas of the movie sequence to track individual particles (left) and stringy Pt growth (right). The field of view of the larger cutout (left) is 50 nm and 44 nm for the smaller (right). For example, the green arrow marks two Pt–Ni particles that slowly move together, while both growing larger. On the right cutout, we see stringy particles growing mostly during potential cycling, and moving during holding. | ||
Still images in Fig. 3b–i are taken from the in situ STEM data that are presented in Movie S2 (ESI†), which also incorporates the animated potential profile. During the hold at +0.8 VRHE carbon remained stable and we saw minimal changes in the catalyst structure (Fig. 3c). When cycling to +1.2 VRHE, a slight movement of the carbon support was observed, visible by the motion of whole particle agglomerates. We also observed the nucleation and growth of stringy, new Pt-rich deposits, as seen in the smallest cutouts in Fig. 3b–i, which is likely due to chemical metal redeposition as we will later discuss (Fig. 3d, f and g, yellow arrow).
During the hold at +1.2 VRHE the redeposited Pt/Ni abruptly moves, as if it was not firmly attached and became dislodged when held at elevated potential (Fig. 3e, orange circle). When the Pt-rich redeposits appear to collide with other parts of the sample or working electrode, their motion slows or stops. At the same time, the former octahedral Pt–Ni nanoparticles also seem mobile (see the smaller cutouts going from Fig. 3d to e) and started to grow slowly in size (Fig. 3f, orange cycle), as expected from both electrochemical and beam-induced redeposition. Upon cycling to +1.4 VRHE, the redeposited Pt/Ni again becomes mobile and swings about, while carbon-supported Pt–Ni particles also move notably (Fig. 3f and g). Additional stringy Pt-rich deposits form. Finally, holding the potential at +1.4 VRHE again causes abrupt motion of the redeposited Pt (Fig. 3h, orange cycle), while carbon corrosion (C + 4H2O → CO2 + 4H+ + 4e− (E0 = 0.21 V)44) appears to occur rapidly enough to cause sustained motions of the carbon-supported Pt–Ni particles (Fig. 3i) and the Pt–Ni particle growth continues.
Several phenomena were observed in Movie S2 (ESI†) – including growth and motion of stringy Pt-rich deposits, Pt–Ni nanoparticle growth, and catalyst structure changes, which are likely due to carbon corrosion – which we will discuss in the following paragraphs.
First, we will discuss the stringy metal redeposition which is highlighted in the smallest (right) cutout of Fig. 3b–i. We believe that the stringy redeposition is primarily Pt being reduced and redeposited, because the high contrast in the STEM images is consistent with a Pt or Pt-rich composite. Additionally, Ni has a lower standard potential than Pt (0.26 VRHE for Ni vs. 1.18 VRHE for Pt), indicating that Pt will be preferentially reduced while Ni will more likely be dissolved. From the literature we also believe that Ni is unlikely to become reduced again on the particle surface.47 There are two potential mechanisms for the observed stringy redeposition: (1) chemical redeposition, which is driven by a reducing chemical environment such as one generated by the electron beam,48 or (2) electrochemical reduction, which occurs at low, reducing potentials only at locations which have electrical contact with the working electrode. We observe that these Pt-rich deposits form faster during cyclic voltammetry than during potential holds. There may be two reasonable explanations for this: (1) electrochemically assisted deposition might occur during the sweep to low potentials, or (2) the Pt is chemically deposited, and this happens faster during the cyclic voltammetry because of increased Pt dissolution during the cyclic voltammetry, so there is more Pt in solution to be chemically deposited (Pt0 ↔ Pt2+ + 2e− (E0 = 1.18 V)).44 If the effect were purely electrochemical deposition at low potentials, we would expect the time at low potential to determine the amount of redeposition. However, if the redeposition is chemical, it will be faster at sweeps to higher potential since more Pt will be dissolved into the system, which will then be available for redeposition. Indeed, we observe that the deposition appears to be faster at the cyclic voltammetry with upper potentials of 1.4 VRHE compared to 1.2 VRHE, indicating that the redeposition is likely in part a chemical process. We thus conclude that the stringy deposits are chemically redeposited Pt that is driven by the reducing effects of the electron beam. These are similar to the formation of so-called pure Pt deposits (referred to as “Pt bands”) reduced by dissolved hydrogen inside fuel cell membranes.49 While most of the chemically redeposited Pt grows in the polymer matrix of the membrane, some hydrogen may make it to the cathode and deposit stringy Pt in the open pore spaces of the cathode. We see that the chemically deposited stringy Pt may be quite mobile in the pores in the cathode material during cycling.
We observed the most severe and sudden changes to the catalyst structure precisely at the transitions from the voltammetric cycling to the potentiostatic holds with chronoamperometric monitoring of the current density. The lightly attached, stringy Pt-rich deposits become loose, very mobile and detached from the catalyst support when carbon corrosion at high potentials starts to occur. They appear to move until they collide with another feature in the catalyst structure. Furthermore, the particle motion and coalescence are correlated with the applied electrode potential during both cyclings and holds, corroborating the detrimental effect of the anodic upper potentials. Thus, our in situ STEM studies evidenced how strongly platinum and nickel oxidation and dissolution accelerated with increasing upper turning potentials as predicted by the mean-field Butler–Volmer relation.50–52
In addition to the stringy Pt/Ni formation, we also observe that the initial Pt–Ni octahedral particles grow over the course of the treatment. During the potential holds at high electrode potentials, catalyst particles continued to grow and lose their shape. This may be due to redeposition by the electron beam.
Carbon corrosion is expected to become significant at potentials of +1.1 VRHE and higher (C + 4H2O → CO2 + 4H+ + 4e− (E0 = 0.21 V)44).53–55 At these high potentials (around 1.2 VRHE), we observe two types of PtNi nanoparticle motion (Movie S2, ESI†). One is that we see carbon support motion and crumpling, which may be an effect of carbon corrosion, where the catalyst nanoparticles in one region of the carbon support appear to move together as the carbon bends. The second effect is that the corrosion appears to weaken the attachment of particles on the carbon support, causing additional particle migration, coalescence and agglomeration. Both of these effects were more severe at higher potentials. We found that holding at higher potentials as opposed to potential cycling intensified and accelerated particle catalyst degradation. High potentials facilitate distinct oxidation of all catalyst components in contrast to cycling, where conditions are temporarily less corrosive at lower potentials. With the help of DEMS, we note that carbon corrosion should happen both during the cyclic sweeps to high potential, and during the potential holds (see Fig. S5 with corresponding text, ESI†). Even though corrosion is happening throughout, the high potential hold is more detrimental to the overall catalyst morphology.
Upon comparison of ex situ and in situ conditions, the ex situ conditions again were less harmful to the catalyst structure than the in situ ones (see Fig. S3, ESI†). After ex situ cycling up to +1.2 VRHE the octahedral particle shape was still clearly discernible, while edges and the corners were degraded after cycling to +1.4 VRHE. While the general trends were consistent, the impact of the applied electrode potential on the shape, particle distribution and carbon corrosion was evidently less pronounced under the ex situ conditions, which is reasonable due to the absence of electron beam driven processes.
Finally, we imaged the structural evolution of the Pt–Ni fuel cell catalysts under conditions simulating startup/shutdown and air or fuel starvation, which often cause uncontrolled potential steps in cathodic or anodic directions.56–58 To achieve that, we first applied 10 potential cycles to an elevated upper potential of +1.2 VRHE after which the electrode potential experienced a potential step to above +1.4 VRHE. The Pt–Ni nanoparticles in this experiment had only undergone the activation profile corresponding to Fig. 2.
During the 10 potential cycles to +1.2 VRHE the octahedral shape of most particles appears largely unaffected, but a few experienced coalescence with close neighboring particles (Fig. 4b–d, pink arrow) or small motions on the support (Fig. 4b–d, yellow arrow). Considering that the upper potential lies outside the window where carbon is kinetically stable, the motion and coalescence may be due to carbon support corrosion.
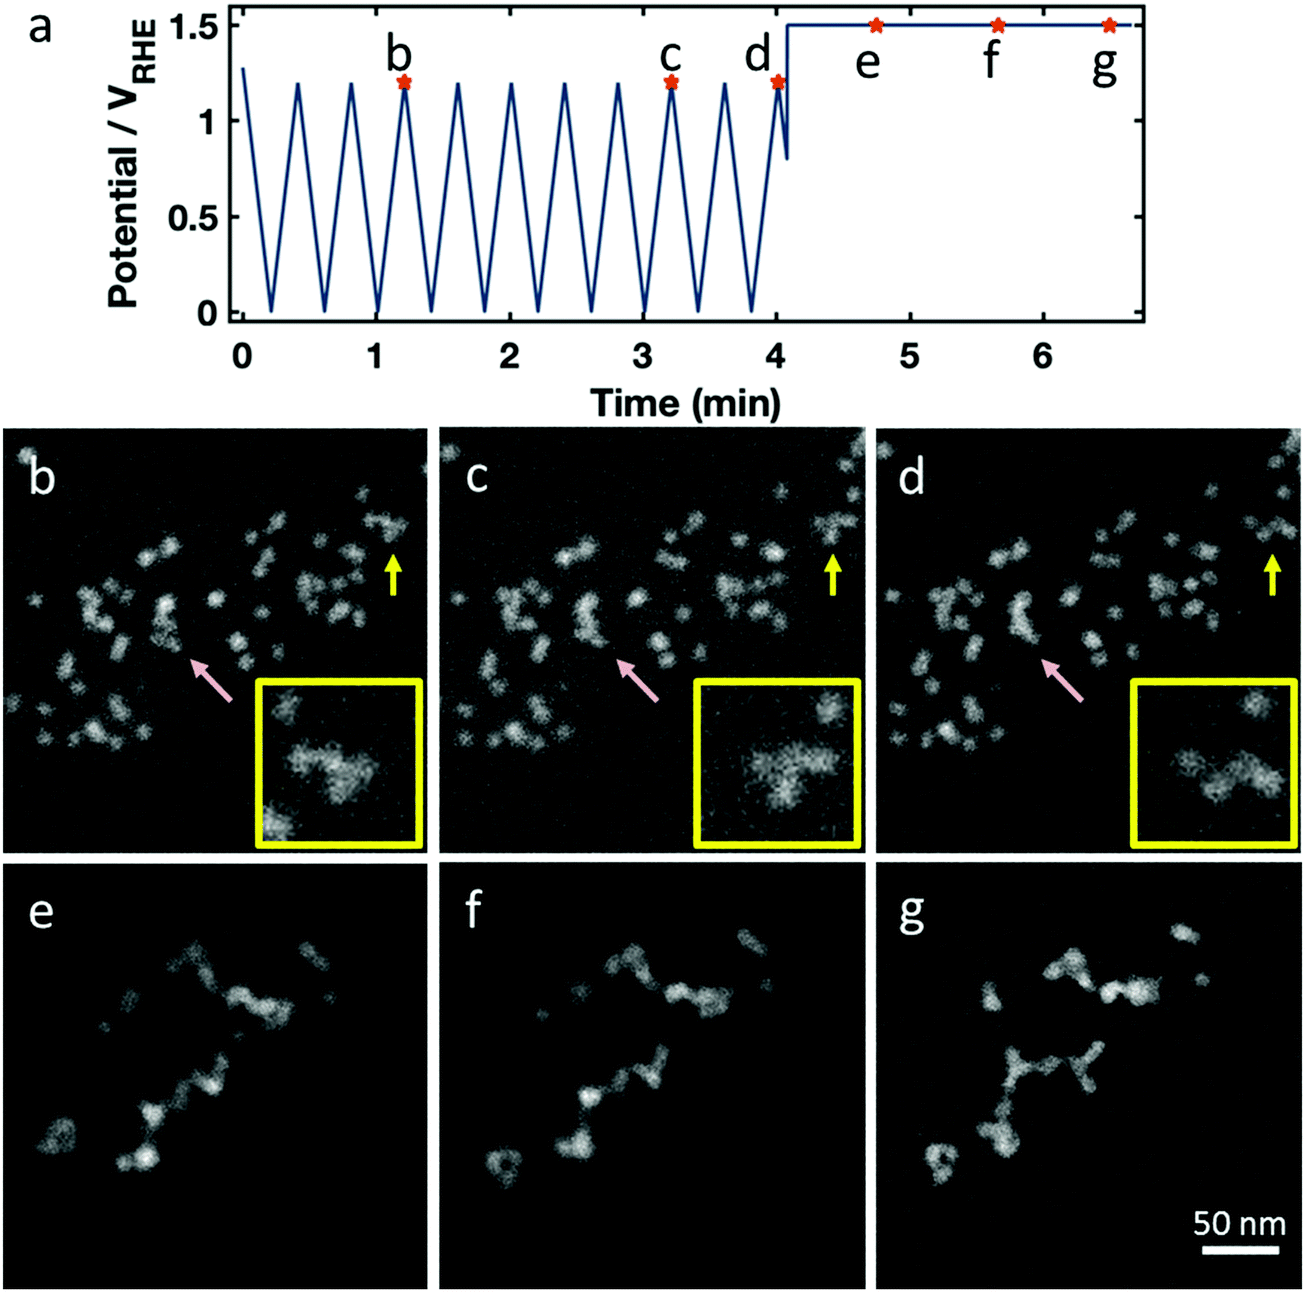 | ||
| Fig. 4 HAADF STEM in situ imaging of the catalyst structure during electrochemical potential cycling between 0.0 and +1.2 VRHE for 20 CV with 100 mV s−1 sweep rate, followed by a step into a high potential. (a) Potential profile over time with marked points corresponding to the images in (b–g). Some changes to catalyst particles are noted during cycling in (b–d) – for example, coalescence as indicated by the pink arrow and particle motion as indicated by the yellow arrow (e–g). After cycling, going to a high potential, we see dramatic coalescence, where the Pt–Ni nanoparticles agglomerate into wires. Insets in (a–c) show enlarged fractions of particles aligning on their facets. | ||
The final anodic potential step dramatically affected the global catalyst structure (Fig. 4e–g) and would have catastrophic consequences for the fuel cell performance. The particles became highly mobile on the carbon support, as shown in the images in Fig. 4 and Movie S3 (ESI†), with the majority of particles colliding on the timescale of seconds into an agglomerate with a long, branching geometry. Often, the particles appear to line up in preferred orientations – often with their edges flush – forming in straight lines or with regular angles. This suggests that they are aligning along their {111} crystal facets before fusing together (see insets Fig. 4a–c, and cartoon schematic in Fig. S3h, ESI†). We observe similar agglomeration in neighboring regions on the electrode outside the field of view, as shown in Fig. S3 (ESI†), showing that this occurred independent of beam effects. After a catastrophic, abrupt agglomeration, the catalyst particles continued to move on the carbon surface as carbon corrosion continues.
The corresponding ex situ images acquired after the same electrochemical treatment confirm the observed trends (see Fig. S4, ESI†). Although individual particles still appeared to be octahedrally shaped they agglomerated at their crystal facets. From the in situ magnification in Fig. 4, it is difficult to unambiguously identify the remaining particles as octahedral or unshaped, due to the low beam dose which is required to avoid radiation damage. All data of Fig. 3 can be inspected in Movie S3 (ESI†).
We should additionally note that the Pt–Ni particles were dispersed onto the carbon support as entire particle ensembles, that is, after their synthesis, rather than grown directly onto it, which likely resulted in weaker interactions between particles and the support compared to Pt/carbon catalysts synthesized with impregnation methods, where a Pt molecular precursor is reduced on the carbon in a dispersed state. Previous in situ TEM investigations of unshaped Pt–Co nanoparticles grown onto the support by impregnation methods found less particle migration despite extreme carbon corrosion at high potentials.59 This indicates that this failure mode may be unique to these highly active shaped nanoparticles, as it was not observed under similar conditions in past in situ studies. Because these high potential conditions may happen unintentionally in practical fuel cell devices, the ideal catalyst should also be robust under these conditions. Recent ex situ studies have shown that the choice of carbon support can dramatically reduce the rate of particle agglomeration in membrane electrode assembly devices,61,62 either by providing a stronger anchoring or by physically constraining particles in carbon pores to prevent collisions. This experiment provides a dramatic illustration of catalyst agglomeration, which points out that an important avenue of research will be in reducing the high mobility of shaped particles on the carbon support to improve their overall stability. Options for addressing this issue may be improving the chemical anchoring points that bond particles to the carbon support, or selecting carbon geometries which either improve this contact area or constrain the particle motion. Further investigations will be required to investigate how the presence of ionomer may alter the effects of carbon corrosion and particle adhesion – as this experiment was done in a liquid without ionomer or membrane.
Our findings provide a real-time visual demonstration of the catastrophic effects of uncontrolled fuel cell cathode potential excursions to values of startup/shutdown. Our results further underline the critical importance of a strict continuous upper electrode potential control. Two distinct mechanisms could contribute to the rapid coalescence at high potential: first, the instantaneous formation of Pt and Ni surface oxides induced by the abrupt anodic potential step may have lowered the particle attachment and caused enhanced mobility; more likely, however, supported by DEMS experiments, is the mechanism involving sudden corrosion and removal of the carbon support leaving Pt–Ni particles unanchored and causing strongly enhanced particle movement by surface and bulk diffusion until the detached particles have found neighboring particles to agglomerate with (Fig. S5, ESI†).
Conclusions
We have presented STEM imaging of fuel cell catalyst activation and degradation processes in an in situ electrochemical cell supported by DEMS measurements. We investigated high activity octahedral Pt–Ni nanoparticle fuel cell catalysts.40 Our in situ studies have revealed new insights into remaining key issues of low temperature fuel cell catalysts including a more detailed understanding of the degradation of octahedral PtNi alloy catalysts such as carbon support corrosion, selective dissolution of non-noble metals, catalyst particle shape degradation, and particle coarsening by coalescence and Pt redeposition. The following issues were addressed: (1) degradation processes were imaged on a time scale which allowed us to track changes happening within a few seconds (e.g., rapid and sudden changes when stepping into the constant potential and subsequent stationary agglomerated state of the particles). (2) Agglomeration along octahedral {111} facets during anodic potential steps as a result of lined up particles during potential cycling. (3) Major corrosion of the carbon support was happening during anodic stepping, not during potential cycling. It is not possible to resolve these differences in ex situ experiments. (4) By tracking the dissolution of individual Ni nanoparticles we were able to determine atomic dissolution rates as a function of time and potential cycle numbers which could provide guidelines for an optimized voltammetric activation protocol of fuel cell catalysts.In more detail: during catalyst activation, we observed the nanometer-scale reaction dynamics of a selective Ni dissolution process, observing that the Ni-rich particles become spongy before fully dissolving. The Ni dissolution process does not take place constantly but rather promptly after some electrochemical cycles. We observe that the octahedral Pt–Ni alloy catalyst remained morphologically stable during moderate potential cycling up to +1.0 VRHE, while cycling to and holding at 1.2 VRHE and 1.4 VRHE caused increasingly severe coarsening. During cyclic voltammetry to high potentials, we observed the electron beam reduction of stringy deposits similar to Pt bands caused by hydrogen cross-over in membrane electrode assemblies. At high potential holds, Pt redeposition quickly obscures the octahedral shape. Changes between potential cycling and holds cause the most severe changes in the catalyst structure. Additionally, carbon corrosion was observed to increase particle migration and coalescence, with Pt–Ni nanoparticles appearing to typically coalesce on their {111} facets.
This study dramatically visualizes the dynamics of fuel cell catalyst activation and degradation at the nanometer scale. From these results we develop a better understanding of detrimental nanoscale effects which occur under different fuel cell conditions and illustrate the urgent need for (1) more corrosion stable support materials, (2) more oxidation stable alloy configurations, and (3) the careful control of electrochemical reaction conditions.
Author contributions
All authors conceived and designed the experiments. V. B. carried out the chemical synthesis and the ex situ electrochemical experiments. M. E. H. performed the ex situ STEM experiments and in situ image and movie processing. M. E. H. and V. B. carried out the in situ STEM experiments. J. F. A. planned, performed and evaluated the DEMS experiments. All authors discussed the results, drew conclusions and participated in writing the manuscript.Conflicts of interest
There are no conflicts to declare.Acknowledgements
Financial support was given by Deutsche Forschungsgemeinschaft (DFG) grant STR 596/5-1 (“Shaped Pt bimetallics”). TEM Research at Cornell was supported by the US Department of Energy (DE-SC0019445). Elliot Padgett acknowledges support from an NSF Graduate Research Fellowship (DGE-1650441). This work made use of the Electron Microscopy Facilities at the Cornell Center for Materials Research Shared Facilities which are supported through the NSF MRSEC program (DMR-1719875). We thank John Grazul and Mariena Silvestry-Ramos for help with the electron microscopes.References
- F. Hasche, M. Oezaslan and P. Strasser, ChemCatChem, 2011, 3, 1805–1813 CAS.
- U. A. Paulus, A. Wokaun, G. G. Scherer, T. J. Schmidt, V. Stamenkovic, V. Radmilovic, N. M. Markovic and P. N. Ross, J. Phys. Chem. B, 2002, 106, 4181–4191 CrossRef CAS.
- V. R. Stamenkovic, B. Fowler, B. S. Mun, G. F. Wang, P. N. Ross, C. A. Lucas and N. M. Markovic, Science, 2007, 315, 493–497 CrossRef CAS PubMed.
- J. Zhang, H. Yang, J. Fang and S. Zou, Nano Lett., 2010, 10, 638 CrossRef CAS PubMed.
- S.-I. Choi, S. Xie, M. Shao, N. Lu, S. Guerrero, J. H. Odell, J. Park, J. Wang, M. J. Kim and Y. Xia, ChemSusChem, 2014, 7, 1476–1483 CrossRef CAS.
- L. Gan, C. Cui, M. Heggen, F. Dionigi, S. Rudi and P. Strasser, Science, 2014, 346, 1502–1506 CrossRef CAS.
- D. Banham and S. Ye, ACS Energy Lett., 2017, 2, 629–638 CrossRef CAS.
- N. Konno, S. Mizuno, H. Nakaji and Y. Ishikawa, SAE Int. J. Alt. Power, 2015, 4(1), 123–129 CrossRef.
- A. Kongkanand and M. F. Mathias, J. Phys. Chem. Lett., 2016, 7, 1127–1137 CrossRef CAS PubMed.
- C. Cui, L. Gan, M. Heggen, S. Rudi and P. Strasser, Nat. Mater., 2013, 12, 765–771 CrossRef CAS PubMed.
- V. Beermann, M. Gocyla, E. Willinger, S. Rudi, M. Heggen, R. E. Dunin-Borkowski, M.-G. Willinger and P. Strasser, Nano Lett., 2016, 16, 1719–1725 CrossRef CAS PubMed.
- A. Zana, J. Speder, M. Roefzaad, L. Altmann, M. Bäumer and M. Arenza, J. Electrochem. Soc., 2013, 160, F608–F615 CrossRef CAS.
- J. C. Meier, I. Katsounaros, C. Galeano, H. J. Bongard, A. A. Topalov, A. Kostka, A. Karschin, F. Schüth and K. J. J. Mayrhofer, Energy Environ. Sci., 2012, 5, 9319 RSC.
- F. R. Nikkuni, B. Vion-Dury, L. Dubau, F. Maillard, E. A. Ticianelli and M. Chatenet, Appl. Catal., B, 2014, 156–157, 301–306 CrossRef CAS.
- A. Zadick, L. Dubau, A. Zalineeva, C. Coutanceau and M. Chatenet, Electrochem. Commun., 2014, 48, 1–4 CrossRef CAS.
- Y. Yu, H. L. Xin, R. Hovden, D. Wang, E. D. Rus, J. A. Mundy, D. A. Muller and H. D. Abruna, Nano Lett., 2012, 12, 4417–4423 CrossRef CAS PubMed.
- A. Bergmann, E. Martinez-Moreno, D. Teschner, P. Chernev, M. Gliech, J. F. de Araujo, T. Reier, H. Dau and P. Strasser, Nat. Commun., 2015, 6, 8625 CrossRef CAS.
- M. E. Holtz, Y. Yu, D. Gunceler, J. Gao, R. Sundararaman, K. A. Schwarz, T. A. Arias, H. D. Abruña and D. A. Muller, Nano Lett., 2014, 14, 1453–1459 CrossRef CAS PubMed.
- F. Maillard, E. R. Savinova, P. A. Simonov, V. I. Zaikovskii and U. Stimming, J. Phys. Chem. B, 2004, 108, 17893–17904 CrossRef CAS.
- S. Park, Y. T. Tong, A. Wieckowski and M. J. Weaver, Langmuir, 2002, 18, 3233–3240 CrossRef CAS.
- R. Rizo, M. J. Lazaro, E. Pastor and G. Garcia, Molecules, 2016, 21(9), 1225 CrossRef PubMed.
- Q. Wang, G. Q. Sun, L. H. Jiang, Q. Xin, S. G. Sun, Y. X. Jiang, S. P. Chen, Z. Jusys and R. J. Behm, Phys. Chem. Chem. Phys., 2007, 9, 2686–2696 RSC.
- B. Abécassis, F. Testard, O. Spalla and P. Barboux, Nano Lett., 2007, 7, 1723–1727 CrossRef PubMed.
- F. Zheng, S. Alayoglu, J. Guo, V. Pushkarev, Y. Li, P.-A. Glans, J.-L. Chen and G. Somorjai, Nano Lett., 2011, 11, 847–853 CrossRef CAS PubMed.
- N. de Jonge and F. M. Ross, Nat. Nanotechnol., 2011, 6, 695–704 CrossRef CAS PubMed.
- M. J. Williamson, R. M. Tromp, P. M. Vereecken, R. Hull and F. M. Ross, Nat. Mater., 2003, 2, 532–536 CrossRef CAS PubMed.
- F. M. Ross, Liquid Cell Electron Microscopy, Cambridge University Press, 2017 Search PubMed.
- H. M. Zheng, R. K. Smith, Y. W. Jun, C. Kisielowski, U. Dahmen and A. P. Alivisatos, Science, 2009, 324, 1309–1312 CrossRef CAS PubMed.
- R. R. Unocic, R. L. Sacci, G. M. Brown, G. M. Veith, N. J. Dudney, K. L. More, F. S. Walden, D. S. Gardiner, J. Damiano and D. P. Nackashi, Microsc. Microanal., 2014, 20, 452–461 CrossRef CAS PubMed.
- G.-Z. Zhu, S. Prabhudev, J. Yang, C. M. Gabardo, G. A. Botton and L. Soleymani, J. Phys. Chem. C, 2014, 118, 22111–22119 CrossRef CAS.
- N. Hodnik, G. Dehm and K. J. Mayrhofer, Acc. Chem. Res., 2016, 49, 2015–2022 CrossRef CAS PubMed.
- S. Nagashima, K. Yoshida, T. Hiroyama, K. Liu, Y. Kang, T. Ikai, H. Kato, T. Nagami and K. Kishita, Microsc. Microanal., 2015, 21, 1295–1296 CrossRef.
- M. E. Holtz, Y. Yu, J. Rivera, H. D. Abruña and D. A. Muller, Microsc. Microanal., 2015, 21, 1509–1510 CrossRef.
- H. Kato, SAE Int. J. Alt. Power, 2016, 5(1), 189–194 CrossRef.
- Z. Zeng, W. I. Liang, Y. H. Chu and H. Zheng, Faraday Discuss., 2014, 176, 95–107 RSC.
- S. Khan, A. Gupta, N. C. Verma and C. K. Nandi, Nano Lett., 2015, 15, 8300–8305 CrossRef CAS PubMed.
- M. Gu, L. R. Parent, B. L. Mehdi, R. R. Unocic, M. T. McDowell, R. L. Sacci, W. Xu, J. G. Connell, P. Xu, P. Abellan, X. Chen, Y. Zhang, D. E. Perea, J. E. Evans, L. J. Lauhon, J. G. Zhang, J. Liu, N. D. Browning, Y. Cui, I. Arslan and C. M. Wang, Nano Lett., 2013, 13, 6106–6112 CrossRef CAS PubMed.
- R. R. Unocic, X. G. Sun, R. L. Sacci, L. A. Adamczyk, D. H. Alsem, S. Dai, N. J. Dudney and K. L. More, Microsc. Microanal., 2014, 20, 1029–1037 CrossRef CAS PubMed.
- B. T. Riley, O. Ilyichova, M. G. Costa, B. T. Porebski, S. J. de Veer, J. E. Swedberg, I. Kass, J. M. Harris, D. E. Hoke and A. M. Buckle, Sci. Rep., 2016, 6, 35385 CrossRef CAS PubMed.
- V. Beermann, M. Gocyla, S. Kuehl, E. Padgett, H. Schmies, M. Goerlin, N. Erini, M. Shviro, M. Heggen, R. E. Dunin-Borkowski, D. Muller and P. Strasser, J. Am. Chem. Soc., 2017, 139(46), 16536–16547 CrossRef CAS PubMed.
- M. E. Holtz, Y. C. Yu, J. Gao, H. D. Abruna and D. A. Muller, Microsc. Microanal., 2013, 19, 1027–1035 CrossRef CAS PubMed.
- L. Zheng, J. Sun, L. Xiong, R. Jin, J. Li, X. Li, D. Zheng, Q. Liu, L. Niu, S. Yang and J. Xia, Fuel Cells, 2010, 10, 384–389 CrossRef CAS.
- S. Rudi, L. Gan, C. Cui, M. Gliech and P. Strasser, J. Electrochem. Soc., 2015, 162, F403–F409 CrossRef CAS.
- P. Vanysek, Electrochemical Series, CRC Press LLC, 2000 Search PubMed.
- A. O. Filmer, J. South Afr. Inst. Min. Metall., 1981, 74–84 CAS.
- V. Grozovski, J. Solla-Gullon, V. Climent, E. Herrero and J. M. Feliu, J. Phys. Chem. C, 2010, 114, 13802–13812 CrossRef CAS.
- S. Rudi, X. Tuaev and P. Strasser, Electrocatalysis, 2012, 3, 265–273 CrossRef CAS.
- N. M. Schneider, M. M. Norton, B. J. Mendel, J. M. Grogan, F. M. Ross and H. H. Bau, J. Phys. Chem. C, 2014, 118, 22373–22382 CrossRef CAS.
- Y. Shao-Horn, E. F. Holby, W. C. Sheng and D. Morgan, Energy Environ. Sci., 2009, 2, 865–871 RSC.
- S. Cherevko, A. R. Zeradjanin, G. P. Keeley and K. J. J. Mayrhofer, J. Electrochem. Soc., 2014, 161, H822–H830 CrossRef.
- S. Cherevko, G. P. Keeley, S. Geiger, A. R. Zeradjanin, N. Hodnik, N. Kulyk and K. J. J. Mayrhofer, ChemElectroChem, 2015, 2, 1471–1478 CrossRef CAS PubMed.
- A. A. Topalov, I. Katsounaros, M. Auinger, S. Cherevko, J. C. Meier, S. O. Klemm and K. J. J. Mayrhofer, Angew. Chem., Int. Ed., 2012, 51, 12613–12615 CrossRef CAS PubMed.
- D. A. Stevens, M. T. Hicks, G. M. Haugen and J. R. Dahn, J. Electrochem. Soc., 2005, 152, A2309–A2315 CrossRef CAS.
- R. Makharia, S. Kocha, P. Yu, M. A. Sweikart, W. Gu, F. Wagner and H. A. Gasteiger, ECS Trans., 2006, 1, 3–18 CAS.
- J. Willsau and J. Heitbaum, J. Electroanal. Chem., 1984, 161, 93–101 CrossRef CAS.
- N. Zamel, R. Hanke-Rauschenbach, S. Kirsch, A. Bhattarai and D. Gerteisen, Int. J. Hydrogen Energy, 2013, 38, 15318–15327 CrossRef CAS.
- A. Rabis, P. Rodriguez and T. J. Schmidt, ACS Catal., 2012, 2, 864–890 CrossRef CAS.
- T. Mittermeier, A. Weiß, F. Hasché, G. Hübner and H. A. Gasteiger, J. Electrochem. Soc., 2017, 164(2), F127–F137 CrossRef CAS.
- Y. Yu, M. E. Holtz, H. L. Xin, D. Wang, H. D. Abruña and D. A. Muller, Microsc. Microanal., 2013, 19, 1666–1667 CrossRef.
- L. Gan, M. Heggen, R. O'Malley, B. Theobald and P. Strasser, Nano Lett., 2013, 13, 1131–1138 CrossRef CAS PubMed.
- B. T. Sneed, D. A. Cullen, K. S. Reeves, O. E. Dyck, D. A. Langlois, R. Mukundan, R. L. Borup and K. L. More, ACS Appl. Mater. Interfaces, 2017, 9, 29839–29848 CrossRef CAS PubMed.
- E. Padgett, V. Yarlagadda, M. E. Holtz, M. Ko, B. D. A. Levin, R. S. Kukreja, J. M. Ziegelbauer, R. N. Andrews, J. Ilavsky, A. Kongkanand and D. A. Muller, J. Electrochem. Soc., 2019, 166, F198–F207 CrossRef CAS.
Footnotes |
| † Electronic supplementary information (ESI) available: Experimental procedures, HAADF STEM images for beam damage comparison, ex situ STEM images, in situ and ex situ electrochemical data, differential electrochemical mass spectral data, and HAADF STEM Movies S1–S3. See DOI: 10.1039/c9ee01185d |
| ‡ These authors contributed equally to this work. |
| This journal is © The Royal Society of Chemistry 2019 |