 Open Access Article
Creative Commons Attribution 3.0 Unported Licence
The mechanism of monochloramine disproportionation under acidic conditions†
Péter Pál
Fehér
 ab,
Mihály
Purgel
 a,
Adrienn
Lengyel
c,
András
Stirling
 *b and
István
Fábián
 *cd
*cd
aDepartment of Physical Chemistry, University of Debrecen, Egyetem tér 1, Debrecen H-4032, Hungary
bResearch Centre for Natural Sciences, Hungarian Academy of Sciences, Magyar tudósok körútja 2, Budapest H-1117, Hungary. E-mail: stirling.andras@ttk.hu
cDepartment of Inorganic and Analytical Chemistry, University of Debrecen, Egyetem tér 1, Debrecen H-4032, Hungary. E-mail: ifabian@science.unideb.hu
dMTA-DE Redox and Homogeneous Catalytic Reaction Mechanisms Research Group, Egyetem tér 1, Debrecen, H-4032 Hungary
First published on 28th October 2019
Abstract
Monochloramine is a widely employed agent in water treatment technologies. However, its utilization has some drawbacks like the transformation of the active species into the undesired dichloramine. Although it is more pronounced in acidic solutions, the features of this reaction have still remained largely unexplored in the pH < 4 region. In this study the decomposition of monochloramine is examined under such conditions by using kinetic and computational methods. Fast kinetics measurements have convincingly showed that the disproportion into dicloramine is relatively fast and can be studied without any interference from side reactions. By varying the pH, the deprotonation constant of monochloramine has been determined by UV spectroscopy (Ka = 0.023 ± 0.005 M for I = 1.0 M NaClO4, and T = 25.0 °C). Dichloramine formation via monochloramine disproportion was found to follow second-order kinetics. The computations have provided the reaction mechanism and its free energy profile in accord with the proposed kinetic model. This involves the reaction between the protonated and unprotonated forms of monochloramine, with a rate constant k = 335.3 ± 11.8 M−1 s−1, corresponding to an activation free energy barrier of 14.1 kcal mol−1. The simulations predicted a barrier of 14.9 kcal mol−1 and revealed a key short-lived chlorine-bridged intermediate which yields dichloroamine and ammonium ion through a deprotonation-coupled chlorine shift.
Introduction
Chlorination is the most extensively used disinfection method to produce potable water all over the World. Chlorine is involved in a hydrolytic equilibrium and the active form of the disinfectant can be either Cl2 or HOCl.1| Cl2 + H2O ⇌ HOCl + H+ + Cl− | (1) |
In the presence of amino compounds, chloramines are formed which may have significant secondary disinfection effects, and the toxicological impact of these compounds as well as the byproducts formed during their decomposition is of primary concern. In addition, the presence of chloramines may lead to odor and taste issues in drinking water.2,3 In the case of ammonia, various chloramines may form depending on the chlorine dosage and pH.4
| NH3 + HOCl ⇌ NH2Cl + H2O | (2) |
| NH2Cl + HOCl = NHCl2 + H2O | (3) |
| NHCl2 + HOCl = NCl3 + 3H2O | (4) |
The formation of chloramines reduces the efficiency of the primary chlorination process because chloramines are less reactive than chlorine or hypochlorous acid. However, they survive longer in water pipes providing a secondary disinfection effect and due to the lower reactivity, smaller amounts of regulated disinfection byproducts are produced.5 For this reason, dosing ammonia during chlorination processes leads to the formation of monochloramine, and water plants are able to comply with stricter environmental standards.6–8 There are however, still concerns about the formation of strong carcinogens like N-nitrosodimethylamine (NDMA),9–15 or the possible violent decomposition of trichloramine at high concentrations according to eqn (5), a reaction that is also utilized in breakpoint chlorination.4
| 2NCl3 + 3H2O = N2 + 3HOCl + 3Cl− + 3H+ | (5) |
Furthermore, the insertion of more than one chlorine atom into ammonia should be avoided as the resulting di- and trichloramines lack the necessary oxidative ability and have lower concentration thresholds for bad taste and odor.4 Under acidic conditions (pH ≈ 3–4), the acid catalyzed disproportionation of monochloramine (eqn (6)) occurs, which is a relatively fast process.16,17
| 2NH2Cl + H+ ⇌ NHCl2 + NH4+ | (6) |
Earlier, it was established that the disproportionation of NH2Cl is general acid catalyzed.18,19 While the reactivity of monochloramine has been explored in the neutral pH region (pH ≈ 6.5–8.4) in detail,19 the decomposition of this compound has not yet been investigated under more acidic conditions.20,21 For instance, in ref. 18 the authors compiled a detailed mechanism for the chlorination of ammonia on the basis of previous literature results. The model includes equilibrium steps, substitution reactions by HOCl as well as disproportionation reactions of NH2Cl and several other reactions between various chloramines. The validity of the model was tested in the pH range of 6–8 at different concentration ratios of ammonia and HOCl. The study has convincingly demonstrated that the model is sufficient for phenomenological description of the chlorination of ammonia. However, a detailed mechanistic interpretation of the individual reaction steps has not been given.
In this study we address the kinetics and mechanism of the decomposition of NH2Cl using experimental kinetic and molecular modelling approaches. The experiments include highly acidic conditions (from pH = 1). There are important reasons to go beyond the environmentally relevant pH range: (i) to obtain reliable results for chloramine chemistry, especially for the chemistry of the protonated chloramine species, we need to look into the kinetics at low pH where the protonated forms can be accurately measured; (ii) for an accurate and general kinetic model we need to include observations from a wider pH-range covering low and high concentrations of all the relevant species; (iii) the results can also be of interest for designing or interpreting future experiments involving chloramine chemistry either within or outside water treatment contexts. It is important to emphasize that dichloramine is somewhat stabilized under acidic conditions and its very slow formation from monochloramine presumably begins already at neutral pH. Under such conditions, the control of pH requires the use of buffers which may trigger additional reactions path in the decomposition of NHCl2.19 Earlier results on the rate constant of the acid catalyzed reaction path were obtained by extrapolation considering various other reaction steps by modeling water in distribution systems. This introduced uncertainties in the estimated rate constants. In order to avoid any complications, buffers were not used in the present study and we assume that the results obtained at low pH also valid under slightly acidic – neutral conditions. In addition, this subject is highly relevant with respect to predicting the fate of the residual chloramine of drinking water in the acidic gastric fluid.22 The decomposition was studied by the stopped-flow method and the process was also modelled using ab initio molecular dynamics. In these calculations, water molecules were included explicitly. As it has been shown earlier, when the solvent plays a dual role, i.e. it is a reactant and solvating medium, then a proper description of the reacting system necessitates the use of explicit solvent models.23 These calculations are however computationally very demanding, thus we limited the number of the simulations and also performed static quantum mechanical calculations for additional insights. The combination of experiment and theory provides not only a plausible mechanistic picture for the disproportion reaction but valuable feedback to the experimental work as well. In particular, a new kinetic model has been derived from the measurements with extended pH range and unfavorable reactions could be excluded.
Materials and methods
Chemicals
The measurements were carried out using chloride-free NaOCl solutions which were prepared as described earlier.24,25 According to our earlier observations, the chlorination reactions are markedly affected by the presence of chloride ion under acidic conditions. This is due to the formation of Cl2 in an equilibrium process involving HOCl, because chlorine has the tendency to react with amines much faster than HOCl. The experiments include highly acidic conditions (from pH = 1). The ionic strength was set to 1.0 M using NaClO4 which was prepared by reacting Na2CO3 and HClO4 (Reanal).26 On the basis of the transition state theory,27 we can conclude that the selected 1.0 M ionic strength has only very limited effect on the kinetics of the reaction of two NH3Cl+ ions. The monochloramine solutions were prepared with analytical grade NH4SO4 (Spektrum 3D). All stock solutions and samples were prepared with water obtained from a Milli-Q RG (Millipore) purifying system.Instrumentation
Iodometric titrations were made with a Metrohm 721 Tinet Titrino titrating unit equipped with a Metrohm 6.0202.000 platinum combination electrode. The pH of the samples was measured with a Radiometer PHM 85 Precision PH meter equipped with a Metrohm 6.0234.000 combination glass electrode. The read out of the pH meter was converted to pH = −lg[H+] according to the method of Irving et al.28 Spectrophotometric measurements were made with a Lambda 2S UV/VIS (PerkinElmer) spectrophotometer. Fast kinetic experiments were made with an SX-18MV (Applied Photophysics) stopped-flow instrument. Rate constants were obtained by fitting the average of at least three kinetic runs using a non-linear least squares method (see ESI† for details). Fast time dependent spectra were constructed from the individual kinetic traces obtained at various wavelengths by using the dedicated software of the stopped-flow instrument. The kinetic traces were fitted with the controlling software of the stopped-flow instrument. Nonlinear least-squares data fitting was made with the program package OriginPro 2018b.29Computational details
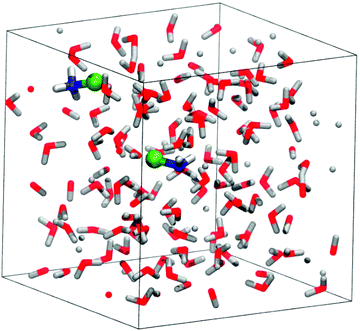
For the static calculations, we used the Gaussian09 software package,30 and the B2PYLP exchange correlation functional with empirical dispersion corrections including Becke–Johnson damping (D3BJ).31,32 This functional is of double hybrid type containing MP2 correlation and is commonly used as a benchmark for other DFT functionals due to its good performance.33–37 The 6-311+G(d,p) all-electron basis was used for every atom.38–40 To account for solvation in the static calculations, the implicit SMD solvent model41 was employed. For the energy profiles obtained by static calculations the implicit solvent model was further augmented with explicit solvent molecules (microsolvation). The structures were always optimized in the solvent cavity. To verify the validity of the minima and TS structures, vibrational analysis and intrinsic reaction coordinate (IRC) calculations were performed. The discussions are based on Gibbs free energy differences.The periodic model employed for the molecular dynamics simulations is shown in Fig. 1. It contains 128 water molecules, two monochloramines (MCAs) and one or two additional protons. The extra protons were initially placed on the nitrogen atoms to have protonated monochloramines (HMCAs) accounting for the MCA + HMCA and HMCA + HMCA reactions. All the molecules are situated in a cubic box with an edge length of 15.820 Å in accord with the expected density of the system. In the calculations the box is replicated in every direction using periodic boundary conditions. The simulations were carried out using the Quickstep method as implemented in the CP2K software.42 We have used the PBE functional with the D3 dispersion corrections.43 A hybrid Gaussian-plane wave (GPW) scheme was employed, where the valence electrons have been described by the TZVP basis set of CP2K, whereas the electron densities were expanded over a plane-wave set with 400 Ry cutoff.44,45 The atomic cores were described by the GTH pseudopotentials.46–48 NVT ensembles at 300 K were simulated using the CSVR thermostat.49 The integration time step was 0.5 fs. Details of the employed free energy methods50,51 can be found in the ESI.†
Results and discussion
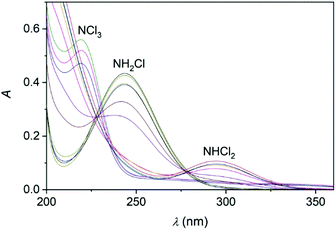
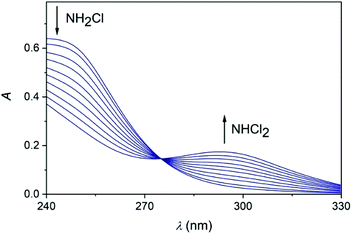
Upon mixing appropriate aliquots of (NH4)2SO4 and HOCl solutions, monochloramine (NH2Cl) is immediately formed which is stable for an extended period of time under slightly alkaline condition, λmax = 243 nm. The titration of this solution with perchloric acid is associated with characteristic spectral changes in the UV region. Two new absorbance bands appear in the acidic region (below pH 5) at 294 and 220 nm which are assigned to the formation of NHCl2 and NCl3, respectively (Fig. 2).52,53 It should be added that the sole purpose of these experiments was to demonstrate the formation of these species. Dosing the titration solution at different time intervals does not allow to draw conclusions regarding the kinetics of the related reactions. As the titration proceeds, the irreversible decomposition of NCl3 becomes increasingly important and leads to the decay of the characteristic UV band at 220 nm.Earlier it was proposed that chloramines convert of into each other in equilibrium processes.54 However, the back-titration of the acidic solution with NaOH does not yield the original amount of NH2Cl indicating that irreversible reactions also occur in this system (see also ref. 18). Presumably, one of these processes is the decomposition of NCl3, however other auto decomposition reactions can also play a role in the slow decay of the concentration of NH2Cl.19 It was assumed before that dichloramine may reform monochloramine or react with excess ammonia.19 However, these reactions are not relevant under the conditions applied here. Thus, only the subsequent slow conversion of DCA into TCA has significance, which proceeds for several hours (Fig. S1 in ESI†). To explore the conversion of various chloramines into each other, kinetic measurements were performed. The time resolved spectra (Fig. 3) obtained after the acidification of an MCA solution indicates the rapid formation of DCA. Fig. 3 also features a well-defined isosbestic point, proving that side reactions do not interfere with the main process on a timescale of a few minutes.
The kinetics of the formation of DCA from MCA was systematically studied at 250 and 300 nm by the stopped-flow method. Slightly alkaline solutions of MCA were mixed with perchloric acid solutions to set different pH values for the reaction.
As shown in Fig. 4, the kinetic traces feature a sudden initial absorbance drop (ΔA) which is consistent with an extremely fast reaction completed within the mixing regime of the experiment. It is well known that proton transfer reactions proceed at a diffusion-controlled rate and complete within the dead-time of the stopped flow method under acidic conditions. Thus, we attribute this effect to the protonation of MCA.
 | (7) |
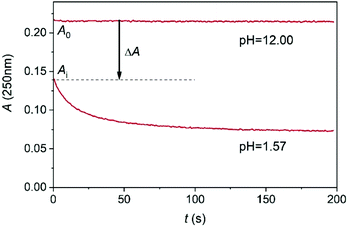 | ||
| Fig. 4 A typical stopped flow trace of the conversion of MCA into DCA at 250 nm. c0MCA = 1.664 × 10⁻³ mol dm−3. I = 1.0 M (NaClO4), T = 25.0 °C. | ||
The initial absorbance after the jump, Ai, can be expressed as follows
 | (8) |
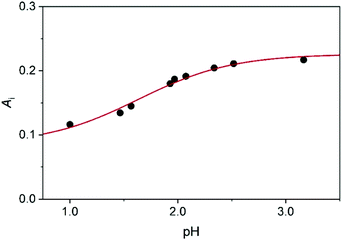 | ||
| Fig. 5 The initial absorbance as a function of pH: experimental data (dots) and fitted curve (red line) using eqn (4). c0MCA = 1.005 × 10⁻³ mol dm−3, I = 1.0 M (NaClO4), T = 25.0 °C. | ||
The transformation of MCA into DCA was followed by monitoring either the decay of MCA (250 nm) and the formation of DCA (300 nm). The reaction is a second order process and fitting the traces with the appropriate rate expression yields the pH-dependent pseudo-second order rate constant, kapp. As shown in Fig. 6, the rate constants obtained at the two wavelengths agree reasonably well and kapp increases with decreasing pH. Such a characteristic pH profile implies that the protonated form of MCA is active in the reaction. In accordance with the observations, we propose that the reaction proceeds as given in eqn (9).
 | (9) |
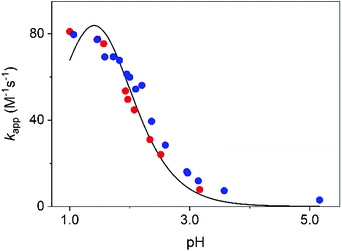 | ||
| Fig. 6 The pseudo second order rate constant, kapp, as a function of pH. Experimental results at 250 nm (red dots) and 300 nm (blue dots) and the fitted curve using eqn (10). I = 1.0 M (NaClO4), T = 25.0 °C. | ||
Theoretically, the reaction between two protonated MCA-s may also be operative. However, the encounter of two positively charged particles is not favorable and such a reaction path is expected to be negligible for all practical purposes. The acid–base equilibrium between the two forms of MCA is established at a diffusion-controlled rate, thus, eqn (7) should be treated as a fast preequilibrium of reaction (9). Accordingly, the pH dependence of kapp is given by eqn (10).
 | (10) |
The experimental rate constants can be fitted with eqn (10) reasonably well (Fig. 6), yielding the following estimates for the fitted parameters: Ka = 0.039 ± 0.003 M, k = 335.4 ± 11.8 M−1 s−1. Earlier, Jafvert and Valentine reported kh = 2.5 × 10⁷ M−2 h−1 for the third order acid catalyzed decomposition of MCA.18 By converting our results, we obtain kh = k/Ka = 3.1 × 10⁷ M−2 h−1. Considering the different experimental conditions in the two studies, the corresponding rate constants are in excellent agreement.
The Ka values obtained from fitting the initial absorbances and the kinetic data differ somewhat. However, such a difference is still acceptable by considering the experimental limitations. A thorough statistical analysis of the fitting process reveals that the extension of these studies to a more acidic pH range would perhaps provide a better basis for estimating Ka. However, at pH < 1.0 additional medium effects contribute to the overall process due to the relatively high acidity even at constant ionic strength. It is noteworthy, that refitting the data by fixing Ka at 0.023 M, yields only an about 10% smaller estimate for the rate constant, k = 296.9 ± 13.1 M−1 s−1. In other words, the experimental studies provide appropriate description of the studied system. Nevertheless, theoretical studies are expected to offer a more detailed insight into the mechanism of the decomposition of MCA into DCA. Therefore, we investigated theoretically the mechanism of the reaction in terms of elementary steps and the associated free energy profiles.
First, we discuss the gas-phase calculations. Here we have considered eight possible reactions which are collected in Table 1 along with the calculated ΔGr values. For both the MCA + HMCA and HMCA + HMCA reactions, the main products are DCA and NH4+ in the thermodynamically favorable routes (entries 3 and 7). The formation of the ammonium ion can be identified as the driving force behind the disproportion. Indeed, comparison of the reactions with and without NH4+ as product clearly supports this observation. There are also other, thermodynamically accessible states, like the Cl-bridged one (entries 1 and 5), which is a potential intermediate for DCA formation; or entry 8, which can be a viable initial step in the HMCA + HMCA reaction to avoid the strong coulombic repulsion between the two HMCAs. In fact, as we show later, the calculations could not locate other route for reaction (8).
| Reactant | Product | ΔGr (kcal mol−1) | |
|---|---|---|---|
| 1 | NH2Cl + NH3Cl+ | ClH2N⋯Cl–NH3+ | +2.6 |
| 2 | NH2Cl2+ + NH3 | +19.4 | |
| 3 | NHCl2 + NH4+ | −16.9 | |
| 4 | NH3Cl+ + NH3Cl+ | NH2Cl2+ + NH4+ | +1.9 |
| 5 | ClH2N⋯Cl–NH3+ + H+ | +1.0 | |
| 6 | NH2Cl2+ + NH3 + H+ | +17.8 | |
| 7 | NHCl2 + NH4+ + H+ | −18.6 | |
| 8 | NH2Cl + NH3Cl+ + H+ | −1.7 |
Chemical intuition and also our results indicate that the disproportion involves a Cl-bridged dimer intermediate. Subsequent intramolecular Cl migration yields a NH2Cl2+ ion. This state must be short-lived as evidenced by its high formation energy in Table 1 (e.g. entry 2). The system is stabilized by simultaneous or successive proton transfer to the solvent and eventually to the nearby NH3 to reach the most favorable situations displayed in Table 1. To model these steps, we had to include explicit solvent molecules in the computational model as temporary proton acceptors or proton shuttles. Such approaches have been successful in several earlier studies.55–57 We have constructed models with three water molecules in analogy with models of ref. 55. The calculated free energy profiles are shown in Fig. 7.
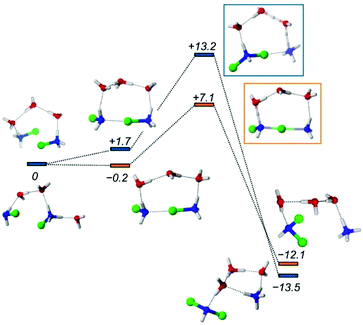 | ||
| Fig. 7 Energy profile of the disproportionation of MCA. Orange and blue markers show the MCA + HMCA and HMCA + HMCA pathways, respectively. The numbers in italics represent the relative Gibbs free energy values in kcal mol−1. For the molecular models, the following coloring scheme is used: blue: N, red: O, green: Cl, white: H. For further details of the profiles see the ESI.† | ||
The formation of the halogen bond between the monomers is slightly exergonic. The energy drop compared to the first entry of Table 1 is most likely due to the water bridge, or simply the more favorable arrangement of the solvent compared to the reactant state. From this dimer the reaction may proceed via a transition state at +7.1 kcal mol−1, where the chlorine accepting nitrogen atom gets deprotonated. Then the dimer breaks and the proton is transferred to the ammonia to give the final products. Fig. 7 also shows the reaction between two HMCAs in accordance with entry 5 in Table 1. The TS here is different because the already protonated water cluster cannot take a proton away from the dimer like in the MCA + HMCA reaction. Instead, the HMCA in the dimer gets protonated and simultaneously transfers the Cl+ yielding a dissociated ammonium ion. Then the spontaneous deprotonation of the transient HDCA (protonated dichloramine) occurs as the thermodynamics in Table 1 suggests. The corresponding activation barrier of +13.2 kcal mol−1 however, is considerably higher than the +7.1 kcal mol−1 value calculated for the other pathway. Clearly the cluster models employed here can provide valuable insights into the reactivity of MCA, but they suffer from a couple of problems: their limited size and arbitrariness in the number and arrangements of the solvent molecules. These drawbacks can be eliminated by extending the model significantly and sampling the solvation configurations properly.
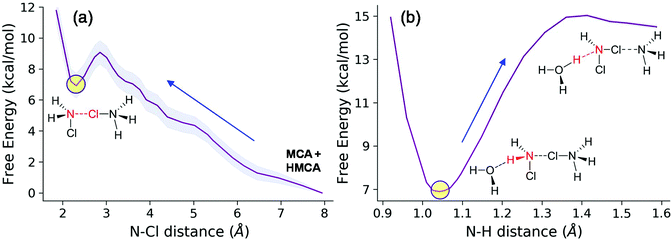
We therefore carried the simulations a step further and performed calculations on extended models where the solvent water is included fully explicitly. To sample the astronomically large configurational space we performed ab initio molecular dynamics calculations. In this way we can recover solvent–solute interactions missing from the cluster-models and also take into account more accurately the configurational entropy contributions. We started from a separated MCA − HMCA pair and calculated the free energy profile of their dimer formation reaction (Fig. 8a). The reaction coordinate was the distance between the N atom of the MCA molecule and the Cl atom of the HMCA ion. The free energy profile has been obtained by thermodynamic integration as described in the ESI.†
This process is endergonic by 6.9 ± 1.0 kcal mol−1, with a relatively low activation barrier lying close to the dimer state, at 9.0 ± 1.0 kcal mol−1. In the minimum at 2.31 Å we see the dimer cation. We have extensively sampled this peculiar intermediate by four independent NVE simulations which combined represent a 32 ps trajectory. The distribution of the three N–Cl distances obtained in this way are shown in Fig. 9. The sharpest peak around 1.77 Å belongs to the covalent N–Cl bond of the original MCA molecule. The other two peaks are associated with the linking chlorine atom: the one at 1.92 Å corresponds to the N–Cl bond of the original HMCA ion, whereas the wider one corresponds to the weak N–Cl bond holding the dimer together. This halogen-bond has a less pronounced equilibrium distance around 2.26 Å.
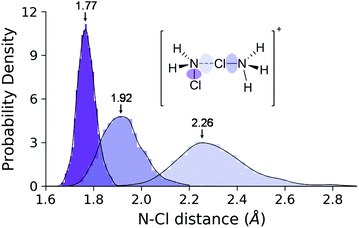 | ||
| Fig. 9 Distance distributions of the three N–Cl bond types in the dimer ensemble. The envelope curves are the approximate probability density functions obtained via kernel density estimation. | ||
During the simulations we incidentally observed dimer dissociation via proton transfer to nearby water molecules which resulted in Cl transfer to the MCA moiety of the dimer and the formation of protonated DCA and NH3. Pursuing this line, we then sampled the system along the reaction coordinate describing the proton transfer from the MCA moiety to the solvent (distance between atom N and the dissociating H). The free energy profile (Fig. 8b) shows that this process requires an additional 8.0 kcal mol−1 free energy investment. This implies that the deprotonation is the rate determining step with 14.9 kcal mol−1 relative to the isolated reactants.58 This magnitude of activation free energy barrier is in full accord with the experimentally observed reaction times. In fact, using the transition state theory (TST),27 we obtain a theoretical rate constant of 72.4 s−1 which is in excellent agreement with the calculated 335.3 s−1 taking into account the fact that 1 kcal mol−1 differences in the barrier is equivalent to a 5.4-fold change in the rate. In terms of activation free energy barriers, we compare the theoretical 14.9 kcal mol−1 with the barrier of 14.1 kcal mol−1 compiled from the experimental rate constant. The latter comparison also shows that experiment and theory are in nice accord. The product of this step is an intermediate DCA⋯NH3 complex with a protonated water molecule nearby. Further unbiased simulations of a few hundreds of fs then yield the final DCA + NH4+ state via proton transfers between solvent water molecules. This could be also seen in the committor analysis when sufficiently long trajectories also produced the ammonium ion. This behavior is in line with the expected barrier for proton hopping in water which is in the range of the accessible thermal fluctuations with the present methodology.59–61
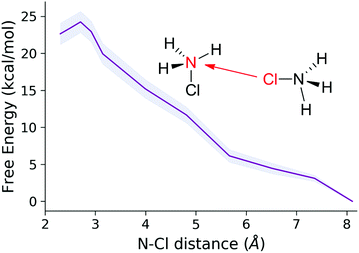
Next, we turned to the reaction between two HMCAs, and employed the same methodology. The energy profile of the N–Cl distance sampling (Fig. 10) however shows that this process must overcome a considerably larger barrier compared to the MCA + HMCA case. The system also reaches the Cl-bonded intermediate (minimum around 2.5 Å), but when the reactants come into close vicinity a proton transfer occurs from one of the ions. This indicates that in fact the original MCA + HMCA reaction takes place at distances smaller than 3 Å. However, at variance with the earlier reaction, here a ca. 20 kcal mol−1 free energy investment is necessary to bring the reactants in sufficient proximity to overcome the coulombic repulsion between the two cations. The high barrier indicates that the rate of the reaction between two HMCA ions is negligible as compared to that of the MCA + HMCA reaction.
Conclusions
In summary, we have explored the disproportion of monochloramine that takes place below pH = 5. It has been shown that the conversion of MCA into DCA occurs in a second order process which includes both the protonated and unprotonated forms. The pH dependence of the pseudo-second-order rate constant is conveniently interpreted by considering the acid–base equilibrium of MCA. Theoretical calculations showed that the only kinetically accessible pathway is the MCA + HMCA reaction. The proposed mechanism consists of two steps; the first is the formation of the ClH2N⋯Cl–NH3+ halogen bonded dimer which is followed by a deprotonation induced chlorine shift to produce DCA and an ammonium ion. We found the second step as rate determining with an activation barrier of 14.9 ± 1.0 kcal mol−1 which is fully in accord with the reaction times observed experimentally.62 The mechanistic picture derived from computations is consistent with the pre-equilibrium kinetic approach, from which the kapp fitting curves can be derived. Agreement between kinetic model and experiment can be further improved if both the deprotonation constant of MCA and the rate constant were varied. The calculations also revealed the structure of the key transient complex along the route toward DCA. This loose dimer is kept together by a weak halogen-bond. We speculate that appropriate substitution on the MCA counterparts could lead to an experimentally detectable stabilization of this complex which lends itself to further kinetics studies. From a more general methodology perspective it has also been demonstrated that the present combination of experiment with computational modelling has been proved to be synergistic and may boost further similar studies where computational insights can complete and explain the experimental models.Conflicts of interest
There are no conflicts to declare.Acknowledgements
The authors thank the Hungarian Science Foundation (K_17-124983) and the National Research, Development and Innovation Office (NKFIH grant no. 116034) for financial support. The research was supported by the EU and co-financed by the European Regional Development Fund under the project GINOP-2.3.2-15-2016-00008. We acknowledge the computational resources of KIFÜ.Notes and references
- T. X. Wang and D. W. Margerum, Inorg. Chem., 1994, 33, 1050–1055 CrossRef CAS.
- Z. T. How, K. L. Linge, F. Busetti and C. A. Joll, Environ. Sci. Technol., 2017, 51, 4870–4876 CrossRef CAS PubMed.
- M. Kajino, K. Morizane, T. Umetani and K. Terashima, Water Sci. Technol., 1999, 40, 107–114 CrossRef CAS.
- G. C. White, Handbook of Chlorination and Alternative Disinfectants, Van Nostrand Reinhold, New York, 1992 Search PubMed.
- W. Lee and P. Westerhoff, Water Res., 2009, 43, 2233–2239 CrossRef CAS PubMed.
- S. Hou, X. Dong, J. Zhu, J. Zheng, W. Bi, S. Li and S. Zhang, J. Colloid Interface Sci., 2017, 496, 391–400 CrossRef CAS PubMed.
- A. D. Shah and W. A. Mitch, Environ. Sci. Technol., 2011, 46, 119–131 CrossRef PubMed.
- https://www.epa.gov/dwreginfo/chloramines-drinking-water .
- W. A. Mitch, J. O. Sharp, R. Trussell, R. L. Valentine, L. Alvarez-Cohen and D. L. Sedlak, Environ. Eng. Sci., 2003, 20, 389–404 CrossRef CAS.
- I. M. Schreiber and W. A. Mitch, Environ. Sci. Technol., 2005, 39, 3811–3818 CrossRef CAS PubMed.
- I. M. Schreiber and W. A. Mitch, Environ. Sci. Technol., 2006, 40, 6007–6014 CrossRef CAS PubMed.
- M. J. Farré, K. Döderer, L. Hearn, Y. Poussade, J. Keller and W. Gernjak, J. Hazard. Mater., 2011, 185, 1575–1581 CrossRef PubMed.
- D. L. McCurry, K. P. Ishida, G. L. Oelker and W. A. Mitch, Environ. Sci. Technol., 2017, 51, 8589–8596 CrossRef CAS PubMed.
- M. E. Huang, S. Huang and D. L. McCurry, Environ. Sci. Technol., 2018, 5, 154–159 CAS.
- M. Selbes, W. Beite-Sandí, D. Kim and T. Karanfil, Water Res., 2018, 140, 100–109 CrossRef CAS PubMed.
- V. C. Hand and D. W. Margerum, Inorg. Chem., 1983, 22, 1449–1456 CrossRef CAS.
- R. L. Valentine and C. T. Jafvert, Environ. Sci. Technol., 1988, 22, 691–696 CrossRef CAS.
- R. L. Valentine and C. T. Jafvert, Environ. Sci. Technol., 1992, 26, 577–586 CrossRef.
- P. J. Vikesland, K. Ozekin and R. L. Valentine, Water Res., 2001, 35, 1766–1776 CrossRef CAS.
- J. Luh, N. Tong, L. Raskin and B. J. Mariñas, Environ. Sci. Technol., 2008, 42, 8051–8056 CrossRef CAS PubMed.
- P. J. Vikesland, K. Ozekin and R. L. Valentine, Environ. Sci. Technol., 1998, 32, 1409–1416 CrossRef CAS.
- F. E. Scully and W. N. White, Environ. Sci. Technol., 1991, 25, 820–828 CrossRef CAS.
- A. Stirling, N. N. Nair, A. Lledós and G. Ujaque, Chem. Soc. Rev., 2014, 43, 4940–4952 RSC.
- G. Peintler, I. Nagypal and I. R. Epstein, J. Phys. Chem., 1990, 94, 2954–2958 CrossRef CAS.
- L. C. Adam, I. Fabian, K. Suzuki and G. Gordon, Inorg. Chem., 1992, 31, 3534–3541 CrossRef CAS.
- I. Fabian and G. Gordon, Inorg. Chem., 1991, 30, 3785–3787 CrossRef CAS.
- W. C. Gardiner Jr., Rates and Mechanisms of Chemical Reactions, The Benjamin/Cummings Publishing Company, 1972 Search PubMed.
- H. M. Irving, M. G. Miles and D. L. Pettit, Anal. Chim. Acta, 1967, 38, 475–488 CrossRef CAS.
- OriginPro 2018b, Microcal Software Inc., Northampton, MA, 2018 Search PubMed.
- M. J. Frisch, G. W. Trucks, H. B. Schlegel, G. E. Scuseria, M. A. Robb, J. R. Cheeseman, G. Scalmani, V. Barone, G. A. Petersson, H. Nakatsuji, X. Li, M. Caricato, A. Marenich, J. Bloino, B. G. Janesko, R. Gomperts, B. Mennucci, H. P. Hratchian, J. V. Ortiz, A. F. Izmaylov, J. L. Sonnenberg, D. Williams-Young, F. Ding, F. Lipparini, F. Egidi, J. Goings, B. Peng, A. Petrone, T. Henderson, D. Ranasinghe, V. G. Zakrzewski, J. Gao, N. Rega, G. Zheng, W. Liang, M. Hada, M. Ehara, K. Toyota, R. Fukuda, J. Hasegawa, M. Ishida, T. Nakajima, Y. Honda, O. Kitao, H. Nakai, T. Vreven, K. Throssell, J. A. Montgomery Jr., J. E. Peralta, F. Ogliaro, M. Bearpark, J. J. Heyd, E. Brothers, K. N. Kudin, V. N. Staroverov, T. Keith, R. Kobayashi, J. Normand, K. Raghavachari, A. Rendell, J. C. Burant, S. S. Iyengar, J. Tomasi, M. Cossi, J. M. Millam, M. Klene, C. Adamo, R. Cammi, J. W. Ochterski, R. L. Martin, K. Morokuma, O. Farkas, J. B. Foresman and D. J. Fox, Gaussian 09, Revision E.01, Gaussian, Inc., Wallingford CT, 2016 Search PubMed.
- S. Grimme, J. Chem. Phys., 2006, 124, 34108 CrossRef PubMed.
- S. Grimme, S. Ehrlich and L. Goerigk, J. Comput. Chem., 2011, 32, 1456–1465 CrossRef CAS PubMed.
- A. Forni, S. Pieraccini, D. Franchini and M. Sironi, J. Phys. Chem. A, 2016, 120, 9071–9080 CrossRef CAS PubMed.
- N. Mardirossian and M. Head-Gordon, J. Chem. Phys., 2018, 148, 241736 CrossRef PubMed.
- K. A. Moltved and K. P. Kepp, J. Chem. Theory Comput., 2018, 14, 3479–3492 CrossRef CAS PubMed.
- K. Varga, I. Biljan, V. Tomišić, Z. Mihalić and H. Vančik, J. Phys. Chem. A, 2018, 122, 2542–2549 CrossRef CAS PubMed.
- D. Trogolo and J. S. Arey, Environ. Sci. Technol., 2016, 51, 128–140 CrossRef PubMed.
- R. Krishnan, J. S. Binkley, R. Seeger and J. A. Pople, J. Chem. Phys., 1980, 72, 650–654 CrossRef CAS.
- T. Clark, J. Chandrasekhar, G. W. Spitznagel and P. V. R. Schleyer, J. Comput. Chem., 1983, 4, 294–301 CrossRef CAS.
- M. J. Frisch, J. A. Pople and J. S. Binkley, J. Chem. Phys., 1984, 80, 3265–3269 CrossRef CAS.
- A. V. Marenich, C. J. Cramer and D. G. Truhlar, J. Phys. Chem. B, 2009, 113, 6378–6396 CrossRef CAS PubMed.
- J. VandeVondele, M. Krack, F. Mohamed, M. Parrinello, T. Chassaing and J. Hutter, Comput. Phys. Commun., 2005, 167, 103–128 CrossRef CAS.
- J. P. Perdew, K. Burke and M. Ernzerhof, Phys. Rev. Lett., 1996, 77, 3865–3868 CrossRef CAS PubMed.
- A. Schäfer, C. Huber and R. Ahlrichs, J. Chem. Phys., 1994, 100, 5829–5835 CrossRef.
- J. VandeVondele and J. Hutter, J. Chem. Phys., 2007, 127, 114105 CrossRef PubMed.
- S. Goedecker, M. Teter and J. Hutter, Phys. Rev. B: Condens. Matter Mater. Phys., 1996, 54, 1703–1710 CrossRef CAS PubMed.
- C. Hartwigsen, S. Goedecker and J. Hutter, Phys. Rev. B: Condens. Matter Mater. Phys., 1998, 58, 3641–3662 CrossRef CAS.
- M. Krack, Theor. Chem. Acc., 2005, 114, 145–152 Search PubMed.
- G. Bussi, D. Donadio and M. Parrinello, J. Chem. Phys., 2007, 126, 14101 CrossRef PubMed.
- A. Pohorille and C. Chipot, Free energy calculations: theory and applications in chemistry and biology, Springer, Berlin, 2007 Search PubMed.
- G. Ciccotti, R. Kapral and E. Vanden-Eijnden, ChemPhysChem, 2005, 6, 1809–1814 CrossRef CAS PubMed.
- L. M. Schurter, P. P. Bachelor and D. W. Margerum, Environ. Sci. Technol., 1995, 29, 1127–1134 CrossRef CAS PubMed.
- M. Gazda, K. Kumar and D. W. Margerum, Inorg. Chem., 1995, 34, 3536–3542 CrossRef CAS.
- E. T. Gray, D. W. Margerum and R. P. Huffman, in Organometals and Organometalloids, American Chemical Society, 1979, ch. 16, vol. 82, pp. 264–277 Search PubMed.
- M. S. Rayson, M. Altarawneh, J. C. Mackie, E. Kennedy and B. Z. Dlugogorski, J. Phys. Chem. A, 2010, 114, 2597–2606 CrossRef CAS PubMed.
- F. Sarrami, A. A. Kroeger and A. Karton, Chem. Phys. Lett., 2018, 708, 123–129 CrossRef CAS.
- F.-Q. Shi, X. Li, Y. Xia, L. Zhang and Z.-X. Yu, J. Am. Chem. Soc., 2007, 129, 15503–15512 CrossRef CAS PubMed.
- Note that we have singled out a H atom, therefore we have narrowed the sampling of the proton transfer which resulted in a higher barrier (including more H into the simulations is equivalent to a higher probability for reaction, which translates to a lower barrier). Therefore, the barrier obtained here is somewhat overestimated within the framework of the methodology.
- A. Hassanali, F. Giberti, J. Cuny, T. D. Kühne and M. Parrinello, Proc. Natl. Acad. Sci. U. S. A., 2013, 110, 13723–13728 CrossRef CAS PubMed.
- D. Marx, ChemPhysChem, 2006, 7, 1848–1870 CrossRef CAS PubMed.
- We note that the cluster calculations also indicated this process.
- H. Ryu, J. Park, H. K. Kim, J. Y. Park, S.-T. Kim and M.-H. Baik, Organometallics, 2018, 37, 3228–3239 CrossRef CAS.
Footnote |
| † Electronic supplementary information (ESI) available: Additional experimental information; error estimation for the MD simulations. See DOI: 10.1039/c9dt03789f |
| This journal is © The Royal Society of Chemistry 2019 |

