
 Open Access Article
 This Open Access Article is licensed under a
 Creative Commons Attribution 3.0 Unported Licence
Citrate-gel preparation and ammonia synthesis activity of compounds in the quaternary (Ni,M)2Mo3N (M = Cu or Fe) systems†
Samia
Al Sobhi
a,
Justin S. J.
Hargreaves
*b,
Andrew L.
Hector
 *a and
Said
Laassiri
b
*a and
Said
Laassiri
b
aSchool of Chemistry, University of Southampton, Highfield, Southampton SO17 1BJ, UK. E-mail: A.L.Hector@soton.ac.uk
bWestCHEM, School of Chemistry, University of Glasgow, Joseph Black Building, Glasgow G12 8QQ, UK. E-mail: Justin.Hargreaves@glasgow.ac.uk
First published on 25th October 2019
Abstract
Single phase solid solutions based on copper and iron substitution into the nickel sites of Ni2Mo3N are produced using a citrate gel approach followed by ammonolysis. These metal nitrides show good ammonia synthesis activity at 500 °C and ambient pressure. The activity fell with copper content and increased with iron content, although these changes appear to be related to the surface areas of the catalysts. The oxide intermediates from the citrate gel process cleanly converted to the metal nitride under the ammonia synthesis gas stream (75% H2, 25% N2) providing more active catalysts than those pre-nitrided by ammonolysis.
Introduction
The Haber–Bosch process directly sustains a major fraction of the world's population by providing a route from N2 to fertilisers, and demand could rise if ammonia is employed significantly as a carbon-free fuel. However, Haber–Bosch consumes 1–2% of the world's energy supply and results in significant carbon emissions in necessarily centralised (so poorly suited to renewable energy use) environments.1 Hence the search for catalysts that can operate effectively under lower pressure and temperature environments, or with less pure feedstocks, continues to be important even after many decades of operation of the Haber–Bosch process.Interest in metal nitrides as heterogeneous catalysts has focussed on hydrotreating reactions such as heteroatom removal and hydrogenations, often using high surface area molybdenum nitride derived from temperature programmed ammonolysis reactions of oxides or other molybdenum compounds.2–4 However, the high ammonia synthesis activity of some ternary molybdenum nitrides has also attracted significant work on these compounds. Notably Co3Mo3N can outperform commercial iron-based Haber–Bosch catalysts,5,6 with its high activity linked to the possible operation of a Mars–van Krevelen type process.7,8 It is also an active electrocatalyst for ammonia synthesis.9 We previously reported quaternary compounds in the (Ni,Co)2Mo3N system with good activity for ammonia synthesis.10,11 The principle of electronic tuning through substitution of one of the atoms is used extensively in catalysis, and could be useful in optimising activity of ternary nitrides.
The filled β-Mn structure adopted by Ni2Mo3N contains distorted, corner sharing NMo6 octahedra interpenetrated with a (10,3)-network of nickel atoms (Fig. 1).12,13 Complex metal nitrides are often made via the high temperature ammonolysis of an oxide with the desired metal atom ratio, for example CoMoO4 produces Co3Mo3N.6 Attempts at this approach in the Ni2Mo3N system have led to metal contamination and a much reduced ammonia synthesis activity.10,14 The use of a citrate gel to produce an intimate mix of metal oxides that forms the filled β-Mn phase on ammonolysis was successful in producing active Ni2Mo3N and (Ni,Co)2Mo3N catalysts.10 Copper substitution of the nickel sites in Ni2Mo3N has not previously been reported, but the citrate gel process requires merely a water soluble copper source and was considered likely to produce phases in this space. We show herein that (Ni,Cu)2Mo3N phases do exist up to a solubility limit, produce (Ni,Fe)2Mo3N compositions by the same route, and determine the effect of copper and iron substitution on ammonia synthesis activity.
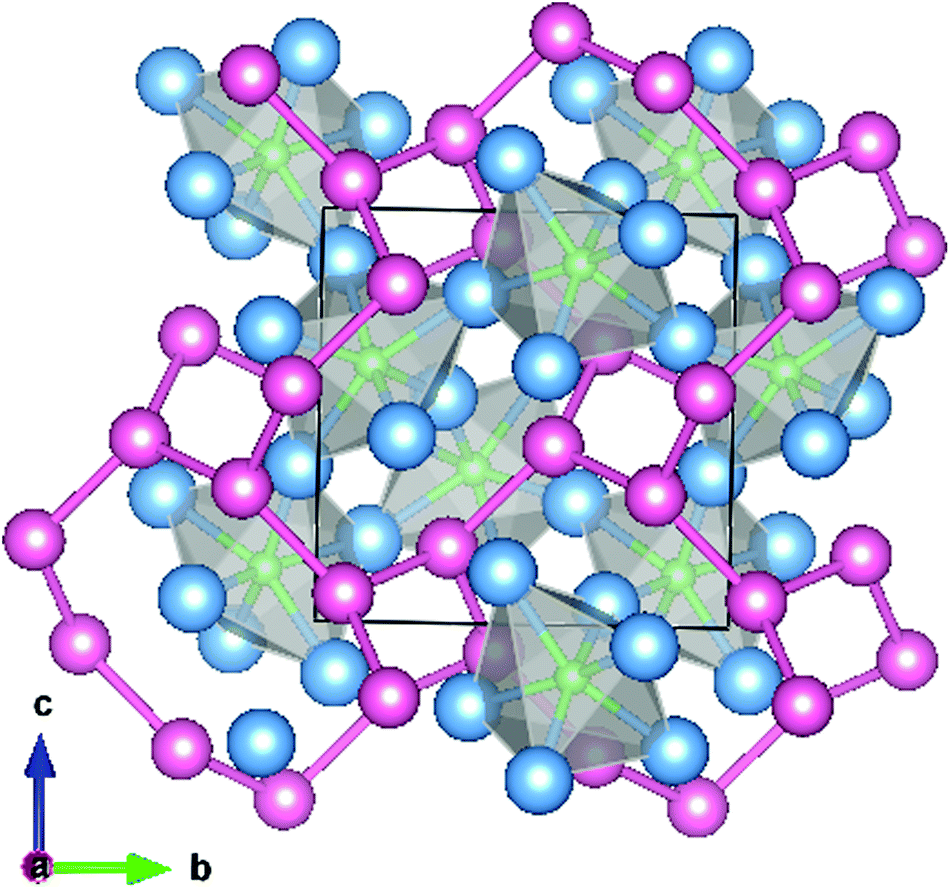 | ||
| Fig. 1 Unit cell of Ni2Mo3N viewed along [100] showing the corner linked NMo6 octahedra and the interpenetrating (10,3)-network of nickel atoms. Nickel atoms are shaded pink, molybdenum blue and nitrogen green. Diagram prepared using Vesta and structure data from Prior and Battle.13 | ||
Experimental
Nanocrystalline samples of Ni2−xMxMo3N (M = Cu or Fe) were prepared by a citrate gel route followed by ammonolysis. Stoichiometric amounts of (NH4)6Mo7O24·4H2O (2 g, Sigma Aldrich, 99.9%), Ni(NO3)2·6H2O (Sigma Aldrich, 99.9%) and either Cu(NO3)2·4H2O (Sigma Aldrich, 99%) or Fe(NO3)2·6H2O (Sigma Aldrich, 99.95%) were dissolved in 60 cm3 aqueous HNO3 (2.6 mol dm−3, prepared from Fisher Scientific 70% HNO3, used for ammonium molybdate solubility). Citric acid monohydrate (7.935 g, Sigma Aldrich, ACS reagent, ≥99%) was then added to the green solution. Actual quantities are given in ESI, Table S1.† The green solution was evaporated in a sand bath at 70 °C to ∼10 cm3 of viscous green gel (ESI, Fig. S1†), then heated in an ashing furnace (60 °C min−1 heating rate) at 500 °C for 2 h. The resulting grey foam was ground to a powder then heated in flowing ammonia (BOC anhydrous grade, further dried with molecular sieves) at 5 °C min−1 to 900 °C and maintained for 12 h. Once cool, the furnace tube was flushed with N2 for 30 min then air was allowed to diffuse in slowly to passivate sample surfaces before the black crystalline product was recovered. Samples were then handled under aerobic conditions during characterisation. Caution: a sand bath was used because citrate gels can occasionally ignite; the unpassivated metal nitrides are highly pyrophoric.The powder X-ray diffraction (PXRD) patterns of the samples were collected using a Bruker D2 Phaser X-ray diffractometer with Cu-Kα radiation. The Rigaku PDXL2 package and the PDF database15 were used for pattern matching. Rietveld refinement was carried out using GSAS16,17 and structure models from ICSD.18 Scanning electron microscopy (SEM) was conducted using a Philips XL-30 ESEM (20 kV accelerating voltage) with a ThermoFisher Ultradry energy dispersive spectroscopy (EDS) detector and Noran System 7 data processing. Transmission electron microscopy (TEM) was performed on Hitachi H7000 with accelerating voltage of 75 kV with samples prepared by ultrasound dispersal in propan-2-ol and deposition on carbon-coated copper grids. Thermogravimetric analysis (TGA) used a Netzch TG 209 F1 Libra instrument with a heating rate of 10 °C min−1 under 40 mL min−1 of 50% oxygen and 50% argon. The surface areas of the samples were calculated by applying the Brunauer, Emmett and Teller19 (BET) method to nitrogen physisorption isotherms measured at 77 K using a Micromeritics Tristar II and samples previously degassed overnight at 120 °C. Combustion (CHN) analysis was outsourced to Medac Ltd.
The catalytic performance of the obtained catalysts in ammonia synthesis was evaluated by a method similar to that described previously.20 The catalyst (0.15 g) was loaded in the centre of a 4.2 mm internal diameter silica tube as a plug held in place by a sinter, then placed in a tube furnace. 13 mL min−1 75% hydrogen/25% nitrogen gas mixture (BOC, H2 99.998%, N2 99.995%) was passed through the tube and it was heated to 700 °C for 2 hours to activate the catalyst followed by lower temperature steps to test ammonia production. On reaching the reaction temperature, the vent gas from the reactor was bubbled through a dilute solution of sulfuric acid (0.001 mol dm−3, 100 ml) at ambient temperature and the rate of ammonia production was calculated from the conductivity decrease of the sulfuric acid solution with time (Orion Star A212 Portable Conductivity Meter).20 A linear decrease in conductivity versus time was observed during the measurement using H2/N2 as the reactant gas. Detailed calculations of ammonia production rates are given in ESI (note S1†).
Results and discussion
The advantage of citrate gel synthesis to produce solid solutions in the (Ni,M)2Mo3N (M = Cu or Fe) system is that the 3d metals are mixed in solution, so could be well distributed in the products. A range of compositions was made starting with Ni2Mo3N and replacing nickel with copper or iron. Previously in the (Ni,Co)2Mo3N system we fired samples at 700 °C and found that, in addition to the filled β-manganese type phases, they contained a trace of a rocksalt-type impurity that resembled γ-Mo2N.10 The filled β-manganese structure has been discussed in more detail elsewhere.12,13 Firing Ni2Mo3N samples at temperatures between 600 and 1000 °C, the samples produced below 800 °C were found to contain the rocksalt-type phase (ESI, Fig. S2†), but at 900 or 1000 °C the phase pure filled β-manganese material was produced. The lattice parameters increased slightly with temperature (ESI, Fig. S3†). Hence the (Ni,M)2Mo3N (M = Cu or Fe) used herein were produced at 900 °C.Fig. 2 shows PXRD patterns for a series of (Ni,Cu)2Mo3N compositions produced at 900 °C. Compositions from Ni2Mo3N to Ni1.7Cu0.3Mo3N were identified as the single phase filled β-manganese structure (space group P4132). However, as the copper content was increased further, γ-Mo2N and copper metal appeared in the patterns and grew in intensity. The lattice parameter variation obtained from Rietveld refinement of the diffraction data (ESI, Fig. S4–S12 and Table S2†) is shown in Fig. 2. The lattice parameters show a Vegard trend in the single phase compositions, suggesting a good distribution of copper in the solid solutions. The values increase with copper content as expected from the larger metallic radius of Cu (1.28 Å) compared with Ni (1.24 Å).21 The lattice parameter of the filled β-manganese phase is then constant for overall compositions from Ni1.7Cu0.3Mo3N to Ni1.25Cu0.75Mo3N. Hence no further copper had been introduced into the Ni2Mo3N structure and the limit of solubility of Cu in Ni2Mo3N is around the Ni1.7Cu0.3Mo3N composition.
 | ||
| Fig. 2 Left: Powder XRD patterns for Ni2−xCuxMo3N (overall composition x = 0 to 0.75) synthesized by firing the dry powder at 900 °C for 12 hours under NH3 gas, where x = 0.0 (a), 0.1 (b), 0.2 (c), 0.3 (d), 0.4 (e), 0.5 (f), 0.6 (g), 0.7 (h) or 0.75 (i). Asterisks indicate the Mo2N reflections and black circles show reflections of Cu metal. Right: The lattice parameter of the filled β-manganese phase versus the concentration of Cu in Ni2−xCuxMo3N, with lines added as a guide to the eye. | ||
EDX showed that the Ni![[thin space (1/6-em)]](https://www.rsc.org/images/entities/char_2009.gif) :Mo ratio of the Ni2Mo3N sample to be 36.4:63.6 (expected 40:60 for Ni2Mo3N). As copper was substituted in, the copper contents were measured a little below the nominal compositions, but with an increasing trend (ESI, Table S3†). Note there is some overlap between the nickel and copper EDX peaks so there is a significant uncertainty in the analysis of these small amounts of copper. The composition was also tested by TGA (Fig. 3), with the samples heated in an oxygen-rich gas mixture to convert it to oxides containing Ni(II), Cu(II) and Mo(VI) (mass gain) as shown in eqn (1) (post-TGA XRD data shown in Fig. S13–S15†). The mass was unchanged up to ∼330 °C, above which the oxidation of the material was observed with a resulting mass increase. This occurred in three distinct steps, with an overall mass increase of 38.30% observed by 550 °C for Ni2Mo3N. No further mass increases were observed above 650 °C, but mass was lost sharply above 750 °C. This can be attributed to the sublimation of MoO3.22 The mass gains for the Cu-doped compositions (ESI, Table S4†) were consistent with expected values. As more Cu is introduced to the lattice the oxidation temperature decreases (Fig. 3).
:Mo ratio of the Ni2Mo3N sample to be 36.4:63.6 (expected 40:60 for Ni2Mo3N). As copper was substituted in, the copper contents were measured a little below the nominal compositions, but with an increasing trend (ESI, Table S3†). Note there is some overlap between the nickel and copper EDX peaks so there is a significant uncertainty in the analysis of these small amounts of copper. The composition was also tested by TGA (Fig. 3), with the samples heated in an oxygen-rich gas mixture to convert it to oxides containing Ni(II), Cu(II) and Mo(VI) (mass gain) as shown in eqn (1) (post-TGA XRD data shown in Fig. S13–S15†). The mass was unchanged up to ∼330 °C, above which the oxidation of the material was observed with a resulting mass increase. This occurred in three distinct steps, with an overall mass increase of 38.30% observed by 550 °C for Ni2Mo3N. No further mass increases were observed above 650 °C, but mass was lost sharply above 750 °C. This can be attributed to the sublimation of MoO3.22 The mass gains for the Cu-doped compositions (ESI, Table S4†) were consistent with expected values. As more Cu is introduced to the lattice the oxidation temperature decreases (Fig. 3).
 | (1) |
 | ||
| Fig. 3 TGA curves (50% O2/50% Ar environment) showing mass gain % of the Ni2Mo3N, Ni1.7Cu0.3Mo3N, Ni1.8Cu0.2Mo3N and Ni1.9Cu0.1Mo3N samples prepared at 900 °C with heating rate of 5 °C min−1 under ammonia. | ||
Not only the crystalline structure and the chemical composition are important to understand the catalytic properties, the morphology of the catalyst can also be significant. Fig. 4 shows typical images of a Ni1.7Cu0.3Mo3N sample obtained at 900 °C. An open structure of interconnected, rounded particles with diameters around 200 nm were found, which is in a good correlation with the average crystallite diameter of 140 nm calculated using an adaptation of the Scherrer equation incorporated into the Rietveld fitting package.16
 | ||
| Fig. 4 TEM (left) and SEM (right) images of Ni1.7Cu0.3Mo3N obtained from the citrate-gel derived metal oxide precursors heated in ammonia at 900 °C for 12 hours. | ||
The ammonia synthesis rates measured for the (Ni,Cu)2Mo3N samples are summarised in Table 1, alongside the BET surface areas and the nitrogen contents measured from combustion (CHN) analysis (expected wt% N is 3.3%). It is noteworthy that the rate of ammonia synthesis reduces systematically with copper doping. The need to produce these samples at a relatively high temperature of 900 °C has resulted in quite low surface areas, and the surface area is reducing with increasing copper content. This can be attributed partly to crystallite growth and partly to agglomeration, both occurring through sintering at this high reaction temperature, but the surface areas are fairly typical for this type of material.23 However, the surface area of Mo based nitride materials can be strongly influenced by synthesis factors such as NH3 flow rates and temperature ramp rates,24–27 and achieving higher surface areas should be a future priority.
| Catalyst | Surface area (m2 g−1) | Crystallite diameter (nm) | Nitrogen contenta (wt%) | Ammonia synthesis rate at 500 °Cb (μmol h−1 g−1) | Specific activity at 500 °C (μmol h−1 m−2) | |
|---|---|---|---|---|---|---|
| Pre-catalysis | Post-catalysis | |||||
| a Calculated values are 3.3%. b Conductivity profiles used to calculate these rates are shown in ESI (Fig. S16†). | ||||||
| Ni2Mo3N | 2.2 | 113(2) | 3.4 | 3.3 | 272(5) | 124(2) |
| Ni1.9Cu0.1Mo3N | 2.1 | 119(3) | 3.6 | 3.4 | 252(2) | 120(1) |
| Ni1.8Cu0.2Mo3N | 1.8 | 126(5) | 3.6 | 3.4 | 231(2) | 128(1) |
| Ni1.7Cu0.3Mo3N | 1.6 | 142(11) | 3.6 | 3.4 | 179(6) | 112(4) |
Substituting iron into the Ni2Mo3N, the synthesis proceeded in the same way as for copper except that a brown colour developed as the sol was concentrated (ESI, Fig. S1†). After firing in ammonia at 900 °C the PXRD showed phase pure filled β-manganese-structured samples with iron contents up to NiFeMo3N (Fig. 5). An increasing linear trend in lattice parameter with iron content indicates the formation of well distributed solid solutions and is consistent with the larger metallic radius of Fe (1.26 Å) compared with Ni (1.24 Å).21 Increasing the iron content, further molybdenum metal and Fe2N impurities were observed, although in contrast with the (Ni,Cu)2Mo3N solid solutions the lattice parameter of the (Ni,Fe)2Mo3N continued to increase, suggesting that there is no strong barrier to forming solid solutions in this more iron-rich region of the phase space. Based on the PXRD data the crystallite diameter of (Ni,Fe)2Mo3N decreases with Fe content, and the BET surface areas increased with iron content (Table 2). The nitrogen content (combustion/CHN analysis) of the samples is approximately consistent with the calculated values. The TGA data during oxidation (ESI, Fig. S17 and Table S5†) showed the expected mass gains, with thermal stability decreasing with concentration of the second metal, similarly to the (Ni,Cu)2Mo3N system. Electron microscopy (ESI, Fig. S18†) showed similar aggregates of particles to those of (Ni,Cu)2Mo3N, and EDX (ESI, Table S6†) showed expected compositions.
 | ||
| Fig. 5 Left: Magnified PXRD patterns of Ni2−xFexMo3N, with asterisks indicating Mo metal reflections and diamonds the reflection of Fe2N. A wider 2θ range is shown in ESI (Fig. S19†). Right: Lattice parameters obtained by Rietveld refinement (ESI, Fig. S20–S27 and Table S7†) versus the concentration of Fe in the (Ni,Fe)2Mo3N systems. | ||
| Catalyst | Surface area (m2 g−1) | Crystallite diameter (nm) | Nitrogen contenta (wt%) | Ammonia synthesis rate at 500 °Cb (μmol h−1 g−1) | Specific activity at 500 °C (μmol h−1 m−2) | |
|---|---|---|---|---|---|---|
| Pre-catalysis | Post-catalysis | |||||
| a Calculated values are 3.3–3.4%. b Conductivity profiles used to calculate these rates are shown in ESI (Fig. S28†). | ||||||
| Ni2Mo3N | 2.2 | 113(2) | 3.4 | 3.3 | 272(5) | 124(2) |
| Ni1.8Fe0.2Mo3N | 2.4 | 142(12) | 3.5 | 3.4 | 311(2) | 130(1) |
| Ni1.5Fe0.5Mo3N | 2.5 | 119(10) | 3.5 | 3.4 | 322(2) | 129(1) |
| Ni1.2Fe0.8Mo3N | 2.7 | 114(1) | 3.6 | 3.4 | 337(4) | 125(1) |
| Ni1.1Fe0.9Mo3N | 2.8 | 103(2) | 3.6 | 3.2 | 354(4) | 126(2) |
The ammonia synthesis rates of the (Ni,Fe)2Mo3N catalysts increase with iron addition throughout the range of compositions where a single phase is formed, from 272 μmol h−1 g−1 with Ni2Mo3N to 354 μmol h−1 g−1 with Ni1.1Fe0.9Mo3N (Table 2). However, this increase appears to be linked to the increasing surface area with temperature, as the activities normalised by surface area have similar values.
Molybdenum nitrides have been reported as active catalysts for ammonia synthesis at 400 °C, and their catalytic performances are sometimes significantly improved by the addition of a second transition metal such as Ni, Co or Fe.28,29 Kojima and Aika showed that cobalt molybdenum nitride promoted with Cs can synthesise ammonia at double the efficiency of commercial catalysts, with reported activities of 652 μmol g−1 h−1 and 986 μmol g−1 h−1.5,6,30–34 The high activity of the Co3Mo3N has been linked to the fact that CoMo alloy has an average nitrogen adsorption energy close to the optimal nitrogen binding energy for catalytic performance,35,36 and to lattice nitrogen activity.2,7,8,10,11,14,32,37 Activities for Ni2Mo3N and doped analogues are typically lower than those of Co3Mo3N-based catalysts despite the structural and electronic similarities between these two systems, and that may be linked at least partly to the lack of lattice nitrogen mobility exhibited by Ni2Mo3N.11 Activities observed here are significantly higher than those observed in many other studies of this material and were seen to increase with iron doping, although our activities were measured at 500 °C due to a relatively low activity observed at 400 °C (ESI, Fig. S29†). Comparison of PXRD patterns collected before and after catalysis (ESI, Fig. S30 and S31†) shows no appreciable change to the structures throughout the series of samples. The nitrogen contents of the catalysts post-catalysis (combustion/CHN analysis, Tables 1 and 2) also remain consistent with the stoichiometric compositions. In addition to the linear conductivity changes observed in the catalysis, this suggests that the catalysts are stable under the reaction conditions used.
It has previously been noted that Ni2Mo3N can be synthesised from oxides at 700 °C using hydrogen–nitrogen mix, a key advantage compared with Co3Mo3N as it means the ammonia synthesis catalyst can be produced in situ under conditions typically used for catalyst activation, not requiring an ammonia firing step before use.10,38 The citrate gel process led to a mixture (Fig. 6) of α-NiMoO4 and MoO3, which is consistent with the previously published observations of Alconchel et al.22 Catalysis used the same conditions as the metal nitrides described above, with the activation step at 700 °C used to convert the oxides to nitrides and catalysis carried out at 500 °C, again resulting in a steady rate of ammonia production. Interestingly these materials exhibited significantly higher mass-normalised ammonia synthesis rates (Table 3). The surface areas were found to be higher than in the pre-formed nitrides both before and after catalysis (Table 3). Post-catalysis the PXRD patterns and compositions were very similar to those of the pre-formed nitrides (Fig. 6). We infer from this that the transformation to the filled β-manganese type nitride phases proceeds smoothly under the catalyst activation conditions (700 °C under 75% H2/25% N2 yielding a higher surface areas that is advantageous in the catalytic process. Use of ammonia in the synthesis at this temperature yields a rocksalt-type impurity.10,11 The activity has not scaled linearly with surface area, and these catalysts have lower area-normalised activities than the pre-formed nitrides (Tables 1–3), but nonetheless the increase supports the idea that increasing surface area could lead to higher overall activity levels in these materials.
 | ||
| Fig. 6 PXRD patterns of catalysts after (a) and before (b) use in ammonia synthesis. The precursor compositions were Ni2Mo3Ox (top), Ni1.7Cu0.3Mo3Ox (centre) and Ni1.2Fe0.8Mo3Ox (bottom). | ||
| Catalyst | Surface area (m2 g−1) | Nitrogen content (wt %) post-catalysisa | Ammonia synthesis rate at 500 °Cb (μmol g−1 h−1) | Specific activity at 500 °Cc (μmol h−1 m−2) | |
|---|---|---|---|---|---|
| Pre-catalysis | Post-catalysis | ||||
| a Calculated values are 3.3–3.4%. b Conductivity profiles used to calculate these rates are shown in ESI (Fig. S32†). c Calculation based on the surface area of the nitride phase post-catalysis. | |||||
| Ni2Mo3Ox | 10 | 6 | 3.1 | 466(18) | 78(3) |
| Ni1.7Cu0.3Mo3OX | 6.6 | 4.8 | 3.3 | 368(9) | 77(2) |
| Ni1.2Fe0.8Mo3OX | 6.2 | 5.2 | 3.2 | 426(4) | 82(1) |
Conclusions
Filled β-manganese type materials with composition Ni2Mo3N and with some Ni sites replaced by Cu or Fe were prepared by a citrate gel route. In both cases there was a limit to the amount of the second metal that could be substituted under these conditions, in the copper case that seemed to be due to a solubility limit of copper in the host phase. Iron doping increased the activity of the phase as a catalyst for ammonia synthesis at 500 °C and copper decreased that activity, but in both cases surface area, rather than any electronic differences, appear to be the main contributor to the observed change. The oxide intermediates could be converted to the nitride phases during the catalyst activation, avoiding the need to fire in ammonia. The in situ transformation of the oxides led to higher catalyst surface areas and hence to higher activity.Conflicts of interest
There are no conflicts to declare.Acknowledgements
The authors thank the Government of Saudi Arabia for a scholarship to SAS and EPSRC for support of SL under EP/L02537X/1.References
- Y. Nishibayashi, Inorg. Chem., 2015, 54, 9234–9247 CrossRef CAS PubMed.
- J. S. J. Hargreaves, Coord. Chem. Rev., 2013, 257, 2015–2031 CrossRef CAS.
- M. Nagai, Appl. Catal., A, 2007, 322, 178–190 CrossRef CAS.
- E. Furimsky, Appl. Catal., A, 2003, 240, 1–28 CrossRef CAS.
- R. Kojima and K. I. Aika, Appl. Catal., A, 2001, 218, 121–128 CrossRef CAS.
- C. J. H. Jacobsen, Chem. Commun., 2000, 1057–1058 RSC.
- C. D. Zeinalipour-Yazdi, J. S. J. Hargreaves and C. R. A. Catlow, J. Phys. Chem. C, 2015, 119, 28368–28376 CrossRef CAS.
- S. M. Hunter, D. H. Gregory, J. S. J. Hargreaves, M. Richard, D. Duprez and N. Bion, ACS Catal., 2013, 3, 1719–1725 CrossRef CAS PubMed.
- I. A. Amar, R. Lan, C. T. G. Petit and S. Tao, Electrocatalysis, 2015, 6, 286–294 CrossRef CAS.
- N. Bion, F. Can, J. Cook, J. S. J. Hargreaves, A. L. Hector, W. Levason, A. R. McFarlane, M. Richard and K. Sardar, Appl. Catal., A, 2015, 504, 44–50 CrossRef CAS.
- S. Al Sobhi, N. Bion, J. S. J. Hargreaves, A. L. Hector, S. Laassiri, W. Levason, A. W. Lodge, A. R. McFarlane and C. Ritter, Mater. Res. Bull., 2019, 118, 110519 CrossRef.
- P. S. Herle, M. S. Hegde, K. Sooryanarayana, T. N. Guru Row and G. N. Subbanna, Inorg. Chem., 1998, 37, 4128–4130 CrossRef CAS.
- T. J. Prior and P. D. Battle, J. Solid State Chem., 2003, 172, 138–147 CrossRef CAS.
- J. S. J. Hargreaves and D. Mckay, J. Mol. Catal. A: Chem., 2009, 305, 125–129 CrossRef CAS.
- PDF-2 (Powder Diffr. File), 2012 release, Int. Cent. Diffr. Data, Swart. PA Search PubMed.
- A. C. Larson and R. B. Von Dreele, General Structure Analysis System (GSAS), Los Alamos National Laboratory Report LAUR 86-LAUR 748, 2000 Search PubMed.
- B. H. Toby, J. Appl. Crystallogr., 2001, 34, 210–213 CrossRef CAS.
- Inorg. Cryst. Struct. Database (ICSD, Fiz Karlsruhe) accessed via EPSRC-funded Natl. Chem. Database Serv. hosted by R. Soc. Chem.
- S. Brunauer, P. H. Emmett and E. Teller, J. Am. Chem. Soc., 1938, 60, 309–319 CrossRef CAS.
- D. McKay, PhD thesis, University of Glasgow, 2008.
- N. N. Greenwood and E. A. Earnshaw, Chemistry of the Elements (2nd Ed.), Butterworth-Heinemann, 1997 Search PubMed.
- S. Alconchel, F. Sapiña, D. Beltrán and A. Beltrán, J. Mater. Chem., 1999, 9, 749–755 RSC.
- A. Srifa, K. Okura, T. Okanishi, H. Muroyama, T. Matsui and K. Eguchi, Catal. Sci. Technol., 2016 Search PubMed, 7495–7504.
- L. Volpe and M. Boudart, J. Solid State Chem., 1985, 59, 332–347 CrossRef CAS.
- J. G. Choi, J. R. Brenner, C. W. Colling, B. G. Demczyk, J. L. Dunning and L. T. Thompson, Catal. Today, 1992, 15, 201–222 CrossRef CAS.
- D. W. Kim, D. K. Lee and S. K. Ihm, Korean J. Chem. Eng., 2002, 19, 587–592 CrossRef CAS.
- J. G. Choi, R. L. Curl and L. T. Thompson, J. Catal., 1994, 146, 218–227 CrossRef CAS.
- L. Volpe and M. Boudart, J. Phys. Chem., 1986, 90, 4874–4877 CrossRef CAS.
- S. T. Oyama, Catal. Today, 1992, 15, 179–200 CrossRef CAS.
- D. Mckay, D. H. Gregory, J. S. J. Hargreaves, S. M. Hunter and X. Sun, Chem. Commun., 2007, 7, 3051–3053 RSC.
- D. Mckay, J. S. J. Hargreaves, J. L. Rico, J. L. Rivera and X. L. Sun, J. Solid State Chem., 2008, 181, 325–333 CrossRef CAS.
- I. Alshibane, A. Daisley, J. S. J. Hargreaves, A. L. Hector, S. Laassiri, J. L. Rico and R. I. Smith, ACS Sustainable Chem. Eng., 2017, 5, 9214–9222 CrossRef CAS.
- R. Kojima and K. I. Aika, Appl. Catal., A, 2001, 219, 141–147 CrossRef CAS.
- R. Kojima and K. Aika, Appl. Catal., A, 2001, 215, 149–160 CrossRef CAS.
- C. J. H. Jacobsen, S. Dahl, B. G. S. Clausen, S. Bahn, A. Logadottir and J. K. Nørskov, J. Am. Chem. Soc., 2001, 123, 8404–8405 CrossRef CAS PubMed.
- A. Boisen, S. Dahl and C. J. H. Jacobsen, J. Catal., 2002, 186, 180–186 CrossRef.
- A. Daisley and J. S. J. Hargreaves, J. Energy Chem., 2019, 39, 170–175 CrossRef.
- J. O. Conway and T. J. Prior, J. Alloys Compd., 2019, 774, 69–74 CrossRef CAS.
Footnote |
| † Electronic supplementary information (ESI) available. See DOI: 10.1039/c9dt03673c |
| This journal is © The Royal Society of Chemistry 2019 |