 Open Access Article
Creative Commons Attribution 3.0 Unported Licence
Efflorescence on calcareous objects in museums: crystallisation, phase characterisation and crystal structures of calcium acetate formate phases†‡
Sebastian
Bette
 *ab,
Michael X.
Müller
c,
Gerhard
Eggert
 b,
Thomas
Schleid
c and
Robert E.
Dinnebier
 a
a
aMax Planck Institute for Solid State Research, Heisenbergstr. 1, 70569 Stuttgart, Germany. E-mail: S.Bette@fkf.mpg.de
bState Academy of Art and Design, Am Weißenhof 1, 70191 Stuttgart, Germany
cInstitute for Inorganic Chemistry, University of Stuttgart, Pfaffenwaldring 55, 70569 Stuttgart, Germany
First published on 9th October 2019
Abstract
During the systematic investigation of the ternary system Ca(CH3COO)2–Ca(HCOO)2–H2O at room temperature, the congruent crystallisation of two solid calcium acetate formates was observed: the hitherto unknown Ca3(CH3COO)4(HCOO)2·4H2O and the poorly characterised Ca(CH3COO)(HCOO)·H2O. The latter is a frequently observed efflorescence phase found on calcareous objects and it could be also identified as a corrosion phase in a natural history collection of birds’ eggs. Elemental and thermal analyses were employed to determine the phase compositions and by Raman and IR spectroscopy the presence of acetate and formate anions in both solids was confirmed. Laboratory X-ray powder diffraction data were used to solve the crystal structures. Ca3(CH3COO)4(HCOO)2·4H2O crystallises in a primitive tetragonal unit cell with space group P41212 and lattice parameters of a = 6.8655(1) Å and c = 45.5454(6) Å, while Ca(CH3COO)(HCOO)·H2O crystallises in a primitive monoclinic unit cell with space group P21/c and lattice parameters of a = 9.2729(1) Å, b = 6.8002(1) Å, c = 11.2219(2) Å and β = 121.232(1)°. Calcium carboxylate zig-zag chains [Ca(μ2-RCOO)+]n (R = CH3 or H) are the main motif of both crystal structures. In Ca3(CH3COO)4(HCOO)2·4H2O these chains are exclusively composed of acetate anions, whereas in Ca(CH3COO)(HCOO)·H2O only formate anions are situated in the chains. The remaining places in the 7–8 fold coordination sphere of the calcium cations are filled by water molecules and additional carboxylate anions that interconnect neighbouring chains, which eventually leads to layered motifs in both structures.
Introduction
When heritage objects are stored in museums or collections over decades and centuries, they are exposed to corrosive atmospheric gases, moisture and temperature fluctuations. This leads to different corrosion phenomena which are often associated with the formation of efflorescence salts as products of these corrosion processes. As these efflorescence phases often crystallise in pores or cracks, their crystallisation can cause significant damage to the objects.1 Moisture and carbon dioxide lead to the corrosion of glass-bearing metal objects. As historic glasses are not stable, they are partially dissolved by moisture, which results in the formation of an alkaline surface film that leads to the corrosion of the metal and to an uptake of CO2.2 This phenomenon is known as “glass-induced metal-corrosion on museum exhibits” (GIMME).3,4 But also the storage furniture or the showcase itself can have a major impact on the corrosion processes. Most of the furniture used for storage or display has been wooden and wood, especially oak, and some glues emit formic and acetic acid or its aldehyde precursors.5 This leads to the formation of acetate and formate salts during the process of glass induced metal corrosion6–9 or to a direct attack on calcareous objects. The occurrence of acetate-containing efflorescence phases on calcareous objects has been known as “Byne's disease” since the end of the 19th century.10 In many cases, simple needle-shaped calcium acetate monohydrate (Ca(CH3COO)2·H2O) and a phase denoted as calcium acetate hemihydrate (Ca(CH3COO)2·0.5H2O) were identified as efflorescence salts on Mollusca shells11 and classical ceramics from the Agora of Athens stored in oak drawers and cabinets.1 More complex, multianionic calcium acetates like calclacite (Ca(CH3COO)Cl·5H2O) or thecotrichite (Ca3(CH3COO)3Cl(NO3)2·6H2O) were found on fossils, limestone rocks,12 ancient reliefs,13 pottery shards14 and ceramics.15 Reports on the occurrence of formate-bearing calcium salts as efflorescence phases are less frequent. Zehnder and Arnold16 observed the formation of calcium formate during model experiments on limestone corrosion. Tennent and Baird11 report on the occurrence of calcium acetate formate monohydrate (Ca(CH3COO)(HCOO)·H2O) on Mollusca shells and a complex efflorescence salt (Ca2(CH3COO)(HCOO)(NO3)2·4H2O) was found both on ancient attic amphorae and wine jugs.17 The identification of these efflorescence salts is rather complex. A visual inspection is often misleading as most calcium-bearing efflorescence phases exhibit a needle like morphology. Identification via X-ray powder diffraction (XRPD) and IR or Raman spectroscopy depends on the availability of reliable reference data. Most of the efflorescence salts, however, are poorly characterised as they usually occur as multiphase samples on historic objects and as the chemistry and crystallography of calcium acetate and formate salts is rather complex. In addition to the investigation of corroded heritage objects, the formation11,16,18 and the de- and rehydration behaviour1 of efflorescence salts found on calcareous objects was studied by model experiments. In the course of these experiments further calcium carboxylate phases like Ca2(CH3COO)3(NO3)·2H2O18 or Ca7(CH3COO)6(HCOO)8·5H2O11 were obtained, the latter, however, was never found to crystallise as efflorescence phases on calcareous objects and the former only once. Nevertheless, these experiments demonstrated that there is a huge variety of solid calcium carboxylate phases.Even the simple calcium acetates and formates exhibit a pronounced polymorphism, as for anhydrous calcium formate four distinct polymorphs19–21 and as both for anhydrous calcium acetate22 and calcium acetate monohydrate23–25 three different polymorphs are known. Despite their simple constitution, the crystal structures of the polymorphs of anhydrous calcium acetate and of the hemihydrate, which also occurs as an intermediate of the thermal decomposition of the monohydrate,26 are still unknown. The structural knowledge on the more complex calcium acetate bearing efflorescence phases was also limited. Until 2015 only the crystal structures of calclacite (Ca(CH3COO)Cl·5H2O)27 and of Ca2(CH3COO)3(NO3)·2H2O18 have been solved. Recently, the crystal structures of thecotrichite (Ca3(CH3COO)3Cl(NO3)2·6H2O)28 and Ca2(CH3COO)(HCOO)(NO3)2·4H2O17 were determined from XRPD-data, whereas the crystal structures of Ca7(CH3COO)6(HCOO)8·5H2O and Ca(CH3COO)(HCOO)·H2O are still unknown. The latter phase is of special importance as Tennent and Baird11 identified it on more than 20 different objects and also in the British Museum, this compound has been detected on a marble relief and classical ceramics.29
In order to increase the structural knowledge on calcium acetate bearing efflorescence salts and to provide a reliable database for the substance identification, we performed a detailed investigation on Ca(CH3COO)(HCOO)·H2O. Therefore, efflorescence phases grown on birds’ eggs were collected and analysed. The natural formation of efflorescence salts usually lead to multiphase samples. Hence, attempts were made to produce the corrosion phase artificially in order to obtain a pure substance for a detailed characterisation, as this approach already has been successfully applied to historic verdigris pigments30,31 and metal corrosion phases.2,7 For this purpose, the solid phase formation in the ternary system Ca(CH3COO)2–Ca(HCOO)2–H2O was investigated systematically, as Tennent and Baird11 describe the crystallisation of Ca(CH3COO)(HCOO)·H2O from an equimolar aqueous calcium acetate formate solution. In result, both the targeted Ca(CH3COO)(HCOO)·H2O and a hitherto unknown calcium carboxylate phase, Ca3(CH3COO)4(HCOO)2·4H2O, were synthesised as pure substances. The crystal structures of the solid phases were solved from XRPD data and the substances characterised by vibrational spectroscopy and thermal analysis.
Experimental section
Sample collection
The samples of the efflorescence phases were collected in the State Museum of Natural History, Stuttgart, during a survey for corrosion products in the mollusks and the birds’ eggs collections and analysed using μ-Raman spectroscopy (experimental details as below).Synthesis procedure
Ca(CH3COO)(HCOO)·H2O and Ca3(CH3COO)4(HCOO)2·4H2O were crystallised from mixed calcium formate – calcium acetate solutions, produced by dissolving Ca(HCOO)2 and Ca(CH3COO)2·H2O in deionised water. The deionised water, which was used for all experiments, had been boiled for 5 minutes before, in order to remove dissolved carbon dioxide. Ca(HCOO)2 (ACROS ORGANIC, >99%) was used without purification, as the purity of the starting material was proven both by XRPD and thermal analysis. A preliminary investigation of the purchased Ca(CH3COO)2·H2O (ABCR chemicals, >99%) by XRPD revealed the starting material to be a mixture of Ca(CH3COO)2·H2O, anhydrous Ca(CH3COO)2 and a small amount of CaCO3 (calcite). Hence Ca(CH3COO)2·H2O was recrystallised according to the procedure published by Klop et al.23 In a typical recrystallisation experiment, 8.9 g Ca(CH3COO)2·H2O were dissolved in 21.1 g deionised water at 0 °C, yielding an aqueous solution with a concentration of 2.3 m (m = mol Ca(CH3COO)2 per kg H2O). Due to traces of undissolved calcite, the solution was slightly turbid. The solid was removed by filtration. Afterwards the saturated, clear calcium acetate solution was slowly heated up from 0 °C to room temperature, which lead to the crystallisation of Ca(CH3COO)2·H2O, as the solubility decreases with increasing temperature.32For a systematic study of the ternary system Ca(CH3COO)2–Ca(HCOO)2–H2O, 2.0 m calcium acetate and 1.0 m calcium formate solutions were mixed with different molar ratios in order to produce a mixed calcium acetate formate solution with acetate to formate ratios from 5![[thin space (1/6-em)]](https://www.rsc.org/images/entities/char_2009.gif) :
:![[thin space (1/6-em)]](https://www.rsc.org/images/entities/char_2009.gif) 1 to 1
1 to 1![[thin space (1/6-em)]](https://www.rsc.org/images/entities/char_2009.gif) :
:![[thin space (1/6-em)]](https://www.rsc.org/images/entities/char_2009.gif) 5. The mixed solutions were stored in crystallising dishes and exposed to a dynamic air atmosphere with (20–40)% r.H. at 20 °C, which led to a slow evaporation of water. After two to four days, (25–50)% of the water was evaporated and a white powder crystallised in each synthesis approach. The resulting solid was removed by filtration.
5. The mixed solutions were stored in crystallising dishes and exposed to a dynamic air atmosphere with (20–40)% r.H. at 20 °C, which led to a slow evaporation of water. After two to four days, (25–50)% of the water was evaporated and a white powder crystallised in each synthesis approach. The resulting solid was removed by filtration.
Phase characterisation
The synthesised samples of Ca(CH3COO)(HCOO)·H2O and Ca3(CH3COO)4(HCOO)2·4H2O were investigated by scanning electron microscopy (SEM) using a MERLIN scanning electron microscope (Zeiss) (5.0 kV accelerating voltage, SE-detector), after coating the sample with iridium. μ-Raman spectroscopy was conducted using a Renishaw inVia Raman spectrometer with a Leica DMLM microscope and a RenCam CCD detector. The spectrometer was equipped with a He–Ne laser operating at 632.8 nm, with power kept below 400 μW on the sample surface. Infrared spectra were recorded in attenuated total reflection (ATR) geometry on a PerkinElmer Spectrum Two device equipped with a diamond crystal. The background spectrum was measured separately and subtracted. Elemental analyses of carbon, hydrogen, sulfur and nitrogen were performed with a Vario Micro Cube analyser (Elementar). Thermal analysis was carried out using a STA 449 F5-Jupiter (Netzsch) device for TG-measurements. Approx. (20–30) mg of the sample were placed in an Al2O3 crucible and heated up from 30 °C to 1000 °C with a heating rate of 2 K min−1 in a 20 mL min−1 O2-stream. An empty Al2O3 crucible was used as reference. XRPD patterns for phase identification were collected at room temperature on a laboratory powder diffractometer in Debye–Scherrer geometry (Stadi P-Diffractometer (Stoe), Cu-Kα1 radiation from primary Ge(111)-Johann-type monochromator, triple array of Mythen 1 K detectors (Dectris)). The samples were sealed in 0.5 mm diameter borosilicate glass capillaries (Hilgenberg glass no. 0140), which were spun during the measurements. Each pattern was measured in a 2θ range from 1.0° to 110° applying a total scan time of 1 h. The XRPD patterns for the crystal structure solution were collected using the same device by only using one Mythen 1 K detector of the triple array and applying a scan range from 5.0° to 100° 2θ and a total scan time of 20 h. Temperature dependent in situ X-ray diffraction experiments were performed on a D8-Advance diffractometer (Bruker, Cu-Kα1 radiation from primary Ge(220)-Johannson-type monochromator, Lynx Eye position sensitive detector (Bruker)) in Debye–Scherrer geometry using a water-cooled furnace (mri capillary heater, (25–1000) °C) for heating the capillary. The samples were sealed in 0.5 mm diameter quartz glass capillaries (Hilgenberg), which were spun during the measurements. The patterns were measured with a scan range of 5.0° 2θ to 40.0° 2θ, employing a step size of 0.005 and a total scan time of 4 h. A delay time of 30 min was applied before each measurement to ensure thermal equilibration.Crystal structure solution
The programme TOPAS 6.0![[thin space (1/6-em)]](https://www.rsc.org/images/entities/char_2009.gif) 33 was used to determine and refine the crystal structures of Ca(CH3COO)(HCOO)·H2O and Ca3(CH3COO)4(HCOO)2·4H2O. Indexing of the powder patterns was carried out by an iterative use of singular value decomposition (LSI)34 leading for Ca(CH3COO)(HCOO)·H2O to a primitive monoclinic unit cell with lattice parameters given in the ESI (Table S1‡). The observed systematic reflection extinction pointed to P21/c (14) as most probable space group. The diffraction pattern of Ca3(CH3COO)4(HCOO)2·4H2O was indexed with a tetragonal unit cell with lattice parameters given in the ESI (Table S1‡). The observed systematic reflection extinction pointed to P41212 (92) as most probable space group. The peak profile and the precise lattice parameters were determined by Le Bail35 fits applying the fundamental parameter approach of TOPAS.36 For modelling of the background Chebychev polynomials of 6th order and a broad Lorentzian type peak at 22° 2θ to account for the hump caused by the capillary were used. The refinements converged quickly.
33 was used to determine and refine the crystal structures of Ca(CH3COO)(HCOO)·H2O and Ca3(CH3COO)4(HCOO)2·4H2O. Indexing of the powder patterns was carried out by an iterative use of singular value decomposition (LSI)34 leading for Ca(CH3COO)(HCOO)·H2O to a primitive monoclinic unit cell with lattice parameters given in the ESI (Table S1‡). The observed systematic reflection extinction pointed to P21/c (14) as most probable space group. The diffraction pattern of Ca3(CH3COO)4(HCOO)2·4H2O was indexed with a tetragonal unit cell with lattice parameters given in the ESI (Table S1‡). The observed systematic reflection extinction pointed to P41212 (92) as most probable space group. The peak profile and the precise lattice parameters were determined by Le Bail35 fits applying the fundamental parameter approach of TOPAS.36 For modelling of the background Chebychev polynomials of 6th order and a broad Lorentzian type peak at 22° 2θ to account for the hump caused by the capillary were used. The refinements converged quickly.
The crystal structures were solved by applying the global optimisation method of simulated annealing (SA) in real space as it is implemented in TOPAS.37 Considering the determined unit-cell volume and the packing density of related calcium acetates24 and formates,21 calcium and carboxylate ions and oxygen atoms representing water molecules were put into the unit cell and freely translated and rotated. The carboxylate related atom sites were constrained by using rigid bodies in z-matrix notation. Each carboxylate ions was represented by an acetate ion with a refineable site occupancy for the methyl group related carbon site. Due to the limits of the XRPD method the acetate and water related hydrogen sites were omitted. Atoms situated on identical or special positions were identified by using a merging radius of 0.7 Å.38 Acetate and formate anions could be easily distinguished as the site occupancy factor (S.O.F.) for the methyl group related carbon site was found to be either close to one or to zero. Accordingly, the carboxylate ions in the crystal structures were replaced by acetate and formate ions. By inspecting the difference Fourier map, an occupational disorder of acetate and formate ions could be excluded. The global optimisation was carried out several times with different starting sets of atoms and ions and led to identical results within the error limits each time. For the final Rietveld refinements39 all profile and lattice parameters were released iteratively and positions of the calcium and oxygen (hydrate water) atoms were subjected to free unconstrained refinement. The bond lengths and angles of the rigid bodies were refined, restraining them to reasonable values. The final agreement factors are listed in Table S1,‡ the atomic coordinates and selected bond distances are given in Tables S2 and S3,‡ the fits of the whole powder patterns are shown in Fig. S1 in the ESI.‡ The crystallographic data have been deposited at CCDC, deposit numbers: 1948773 and 1948774.‡
Results and discussion
Crystallisation and characterisation of calcium acetate formates
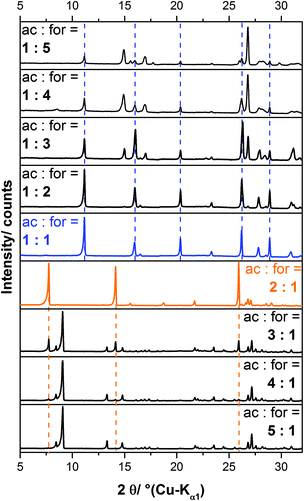
In a systematic approach, mixed calcium acetate formate solutions with acetate to formate ratios (ac![[thin space (1/6-em)]](https://www.rsc.org/images/entities/char_2009.gif) :
:![[thin space (1/6-em)]](https://www.rsc.org/images/entities/char_2009.gif) for) ranging from 5
for) ranging from 5![[thin space (1/6-em)]](https://www.rsc.org/images/entities/char_2009.gif) :
:![[thin space (1/6-em)]](https://www.rsc.org/images/entities/char_2009.gif) 1 to 1
1 to 1![[thin space (1/6-em)]](https://www.rsc.org/images/entities/char_2009.gif) :
:![[thin space (1/6-em)]](https://www.rsc.org/images/entities/char_2009.gif) 5 were slowly evaporated at room temperature in order to initiate the crystallisation of solid calcium acetate formate phases. The XRPD patterns of the obtained solids are presented in Fig. 1. An excess of acetate (ac
5 were slowly evaporated at room temperature in order to initiate the crystallisation of solid calcium acetate formate phases. The XRPD patterns of the obtained solids are presented in Fig. 1. An excess of acetate (ac![[thin space (1/6-em)]](https://www.rsc.org/images/entities/char_2009.gif) :
:![[thin space (1/6-em)]](https://www.rsc.org/images/entities/char_2009.gif) for = 5
for = 5![[thin space (1/6-em)]](https://www.rsc.org/images/entities/char_2009.gif) :
:![[thin space (1/6-em)]](https://www.rsc.org/images/entities/char_2009.gif) 1), leads to the crystallisation of calcium acetate monohydrate. When more formate is present in the starting solution (ac
1), leads to the crystallisation of calcium acetate monohydrate. When more formate is present in the starting solution (ac![[thin space (1/6-em)]](https://www.rsc.org/images/entities/char_2009.gif) :
:![[thin space (1/6-em)]](https://www.rsc.org/images/entities/char_2009.gif) for = 4
for = 4![[thin space (1/6-em)]](https://www.rsc.org/images/entities/char_2009.gif) :
:![[thin space (1/6-em)]](https://www.rsc.org/images/entities/char_2009.gif) 1–3
1–3![[thin space (1/6-em)]](https://www.rsc.org/images/entities/char_2009.gif) :
:![[thin space (1/6-em)]](https://www.rsc.org/images/entities/char_2009.gif) 1), reflections attributed to an additional phase, which could not be assigned to any known compound, are apparent in the powder pattern (Fig. 1, orange, dashed lines). By applying an acetate to formate ratio of 2
1), reflections attributed to an additional phase, which could not be assigned to any known compound, are apparent in the powder pattern (Fig. 1, orange, dashed lines). By applying an acetate to formate ratio of 2![[thin space (1/6-em)]](https://www.rsc.org/images/entities/char_2009.gif) :
:![[thin space (1/6-em)]](https://www.rsc.org/images/entities/char_2009.gif) 1 the unknown byproduct can be obtained as a pure phase. The diffraction pattern could be indexed with a tetragonal unit-cell, P41212 as most probable space group and lattice parameters given in the ESI (Table S1‡). As the synthesis conditions point to a congruent crystallisation, an acetate to formate ratio of 2
1 the unknown byproduct can be obtained as a pure phase. The diffraction pattern could be indexed with a tetragonal unit-cell, P41212 as most probable space group and lattice parameters given in the ESI (Table S1‡). As the synthesis conditions point to a congruent crystallisation, an acetate to formate ratio of 2![[thin space (1/6-em)]](https://www.rsc.org/images/entities/char_2009.gif) :
:![[thin space (1/6-em)]](https://www.rsc.org/images/entities/char_2009.gif) 1 in the solid phase appears to be likely. The elemental analysis points to a phase composition of Ca3(CH3COO)4(HCOO)2·4H2O (Table 1), which was finally confirmed by the crystal structure solution (see below). The diffraction pattern of the solid obtained from a 1
1 in the solid phase appears to be likely. The elemental analysis points to a phase composition of Ca3(CH3COO)4(HCOO)2·4H2O (Table 1), which was finally confirmed by the crystal structure solution (see below). The diffraction pattern of the solid obtained from a 1![[thin space (1/6-em)]](https://www.rsc.org/images/entities/char_2009.gif) :
:![[thin space (1/6-em)]](https://www.rsc.org/images/entities/char_2009.gif) 1 calcium acetate formate solution is completely different (Fig. 1, blue pattern). As the pattern could be indexed with a monoclinic unit cell and P21/c as most probable space group, it can be concluded that a pure solid phase was obtained. The synthesis conditions point to a congruent crystallisation and the elemental analyses (Table 1) also indicate a phase composition of Ca(CH3COO)(HCOO)·H2O, which was finally confirmed by the crystal structure solution (see below). A comparison with the diffraction data of Ca(CH3COO)(HCOO)·H2O given by Tennent and Baird11 shows that the efflorescence phase, which was found by these authors on more than 20 different historic objects and also obtained artificially, is identical to the solid obtained in this study (ESI, Table S4‡). By further increasing the formate content of the solution, additional reflections appear that cannot be assigned to any known solid (Fig. 1). The intensity of the reflections attributed to Ca(CH3COO)(HCOO)·H2O decreases with increasing formate content of the solution (Fig. 1, blue dashed lines), but the phase is still present in a solid obtained from a 1
1 calcium acetate formate solution is completely different (Fig. 1, blue pattern). As the pattern could be indexed with a monoclinic unit cell and P21/c as most probable space group, it can be concluded that a pure solid phase was obtained. The synthesis conditions point to a congruent crystallisation and the elemental analyses (Table 1) also indicate a phase composition of Ca(CH3COO)(HCOO)·H2O, which was finally confirmed by the crystal structure solution (see below). A comparison with the diffraction data of Ca(CH3COO)(HCOO)·H2O given by Tennent and Baird11 shows that the efflorescence phase, which was found by these authors on more than 20 different historic objects and also obtained artificially, is identical to the solid obtained in this study (ESI, Table S4‡). By further increasing the formate content of the solution, additional reflections appear that cannot be assigned to any known solid (Fig. 1). The intensity of the reflections attributed to Ca(CH3COO)(HCOO)·H2O decreases with increasing formate content of the solution (Fig. 1, blue dashed lines), but the phase is still present in a solid obtained from a 1![[thin space (1/6-em)]](https://www.rsc.org/images/entities/char_2009.gif) :
:![[thin space (1/6-em)]](https://www.rsc.org/images/entities/char_2009.gif) 5 calcium acetate formate solution. Broad peak profiles of the reflections attributed to the unknown phase indicate poor crystallinity, hence it was not possible to perform further characterisation of this phase so far.
5 calcium acetate formate solution. Broad peak profiles of the reflections attributed to the unknown phase indicate poor crystallinity, hence it was not possible to perform further characterisation of this phase so far.
| Compound | Carbon/wt% | Hydrogen/wt% | Nitrogen/wt% | |||
|---|---|---|---|---|---|---|
| Calc. | Meas. | Calc. | Meas. | Calc. | Meas. | |
| Ca3(CH3COO)4(HCOO)2·4H2O | 23.2 | 23.2(1) | 4.3 | 4.4(1) | 0.0 | 0.0(1) |
| Ca(CH3COO)(HCOO)·H2O | 22.2 | 22.2(1) | 3.7 | 3.8(1) | 0.0 | 0.0(1) |
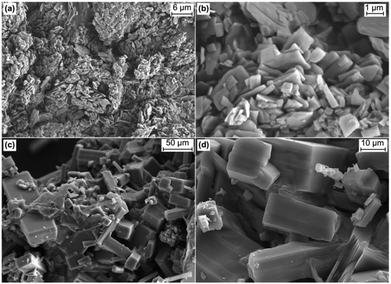
SEM-images were taken from Ca3(CH3COO)4(HCOO)2·4H2O and Ca(CH3COO)(HCOO)·H2O (Fig. 2). The latter crystallises in small (<1 μm), plate-like crystallites that do not show strong aggregation (Fig. 2a and b). In contrast, crystallites of Ca3(CH3COO)4(HCOO)2·4H2O form big (10–100 μm) cuboid-like aggregates (Fig. 2c), which consist of many plate-like crystals (d). The plate like crystal morphology of both calcium acetate formate hydrate phases points to layered structural motifs.
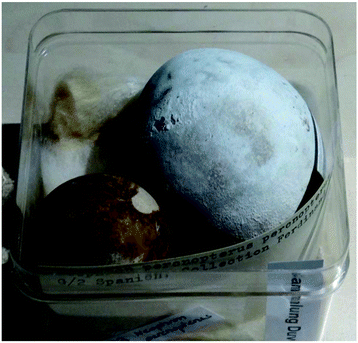
During a sampling campaign of efflorescence phases grown on calcareous heritage objects, molluscs and birds’ eggs, stored in the State Museum of Natural History, Stuttgart, were investigated. One egg that was not protected with a surface coating was completely covered by white efflorescence crystals (Fig. 3). This phenomenon was already described by Tennent and Baird.11 In the measured diffraction pattern of the efflorescence phase (Fig. 4c) reflections attributed to calcium formate (a) are absent, but some reflections can be assigned to calcium acetate monohydrate (b). The main component (90.2 wt%) of the efflorescence salt, however, can be identified as Ca(CH3COO)(HCOO)·H2O (d).
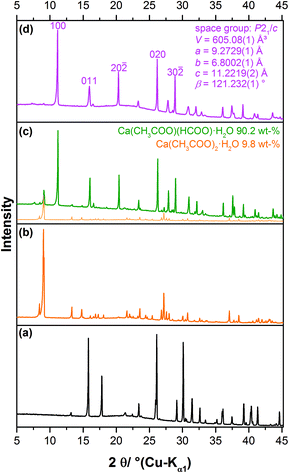 | ||
| Fig. 4 Measured XRPD patterns of (a) Ca(HCOO)2, (b) Ca(CH3-CCOO)2·H2O, (c) the efflorescence crystals collected from the egg shell (Fig. 3) and (d) synthesised Ca(CH3COO)(HCOO)·H2O. | ||
Crystal structure description and comparison
Ca(CH3COO)(HCOO)·H2O crystallises in a centrosymmetric, primitive monoclinic lattice with all atoms situated on general positions (ESI Table S2‡), whereas Ca3(CH3COO)4(HCOO)2·4H2O crystallises in a primitive, non-centrosymmetric tetragonal lattice with one calcium atom (Ca(1)) situated on a special position and all other atoms located on general positions. The crystal structure of Ca(CH3COO)(HCOO)·H2O contains one calcium site that is coordinated by eight oxygen atoms (Fig. 5a). One of these oxygen sites is related to hydrate water (Fig. 5a, red atom), all others to acetate ions, which exhibit both mono- and bidentate coordination modes. The water molecule is situated on apical position, whereas the carboxylate ions bridge neighbouring calcium cations, which results into the formation of infinite calcium carboxylate zig-zag chains (Fig. 6a). In the crystal structure of Ca3(CH3COO)4(HCOO)2·4H2O two calcium sites are apparent. The calcium ion (Ca(1)) situated on a special position is coordinated by eight acetate related oxygen atoms (Fig. 5b), whereas the cation situated on a general position (Ca(2)) is coordinated by seven oxygen atoms related both to acetate and formate anions, as well as to water molecules. In this structure, the water molecules are situated on apical positions. The formate ions exhibit monodentate coordination behaviour, whereas the acetate ions coordinate the calcium cations both in mono- and bidentate modes. Additionally, the acetate ions bridge neighbouring calcium ions, which results in the formation of calcium acetate zig-zag chains (Fig. 6b) in which Ca(1) and Ca(2) sites are arranged in an alternating fashion. One of the most striking differences in the crystal structures of the title compounds is that the calcium carboxylate chain of Ca3(CH3COO)4(HCOO)2·4H2O is constituted of acetate ions, exclusively, whereas in Ca(CH3COO)(HCOO)·H2O it is entirely composed of formate ions. These [Ca(μ2-RCOO)L1L2L3L4]n chains are a common structural motif of efflorescence phases found on calcareous objects.17 Within such a chain, four out of up to eight places in the coordination sphere of calcium are occupied by the bidentate coordinating, bridging carboxylate ions, which represents the backbone of each chain. In the structures of the investigated solids the other places in the coordination spheres of the cations are filled by water molecules and additional carboxylate ions.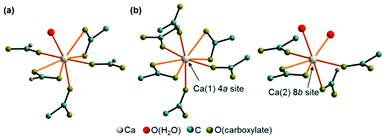 | ||
| Fig. 5 Coordination sphere of the calcium ions in the crystal structure of Ca(CH3COO)(HCOO)·H2O (a) and Ca3(CH3COO)4(HCOO)2·4H2O (b). | ||
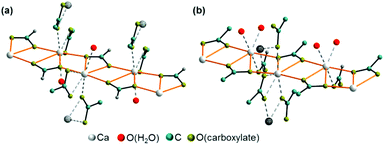 | ||
| Fig. 6 Calcium carboxylate chain as backbone motif in the crystal structures of Ca(CH3COO)(HCOO)·H2O (a) and Ca3(CH3COO)4(HCOO)2·4H2O (b). | ||
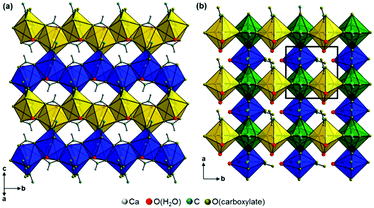
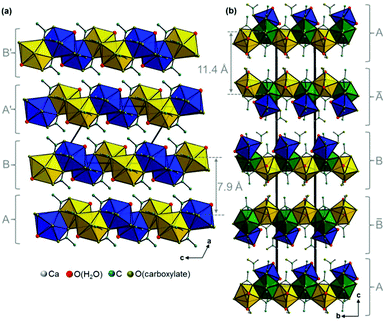
Additional acetate ions bridge neighbouring calcium carboxylate chains, which results in an overall layered motif in both crystal structures (Fig. 7, yellow, blue and green polyhedra) that corresponds to the plate-like crystal morphology (Fig. 2). In the structure of Ca(CH3COO)(HCOO)·H2O the layers are located within the bc-plane with chains running in b-direction (Fig. 7a). Due to a staggered orientation of the zig-zag chains within a layer plane, a honey-comb like motif evolves. The honeycombs are filled by the acetate related methyl groups, hence the packing density of Ca(CH3COO)(HCOO)·H2O is comparatively high, 16.8 Å3 per non-H atom. Another indicator for the high packing density in the structure is the fact, that no additional water molecules or ions are situated in the space in-between the chains. In the crystal structure of Ca3(CH3COO)4(HCOO)2·4H2O two calcium carboxylate chains (Fig. 7b, yellow and blue polyhedra), running in orthogonal directions and sharing half of the calcium-sites (green polyhedra) form layers in the ab-plane. Although there are no additional ions or molecules intercalated in-between the chains, the packing density of Ca3(CH3COO)4(HCOO)2·4H2O is considerably lower (18.5 Å3 per non-H atom) than in Ca(CH3COO)(HCOO)·H2O. This originates from the stacking of the layers. In Ca(CH3COO)(HCOO)·H2O the layers are stacked in a staggered fashion with the calcium carboxylate zig-zag chains shifted by one chain member from one layer to the next one (Fig. 8a). Due to the slight monoclinic distortion of the unit cell, the stacking order can be rationalised to an ABA′B′ sequence, where capital Latin letters describe the position of the layers and the quote indicates the slight deviation of the overall layer position. The stacking order provides a close packing of the layers with an interlayer distance of 7.9 Å indicated by the position of the strong 100 basal reflection (Fig. 4d). Ca3(CH3COO)4(HCOO)2·4H2O exhibits a significantly larger interlayer distance of 11.4 Å and also a different stacking order of the layers (Fig. 8b). Starting from the first layer of the unit cell, the second layer is shifted by one chain member of the calcium carboxylate chains in b-direction. Additionally, the orientation of this layer is inverted. The third layer exhibits no shifting within the ab-plane with respect to the position of the second one, but its orientation is also inverted. The fourth layer is shifted by one chain member in b-direction and therefore located at the position of the first layer in the ab-plane, but the layer orientation is inverted again. In total, the stacking order of Ca3(CH3COO)4(HCOO)2·4H2O can be rationalised to an A![[B with combining macron]](https://www.rsc.org/images/entities/char_0042_0304.gif) BĀ sequence.
BĀ sequence.
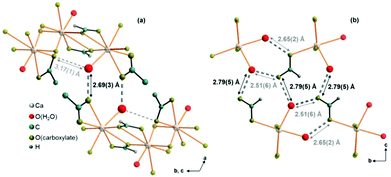
Comparatively short distances between hydrate water and carboxylate related oxygen atoms in the crystal structures of the title compounds point to the presence of both inter- and intra-layer hydrogen bonds (Fig. 9, dashed bonds), which also mediate the interactions between neighbouring layers. In Ca(CH3COO)(HCOO)·H2O, there are short (2.69 Å) O(H2O)⋯O(CH3COO−) inter-layer contacts (Fig. 9, a, dark grey, dashed bonds). The honeycomb-like motif is additionally stabilised by longer (3.19 Å) intra-layer O(H2O)⋯O(CH3COO−) contacts (light grey dashed bonds). In Ca3(CH3COO)4(HCOO)2·4H2O, both, the intra-layer (2.51 and 2.65 Å) and the inter-layer (2.79 Å) O(H2O)⋯O(CH3COO−) contacts are short (Fig. 9b). In Ca(CH3COO)(HCOO)·H2O, only acetate ions act as acceptors for possible H-bonds, whereas in Ca3(CH3COO)4(HCOO)2·4H2O exclusively the formate ions are potential acceptors for H-bonds.
Vibrational spectroscopy
The calcium carboxylate phases were investigated both, by Raman and IR spectroscopy. The complete spectra are presented in the ESI (Fig. S2 and S3‡), excerpts of the spectra are shown in Fig. 10 and a tentative band assignment is given in Table 2. The most prominent bands for substance identification via Raman spectroscopy are the CH-stretching modes at 2942 cm−1 and 2930 cm−1, respectively (5) and the sharp C–C stretching modes at 945 cm−1 and 954 cm−1 (20), respectively. As both modes are acetate-related bands, other efflorescence phases like thecotrichite or Ca2(CH3COO)(HCOO)(NO3)2·4H2O exhibit prominent Raman modes at almost identical positions. Significant differences in the Raman spectra of efflorescence phases grown on calcareous objects are present in the mid-wavenumber region between 1900 cm−1 and 1100 cm−1 (Fig. 10).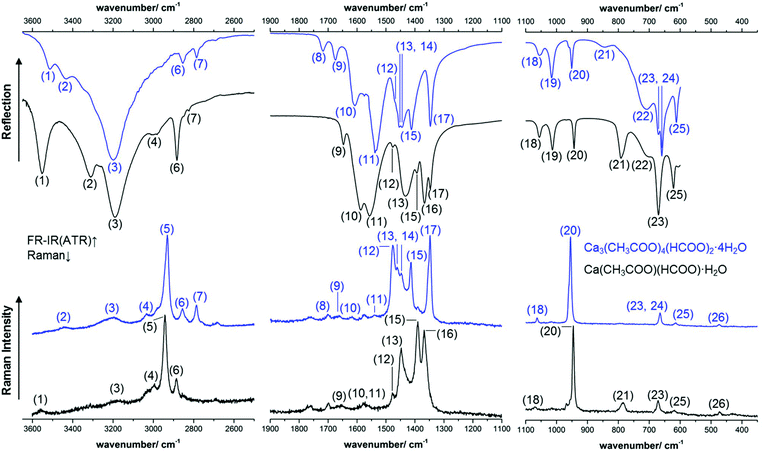 | ||
| Fig. 10 Excerpts of the measured ATR-FT-IR (top) and Raman (bottom) spectra of Ca(CH3COO)(HCOO)·H2O (black lines) and of Ca3(CH3COO)4(HCOO)2·4H2O (blue lines). | ||
| Ca(CH3COO)(HCOO)·H2O | Ca3(CH3COO)4(HCOO)2·4H2O | Assignment | ||||
|---|---|---|---|---|---|---|
| Band no. | Position/cm−1, shape | Band no. | Position/cm−1, shape | |||
| IR | Raman | IR | Raman | |||
| vs: very strong, s: strong, m: medium, br: broad, sh: shoulder. | ||||||
| (1) | 3552, m | ≈3552, br | (1) | 3512, m | — | ν(OH) [hydrate water] |
| (2) | 3310, m | — | (2) | 3432, m | ≈3439, br | |
| (3) | 3189, m | ≈3183, br | (3) | 3197, m | ≈3302, br | |
| (4) | ≈2994, br | 2996, m | (4) | — | 3032, m | ν(CH) [acetate] |
| (5) | — | 2942, vs | (5) | — | 2930, vs | ν(CH, in plane) [formate] |
| (6) | 2884, s | 2884, m | (6) | 2852, s | 2854, s | |
| (7) | 2821, sh | — | (7) | 2785, s | 2785, s | |
| (8) | — | — | (8) | 1716, m | ≈1700, br | δ(HOH)–H2O |
| (9) | 1646, m | ≈1650, br | (9) | 1675, m | ≈1663, br | |
| (10) | 1588, s | ≈1577, br | (10) | 1607, m | ≈1617, br | ν as(CO) [acetate] |
| (11) | 1558, s | — | (11) | 1535, m | ≈1538, br | |
| (12) | 1476, sh | 1478, sh | (12) | ≈1469, sh | 1477, s | ν s(CO) [acetate] |
| (13) | 1431, s | 1448, s | (13) | 1453, m | 1462, sh | |
| (14) | — | — | (14) | 1443, m | 1447, sh | |
| (15) | 1393, sh | 1390, s | (15) | 1411, s | 1412, s | γ(CH, in plane) [formate] |
| (16) | 1367, s | 1367, s | (16) | — | — | ν(CO) [formate] |
| (17) | 1347, s | — | (17) | 1346, s | 1348, s | |
| (18) | 1056, m | ≈1069, br | (18) | 1055, br | 1062, m | ν(CH, out of plane) [formate] |
| (19) | 1013, s | — | (19) | 1015, s | — | |
| (20) | 944, s | 945, vs | (20) | 951, s | 954, vs | ν(CC) [acetate] |
| (21) | 791, m | 785, m | (21) | ≈844, br | — | γ(CO) [formate] |
| (22) | ≈700, sh | — | (22) | 706, br | — | γ(OH)–H2O |
| (23) | 669, s | 670, m | (23) | 669, sh | 664, m | δ(OCO) [acetate] |
| (24) | — | — | (24) | 658, s | ||
| (25) | 621, m | 619, m | (25) | 611, s | 613, br | |
| (26) | — | 471, br | (26) | — | 472, br | ν, ρ, ω(Ca–O), lattice modes |
By the band assignment and by inspection of the band positions several spectral features can be correlated with the determined crystal structures. In the high wavenumber region, the IR spectra are governed by the broad water related OH-stretching modes. In total three hydrate water related OH-stretching modes are apparent in each spectrum, which split over a comparatively large spectral range from 3552 cm−1 to 3189 cm−1 and from 3512 cm−1 to 3183 cm−1 respectively. This is an additional indicator for possible H-bonds within the crystal structures. Despite OH-stretching bands, both formate and acetate related CH-stretching modes are apparent in the high wavenumber region of the vibrational spectra (Fig. 10, 4–7). The mid wavenumber region is governed by overlapping carboxylate related CO-stretching modes (11–14 and 16, 17). For ionic acetates, a splitting of the symmetric and antisymmetric CO-stretching modes of ≈160 cm−1 can be expected.40 The splitting in the measured spectra, however, is smaller, for Ca(CH3COO)(HCOO)·H2O Δν = (82–157) cm−1 and for Ca3(CH3COO)4(HCOO)2·4H2O Δν = (66–164) cm−1 (Table 2). A small splitting of the CO-stretching modes indicates bidentate or bridging coordination of the carboxylate, which was found for the acetate ions in both compounds (Fig. 5). In the low wavenumber region, the bands are more separated and can be assigned to acetate related C–C stretching modes (20), formate related out-of-plane C–H rocking bands (18, 19) and to Ca–O related bands (26). In addition, broad, hydrate water related OH-bending modes are present (22).
Thermal behaviour
The thermal properties of the title compounds were investigated by TG-DTA analysis in a dynamic air atmosphere and by temperature dependent in situ XRPD analysis under static air atmosphere.Ca(CH3COO)(HCOO)·H2O
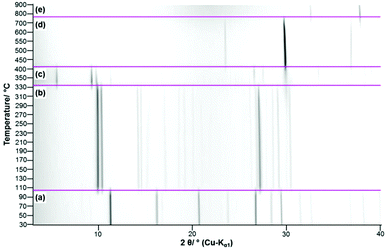
In the TG-curve of Ca(CH3COO)(HCOO)·H2O (Fig. 11, black line) four distinct mass loss steps can be observed. The thermal decomposition of the title compound slowly starts at approx. 80 °C. At ca. 175 °C the first decomposition step, which is associated with an endothermic DTA effect (blue line) is completed. According to the measured mass loss of 11.7 wt% (Table 3), this step is associated with the complete release of hydrate water (calculated mass loss: 11.1 wt%). In the temperature dependent in situ XRPD patterns the Ca(CH3COO)(HCOO)·H2O related reflections suddenly disappear at 130 °C and new reflections appear that cannot be assigned to any known phase (Fig. 12a and b). As the diffraction pattern of the first intermediate can be indexed, the dehydration of the title compound most likely leads to the formation of anhydrous calcium acetate formate, Ca(CH3COO)(HCOO). Indexing of the powder pattern led to a monoclinic unit cell with space group P21/c, a unit-cell volume of 2207.3(3) Å3 and lattice parameters given in Fig. S3 in the ESI.‡ Due to the large unit cell dimensions and the anisotropically broadened peak shapes indicating structural disorder, it was not possible to obtain a structural model that could be refined stably. Further heating led to an additional mass loss steps starting at approx. 300 °C (Fig. 11, black line). Until 425 °C, two overlapping mass loss steps occur that are associated with exothermic DTA effects. In this temperature range, the oxidation of the carboxylate ions in the dynamic air atmosphere can be expected,26 which leads to the formation of calcium carbonate. This is confirmed by the measured total mass loss of 39.2 wt% that is in accordance with the expected value (38.3 wt%) for the decomposition of Ca(CH3COO)(HCOO)·H2O into CaCO3. The in situ XRPD data provide further insights into the thermal decomposition of the carboxylates. At 330 °C the Ca(CH3COO)(HCOO) reflections disappear and new sharp reflections appear (Fig. 12c) that can be assigned to β-Ca(CH3COO)2 and to calcite (CaCO3) (ESI, Fig. S3‡). Accordingly, the second decomposition step is related to the decomposition of the formate ions and the acetate ions decompose shortly afterwards. At 400 °C, only calcite related reflections are apparent in the in situ XRPD patterns (Fig. 12d). By further heating the calcite decomposes in a temperature range between 600 °C and 800 °C (Fig. 11, black line), resulting in the formation of CaO as the final decomposition product, which was also confirmed by in situ XRPD (Fig. 12e). The measured total mass loss of 67.6 wt% is in good accordance with the calculated total mass loss of 67.9 wt% (Fig. 12).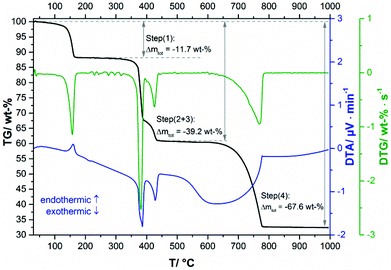 | ||
| Fig. 11 TG curve (black line) with observed mass loss step sizes, DTA (blue line) and DTG curves (green line) of Ca(CH3COO)(HCOO)·H2O. | ||
| Step | Reaction assigned | Calculated Δmtot | Measured Δmtot |
|---|---|---|---|
| (1) | Ca(CH3COO)(HCOO)·H2O → Ca(CH3COO)(HCOO) + H2O↑ | 11.1 wt% | 11.7 wt% |
| (2) | 2Ca(CH3COO)(HCOO) + O2 → β-Ca(CH3COO)2 + CaCO3 + H2O↑ + CO2↑ | 38.3 wt% | 39.2 wt% |
| (3) | β-Ca(CH3COO)2 + CaCO3 + 6O2 → 2CaCO3 + 3H2O↑ + 3CO2↑ | ||
| (4) | 2CaCO3 → 2CaO + 2CO2↑ | 67.9 wt% | 67.6 wt% |
Ca3(CH3COO)4(HCOO)2·4H2O
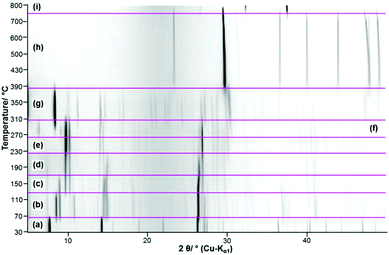
The thermal decomposition of Ca3(CH3COO)4(HCOO)2·4H2O starts at approx. 70 °C. In the TG curve (Fig. 13, black line), the first decomposition step is finished at 110 °C and is associated with an endothermic effect (blue line). Due to the shape of the corresponding DTA and DTG peaks (green) line, the initial decomposition step can also be associated with a two-step process. The temperature dependent in situ XRPD experiment (Fig. 14a and b), however, indicates only one structural transition in this temperature range. After a small plateau, two overlapping mass loss steps that are connected with endothermic DTA effects can be observed in the range between 130 °C and 230 °C. Afterwards an extended plateau is reached in the TG-curve. The first three decomposition steps can be assigned to the release of hydrate water (Table 4), as the observed total mass loss (14.2 wt%) is in good agreement with the expected value (13.9 wt%). The in situ XRPD patterns indicate three structural transitions (Fig. 14a–d). As none of the patterns of the intermediates can be indexed, the dehydration of Ca3(CH3COO)4(HCOO)2·4H2O seems to lead to multiphase mixtures. Anhydrous Ca(CH3COO)(HCOO) as observed during the thermal decomposition of Ca(CH3COO)(HCOO)·H2O could be identified as one of the intermediates (Fig. 14c and d). All other observed reflections could not be assigned to any known compound. Hence the dehydration of Ca3(CH3COO)4(HCOO)2·4H2O leads to the formation of hitherto unknown calcium acetate or acetate formate subhydrate or anhydrate phases. Further heating of the dehydrated Ca3(CH3COO)4(HCOO)2·4H2O in a dynamic air atmosphere results in a complex combustion process of the carboxylates starting at around 300 °C that is associated with exothermic effects (Fig. 13). According to the thermal analysis, the combustion is an at least four-step process and also the in situ XRPD experiment indicates four structural transitions (Fig. 14d–h). The related intermediates are multiphase mixtures consisting of unknown phases. Calcite was identified as the final product of the combustion (Fig. 14h). The observed mass loss for the total decomposition of Ca3(CH3COO)4(HCOO)2·4H2O into calcite (42.2 wt%, Table 4) is in good agreement with the expected value (42.1 wt%). At around 600 °C, the slow decomposition of calcite into calcium oxide starts, which is completed at 800 °C (Fig. 13), which is confirmed both by the in situ XRPD measurements (Fig. 14i) and by the match of the observed and calculated total mass loss of thermal decomposition of Ca3(CH3COO)4(HCOO)2·4H2O (Table 4).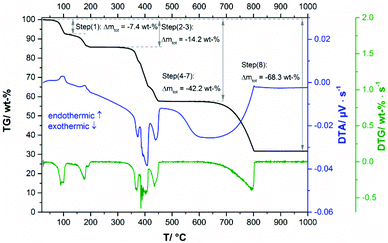 | ||
| Fig. 13 TG curve (black line) with observed mass loss step sizes, DTA (blue line) and DTG curves (green line) of Ca3(CH3COO)4(HCOO)2·4H2O. | ||
| Steps | Process | Calculated Δmtot | Measured Δmtot |
|---|---|---|---|
| (1)–(3) | Release of 4 molecules of hydrate water | 13.9 wt% | 14.2 wt% |
| (4)–(7) | Decomposition of the carboxylate ions yielding pure calcite | 42.1 wt% | 42.2 wt% |
| (8) | Decomposition of calcite into calcium oxide | 67.6 wt% | 68.3 wt% |
Conclusions
Systematic investigation on the solid phase formation in the ternary system Ca(CH3COO)2–Ca(HCOO)2–H2O at room temperature led to the congruent crystallisation of two solid calcium acetate formate hydrates: the hitherto unknown Ca3(CH3COO)4(HCOO)2·4H2O and Ca(CH3COO)(HCOO)·H2O, which has been only poorly characterised yet. The latter is a frequently observed efflorescence phase found on calcareous objects and it could be identified as a corrosion phase in a natural history collection of eggs. The phase compositions were determined both by elemental and thermal analyses. The presence of acetate and formate ions in both solids was confirmed by Raman and IR spectroscopy. Due to the polycrystalline character of the obtained samples, the crystal structures were solved ab initio from laboratory XRPD data employing the method of simulated annealing as global optimisation method. Calcium carboxylate zig-zag chains [Ca(μ2-RCOO)+]n (with R = CH3 or H) are the main motif of both crystal structures. In Ca3(CH3COO)4(HCOO)2·4H2O these chains are exclusively composed of acetate ions, whereas in Ca(CH3COO)(HCOO)·H2O only formate ions are situated in the chains. The remaining places in the seven- to eightfold coordination sphere of the calcium cations are filled by water molecules and additional carboxylate ions that interconnect neighbouring chains which leads to layered motifs in both structures. Intra- and interlayer interactions are mediated by strong O(H2O)⋯O(carboxylate) contacts. Both the systematic crystallisation experiments and the in situ XRPD studies on the thermal dehydration of the title compounds demonstrate that there is a variety of additional, non-characterised calcium acetate formate phases.The presented structural and spectral data of Ca3(CH3COO)4(HCOO)2·4H2O and Ca(CH3COO)(HCOO)·H2O can be used as basis for an easy identification and quantitative analysis of the white efflorescence salts especially in museums and collections worldwide. Furthermore, this study provides deeper insights into the formation mechanism of the efflorescence phases. In the systematic crystallisation experiments the frequently observed efflorescence phases Ca(CH3COO)(HCOO)·H2O and Ca(CH3COO)2·H2O never crystallised simultaneously from aqueous solution. Tennent and Baird,11 however, often observed mixtures of these two phases as efflorescence salts. In consequence, it appears likely that these phases did not crystallise from a pore solution of a calcareous heritage object, but instead by direct attack of the carboxylic acids to the calcareous material.
Conflicts of interest
There are no conflicts to declare.Acknowledgements
Norman H. Tennent's work on calcium acetate efflorescence in collections greatly inspired our research. Svenja Kampe surveyed, sampled and analysed collections of the State Museum of Natural History, Stuttgart, during her MA studies in Objects’ Conservation at the Stuttgart State Academy of Art and Design. Dr Jörg Stelzner from the same institution is acknowledged for measuring the Raman spectra, M.Sc. Alexander M. Pütz from the Max Planck Institute for Solid State Research for measuring the IR-spectra and Christine Stefanie for the XRPD measurements of the corrosion phase. M.Sc. Maurice Conrad is acknowledged for performing the elemental analyses. Funding by DFG for the project “In Search of Structure” (grant EG 137/9-1) is gratefully acknowledged. A stay at the British Museum was supported by the Transnational Access to Research Infrastructures activity in the H2020 Programme of the EU (IPERION CH Grant Agreement no. 654028) Open Access funding provided by the Max Planck Society.References
- A. Boccia Paterakis and M. Steiger, Stud. Conserv., 2015, 60, 172–184 CrossRef.
- S. Bette, G. Eggert, A. Fischer and R. E. Dinnebier, Inorg. Chem., 2017, 56, 5762–5770 CrossRef CAS PubMed.
- G. Eggert, Corros. Eng., Sci. Technol., 2010, 45, 414–419 CrossRef CAS.
- A. Fischer, Glass induced metal corrosion of museums exhibits, PhD thesis, State Academy of Arts and Design, Stuttgart, 2016 Search PubMed.
- L. T. Gibson and C. M. Watt, Corros. Sci., 2010, 52, 172–178 CrossRef CAS.
- H. Euler, B. Barbier, A. Kirfel, S. Haseloff and G. Eggert, Z. Kristallogr. - New Cryst. Struct., 2009, 224, 609–610 CrossRef CAS.
- S. Bette, A. Fischer, J. Stelzner, G. Eggert and R. E. Dinnebier, Eur. J. Inorg. Chem., 2019, 2019, 920–927 CrossRef CAS.
- R. E. Dinnebier, T. Runčevski, A. Fischer and G. Eggert, Inorg. Chem., 2015, 54, 2638–2642 CrossRef CAS PubMed.
- A. Fischer, G. Eggert, R. Dinnebier and T. Runčevski, Stud. Conserv., 2017, 63, 342–355 CrossRef.
- L. F. G. Byne, J. Conchol., 1899, 9, 172–178 Search PubMed.
- N. H. Tennent and T. Baird, Stud. Conserv., 1985, 30, 73–85 CAS.
- J. H. L. Voncken, T. W. Verkroost and M. M. Van Tooren, Neues Jahrb. Mineral., Monatsh., 2001, 210–220 CAS.
- L. T. Gibson, B. G. Cooksey, D. Littlejohn and N. H. Tennent, Anal. Chim. Acta, 1997, 337, 151–164 CrossRef CAS.
- R. van Tassel, Acta Crystallogr., 1958, 11, 745–746 CrossRef CAS.
- G. S. Wheeler and M. T. Wypyski, Stud. Conserv., 1993, 38, 55–62 CAS.
- K. Zehnder and A. Arnold, Stud. Conserv., 1984, 29, 32–34 CAS.
- S. Bette, G. Eggert, A. Fischer, J. Stelzner and R. E. Dinnebier, Corros. Sci., 2018, 132, 68–78 CrossRef CAS.
- B. G. Cooksey, L. T. Gibson, A. R. Kennedy, D. Littlejohn, L. Stewart and N. H. Tennent, Acta Crystallogr., Sect. C: Cryst. Struct. Commun., 1999, 55, 324–326 CrossRef.
- B. F. Mentzen and C. Comel, J. Solid State Chem., 1974, 9, 214–223 CrossRef CAS.
- C. Comel and B. F. Mentzen, J. Solid State Chem., 1974, 9, 210–213 CrossRef CAS.
- M. O. Bargouth and G. Will, Cryst. Struct. Commun., 1980, 9, 605–613 CAS.
- L. Walter-Levy and J. Laniepce, C. R. Hebd. Seances Acad. Sci., 1960, 250, 3320–3322 CAS.
- E. A. Klop, A. Schouten, P. van der Sluis and A. L. Spek, Acta Crystallogr., Sect. C: Cryst. Struct. Commun., 1984, 40, 51–53 CrossRef.
- P. van der Sluis, A. Schouten and A. L. Spek, Acta Crystallogr., Sect. C: Cryst. Struct. Commun., 1987, 43, 1922–1924 CrossRef.
- R. Helems, L. B. Cole and E. M. Holt, Inorg. Chim. Acta, 1988, 152, 9–15 CrossRef CAS.
- J. Panzer, J. Chem. Eng. Data, 1962, 7, 140–142 CrossRef CAS.
- G. Giuseppetti, C. Tadini and L. Ungaretti, Period. Mineral., 1972, 41, 9–21 CAS.
- N. Wahlberg, T. Runčevski, R. E. Dinnebier, A. Fischer, G. Eggert and B. B. Iversen, Cryst. Growth Des., 2015, 15, 2795–2800 CrossRef CAS.
- G. Eggert, S. Bette, R. E. Dinnebier, A. Fischer, J. Stelzner and G. Verharr, Archäometrie und Denkmalpflege 2018: Proceedings, 2018-01, 14–17.
- S. Bette, R. K. Kremer, G. Eggert, C. C. Tang and R. E. Dinnebier, Dalton Trans., 2017, 46, 14847–14858 RSC.
- S. Bette, R. Kremer, G. Eggert and R. E. Dinnebier, Dalton Trans., 2018, 47, 8209–8220 RSC.
- A. Apelblat and E. Manzurola, J. Chem. Thermodyn., 1999, 31, 1347–1357 CrossRef CAS.
- A. A. Coelho, J. Appl. Crystallogr., 2018, 51, 210–218 CrossRef CAS.
- A. A. Coelho, J. Appl. Crystallogr., 2003, 36, 86–95 CrossRef CAS.
- A. Le Bail, H. Duroy and J. L. Fourquet, Mater. Res. Bull., 1988, 23, 447–452 CrossRef CAS.
- R. W. Cheary, A. A. Coelho and J. P. Cline, J. Res. Natl. Inst. Stand. Technol., 2004, 109, 1–25 CrossRef CAS PubMed.
- A. A. Coelho, J. Appl. Crystallogr., 2000, 33, 899–908 CrossRef CAS.
- V. Favre-Nicolin and R. Černý, Mater. Sci. Forum, 2004, 443–444, 35–38 CAS.
- H. M. Rietveld, J. Appl. Crystallogr., 1969, 2, 65–71 CrossRef CAS.
- G. Deacon, Coord. Chem. Rev., 1980, 33, 227–250 CrossRef CAS.
- R. S. Krishnan and P. S. Ramanujam, J. Raman Spectrosc., 1973, 1, 533–538 CrossRef CAS.
- P. Baraldi and G. Fabbri, Spectrochim. Acta, Part A, 1981, 37, 89–92 CrossRef.
- P. Baraldi, Spectrochim. Acta, Part A, 1982, 38, 51–55 CrossRef.
- E. Spinner, J. Chem. Soc., 1964, 4217–4226, 10.1039/jr9640004217.
Footnotes |
| † Dedicated to Professor Norman H. Tennent on the occasion of his 70th birthday. |
| ‡ Electronic supplementary information (ESI) available. CCDC 1948773 and 1948774. For ESI and crystallographic data in CIF or other electronic format see DOI: 10.1039/c9dt03558c |
| This journal is © The Royal Society of Chemistry 2019 |

