 Open Access Article
Creative Commons Attribution 3.0 Unported Licence
Crystal structure and stacking faults in the layered honeycomb, delafossite-type materials Ag3LiIr2O6 and Ag3LiRu2O6†
Sebastian
Bette
 *a,
Tomohiro
Takayama
ab,
Viola
Duppel
a,
Agnieszka
Poulain
c,
Hidenori
Takagi
 ab and
Robert E.
Dinnebier
 a
a
aMax Planck Institut for Solid State Research, Heisenbergstraße 1, 70569 Stuttgart, Germany. E-mail: S.Bette@fkf.mpg.de
bUniversity of Stuttgart, Institute for functional Matter and Quantum Technologies, Pfaffenwaldring 57, 70569 Stuttgart, Germany
cEuropean Synchrotron Radiation Facility (ESRF), 71 avenue des Martyrs, Grenoble, France
First published on 28th May 2019
Abstract
Powder samples of Ag3LiIr2O6 and Ag3LiRu2O6 were synthesized from α-Li2IrO3 and Li2RuO3 respectively by ion exchange in an AgNO3 melt. The crystal structures of the title compounds were solved from high resolution laboratory X-ray powder diffraction (XRPD) patterns and from pair distribution function (PDF) analysis using synchrotron X-ray powder diffraction data. In both crystal structures edge sharing LiO6/3- and (Ir/Ru)O6/3-octahedra form honeycomb like layers that are stacked in a staggered fashion. Silver cations, situated in-between the layers mediate the interlayer interactions by linear O–Ag–O bonds. Anisotropic peak broadening in the XRPD patterns and diffuse scattering occurring as streaks in the precession electron diffraction (PED) patterns indicate the presence of stacking faults, which could be also visualized by high resolution transmission electron microscopy (HRTEM). Possible alternative stacking sequences were derived from the ideal crystal and incorporated into a microstructure model. By applying a supercell approach that randomly generates and averages stacking sequences based on transition probabilities and combining it with a grid search algorithm, the microstructures, i.e. the degrees of faulting in the structures of the title compounds were refined to the measured XRPD data. In result the crystal structures of Ag3LiIr2O6 and Ag3LiRu2O6 were found to be vastly faulted with almost no coherence of the stacked layers.
Introduction
Iridium oxides as α-1 and β-Li2IrO3![[thin space (1/6-em)]](https://www.rsc.org/images/entities/char_2009.gif) 2,3 with a honeycomb like motif in their layered structure and related iridates, like Na2IrO3
2,3 with a honeycomb like motif in their layered structure and related iridates, like Na2IrO3![[thin space (1/6-em)]](https://www.rsc.org/images/entities/char_2009.gif) 4,5 are currently attracting broad interest in the field of quantum magnetism and frustrated magnetism6 because of their possible relevance for the Kitaev quantum spin liquid state.7 A honeycomb layer is built up from edge sharing Mn+O6/2(6−n)− octahedra forming condensed 6-fold rings. The charge balance is maintained by incorporation of cations like alkali metals or protons in the octahedral void in the centre of the 6-fold ring or into the interlayer space. The geometry of the interlayer voids depends on the stacking of the honeycomb layers. In α-Li2IrO31 the layers are stacked in an (aγb)□(cβa)□(bαc)□ fashion where the position of the anion sub-lattice is indicated by small Latin letters, the position of the cation sub-lattice is indicated by small Greek letters, the layers are indicated with round brackets and interlayer voids with “□”. This stacking order leads to trigonal-antiprismatic, i.e. octahedral, interlayer voids, which are filled with lithium cations. The phase composition of α-Li2IrO3 can also be given as Li′3Li′′Ir2O6, where Li′ denotes interlayer lithium and Li′′ denotes intralayer lithium. By acid treatment the interlayer lithium can be exchanged with protons, leading to a H3′Li′′Ir2O6 phase.8 In this phase the layers exhibit an (aγb)□(bαc)□(cβa)□ stacking order, which leads to trigonal-prismatic interlayer voids. Due to the honeycomb motif, several stacking orders exist that lead to trigonal-prismatic interlayer voids. In consequence the stacking order in this phase doesn't need to be homogenous; changes in the direction of stacking order appear as planar defects, i.e. stacking faults. In fact, the crystal structure of H3LiIr2O6 was found to be heavily faulted.9
4,5 are currently attracting broad interest in the field of quantum magnetism and frustrated magnetism6 because of their possible relevance for the Kitaev quantum spin liquid state.7 A honeycomb layer is built up from edge sharing Mn+O6/2(6−n)− octahedra forming condensed 6-fold rings. The charge balance is maintained by incorporation of cations like alkali metals or protons in the octahedral void in the centre of the 6-fold ring or into the interlayer space. The geometry of the interlayer voids depends on the stacking of the honeycomb layers. In α-Li2IrO31 the layers are stacked in an (aγb)□(cβa)□(bαc)□ fashion where the position of the anion sub-lattice is indicated by small Latin letters, the position of the cation sub-lattice is indicated by small Greek letters, the layers are indicated with round brackets and interlayer voids with “□”. This stacking order leads to trigonal-antiprismatic, i.e. octahedral, interlayer voids, which are filled with lithium cations. The phase composition of α-Li2IrO3 can also be given as Li′3Li′′Ir2O6, where Li′ denotes interlayer lithium and Li′′ denotes intralayer lithium. By acid treatment the interlayer lithium can be exchanged with protons, leading to a H3′Li′′Ir2O6 phase.8 In this phase the layers exhibit an (aγb)□(bαc)□(cβa)□ stacking order, which leads to trigonal-prismatic interlayer voids. Due to the honeycomb motif, several stacking orders exist that lead to trigonal-prismatic interlayer voids. In consequence the stacking order in this phase doesn't need to be homogenous; changes in the direction of stacking order appear as planar defects, i.e. stacking faults. In fact, the crystal structure of H3LiIr2O6 was found to be heavily faulted.9
The presence of stacking faults is in general a common phenomenon in layered honeycomb iridates that seriously impedes their structural characterization.4,10,11 The occurrence of defects causes diffuse scattering that among others can lead to strong peak broadening.12 In heavily faulted structures broadened reflections merge with the background, which can lead to artificial lower peak intensities, if the peak shapes are not properly modeled. Vast peak broadening may also lead to an artificial higher lattice symmetry, as stacking faults break the translational symmetry and it is therefore impossible to select a unit cell in the corresponding directions. In consequence, if the occurrence of stacking fault disorder and therefore the microstructure of the sample is neglected during the process of the crystal structure solution, an occupational disorder in the intralayer cation sublattice is introduced, which is connected with a higher lattice symmetry. Thus the crystal structure of H3LiIr2O6 was first described as a CrOOH-type structure with space group R![[3 with combining macron]](https://www.rsc.org/images/entities/char_0033_0304.gif) m1 and with a completely disordered intralayer cation-sublattice.8 By considering planar defects and developing a suitable microstructural model, the crystal structure of H3LiIr2O6 was further sharpened to a layered honeycomb structure in space group C2/m with a completely ordered cation sublattice.9 A detailed understanding of the crystal structures of honeycomb lattices is crucial, as H3LiIr2O6 was found to be the first materialization of the quantum spin liquid state on a honeycomb lattice,13 that may be relevant for the Kitaev quantum spin liquid.7 The interlayer protons in H3LiIr2O6 which exhibit a linear coordination can be replaced by silver cations. In consequence the interlayer distance is increased and therefore interlayer interactions may be decreased. Furthermore intralayer Ir4+ as a d5 cation can be replaced by Ru4+, a d4 cation with a comparable ionic radius (r(Ir4+) = 0.765 Å, r(Ru4+) = 0.760 Å).14 This leads to Ag3LiIr2O6 (
m1 and with a completely disordered intralayer cation-sublattice.8 By considering planar defects and developing a suitable microstructural model, the crystal structure of H3LiIr2O6 was further sharpened to a layered honeycomb structure in space group C2/m with a completely ordered cation sublattice.9 A detailed understanding of the crystal structures of honeycomb lattices is crucial, as H3LiIr2O6 was found to be the first materialization of the quantum spin liquid state on a honeycomb lattice,13 that may be relevant for the Kitaev quantum spin liquid.7 The interlayer protons in H3LiIr2O6 which exhibit a linear coordination can be replaced by silver cations. In consequence the interlayer distance is increased and therefore interlayer interactions may be decreased. Furthermore intralayer Ir4+ as a d5 cation can be replaced by Ru4+, a d4 cation with a comparable ionic radius (r(Ir4+) = 0.765 Å, r(Ru4+) = 0.760 Å).14 This leads to Ag3LiIr2O6 (![[triple bond, length as m-dash]](https://www.rsc.org/images/entities/char_e002.gif) Ag(Li⅓Ir⅔)O2) and Ag3LiRu2O6 (
Ag(Li⅓Ir⅔)O2) and Ag3LiRu2O6 (![[triple bond, length as m-dash]](https://www.rsc.org/images/entities/char_e002.gif) Ag(Li⅓Ru⅔)O2) phases, that can be considered as modified delafossites15 (CuMO2 and AgMO2).16,17 For these compounds average crystal structure models in space group R
Ag(Li⅓Ru⅔)O2) phases, that can be considered as modified delafossites15 (CuMO2 and AgMO2).16,17 For these compounds average crystal structure models in space group R![[3 with combining macron]](https://www.rsc.org/images/entities/char_0033_0304.gif) m1 with a completely disordered intralayer cation-sublattice have been already reported in the literature18,19 The presence of planar defects and a most likely completely honeycomb-like intralayer cation-sublattice was expected for Ag3LiIr2O6 by Todorova et al.18 The authors derived a microstructure model from recursive DIFFaX20 simulations and approximated the diffraction line shapes by anisotropic microstrain broadening models.21,22 A refinement of the real crystal structure that includes the planar defects, however, could not be carried out.
m1 with a completely disordered intralayer cation-sublattice have been already reported in the literature18,19 The presence of planar defects and a most likely completely honeycomb-like intralayer cation-sublattice was expected for Ag3LiIr2O6 by Todorova et al.18 The authors derived a microstructure model from recursive DIFFaX20 simulations and approximated the diffraction line shapes by anisotropic microstrain broadening models.21,22 A refinement of the real crystal structure that includes the planar defects, however, could not be carried out.
In this study we describe the solution of the real crystal structure of the layered honeycomb delafossite-type phases Ag3LiIr2O6 and Ag3LiRu2O6, which also includes the development of suitable microstructure models and their refinement to the measured data.
Experimental section
Phase synthesis
The polycrystalline samples of Ag3LiRu2O6 and Ag3LiIr2O6 were synthesized by ion-exchange reactions from Li2RuO3 and α-Li2IrO3 powders, respectively. The precursors were obtained by a solid state reaction using powders of Li2CO3 and RuO2 or IrO2. The precursor powder was mixed with a 10-times excess of AgNO3. The mixture was heated at 240 °C for 72 hours in an alumina crucible, and cooled to room temperature at a rate of 20 K per hour. At high-temperatures, the interlayer Li+ ions of Li2RuO3 or α-Li2IrO3 were replaced with Ag+ through the following reactions: | (1) |
The product was rinsed with distilled water to remove the excess of AgNO3 and resulting LiNO3, and dried at room temperature.
Phase characterization
Synchrotron X-ray powder diffraction
Synchrotron X-ray total scattering patterns of the samples were recorded in Debye–Scherrer mode at the European Synchrotron Radiation Facility (ESRF), Grenoble (France), at a wavelength of λ = 0.18087 Å (≈ 68.5 keV) on beamline ID31 in rapid acquisition mode.25 Diffracted X-rays were detected using a single photon counting detector (Dectris, Pilatus3X CdTe 2 M with 172 × 172 μm2 pixel size) mounted orthogonal to the beam path with a sample-to-detector distance of 273.35 mm. The measured samples were sealed in kapton tubes of 1.0 mm diameter. The collected Debye–Scherrer rings were subsequently azimuthally integrated with the pyFAI-software26 to one-dimensional powder diffraction patterns in Q [nm−1] and 2θ [°] versus intensity. Parameters for intensity integration were determined from a NIST CeO2 reference sample (SRM 674b). Further mask generation, polarization correction, and azimuthal integration of the 2D patterns was performed using the xpdtools software.27 Using the software TOPAS,28 Rietveld29 refinements were carried out, applying the fundamental parameter method30,31 for peak modelling and Chebyshev polynomials for modelling the background.Pair distribution function (PDF) analyses
PDFGETX232 was used to correct and normalize the diffraction data and the Fourier transform in order to obtain the experimental pair distribution function (PDF), G(r). The Q range used in the Fourier transform was limited to 30 Å−1. Nickel was previously measured as a standard material to determine the Q-damp and Q-broad parameters which are the parameters that correct the PDF envelope function for instrumental resolution effects.33,34Results and discussion
Phase characterization
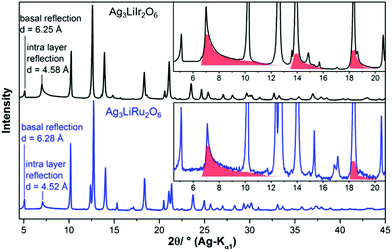
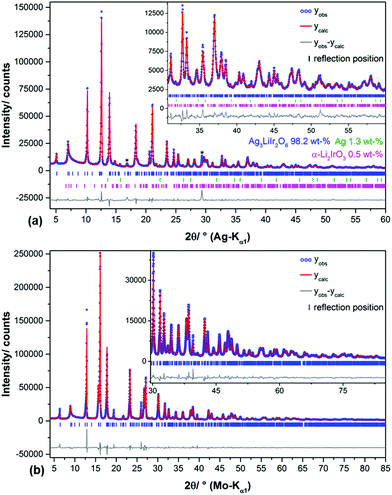
In the diffraction pattern of Ag3LiRu2O6, all peaks can be assigned to the title compound. The diffraction pattern of Ag3LiIr2O6 exhibits weak peaks that can be assigned to elemental silver and to α-Li2IrO3. The final Rietveld refinement (ESI, Fig. S1†) revealed the content of impurities to be very low (1.3 wt% Ag and 0.5 wt% α-Li2IrO3). As expected the isotypic compounds Ag3LiIr2O6 and Ag3LiRu2O6 show almost identical XRPD patterns (Fig. 1). Slight differences in the reflection positions point to slightly different unit cell metrics. Some reflections show large anisotropic broadening and characteristic triangular peak shapes (red highlighted areas), which is indicative of heavily stacking faulted samples.35Ab initio indexing by an iterative use of singular value decomposition36 didn't lead to an unambiguous result, as the XRPD pattern can be indexed both with a trigonal unit cell with P31, P3121 and P3112 as most probable space groups or with a monoclinic unit cell with C2, Cm and C2/m as most probable space group (Table 1).![[thin space (1/6-em)]](https://www.rsc.org/images/entities/char_2009.gif) 18 and Ag3LiRu2O6
18 and Ag3LiRu2O6![[thin space (1/6-em)]](https://www.rsc.org/images/entities/char_2009.gif) 19 and the corresponding transformed, enlarged trigonal and monoclinic settings
19 and the corresponding transformed, enlarged trigonal and monoclinic settings
| Ag3LiIr2O6 | Ag3LiRu2O6 | |||||
|---|---|---|---|---|---|---|
| Rhombohedral cell | Alternative trigonal cell | Monoclinic cell | Rhombohedral cell | Alternative trigonal cell | Monoclinic cell | |
| Space group |
R![[3 with combining macron]](https://www.rsc.org/images/entities/char_0033_0304.gif) m1 m1 |
P3112/P3121 | C2/m |
R![[3 with combining macron]](https://www.rsc.org/images/entities/char_0033_0304.gif) m1 m1 |
P3112/P3121 | C2/m |
| V/Å3 | 150.7 | 452.1 | 301.4 | 149.5 | 348.5 | 299.0 |
| Z | 1 | 3 | 2 | 1 | 3 | 2 |
| No. of layers | 3 | 3 | 1 | 3 | 3 | 1 |
| a/Å | 3.0478 | 5.2789 | 5.2789 | 3.0642 | 5.3074 | 5.3074 |
| b/Å | 3.0478 | 5.2789 | 9.1434 | 3.0642 | 5.3074 | 9.1926 |
| c/Å | 18.7335 | 18.7335 | 6.4877 | 18.3861 | 18.3861 | 6.3789 |
| α/° | 90 | 90 | 90 | 90 | 90 | 90 |
| β/° | 90 | 90 | 105.3 | 90 | 90 | 106.1 |
| γ/° | 120 | 120 | 90 | 120 | 120 | 90 |
| Stacking vectors | 1 | 3, circular sequence | 1 | 1 | 3, circular sequence | 1 |
| Independent sites/layer | 3 | 7 | 6 | 3 | 7 | 6 |
Evaluation of the 3R-type structure models
The 3R-type structure models comprise a complete occupational disorder between Li and Ru/Ir and hence a small rhombohedral unit cell in a- and b-dimension (Fig. 2, a, black cell edges). A completely ordered intra-layer cation sublattice with a honeycomb motif leads to an expanded unit cell in the ab-plane (Table 1), that can be described both by a trigonal (blue cell edges) and a monoclinic cell metric (green cell edges). Pawley fits37 were employed in order to evaluate the considered unit cell metrics (Fig. 2b–d). By using the rhombohedral, small unit cell (Fig. 2a, black cell edges) several reflections at (8.9, 19.9 and 23.9)° 2θ cannot be modeled (Fig. 2b, *), which indicates that the cell is too small and/or that the space group symmetry too high to describe the real layer constitution. Both the large trigonal and monoclinic unit cells (Fig. 2a, green and blue cell edges) yield equivalent Pawley fits, in which the reflections at (8.9, 19.9 and 23.9)° 2θ (Fig. 2c and d) are included. | ||
Fig. 2 (a) Topview on the Li(Ru/Ir)2O63− layers in the proposed crystal structure models of Ag3LiIr2O6![[thin space (1/6-em)]](https://www.rsc.org/images/entities/char_2009.gif) 18 and Ag3LiRu2O6.19 The ab-plane of the rhombohedral unit cell, which includes an occupational disorder of Li and Ir/Ru is indicated by black bars, the ab-plane of the transformed monoclinic unit cell with an ordered, honey-comb lattice cation sublattice is indicated by green bars. Pawley fit of the measured diffraction pattern of Ag3LiRu2O6 using the rhombohedral unit cell (space group R 18 and Ag3LiRu2O6.19 The ab-plane of the rhombohedral unit cell, which includes an occupational disorder of Li and Ir/Ru is indicated by black bars, the ab-plane of the transformed monoclinic unit cell with an ordered, honey-comb lattice cation sublattice is indicated by green bars. Pawley fit of the measured diffraction pattern of Ag3LiRu2O6 using the rhombohedral unit cell (space group R![[3 with combining macron]](https://www.rsc.org/images/entities/char_0033_0304.gif) m1) of the proposed structure model (b) with reflections that are not modelled using this unit cell indicated by “*”, and using the alternative trigonal cell (space group P3121/P3112) (c) and the transformed monoclinic unit cell (space group C2/m) (d) (Table 1). m1) of the proposed structure model (b) with reflections that are not modelled using this unit cell indicated by “*”, and using the alternative trigonal cell (space group P3121/P3112) (c) and the transformed monoclinic unit cell (space group C2/m) (d) (Table 1). | ||
As Todorova et al.18 already described the different cell settings arise from different stacking orders of the layers. The trigonal cell metric with space group P3121/P3112 leads to a circular stacking sequence of three stacking vectors, whereas the C-centered monoclinic cell describes a homogenous stacking sequence. Due to the presence of planar defects the coherence of the stacking order is almost lost for both compounds as indicated by the severe broadening of the 10![[1 with combining macron]](https://www.rsc.org/images/entities/char_0031_0304.gif) , 10
, 10![[2 with combining macron]](https://www.rsc.org/images/entities/char_0032_0304.gif) and the 103 reflection or the 110, 11
and the 103 reflection or the 110, 11![[1 with combining macron]](https://www.rsc.org/images/entities/char_0031_0304.gif) and the 021 reflections, respectively (Fig. 2c and d). Hence we decided to use the monoclinic cell setting for describing the ideal, faultless crystal structures, i.e. primarily the layer constitutions of Ag3LiIr2O6 and Ag3LiRu2O6, as this unit cell setting contains less symmetrically independent atomic sites per layer (Table 1) and can be therefore refined by using fewer parameters.
and the 021 reflections, respectively (Fig. 2c and d). Hence we decided to use the monoclinic cell setting for describing the ideal, faultless crystal structures, i.e. primarily the layer constitutions of Ag3LiIr2O6 and Ag3LiRu2O6, as this unit cell setting contains less symmetrically independent atomic sites per layer (Table 1) and can be therefore refined by using fewer parameters.
Solution and description of the ideal, faultless crystal structures
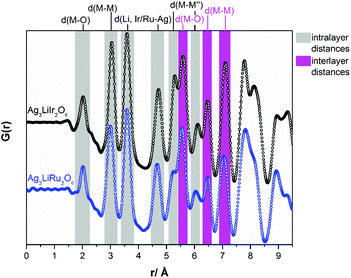
![[thin space (1/6-em)]](https://www.rsc.org/images/entities/char_2009.gif) 9 was used as a starting model and the M–O and M–M distances were softly restrained to ≈2.0 Å and ≈3.0 Å respectively by applying a flat artificial penalty function in order to stabilize the refinements. PDF-analysis (Fig. 4) was used to derive reasonable values for these restraints on the interatomic distances. This procedure led, as described for H3LiIr2O6
9 was used as a starting model and the M–O and M–M distances were softly restrained to ≈2.0 Å and ≈3.0 Å respectively by applying a flat artificial penalty function in order to stabilize the refinements. PDF-analysis (Fig. 4) was used to derive reasonable values for these restraints on the interatomic distances. This procedure led, as described for H3LiIr2O6![[thin space (1/6-em)]](https://www.rsc.org/images/entities/char_2009.gif) 9 to a stable refinement with reproducible results. The crystallographic data have been deposited at the CDCC, deposit numbers: 1912803 and 1912804.†
9 to a stable refinement with reproducible results. The crystallographic data have been deposited at the CDCC, deposit numbers: 1912803 and 1912804.†
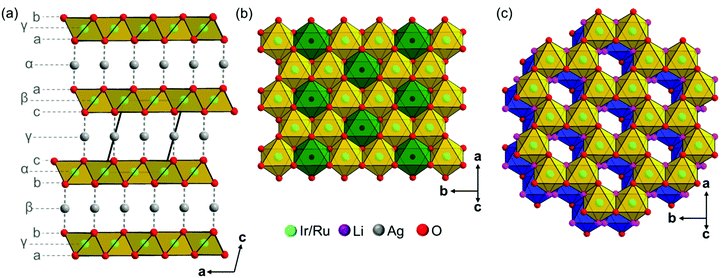
The crystal structures of Ag3LiIr2O6 and Ag3LiRu2O6 consist of edge sharing Ir/RuO6/3 octahedra forming layers perpendicular to the c-axis. Silver cations are situated in-between the layers and are linearly coordinated by two oxide anions with the O–Ag–O bond oriented perpendicular to the layer planes. This leads to an overall (aγb)β(bαc)γ(cβa)α stacking order of the layers (Fig. 3a). The intralayer cation sublattice is completely ordered. Condensed 6-fold rings of edge sharing (Ir/Ru)O6/22− octahedra form a honey-comb like motif (Fig. 3b, yellow octahedra) and lithium cations occupy the central octahedral voids of the honeycombs (green octahedra). The honeycombs of each layer (Fig. 3c, yellow octahedra) are slightly shifted with respect to the honeycombs of the preceding layer (Fig. 3c, blue octahedra), which leads to an overall staggered stacking. The layer constitutions of Ag3LiIr2O6 and Ag3LiRu2O6 are comparable to H3LiIr2O6![[thin space (1/6-em)]](https://www.rsc.org/images/entities/char_2009.gif) 9 (ESI, Tables S2 and S3†), the interlayer distance, however, is increased from 4.54 Å after replacing the protons by silver cations to 6.25 Å (Ir-phase) and 6.28 Å (Ru-phase), respectively.
9 (ESI, Tables S2 and S3†), the interlayer distance, however, is increased from 4.54 Å after replacing the protons by silver cations to 6.25 Å (Ir-phase) and 6.28 Å (Ru-phase), respectively.
In Fig. 4a comparison of the PDF-curves of Ag3LiIr2O6 (black curve) and Ag3LiRu2O6 (blue curve) is presented. The radial distribution functions are essentially identical for both isotypic phases. Up to a radial distance of 5.3 Å all peaks in the PDF-curves can be assigned to intralayer atom pairs (grey background). Within the resolution of the PDF-curves Ag3LiIr2O6 and Ag3LiRu2O6 exhibit identical M–O (2.0(1) Å), M–M (3.0(1) Å) and Li, Ir/Ru–Ag (3.6(1) Å and 4.7(1) Å for the second nearest neighbor) distances. Slight differences can be observed for the M–M′′ (second nearest neighbor) distances within the ab-plane, that are slightly larger in Ag3LiIr2O6 (5.3(1) Å and 6.1(1) Å) than in Ag3LiRu2O6 (5.2(1) Å and 6.0(1) Å). This is also reflected by the larger a- and b-lattice parameters of the Ir-phase (a = 5.287(1) Å, b = 9.151(2) Å versus a = 5.226(1) Å, b = 9.036(1) Å for the Ru-phase, ESI, Table S2†) and can be explained by the slightly larger ionic radius of Ir4+ (see Introduction).
Derivation and optimization of a faulting model for the structures of the honeycomb materials
In order to describe the microstructures of the samples, all considered layer-to-layer transitions are associated with a transition probability, which is presented in a 5 × 5 transition probability matrix in Table 2. Without any constraints this matrix would contain 25 transition probabilities, i.e. 25 independent parameters which need to be optimized to model the microstructure of each investigated sample. For simplification and reduction of the parameter space it was assumed that all possible O–Ag–O bonds and therefore all considered stacking sequences are equally favorable. Then the transition probability matrix can be described by using only one parameter, Px, which describes a general degree of faulting, i.e. the probability that a shift from any of the considered stacking orders to another stacking pattern occurs. This leads to the constrained, diagonal transition probability matrix, presented in Table 2. A faultless structure is modelled by the parameter value Px = 0, whereas Px = 0.8 describes stacking in a completely random fashion, i.e. the total loss of coherence in the stacking order, is described and Px = 1.0 results in a change of the stacking vector after each layer-to-layer transition.
| From↓/to→ | O1–Ag–O1 contact | O1–Ag–O2 contact-1 | O1–Ag–O2 contact-2 | O1–Ag–O2 contact-3 | O1–Ag–O2 contact-4 |
|---|---|---|---|---|---|
| O1–Ag–O1 contact | 1 − Px, S1 | 0.25·Px, S2-1 | 0.25·Px, S2-2 | 0.25·Px, S2-3 | 0.25·Px, S2-4 |
| O1–Ag–O2 contact-1 | 0.25·Px, S1 | 1 − Px, S2-1 | 0.25·Px, S2-2 | 0.25·Px, S2-3 | 0.25·Px, S2-4 |
| O1–Ag–O2 contact-2 | 0.25·Px, S1 | 0.25·Px, S2-1 | 1 − Px, S2-2 | 0.25·Px, S2-3 | 0.25·Px, S2-4 |
| O1–Ag–O2 contact-3 | 0.25·Px, S1 | 0.25·Px, S2-1 | 0.25·Px, S2-2 | 1 − Px, S2-3 | 0.25·Px, S2-4 |
| O1–Ag–O2 contact-4 | 0.25·Px, S1 | 0.25·Px, S2-1 | 0.25·Px, S2-2 | 0.25·Px, S2-3 | 1−Px, S2-4 |
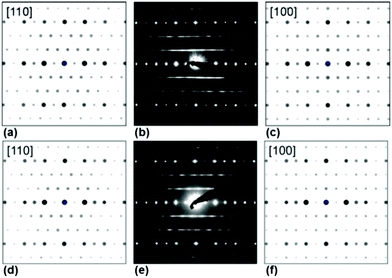 | ||
| Fig. 6 Simulated (a, c, d, f) and measured (b, e) PED patterns of Ag3LiIr2O6 (a–c) and Ag3LiRu2O6 (d–f). | ||
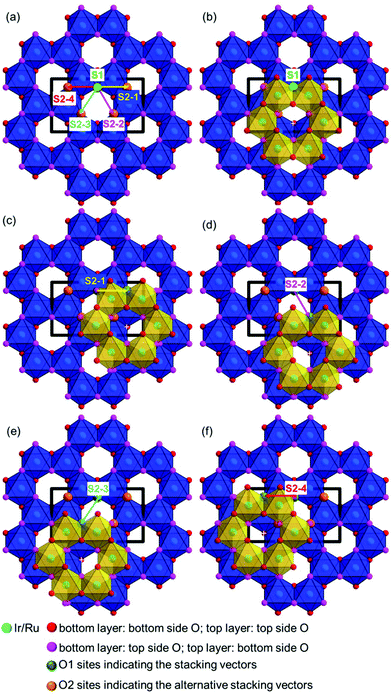
In order to visualize the faults in the crystal structures of the title compounds HRTEM images were recorded for the [110] zone axis. The micrographs are in good accordance with the simulated images based on the monoclinic structure model (ESI, Fig. S3†). HRTEM images of Ag3LiRu2O6 using different Defocus values (Δf = (+70, −35 and −90) nm) are shown in Fig. 7a–c and an HRTEM images of Ag3LiIr2O6 is presented in the ESI, Fig. S4.† For Δf = −35 nm the imaging conditions are close to the Scherzer focus (Fig. 7b), therefore the horizontal dark lines are correlated with the layers of silver cations in the crystal structure and the dark, ellipsoid shaped spots correlate with neighboring ruthenium cations of the intra-layer cation sublattice (Fig. 7d). Within the LiRu2O63−-layers circular, bright spots are apparent that can be assigned to the lithium sites, which confirms the presence of an ordered intra-layer cation sublattice. By inspecting the relative position of the dark and bright spots from one layer to subsequent ones it becomes obvious that the stacking order of the layers is not homogenous (Fig. 7b and d, yellow, cyan and green arrows). This is also confirmed by HRTEM micrographs taken with Δf = (+70 and −90) nm (Fig. 7a and c). In the micrographs the layers are shifted to the left hand site (green arrows) or to the right hand site (Fig. 7, magenta arrows) with respect to the preceding layer and some layers are situated at the same horizontal position (yellow arrows). This is in accordance with the derived stacking vectors (Fig. 8a). Due to the translational symmetry of the unit cell within the ab-plane, there are several possibilities to orient the stacking vectors, in particular the vectors S2-2, S2-3 and S2-4 (Fig. 8b). When the unit cell is rotated in a way that the [110] axis is oriented vertically (Fig. 8c), it becomes clear that the pairs of the stacking vectors (S2-2 and S2-4) and (S2-1 and S2-3) yield the same shift perpendicular to the [110] axis. As the HRTEM image along the [110] zone axis represents a one-dimensional projection of the planar defects, both the stacking vectors S2-2 and S2-4 appear as a shift of the layers to the right hand or to the left hand site. Accordingly, the stacking vector S1 appears as a shift to the other site and the stacking vectors S2-1 and S2-3 don't appear as a shift in the HRTEM image, as they lead to a shifting of the layers, perpendicular to the image plane.
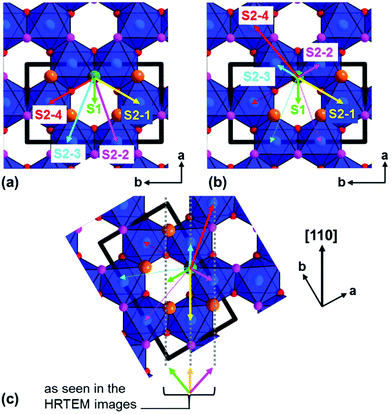 | ||
| Fig. 8 (a) Representation of the stacking vectors, as derived from the possible O–Ag–O contacts (Fig. 5), (b) replacement of the stacking vectors S2-2, S2-3 and S2-4 (dashed arrows) by alternative settings that are equivalent by translational symmetry (straight arrows), (c) reorientation of the unit cell (bold black lines) leading to a vertical orientation of the [110] axis and indication of stacking vectors leading to the same layer shift as observed in the HRTEM image taken along the [110] zone axis (Fig. 7d). | ||
For the optimization of the microstructures of Ag3LiIr2O6 and Ag3LiRu2O6 the monoclinic unit cells of the initial faultless structure models were transformed into P1-pseudo-orthorhombic cells as described for H3LiIr2O6.9 During each simulation 100 supercells with 200 layers each were simulated and averaged. The simulated pattern was refined against the measured pattern while keeping all parameters fixed except the scaling factor. A series of simulations comprised 101 simulated and refined patterns and took between one and two hours using a conventional desk top PC or notebook. During a grid search the transition probability, Px, was increased from 0 to 1 in 0.01 increments. In order to sharpen the model of the layer constitution, the atomic positions and also the stacking vectors were refined subsequently, by averaging 100 randomly created stacks of 200 layers using the transition probability Px, that yielded the best fit, and applying constraints to keep the monoclinic symmetry of the layers (ESI, Table S5†). Afterwards, another grid search was started with the optimized layer constitution. This process was repeated until the actual grid search cycle led to an optimized transition probability that was in a ±0.03 range of the optimized transition probability of the previous cycle. For both substances the subsequent optimization of the atomic positions, the stacking vectors and the transition probabilities took between two and three cycles in total. It should be noted, that in each case the refined layer constitution doesn't deviate significantly from the initial model in terms of atomic positions and distances. The whole process of the structural characterization of Ag3LiIr2O6 and Ag3LiRu2O6 is presented as a scheme in Fig. 9.
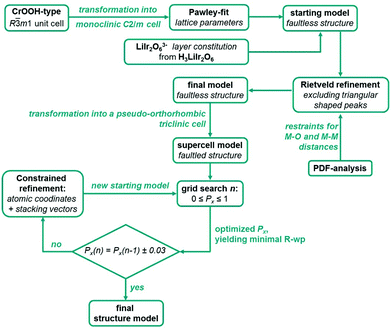 | ||
| Fig. 9 Schematic illustration of the combined approach of a grid search in the parameter space of the transition probabilities and of least squares based refinement of structural parameter to solve and optimize the crystal structures of Ag3LiIr2O6 and Ag3LiRu2O6. The constraints applied for the refinement of atomic coordinates and the stacking vectors are given in the ESI, Table S5.† | ||
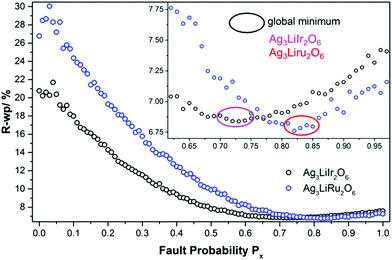
In Fig. 11 the final Px-grids of Ag3LiIr2O6 and Ag3LiRu2O6 are presented. Increasing the degree of disorder initially leads to a steep decrease of the R-wp value. Both grids exhibit a flat minimum at high degrees of disorder. The minimum R-wp value is achieved for Ag3LiIr2O6 at Px = 0.73 and for Ag3LiRu2O6 at Px = 0.82. It must be noted that the creation of the stacking sequences is driven by a random number generator. As only a limited number of structures were averaged, the R-wp can vary in a small range when a bunch of supercell models is simulated by using the same Px-parameter. Taking the flat global minimum of the parameter-space (Fig. 11, inset) into account, it is reasonable to rather use a range than a discrete value for the optimized degree of faulting, Px. In consequence the optimized degree of disorder should be given for Ag3LiIr2O6 as Px = 0.73 ± 0.03 and for Ag3LiRu2O6 as Px = 0.82 ± 0.03.
As both phases are vastly disordered, the coherence of the stacking order of the layers is almost completely lost. The fault probabilities are close to a complete random stacking of the layers, which is represented by Px = 0.8. Therefore the occurrence of large (more than 3 layers, i.e. more than 2 nm) homogenously stacked sections is unlikely for both compounds, as it is reflected by the HR-TEM images (Fig. 7). A higher fault probability than Px = 0.8 corresponds to a partial anti-correlation of the layer stacking, i.e. stacking in an alternating or circular sequence, which leads to more coherent scattering is more likely. The microstructural properties of Ag3LiIr2O6 and Ag3LiRu2O6 are similar to H3LiIr2O6.9 This may point to the fact that the presence of planar defects is an intrinsic property of this kind of layered honeycomb structures.
Conclusions
Ag3LiIr2O6 and Ag3LiRu2O6 were synthesized by ion exchange in an AgNO3 melt. The crystal structures of the layered honeycomb materials were investigated by high resolution laboratory X-ray powder diffraction, pair distribution analysis based on synchrotron powder diffraction and transmission electron microscopy. In the XRPD patterns anisotropic peak broadening and characteristic trigonal peak shapes indicate the presence of planar defects in the crystal lattice, which can be also visualized by HRTEM micrographs. Idealized models of the layered crystal structures were obtained by using the constitution of LiIr2O63− layers of the related phase H3LiIr2O6 as a starting model, excluding the section from the diffraction pattern, that are governed by diffuse scattering and extracting reasonable restraints for the bond lengths from the measured PDF curves. The LiIr2O63− and LiRu2O63− layers of the title compounds consist of edge sharing (Ir/Ru)O6/3 octahedra forming a honey-comb like motif and lithium cations occupy the central octahedral voids of the honeycombs. Linear O–Ag–O bonds connect the layers with each other, leading to an (aγb)β(bαc)γ(cβa)α stacking order of the layers. As different orientations of the honeycomb-layers can lead to this kind of staggered stacking, possible faults, i.e. alternative stacking orders were derived from the layer constitution. A microstructural model was developed and refined against the measured diffraction patterns by applying a grid search optimization in the space of the microstructure-related parameters. Further refinement of the atomic coordinates and the stacking vectors were performed subsequently. Both Ag3LiIr2O6 and Ag3LiRu2O6 are heavily faulted. In both compounds the layers are stacked in an almost complete random fashion. Therefore the microstructures of the title compounds exhibit great similarities to the microstructure of H3LiIr2O6.Conflicts of interest
There are no conflicts to declare.Acknowledgements
Maxwell W. Terban from the Max Planck Institute of solid state research is gratefully acknowledged for his valuable support in performing the synchrotron powder diffraction experiment and in the related data processing. The high energy powder diffraction patterns were collected at ID31 beamline at the ESRF in the frame of in-house research program. Open Access funding provided by the Max Planck Society.Funding by DFG for the project “In search of structure” (grant EG 137/9-1) is gratefully acknowledged.
References
- M. J. O'Malley, H. Verweij and P. M. Woodward, J. Solid State Chem., 2008, 181, 1803–1809 CrossRef.
- T. Takayama, A. Kato, R. Dinnebier, J. Nuss, H. Kono, L. S. I. Veiga, G. Fabbris, D. Haskel and H. Takagi, Phys. Rev. Lett., 2015, 114, 077202 CrossRef CAS PubMed.
- H. Takagi, T. Takayama, G. Jackeli, G. Khaliullin and S. E. Nagler, Nat. Rev. Phys., 2019, 1, 264–280 CrossRef.
- D. C. Wallace and T. M. McQueen, Dalton Trans., 2015, 44, 20344–20351 RSC.
- Y. Singh and P. Gegenwart, Phys. Rev. B: Condens. Matter Mater. Phys., 2010, 82, 064412 CrossRef.
- Y. Singh, S. Manni, J. Reuther, T. Berlijn, R. Thomale, W. Ku, S. Trebst and P. Gegenwart, Phys. Rev. Lett., 2012, 108, 127203 CrossRef PubMed.
- A. Kitaev, Ann. Phys., 2006, 321, 2–111 CAS.
- M. J. O'Malley, P. M. Woodward and H. Verweij, J. Mater. Chem., 2012, 22, 7782 RSC.
- S. Bette, T. Takayama, K. Kitagawa, R. Takano, H. Takagi and R. E. Dinnebier, Dalton Trans., 2017, 46, 15216–15227 RSC.
- D. C. Wallace, C. M. Brown and T. M. McQueen, J. Solid State Chem., 2015, 224, 28–35 CrossRef CAS.
- J. H. Roudebush, K. A. Ross and R. J. Cava, Dalton Trans., 2016, 45, 8783–8789 RSC.
- T. R. Welberry and B. D. Butler, J. Appl. Crystallogr., 1994, 27, 205–231 CrossRef CAS.
- K. Kitagawa, T. Takayama, Y. Matsumoto, A. Kato, R. Takano, Y. Kishimoto, S. Bette, R. Dinnebier, G. Jackeli and H. Takagi, Nature, 2018, 554, 341–345 CrossRef CAS PubMed.
- R. D. Shannon, Acta Crystallogr., Sect. A: Cryst. Phys., Diffr., Theor. Gen. Crystallogr., 1976, 32, 751–767 CrossRef.
- A. Pabst, Am. Mineral., 1946, 31, 539–546 CAS.
- R. D. Shannon, D. B. Rogers and C. T. Prewitt, Inorg. Chem., 1971, 10, 713–718 CrossRef CAS.
- B. U. Koehler and M. Jansen, Z. Anorg. Allg. Chem., 1986, 543, 73–80 CrossRef CAS.
- V. Todorova, A. Leineweber, L. Kienle, V. Duppel and M. Jansen, J. Solid State Chem., 2011, 184, 1112–1119 CrossRef CAS.
- K. Ramesha, A. S. Prakash, M. Sathiya, G. Madras and A. K. Shukla, J. Mater. Sci. Eng. B, 2011, 176, 141–146 CrossRef CAS.
- M. M. J. Treacy, J. M. Newsam and M. W. Deem, Proc. R. Soc. London, Ser. A, 1991, 433, 499–520 CrossRef.
- P. W. Stephens, J. Appl. Crystallogr., 1999, 32, 281–289 CrossRef CAS.
- A. Leineweber, J. Appl. Crystallogr., 2006, 39, 509–518 CrossRef CAS.
- V. K. Medvedev, Y. Suchorski and J. H. Block, Ultramicroscopy, 1994, 53, 27–35 CrossRef CAS.
- P. A. Stadelmann, Ultramicroscopy, 1987, 21, 131–145 CrossRef CAS.
- P. J. Chupas, X. Qiu, J. C. Hanson, P. L. Lee, C. P. Grey and S. J. L. Billinge, J. Appl. Crystallogr., 2015, 36, 1342–1347 CrossRef.
- G. Ashiotis, A. Deschildre, Z. Nawaz, J. P. Wright, D. Karkoulis, F. E. Picca and J. Kieffer, J. Appl. Crystallogr., 2015, 48, 510–519 CrossRef CAS PubMed.
- C. J. Wright and X. D. Zhou, J. Synchrotron Radiat., 2017, 24, 506–508 CrossRef PubMed.
- TOPAS 6.0, Bruker AXS, 2017 Search PubMed.
- H. M. Rietveld, J. Appl. Crystallogr., 1969, 2, 65–71 CrossRef CAS.
- R. W. Cheary and A. Coelho, J. Appl. Crystallogr., 1992, 25, 109–121 CrossRef CAS.
- R. W. Cheary, A. A. Coelho and J. P. Cline, J. Res. Natl. Inst. Stand. Technol., 2004, 109, 1–25 CrossRef CAS PubMed.
- X. Qiu, J. W. Thompson and S. J. L. Billinge, J. Appl. Crystallogr., 2004, 37, 678–678 CrossRef CAS.
- T. Proffen and S. J. L. Billinge, J. Appl. Crystallogr., 1999, 32, 572–575 CrossRef CAS.
- C. L. Farrow, P. Juhas, J. W. Liu, D. Bryndin, E. S. Božin, J. Bloch, T. Proffen and S. J. L. Billinge, J. Phys.: Condens. Matter, 2007, 19, 335219 CrossRef CAS PubMed.
- B. E. Warren, Phys. Rev., 1941, 59, 693–698 CrossRef CAS.
- A. A. Coelho, J. Appl. Crystallogr., 2003, 36, 86–95 CrossRef CAS.
- G. S. Pawley, J. Appl. Crystallogr., 1981, 14, 357–361 CrossRef CAS.
- X. Wang, J. Li, R. D. Hart, A. van Riessen and R. McDonald, J. Appl. Crystallogr., 2011, 44, 902–910 CrossRef CAS.
- S. Bette, R. E. Dinnebier and D. Freyer, J. Appl. Crystallogr., 2015, 48, 1706–1718 CrossRef CAS.
- C. M. Ainsworth, J. W. Lewis, C.-H. Wang, A. A. Coelho, H. E. Johnston, H. E. A. Brand and J. S. O. Evans, Chem. Mater., 2016, 28, 3184–3195 CrossRef CAS.
- S. Mangelsen, B. R. Srinivasan, U. Schürmann, L. Kienle, C. Näther and W. Bensch, Dalton Trans., 2019, 48, 1184–1201 RSC.
- A. Kudielka, S. Bette, R. E. Dinnebier, M. Abeykoon, C. Pietzonka and B. Harbrecht, J. Mater. Chem. C, 2017, 5, 2899–2909 RSC.
- A. A. Coelho, J. S. O. Evans and J. W. Lewis, J. Appl. Crystallogr., 2016, 49, 1740–1749 CrossRef CAS.
- R. E. Dinnebier, A. Leineweber and J. S. O. Evans, in Rietveld Refinement - practical powder diffraction pattern analysis using TOPAS, Walter de Gruyter, Berlin/Boston, 2019, ch. 12 Multiple Datasets, pp. 270–271 Search PubMed.
Footnote |
| † Electronic supplementary information (ESI) available. CCDC 1912803 and 1912804. For ESI and crystallographic data in CIF or other electronic format see DOI: 10.1039/c9dt01789e |
| This journal is © The Royal Society of Chemistry 2019 |

