 Open Access Article
Preparation of highly active phosphated TiO2 catalysts via continuous sol–gel synthesis in a microreactor†
O.
Martin
 a,
N.
Bolzli
a,
B.
Puértolas
b,
J.
Pérez-Ramírez
a,
N.
Bolzli
a,
B.
Puértolas
b,
J.
Pérez-Ramírez
 b and
P.
Riedlberger
 *a
*a
aResearch Group Chemical Engineering, Institute of Chemistry and Biotechnology, ZHAW Zurich University of Applied Sciences, 8820 Wädenswil, Switzerland. E-mail: peter.riedlberger@zhaw.ch
bInstitute for Chemical and Bioengineering, Department of Chemistry and Applied Biosciences, ETH Zurich, Vladimir-Prelog-Weg 1, 8093 Zurich, Switzerland
First published on 13th August 2019
Abstract
Microreactors, featuring μm-sized tubes, offer greater flexibility and precise control of chemical processes compared to conventional large-scale reactors, due to their elevated surface-to-volume ratio and modular construction. However, their application in catalyst production has been largely neglected. Herein, we present the development of a microreactor process for the one-step sol–gel preparation of phosphated TiO2 – a catalyst which has been recently demonstrated to be an eco-friendly material for the selective synthesis of the platform chemical 5-hydroxymethylfurfural (5-HMF) from bio-derived glucose. In order to establish catalyst preparation–property–performance relationships, 18 samples were prepared according to a D-optimal experimental plan with a central point. The key properties of these samples (porosity, crystallite size, mole bulk fraction of P) were correlated, using quadratic and interaction models, with the catalytic performance (conversion, selectivity, reaction rate) of 5-HMF synthesis as a test reaction. The optimal calculated catalyst features were set as target parameters to optimise catalyst synthesis applying quadratic correlation functions. An optimal catalyst was obtained, validating the models employed, with a yield of almost 100% and a space–time yield of ca. 3 orders of magnitude higher than that of a conventional batch process (26.8 vs. 0.07 gcat h−1 cmreactor−3). The high yield could be mainly attributed to the optimal hydrolysis ratio and temperature. Controlling the TiO2 crystallite size and surface acidity in conjunction with fine-tuning of the porous properties in the microreactor led to increased glucose conversion (95.6 vs. 78.7%), surface based formation rates of 5-HMF (0.047 vs. 0.008 g5-HMF h−1 mcat−2), and selectivity towards 5-HMF (55.5 vs. 50.0%) of the optimal catalyst in relation to the batch-prepared material.
Introduction
There has recently been a significant increase in interest in process intensification, as it promises to improve efficiency of industrial processes and lower their ecological impact.1 One notable approach is the use of continuous microreactors featuring μm-sized tubes. Their high surface-to-volume ratio results in fast heat exchange and very short mixing times, which enables precise process control, enhancing both efficacy and safety compared to processes performed in batch and/or large-scale reactors.2–7 Furthermore, microreactors render the time and cost intensive scale-up of both the catalyst and process redundant. In addition, their modular design is of unrivalled flexibility. Their scalability to industrial production rates through parallelization has been recently proven for both pharmaceuticals and fine chemicals.8Numerous catalysed reactions in microreactors have been reported,9–16 and Torrente-Murciano et al.17–19 highlighted the benefits of applying microreactors with specific geometries to tune the size and size distribution of Ag and Ag–Pd nanoparticles. However, the use of such reactors in the preparation of heterogeneous catalysts has been greatly overlooked, even though the controlled synthesis of catalysts is key for improving efficiency and sustainability of catalysed processes.20 Fouling of the small reactor channels has impeded their long-term use in the industrial production of solids in microreactors.21–25 However, a recent study by Riedlberger et al.26 on the synthesis of phosphated TiO2 in such systems demonstrated that fine-tuning of nucleation kinetics and mixing times could diminish this issue.
TiO2 nanoparticles are widely applied in sunscreens, paints, toothpastes, solar cells, electrochemical electrodes, capacitors, and heterogeneous catalysts, amongst others.27,28 Recently, Beltramini et al.29–31 discovered that phosphate modified TiO2 anatase nanoparticles almost fully convert glucose selectively into 5-hydroxymethylfurfural (5-HMF). This reaction offers a sustainable access to 5-HMF, a platform chemical for functionalised materials useful for polymers, fuels, etc.,32,33 since glucose can be retrieved from industrially amenable bio sources.33,34 Hence, there is a need for efficient catalysts for this reaction: phosphated TiO2 features an activation energy ca. 40 kJ mol−1 lower compared to common mineral acids.36 The improved catalytic activity of this material was attributed to the beneficial role of the phosphorus incorporated into the crystal lattice of TiO2, which decreases its crystallite size upon synthesis.30,37 In addition, this dopant prevented sintering of the TiO2 crystals and stabilised them in their anatase phase even under elevated temperatures (873–1173 K)30,38–42 at which rutile formation usually becomes predominant.43 Besides, the presence of phosphate groups increases Lewis acidity and introduces Brønsted acid sites.29–31 It was concluded that a balanced amount of Lewis and Brønsted acid centres are required to efficiently isomerise glucose to fructose over the first sites and to quickly dehydrate the intermediate to 5-HMF over the latter ones, which was realised at an optimal phosphate content of 15 wt%. This is in line with earlier results in the literature demonstrating the beneficial role of bifunctional acid catalysts (like solid heteropoly acid salts44 or Sn-beta zeolite)45 in this reaction. In addition to 5-HMF production, phosphorus doped TiO2 has also proved its capability in photodegradation reactions of various organic compounds,37,40,46–49 dehydration of isopropanol to propene,39,41 and nitration of toluene,38 which has further raised our interest in this catalytic material.
Preparation methods for phosphated TiO2 in the aforementioned studies included impregnation46,49 and solid–solid kneading38 of pre-formed TiO2 nanoparticles, hydrothermal synthesis,48 and sol–gel synthesis.29–31,37,39–41,47,48 The latter offers many advantages over the other processes due its mild reaction conditions resulting in better product homogeneity, minimising sintering of the particles, and facilitating functionalisation of the resultant material.50,51 Upon this preparation route, a metal–organic precursor like titanium butoxide (TB) is typically hydrolysed in an H2O containing organic solvent, which results in instantaneous formation of sub-nanometer sized sol particles. Subsequently, a 3D gel network is formed by progressive concurrent particle growth and agglomeration, which usually leads to highly porous solids, once organic residues have been removed. Conventionally, this process has been performed in a batch reactor, which may impose several drawbacks compared to continuous reactors, such as lower space–time yields and less well-defined catalyst properties due to inhomogeneity of the reaction solution. Furthermore, it is also more difficult to control the various reaction steps involved.52,53
Therefore, we aimed at combining the advantages of both sol–gel synthesis and microflow reactors to achieve controlled and optimised preparation of phosphated TiO2 in a modular Ehrfeld system involving three mixing steps for i) hydrolysis of the Ti precursor, ii) phosphate functionalisation of the sol particles, and iii) final gelation–precipitation. In order to rationalise both synthesis of the catalyst and catalysed 5-HMF formation from glucose, a design of experiments (DoE) software was employed that provided models to correlate catalyst synthesis conditions (temperature, space velocity, concentrations and molar feed ratios of reactants), catalyst yield, catalyst properties (porosity, crystallite size, molar P/Ti bulk ratio determined by N2 physisorption, X-ray powder diffraction (XRPD), X-ray fluorescence spectroscopy (XRF), respectively), and catalytic performance upon 5-HMF synthesis from glucose. Structural insights of selected samples were gathered by various spectroscopic, temperature-programmed, or imaging techniques. Based on these models, the optimal microreactor process provided a superior (space–time) yield than the batch process resulting in an optimal catalyst with improved catalytic performance compared to the batch sample because of its well-tuned structure.
Materials and methods
Catalyst preparation
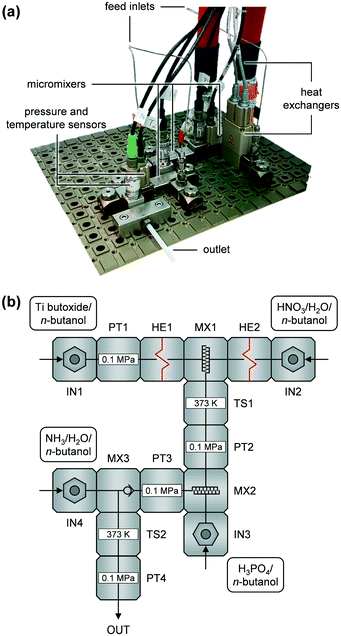
Continuous catalyst syntheses were carried out in an Ehrfeld Modular Microreactor System (MMRS, i.d. 3.00 mm) controlled by HitecZang LabVision software and based on the set-up previously described.26 A photograph and a simplified piping & instrumentation diagram (PID) of the set-up are depicted in Fig. 1a and b, respectively. The volumetric flows of the four feeds containing TB (Sigma-Aldrich, 97%), HNO3(aq) (Carl Roth, ≥65%) + deionised H2O, H3PO4 (Sigma-Aldrich, ≥99.999%), and NH3(aq) (Sigma-Aldrich, 25%) + deionised H2O, all in n-butanol (Sigma-Aldrich, ≥99.7%) are denoted as FTB, FHNO3, FH3PO4, and FNH3, respectively. These solutions were mixed consecutively in the three micromixers (Fig. 1, MX1–MX3). The nominal volumetric ratio was kept constant at FTB/FHNO3/FH3PO4/FNH3 = 1/1/1.3/1.6 during all syntheses, based on former investigations,26 while temperature (TMX1), space velocity (SV), concentration of TB (cTB), and molar flow ratios of each reactant (HNO3, H2O at MX1, H3PO4, NH3, and H2O at MX3) in relation to TB (ṅHNO3/ṅTB, ṅH2O/ṅTB (at MX1), ṅH3PO4/ṅTB, ṅNH3/ṅTB, ṅH2O/ṅTB (at MX3), respectively) were varied. The temperature in MX1 was adjusted utilising the two heat exchangers (HE1 and HE2) in the TB and H3PO4 feeds, respectively. The space velocity, based on the flow of pure TB and a total reactor volume of Vr = 2.24 cm3, was varied through the total flow of the TB solution while the other reactant flows were set according to the flow ratio given above. Molar flow ratios were tuned by modifying the concentrations of the reactants in the feed solutions. Ca. 200 cm3 of the resulting slurry were collected in a stirred beaker upon each experiment. The catalyst precursor was separated from the slurry without further ageing by centrifugation at 10![[thin space (1/6-em)]](https://www.rsc.org/images/entities/char_2009.gif) 000 rpm for 10 min and subsequent washing i) two times with ca. 200 cm3 of acetone + 0.75 cm3 NH3(aq) and ii) with ca. 200 cm3 of n-hexane + 0.75 cm3 NH3(aq). The materials obtained were dried at 338 K in vacuum for 15 h and finally they were calcined at 873 K (5 K min−1) for 3 h in static air. A table detailing all reaction solutions and synthesis parameters applied is given in the ESI† (Table S1). These samples are denoted as P-TiO2-mr-x, where x is the number of the experimental run. The optimised phosphated TiO2 and the pure TiO2 catalyst both prepared under the same conditions are labelled P-TiO2-mr and TiO2-mr, respectively. A phosphated TiO2 benchmark catalyst and a pure TiO2 material (denoted as P-TiO2-b and TiO2-b, respectively) were synthesised in a batch reactor using the same cTB and molar ratios of reactants (nHNO3/nTB, nH2O/nTB, nH3PO4/nTB, nNH3/nTB) as for the synthesis of P-TiO2-mr and TiO2-mr, respectively. In case of P-TiO2-b, 1.27 g of H3PO4 were dissolved in a mixture containing 74.12 g of n-butanol and 31.03 g of deionised water in a round-bottom flask. Subsequently, 42.54 g of TB and 4.26 g of NH3(aq) were added dropwise to this solution under vigorous stirring and heating to 318 K. After the addition of all reactants, the slurry was stirred for a further hour. Afterwards, all solvents were removed by centrifugation and the solid was washed, dried, and calcined as previously elaborated. The TiO2-b sample was synthesised in the same way by omitting H3PO4. Apparent reaction rate (rc), catalyst yield (Ycat), and space–time yield (STYcat) were calculated according to eqn (S1)–(S3),† respectively.
000 rpm for 10 min and subsequent washing i) two times with ca. 200 cm3 of acetone + 0.75 cm3 NH3(aq) and ii) with ca. 200 cm3 of n-hexane + 0.75 cm3 NH3(aq). The materials obtained were dried at 338 K in vacuum for 15 h and finally they were calcined at 873 K (5 K min−1) for 3 h in static air. A table detailing all reaction solutions and synthesis parameters applied is given in the ESI† (Table S1). These samples are denoted as P-TiO2-mr-x, where x is the number of the experimental run. The optimised phosphated TiO2 and the pure TiO2 catalyst both prepared under the same conditions are labelled P-TiO2-mr and TiO2-mr, respectively. A phosphated TiO2 benchmark catalyst and a pure TiO2 material (denoted as P-TiO2-b and TiO2-b, respectively) were synthesised in a batch reactor using the same cTB and molar ratios of reactants (nHNO3/nTB, nH2O/nTB, nH3PO4/nTB, nNH3/nTB) as for the synthesis of P-TiO2-mr and TiO2-mr, respectively. In case of P-TiO2-b, 1.27 g of H3PO4 were dissolved in a mixture containing 74.12 g of n-butanol and 31.03 g of deionised water in a round-bottom flask. Subsequently, 42.54 g of TB and 4.26 g of NH3(aq) were added dropwise to this solution under vigorous stirring and heating to 318 K. After the addition of all reactants, the slurry was stirred for a further hour. Afterwards, all solvents were removed by centrifugation and the solid was washed, dried, and calcined as previously elaborated. The TiO2-b sample was synthesised in the same way by omitting H3PO4. Apparent reaction rate (rc), catalyst yield (Ycat), and space–time yield (STYcat) were calculated according to eqn (S1)–(S3),† respectively.
Characterisation
The bulk elemental composition of the calcined samples was determined by XRF spectroscopy applying a Thermo ARL ADVANT'XP spectrometer equipped with a Rh source (60 kV, 40 mA) and a flow proportional counter (FPC) detector. Mole fraction of phosphorus in the bulk catalyst was determined by eqn (S4).† Semi-quantitative analysis was performed using Uniquant software. XRPD was carried out utilising a Bruker D8 Advance instrument, applying Ni-filtered Cu-Kα radiation, an angular step size of 0.009° 2θ, and a counting time of 0.5 s per step. The average TiO2 particle size was estimated from the largest reflection of each individual phase using the Scherrer equation. Nitrogen sorption was measured at 77 K in a Quantachrome NOVA 3000e instrument, after evacuating the samples at 573 K for 3 h. The total surface area and average pore size were determined by applying Brunauer–Emmett–Teller (BET) and Barrett–Joyner–Halenda (BJH) models, respectively. Temperature-programmed desorption of NH3 (NH3-TPD) analysis was performed at a Quantachrome Autosorb iQ TPX unit equipped with a thermal conductivity detector (TCD). For this measurement, a sample of ca. 100 mg was first pretreated in He (50 cm3 STP min−1) at 773 K (50 K min−1) for 2 h followed by an adsorption step in 10 mol% NH3 in N2 (25 cm3 STP min−1) at 373 K for 30 min, a subsequent purging step in N2 (25 cm3 STP min−1) at 373 K for 2 h, and finally a desorption step in which the temperature was increased from 373 to 1073 K at a heating rate of 10 K min−1 in N2 (25 cm3 STP min−1). Fourier transform infrared spectroscopy (FT-IR) of pyridine adsorbed was conducted in a Bruker Vertex 70 spectrometer (400–4000 cm−1, co-addition of 32 scans). Self-supporting wafers of catalyst (5 ton m−2, 30 mg, 1 cm2) were degassed under vacuum (10−3 mbar) for 4 h at 573 K, prior to adsorbing pyridine at room temperature. Gaseous and weakly adsorbed molecules were subsequently removed by evacuation at room temperature (15 min) and 473 K, 573 K, and 673 K (30 min). The total concentrations of Brønsted and Lewis acid sites were calculated from the band area of pyridine adsorbed at 1545 and 1454 cm−1, using previously determined extinction coefficients of εBrønsted = 1.67 cm mmol−1 and εLewis = 2.94 cm mmol−1.54 Temperature-programmed surface reaction (TPSR) of n-propylamine to propene and ammonia was studied using a Micromeritics Autochem II chemisorption analyzer coupled with a Pfeiffer Vacuum OmniStar quadrupole mass spectrometer. Following in situ pretreatment in flowing He (50 cm3 min−1) at 773 K for 2 h, the samples were saturated with n-propylamine at 473 K. Physisorbed amine was removed by purging with He. The decomposition of n-propylamine was monitored in the range 473–773 K using a heating rate of 10 K min−1. Diffuse reflectance ultraviolet-visible spectroscopy (UV-vis) spectroscopy was carried out at a PerkinElmer Lambda 650 spectrometer with an integrating sphere (150 mm in diameter, Spectralon) and an R955 photomultiplier tube (PMT) detector. Samples and blank (Spectralon) were scanned between 200 and 800 nm using monochromatised light from tungsten halogen and deuterium lamps (switching at 319.2 nm) at steps of 1 nm s−1. The measured reflectance was converted to Kubelka–Munk intensity and the band gaps were calculated from the wavelength λ, given by the intersection of the two tangents, applying the following equation: Ebandgap/eV = 1239.8 nm λ−1.46 Solid-state magic angle spinning nuclear magnetic resonance (MAS NMR) spectroscopy with high-power proton decoupling spectra of 31P were recorded at a spinning speed of 10 kHz on a Bruker Avance 700 MHz spectrometer featuring a 2.5 mm probe head and 2.5 mm ZrO2 rotors. 31P MAS NMR spectra were collected using 1024 accumulations at pulses of 7.2 ms and a relaxation time of one second, and NH4H2PO4 as reference.Catalytic evaluation
All samples were tested for their catalytic performance during 5-HMF synthesis from glucose based on the method reported by Beltramini et al.29 In brief, α-D-glucose (520 mg, Sigma-Aldrich, 96%), NaCl (400 mg, Sigma-Aldrich, ≥99.8%), and the catalyst (125 mg) were mixed together with deionised water (2.0 cm3), tetrahydrofuran (THF, 6.0 cm3, Acros Organics, 99.99%), and 1-methyl-2-pyrrolidinone (NMP, 2.0 cm3, Sigma-Aldrich, 99.5%) in a sealed 20 cm3 glass vial equipped with a magnetic stirrer bar. The reaction was performed in a Biotage Initiator microwave reactor at 423 K for 105 min at autogenous pressure (ca. 1.0 MPa). After cooling-down, the reaction mixture was decanted to remove any solids and the resulting two phases were isolated in a separation funnel. Both liquids were analysed individually by high-performance liquid chromatography (HPLC) using an Agilent 1200 Series instrument with an evaporative light scattering detector (ELSD) to analyse glucose and fructose concentrations. A diode array detector (DAD) was applied to analyse the 5-HMF. All measurement solutions were further purified through a 0.45 μm syringe filter. For calibration purposes, α-D-glucose (vide supra), α-D-fructose (Alfa Aesar, 99%), and 5-HMF (Sigma-Aldrich, ≥98.0%) were utilised. Glucose conversion (Xglucose), 5-HMF selectivity (S5-HMF), and the catalyst surface-based rate of 5-HMF formation (rs) were calculated by eqn (S5)–(S7),† respectively. For examining catalyst stability, sample P-TiO2-mr was filtered from the reaction mixture after the 5-HMF reaction, washed three times with 10 cm3 of acetone each and finally it was calcined as described above. Amounts of chemicals applied in the mixture for the 5-HMF reaction were adapted, due to the small loss of catalytic material upon each regeneration step, to keep the weight ratio constant with respect to the catalyst.Design of experiments (DoE)
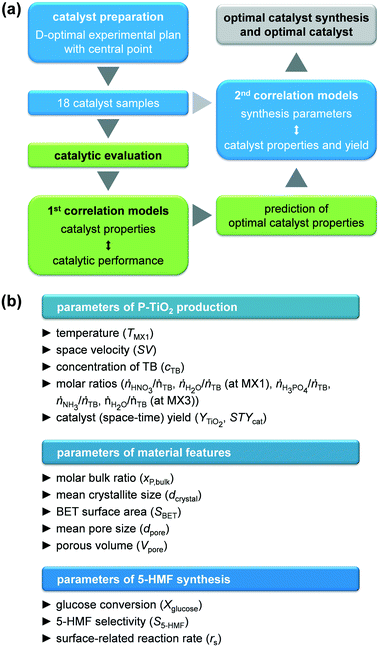
GlobalOptimize 2.1 software was employed to create the experimental plan, to calculate correlation models, and to optimise the catalyst synthesis and properties. All parameters used as well as all models and results obtained can be found in the ESI† (Tables S1–S4 and Fig. S1 and S2). Input parameters were selected based on literature findings, mainly in order to influence sol–gel process or 5-HMF synthesis. The developed approach is schematically presented in Fig. 2. A D-optimal experimental plan with a central point was defined for the catalyst synthesis, resulting in 18 experiments in which TMX1, SV, cTB, ṅHNO3/ṅTB, ṅH2O/ṅTB (at MX1), ṅH3PO4/ṅTB, ṅNH3/ṅTB, and ṅH2O/ṅTB (at MX3) were varied simultaneously. First, the BET surface area, the mean pore size, the total pore volume, the mean crystallite size, and the mole bulk fraction of P of the resulting calcined catalysts were correlated with the glucose conversion, the 5-HMF selectivity, and the surface related reaction rate of 5-HMF applying a linear combination of either interaction and quadratic models, which provided the best fit for the data. These models were used to predict optimal catalyst properties, at which the conversion, selectivity, and reaction rate should be maximised. The resulting properties were finally used as target parameters to optimise the catalyst synthesis, while simultaneously targeting maximum catalyst (space–time) yield, employing a linear combination of quadratic models.Results and discussion
Sol–gel synthesis of phosphated TiO2 in a microreactor
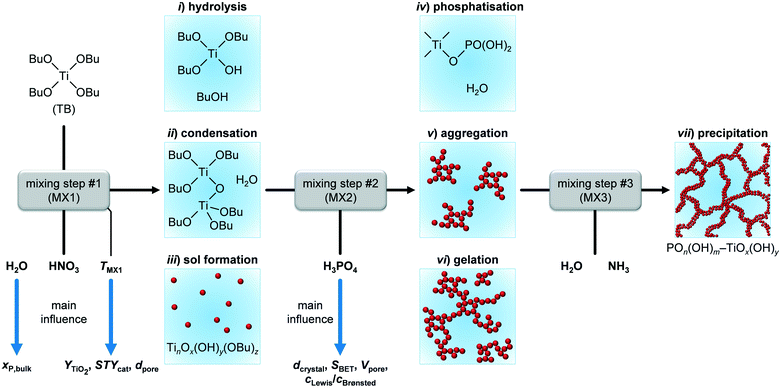
The microreactor set-up was developed based on the conventional batch process for synthesising phosphated TiO2via sol–gel reported by Beltramini et al.29–31 We thought the three reaction steps, i.e., i) hydrolysis and sol formation, ii) phosphatisation, and iii) gelation–precipitation, could be better controlled by using a continuous microreactor featuring three micromixers (Fig. 1b, MX1–3). We utilised two narrow slit plate mixers for the first two mixing steps, during which sol particles below 2–3 nm in size were expected to form according to earlier investigations.26 The first step mixed the solutions containing the Ti precursor (TB) and H2O (MX1) and the second one blended the resulting mixture with the H3PO4 containing feed (MX2). In addition, we added HNO3 to the H2O containing feed during the first mixing step, prior to the phosphorus incorporation step, to investigate the catalytic role of mineral acids on hydrolysis upon TiO2 sol formation.37 Since generation of nm–μm-sized aggregates was anticipated during gelation–precipitation, i.e., when NH3 was added to the reaction mixture (MX3), we decided to use a valve mixer, which prevents fouling because of its advantageous dimensions.26A D-optimal experimental plan with a central point for synthesising the phosphated TiO2 catalysts in the microreactor was defined based on the boundaries of the input parameters (Table S1†), which were either given based on technical limitations (e.g., for the temperature in the heaters, HE1 and HE2) or established through preliminary experiments (e.g., miscibility of H2O and n-butanol). This provided a set of a minimum of 18 experiments in which all eight input parameters (Fig. 2b) were altered simultaneously. Since the DoE software allows the suggested parameters to be varied, the plan was adapted if necessary, e.g., when the H2O concentration in one of the feed solutions would have been too high in order to completely mix with n-butanol. It was observed that under all conditions applied, there was no severe fouling of the microreactor, i.e., the pressure in the system did not exceed 0.7 MPa during catalyst production. This result corroborates the theory that using TB as precursor for this synthesis appears to be a promising way to avoid clogging of the narrow microchannels of the slit plate mixers as a result of the slower hydrolysis kinetics of this compound compared to other alkoxides, e.g., Ti isopropoxide.26 However, it should be noted that the largest increase in pressure occurred at high concentrations of TB (cTB) and small space velocities. Since our microreactor set-up only ran for between 5 and 60 min (depending on cTB and SV), long-term tests will be required in the future to evaluate fouling behaviour on industrially-relevant production time scales of several days and longer.
TiO2 based yields (YTiO2) and catalyst space–time yields (STYcat) achieved for the microreactor prepared samples ranged between 21.2–99.2% and 0.7–26.7 gcat h−1 cmreactor−3, respectively (Table S2†). In the batch reactor, comparable YTiO2 values of 89.6 and 91.7% (Table 1) could be achieved for pure (TiO2-b) and phosphated TiO2 (P-TiO2-b), respectively, but at only STYcat of 0.07 gcat h−1 cmreactor−3, i.e., ca. 1–3 orders of magnitude lower than all samples prepared in the microreactor. This can be explained by the larger reactor volume in the batch system (ca. 170 vs. 2.24 cm3). In addition, the STYcat as defined in this work (eqn (S3))† does not take into account the unavoidable time of repetitive shut-downs, emptying, refilling, and restarting of the batch system, which would further lower its effective space–time yield over the long term. Considering the microreactor prepared samples only, STYcat increases almost linearly with ascending space velocity (Fig. S3†), which is generally expected in continuous reactors. In contrast, a broad distribution of YTiO2 (21.2–87.9%) was observed at SV < 40 h−1, while above this limit YTiO2 remained between 80.6 and 99.2% when plotting the yield against space velocity (Fig. 3a, red and blue symbols, respectively). This distribution indicates that catalyst yield is heavily influenced by reaction kinetics at low SV. Replotting YTiO2 as a function of apparent reaction rates of TB (rc) reveals a monotonically increasing relationship between both (Fig. 3b). Interestingly, the lowest reaction rates were observed for the samples synthesised at low SV and, in fact, both groups appear to follow different reaction kinetics according to rc–TMX1 correlations (Fig. 3c): i) samples prepared at SV > 40 h−1 show a steady increase in rc as TMX1 increases and ii) the ones synthesised at SV < 40 h−1 show an rc which is almost invariant in relation to TMX1. The lower yield of the latter samples might be therefore partially explained by the slower reaction rates. Eventually, the reaction network is controlled by thermodynamics for long residence times, e.g., by favouring hydrolysis ↔ hydroxylation over condensation.
| Parameters | P-TiO2-mra | Catalyst preparation optimumb | 5-HMF synthesis optimumb | P-TiO2-b | TiO2-mr | TiO2-b |
|---|---|---|---|---|---|---|
| a Values are given with the standard deviations calculated from the triple determination of the optimal catalyst (Tables S1 and S2). b As predicted by the DoE software. c Calculated from the concentration of the reactants in the feed solutions and the volumetric flows of the latter. In case of the batch-prepared samples the values were directly determined from the concentration ratio in the reaction solution. d The nH2O/nTB ratio upon batch synthesis accounts for the total H2O present in the batch reactor, i.e., the sum of ṅH2O/ṅTB at MX1 and MX3 in the case of the catalysts prepared in the microreactor. | ||||||
| T MX1 (K) | 317 ± 1 | 318 | — | 317 | 317 | 318 |
| SV (h−1) | 105 ± 2 | 110 | — | — | 105 | — |
| c TB (mol l−1) | 0.85 ± 0.01 | 0.85 | — | 0.74 | 0.85 | 0.74 |
| ṅ HNO3/ṅTBc (—) | 0 | 0 | — | 0 | 0 | 0 |
| ṅ H2O/ṅTB (at MX1)c (—) | 2.1 ± 0.2 | 2.0 | — | 15.2d | 2.2 | 15.2d |
| ṅ H3PO4/ṅTBc (—) | 0.26 ± 0.01 | 0.27 | — | 0.10 | 0.00 | 0.00 |
| ṅ NH3/ṅTBc (—) | 0.50 ± 0.02 | 0.5 | — | 0.50 | 0.54 | 0.50 |
| ṅ H2O/ṅTB (at MX3)c (—) | 12.6 ± 0.4 | 12.1 | — | 0.0d | 13.5 | 0.0d |
| Y TiO2 (%) | 98.9 ± 0.3 | 99.9 | — | 89.6 | 82.9 | 91.7 |
| STYcat (gcat h−1 cmreactor−3) | 26.8 ± 0.4 | 25.7 | — | 0.07 | 20.5 | 0.07 |
| x P,bulk (—) | 0.053 ± 0.005 | 0.046 | 0.040 | 0.049 | 0 | 0 |
| d crystal (nm) | 7.5 ± 0.1 | 7.0 | 6.3 | 8.6 | 29.2 | 45.1 |
| S BET (m2 gcat−1) | 28 ± 9 | 18 | 17 | 118 | 15 | 4 |
| d pore (nm) | 6.9 ± 1.0 | 5.2 | 5.4 | 9.6 | 3.6 | 3.6 |
| V pore (cm3 gcat−1) | 0.05 ± 0.02 | 0.03 | 0.03 | 0.40 | 0.04 | 0.01 |
| X glucose (%) | 95.6 ± 1.2 | — | 100.0 | 78.7 | 21.4 | 5.6 |
| S 5-HMF (%) | 55.5 ± 0.8 | — | 52.8 | 50.0 | 42.4 | 24.5 |
| r s (g5-HMF h−1 mcat−2) | 0.047 ± 0.013 | — | 0.037 | 0.008 | 0.014 | 0.008 |
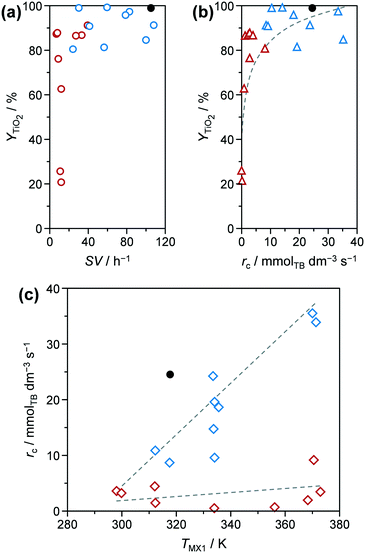 | ||
| Fig. 3 Y TiO2 as a function of (a) space velocity (SV) and (b) apparent reaction rate regarding TB (rc). (c) Apparent reaction rate as function of temperature in mixer MX1 (TMX1). Symbols of the same colour in these plots correspond to the same samples. Solid symbols represent the results of P-TiO2-mr synthesised under optimal conditions (Table 1). | ||
In order to identify possible correlations between input and target parameters, YTiO2, STYcat, xP,bulk, dcrystal, SBET, and Vpore from all 18 of the DoE samples were fitted by quadratic models as functions of synthesis input parameters (models are summarised in Table S3†). Limitations in these models become obvious when either certain conditions in the reactor are not practically feasible (e.g., too high hydrolysis ratios which would lead to biphasic mixtures) or the resulting target parameters would not have a physical meaning (e.g., yields higher than 100%). For our investigations, we varied a single parameter from the corresponding models and kept all other seven parameters constant at the values used for the preparation of the optimal catalyst P-TiO2-mr (vide infra). For instance, Fig. 4 visualises YTiO2 as a modelled function of temperature TMX1 (blue line). According to the model, catalyst yield is maximum at low temperatures of around 320 K and reaches a minimum at ca. 345 K. Subsequently, it increases again as TMX1 increases up to 370 K but attaining a lower level with respect to YTiO2 at 320 K (∼80 vs. 100%). One plausible explanation for this behaviour could be that at lower temperatures a higher degree of supersaturation can be achieved. This is corroborated by the fact that P-TiO2-mr-13 and -16 samples synthesised under similar conditions (Table S1†) at TMX1 = 312.8 and 356.5 K, respectively, resulted in YTiO2 of 62.8 and 21.2% (Table S2†). At TMX1 > 345 K, it appears that reaction kinetics is accelerated and might partially compensate for deficient supersaturation.
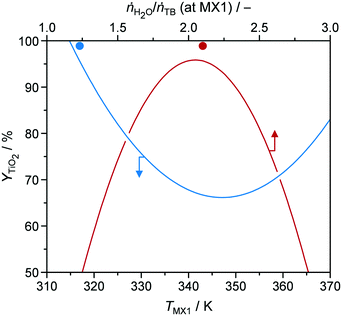 | ||
| Fig. 4 Y TiO2 as a function of temperature (TMX1) and hydrolysis ratio ṅH2O/ṅTB (at MX1) at mixer MX1. Solid symbols represent the results of P-TiO2-mr synthesised under optimal conditions (Table 1). | ||
Focusing on the hydrolysis ratio ṅH2O/ṅTB (at MX1) (red line in Fig. 4), an optimal ratio of 2.1 was observed at which YTiO2 is maximised in the model with fixed parameters. According to stoichiometry, formation of 1 mole of Ti–O–Ti bridges would require 1 mole of H2O (Fig. 5), corresponding to ṅH2O/ṅTB = 0.5. The higher hydrolysis ratio found optimal for a high YTiO2 could be partially explained by the fact that, from a kinetic perspective, 2 hydroxylated Ti species are required for condensation. Furthermore, H2O interacts strongly with mineral acids such as HNO3 or H3PO4, leading to protolysis.37 We initially thought that this effect may catalyse the hydrolysis step. However, if we consider that the P-TiO2-mr-3 sample, which was synthesised at a high SV of 100 h−1 without the use of HNO3, resulted in a good YTiO2 of 84.7% (Tables S1 and S2†), demonstrating that a residence time below 0.5 s was sufficient to effectively hydrolyse the TB agent and that hydrolysis does not appear to be the rate-determining step. We therefore deduced that neither HNO3 or any additional catalysts may be necessary for optimal catalyst synthesis of P-TiO2. This hypothesis is further elaborated in section 3.1 of the ESI.† With respect to the decrease of YTiO2 at hydrolysis ratios above 2.1 it appears that such excess of H2O shifts condensation equilibrium towards hydroxylated Ti species.
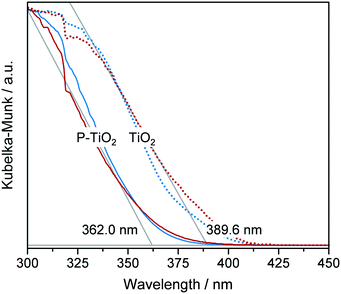
Although hydrolysis does not seem to be the bottle neck in the reaction network, the added H2O was observed to play a significant role in the incorporation of the phosphate species (Fig. 6a) in addition to the expected global trend of xP,bulk (i.e., mole bulk fraction of P in the resulting catalyst) to ascend as H3PO4 content increased in the feed (ṅH3PO4/ṅTB, Fig. S4†). Following the quadratic correlation for xP,bulk as a function of ṅH2O/ṅTB (at MX1) (Table S3†), while keeping the other parameters constant, provided an inverse trend to the one described for YTiO2 as a function of ṅH2O/ṅTB (at MX1) (vide supra). xP,bulk is minimised at a similar hydrolysis ratio of ca. 2.1, at which YTiO2 is maximised. This corroborates the strong interaction of H2O and H3PO4 with TB, which we attempted to better understand by conducting UV-vis of the calcined TiO2 and P-TiO2 catalysts (Fig. 7). In accordance with earlier findings in the literature,37,40,46 phosphate modification of TiO2 leads to a blue-shifted O2p → Ti3d transition within the UV-vis spectra, corresponding to an enlargement of the band gap from 3.2 to 3.4 eV (TiO2-mr and P-TiO2-mr, respectively). This effect was partially explained by the smaller crystallite size (dcrystal), caused by the presence of the phosphorus dopant, which was also the case for our samples substantiated by the peak broadening in XRPD patterns of the phosphated catalysts (Fig. S5,† Scherrer derived dcrystal is given in Table 1). Hence, one may conclude that linking phosphate groups to hydrolysed TiOx(OH)y sol particles impedes further crystal growth, an effect that has also been previously observed.30,37 In addition to shifts in the O1s and Ti2p3/2 X-ray photoelectron spectroscopy (XPS) spectra to higher binding energies,30,46,53 peak broadening and loss of intensity in XRPD patterns30 were used to explain the incorporation of phosphorus into the TiO2 crystal lattice, which is in line with our observations (see Fig. S5–S8†).
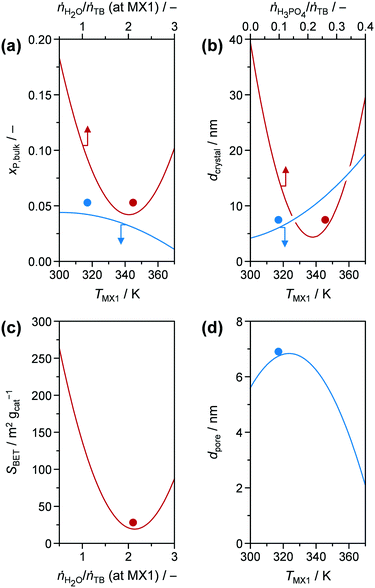 | ||
| Fig. 6 (a) xP,bulk, (b) dcrystal, (c) SBET, and (d) dpore as modelled functions (obtained from DoE) of (a, b and d) TMX1, (a and c) ṅH2O/ṅTB (at MX1), and (b) ṅH3PO4/ṅTB, respectively. Other input parameters were fixed at the optimal values for P-TiO2-mr (Table 1). Solid symbols represent the results for P-TiO2-mr synthesised under optimal conditions. | ||
The presence of H3PO4 in the reaction mixture greatly influenced dcrystal. Even for very low amounts of H3PO4 in the feed (ṅH3PO4/ṅTB ∼ 0.05, corresponding to xP,bulk ∼ 0.01), the crystallite size decreased from 29.9 nm in pure TiO2 to 12.2 nm (vide P-TiO2-mr-18 and -11 samples in Tables S1 and S2,† respectively). This effect was visualised by TEM images of pure and phosphated TiO2 (Fig. S9†). These results also revealed that addition of phosphoric acid to the synthesis mixture leads to almost monodisperse crystals hinting that phosphate already is incorporated into the TiO2 lattice at an early stage upon crystal growth. According to the conclusion given above, this is explained by the reaction of H3PO4 with hydrolysed TB hampering the extended crystal growth of TiO2. Both measured data (Fig. S10†) and quadratic model (Fig. 6b, red line) point to a minimum of the crystallite size for medium ṅH3PO4/ṅTB ∼ 0.23 and xP,bulk ∼ 0.09, respectively. Based on the model, dcrystal became larger for higher ratios, a fact that was also proven using samples prepared under similar conditions, e.g.: P-TiO2-mr-1, -5, and -15 synthesised at ṅH3PO4/ṅTB ∼ 0.05, 0.43, and 0.10 (Table S1†) resulting in crystallite sizes of 13.4, 10.4, and 7.3 nm, respectively (Table S2†). This entire effect has not been previously observed, since former studies investigated samples with a maximum mole bulk fraction of phosphorus ≤0.15.30,37,40,42,55,56 In case of the first and latter samples (ṅH3PO4/ṅTB = 0.05 and 0.10), ca. 47 mol% of phosphorus in the feed solution was incorporated into the resulting solid while only 41 mol% were found in P-TiO2-mr-5 (high ṅH3PO4/ṅTB), indicating a limit to phosphate uptake in the TiO2 sol–gel framework. We further concluded that hydrolysis and condensation, and the resulting crystallite growth were accelerated and favoured over P incorporation at high acid-to-TB ratios.
Porous properties, i.e., SBET, dpore, and Vpore, of the calcined samples were mainly influenced by ṅH2O/ṅTB (at MX1), ṅH3PO4/ṅTB, and TMX1 (Fig. 6c and d), according to the DoE models (Table S3†); a simple global correlation between experimental results and input parameters was not observed, indicating a more complex dependency between porosity and synthesis conditions. In the following discussion, Vpore is not further investigated, since it generally increased linearly with SBET (Fig. S11†). A relationship between both properties can usually be anticipated; however, a peculiar feature in our case was that two groups emerged in this correlation. A steeper rise of Vpore was detected as SBET increased for high mole bulk fractions of phosphorus (xP,bulk > 0.15), indicating a different porous structure in the samples containing less phosphorus. The correlation SBET model as a function of hydrolysis ratio in MX1 (Fig. 6c) reveals a similar shape compared to the xP,bulk model (Fig. 6a) and its minimum at ṅH2O/ṅTB (at MX1) ∼ 2.2 is only slightly higher than the one of the latter model (2.0, vide supra). Thus, it could be concluded that surface area and phosphorus content in the catalysts are tuned by the same mechanistic steps during sol–gel formation, which makes sense when considering phosphate is incorporated into the TiO2 crystal lattice. One aspect of this dependency relates to the observation that SBET increases as dcrystal decreases (Fig. S12†). However, this correlation comprises huge distributions and hence, crystallite size is one but not the only parameter that influences the porous properties of our samples. Based on experimental evidence and models, we deduced that i) phosphorus incorporation into the titanium oxide framework upon sol formation and ii) the arrangement of the resulting crystallites within the mesoporous agglomerates during gelation were governed by the hydrolysis ratio (ṅH2O/ṅTB (at MX1)).
5-HMF synthesis over phosphated TiO2
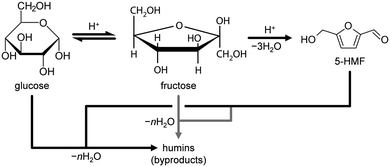
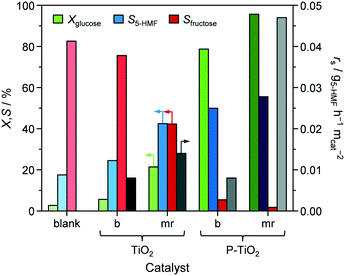
Conversion of glucose to 5-HMF via fructose as an intermediate (Scheme 1) was chosen as a model reaction since it has previously been shown that phosphated TiO2 catalysts exhibit promising activity and selectivity for this reaction when conducted in biphasic systems.29–31 Under optimised conditions, low glucose concentration (2 wt%), high catalyst-to-substrate ratios (mcat/mglucose = 1/3), biphasic systems (like THF/H2O), medium temperatures (448 K), and ca. 3 h of reaction time lead to 94% glucose conversion and 83% 5-HMF yield.29 The addition of NMP as an additive was also found to significantly improve selectivity, explained by i) suppressing the formation of polycondensation humin byproducts from the substrate, intermediate, and product (Scheme 1), and ii) facilitated partitioning of 5-HMF into the organic layer.57 For the purpose of the investigations presented herein, we utilised the synthesis approach by Beltramini et al.29 However, since the focus of our study was on the optimisation of the catalyst and its synthesis, conditions for 5-HMF synthesis were, for the sake of comparison, fixed to maintain conversion levels below 100% by applying a lower reaction temperature (423 K) and a larger substrate concentration (5.5 wt%). Furthermore, reactions were performed in microwave irradiated batch reactors, enabling fast heating rates and high energy efficiency.35 In line with results from the literature, we also obtained an increase in both activity and selectivity towards 5-HMF for comparable catalysts synthesised in a batch reactor when phosphate is present in the TiO2 framework (Fig. 8). Glucose conversion (Xglucose, green bars) improved from 2.7% in the reaction without a catalyst to 5.6% for the TiO2-b sample and finally, to 78.7% for the P-TiO2-b sample, while selectivity for 5-HMF (S5-HMF, blue bars) increased from 17.5 to 24.5 to 50.0%, respectively, and selectivity to fructose (Sfructose) declined likewise.The change in activity can be explained by the different amounts and types of catalytically active acid sites present on TiO2-b and P-TiO2-b. The total concentrations of Brønsted (cBrønsted) and Lewis (cLewis) acid sites and their evolution upon increasing the evacuation temperature were quantified by infrared spectroscopic analysis of chemisorbed pyridine (Fig. 9, blue symbols). The absence of Brønsted acidity was evidenced for the TiO2 sample and was accompanied by a minor concentration of Lewis acid sites that was almost vanished after evacuation at 573 K. Phosphorus incorporation led to the appearance of Brønsted acidity and the higher concentration of stronger Lewis acid sites than the pure TiO2 sample. In the case of the phosphated catalyst (P-TiO2-b), 50% and 11% of the Lewis acid sites present at 473 K are retained after evacuation at 573 K and 673 K, respectively. Contrarily, in the absence of phosphorus, TiO2-b sample only preserved 75% at 573 K and the complete disappearance of Lewis acid sites was detected after evacuation at 673 K, which suggests the presence of stronger acid sites on the P-TiO2-b sample (Fig. 9b). These results are in line with the observations by NH3-TPD (Fig. S14,† blue lines). Brønsted sites were further investigated by TPSR of n-propylamine (Fig. 10a, blue lines): primary amines, which can be adsorbed in stoichiometric quantities on Brønsted acid sites, decompose upon heating via the Hofmann elimination to alkenes and ammonia. The relative evolutions of n-propylamine, propene, and ammonia between 473 K and 773 K are provided in Fig. S15b and d.† In the case of the TiO2-b sample, the mass spectra of these compounds are barely constant, which could be due to the negligible adsorption of n-propylamine, in line with the absence of Brønsted acid sites on these catalysts (Fig. 9a, blue diamonds). For the phosphated TiO2 sample (Fig. S15d†), only unreacted n-propylamine was detected in appreciable amounts between 473 K and 525 K. A single broad desorption peak was observed, which is attributed to the loss of weakly bound molecules, e.g., associated to Lewis acid sites, hydroxyl defects or hydrogen bonded to protonated amines at the Brønsted sites that are unable to catalyze the Hofmann elimination.58 Above 525 K, propene and ammonia were also evolved. As shown in Fig. 10a, two well-resolved peaks can be distinguished in the propene spectra (blue line). The first peak is characteristic of the surface reaction of n-propylamine adsorbed on Brønsted acid sites.58 The temperature of the peak maximum and the associated amount of propene desorbed can be used as an alternative mean to quantify the strength and bulk concentration of Brønsted acid sites, respectively. In contrast to the first peak, the origin of the second peak is still a subject of debate. Its appearance has been linked with the presence of a weaker type of acid sites59 and with the interaction with Lewis acid centers.60 Readsorption and subsequent reaction of the desorbed n-propylamine on Brønsted acid sites vacated at lower temperatures that could give rise to additional propene desorption at higher temperatures seems unfeasible since no ammonia desorption was detected in this temperature range (Fig. S15d†). The latter suggests the possible formation of dialkylamines and their subsequent decomposition into the alkene and the primary amine at temperatures above 650 K.61
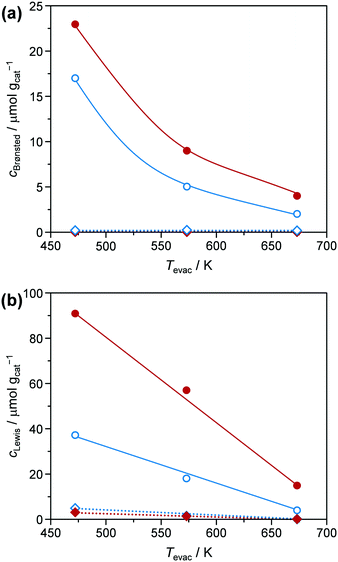 | ||
| Fig. 9 Evolution of the concentration of (a) Brønsted (cBrønsted) and (b) Lewis (cLewis) acid sites of the TiO2 (diamonds) and P-TiO2 (circles) catalysts prepared in the batch (blue symbols) or in the microreactor (red symbols), respectively, with the evacuation temperature (Tevac) determined by infrared spectroscopy of pyridine adsorbed (see Fig. S13†). | ||
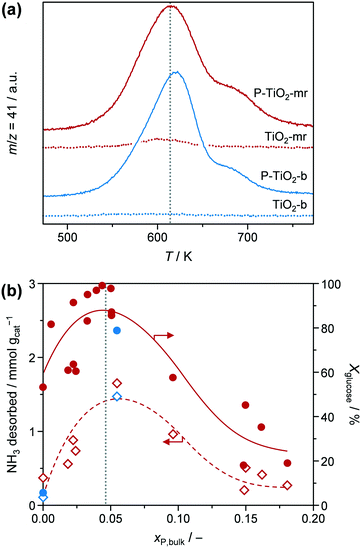 | ||
| Fig. 10 (a) Propene evolution upon TPSR of n-propylamine over TiO2 (dashed lines) and P-TiO2 (straight lines) catalysts prepared in the batch (blue lines) or in the microreactor (red lines), respectively. Evolution of n-propylamine and ammonia is given in Fig. S15 in the ESI.† (b) Total amount of NH3 desorbed during NH3-TPD analysis (diamonds) and glucose conversion (Xglucose, circles) of (selected) P-TiO2 samples, prepared in the batch (‘b’, blue symbols) or in the microreactor (‘mr’, red symbols), as a function of mole bulk fraction of P. Dotted line represents optimal xP,bulk. | ||
In view of these evidences, which are in line with various studies,29,30,39,41 it is clear that phosphatisation of TiO2 enhances the number of Lewis and Brønsted sites; however, only the optimal balance between both centres in such bifunctional catalysts correlated with elevated 5-HMF formation compared to systems featuring only one type of acid site.29–31,44,45 According to the observations and conclusions of these studies, fructose isomerisation is supposed to mainly take place over Lewis sites while Brønsted centres are likely to catalyse dehydrogenation of a cyclic enol intermediate62,63 into 5-HMF. The low activity and 5-HMF selectivity determined in our experiments when a catalyst was absent and the observation of decreasing fructose concentrations as Xglucose increases in favour of 5-HMF formation (Fig. 8) corroborate earlier hypotheses claiming fructose isomerisation to be the rate determining step in this reaction.29,31
In order to gain a deeper understanding of the interplay between catalyst properties and catalytic performance, we evaluated all microreactor prepared samples (P-TiO2-mr-1–18) under the same reaction conditions as the batch catalysts. Their individual catalytic results are summarised in Table S2.† We found an optimal value for the phosphorus bulk concentration of xP,bulk ∼ 0.05 at which Xglucose, ranging from 18.0 to 99.1%, is maximised (Fig. 10b, circles) in line with the results obtained by Beltramini et al.30 However, in the correlation presented herein, strong local deviations were also observed, hinting that more than one single catalyst property might influence the activity. This relation can be partly explained by the number of catalytically active surface acid sites present in our samples since the total amount of NH3 desorbed shows a similar trend for xP,bulk, featuring a slight shift of the maximum to higher bulk phosphorus concentrations of 0.07 (Fig. 10b, diamonds). This result substantiates that not only the number of acid sites but also the balanced presence of both Lewis and Brønsted sites is relevant to the efficient conversion of glucose to 5-HMF over P-TiO2 based catalysts. In terms of the correlation between mole surface and bulk fraction of phosphorus (Fig. S16†), all samples had slightly more phosphorus on the surface compared to the bulk. From this we deduced that the surface of the samples exhibiting xP,bulk > 0.05 may already be enriched with Brønsted acid sites at the expense of Lewis centres and hence, resulting in lower activity of glucose–fructose isomerisation, but enhanced dehydrogenation of fructose to 5-HMF. In fact, selectivity towards 5-HMF was highest (S5-HMF > 44.7%, Table S2†) for the samples containing most phosphorus (xP,bulk > 0.09). Besides, the change in selectivity could also be explained by the ca. 10% higher acid site density in these samples compared to the ones featuring less phosphorus (Fig. S17b†). The same explanations hold for the TiO2 catalysts without phosphate loading: the microreactor prepared sample, P-TiO2-mr-18, had a significantly higher number of surface acid sites (0.38 vs. 0.10 mmol gcat−1) and hence, exhibited greatly improved activity of 56.2% compared to its batch prepared counterpart (TiO2-b) with only 5.6% conversion (vide points of Xglucose at xP,bulk = 0 in Fig. 10b). The local fine structure of the Xglucose–xP,bulk correlation in Fig. 10b is likely due to other catalyst properties influencing their activity. It can be generally stated that as SBET increases, conversion also increases to almost 100%, which could be explained by the likely higher absolute number of active sites exposed. Interestingly, the two groups of microreactor prepared samples that showed a different correlation for Vporevs. SBET (Fig. S11† and vide supra) also exhibited a distinct activity when correlating Xglucose and SBET (Fig. S18a†). Understanding the different porous features of these two groups will require a deeper structural analysis in an upcoming investigation.
In contrast to Xglucose, S5-HMF was only slightly affected (changing between 34.7 and 49.8%, Table S2 and Fig. S18b†) by catalyst properties of the samples of this study. In view of this result and based on the literature,19,29–31,34,35,57,62–69 we concluded that reaction conditions (i.e., reaction or residence time, temperature, pressure and partitioning of 5-HMF into the organic layer) play a more significant role on selectivity than catalyst features. In all cases, the resulting reaction mixtures in our experiments became medium to dark brown solutions, which probably caused the unresolved peaks observed in the HPLC analysis. Several side reactions have been identified in 5-HMF synthesis from sugar sources combining in a network of isomerisation, dehydration, fragmentation, and/or condensation steps,62,63,65e.g.: 5-HMF, likely adsorbed on strong Brønsted acid sites,70,71 and H2O can undergo polymerisation reactions and/or form levulinic acid.64 Furthermore, the glucose substrate, the fructose intermediate, and the 5-HMF product can be involved in polycondensation, creating cross-linked humin compounds.65,67–69 In order to achieve high selectivity to 5-HMF, it was necessary i) to quickly isomerise glucose into fructose, thus avoiding the formation of reactive glucose oligosaccharides31,65 and ii) to partition 5-HMF into the organic layer to separate it from the sugars and H2O.34,35,56 Despite the use of NMP as a phase transfer mediator for 5-HMF,29 the average product concentration in our system was only 1.5-times higher in the organic phase than in the aqueous layer. The high glucose concentration (i.e., 5.5 wt%) is prone to result in excessive oligomer formation, triggering the side reactions described above.65
Finally, we assessed the catalyst efficiency expressed as surface based reaction rate (rs), i.e., formation rate of 5-HMF per BET surface area of calcined, fresh catalyst, for all the developed materials (Tables 1 and S2†). For the bulk prepared catalysts, there was no improvement when comparing TiO2-b and P-TiO2-b, resulting in a rs of 0.008 g5-HMF h−1 m−2. In contrast, samples synthesised in the microreactor (P-TiO2-mr-1–18) exhibited higher catalyst efficiencies (0.007–0.047 g5-HMF h−1 m−2) compared to the bulk. Plotting rsvs. a single catalyst property did not allow simple correlations to be identified, hinting that catalyst efficiency is affected by an interplay of porosity, crystallite size, and molar P/Ti bulk ratio (i.e., acidity). Fig. 11 highlights the correlations between rs and xP,bulk and dcrystal when the other catalyst properties are kept fixed. According to these models (Table S4†), the most efficient catalyst should possess small dcrystal and low xP,bulk. Hence, 5-HMF synthesis over P-TiO2 catalysts appears to be particle size dependent. This was attributed to the fact that the proportion of crystallographic facets of TiO2 crystallites, as present in our samples, is usually different for crystals of different sizes, which is likely to impact the active sites.72 The second maximum found for small dcrystal and high xP,bulk is likely due to enhanced surface acid site concentration, which was found beneficial for 5-HMF synthesis activity (vide supra and Fig. S17b†). The third maximum for large dcrystal and low xP,bulk stems from including the P-TiO2-mr-18 sample (pure TiO2) in the DoE which showed very large crystals (29.9 nm), a xP,bulk of 0, but a high rs of 0.032 g5-HMF h−1 m−2 (Table S2†). We interpreted this outlier in the correlation as evidence that the reaction mechanism over pure TiO2 differs from that using the phosphated catalysts and is probably due to the presence of different types of acid sites in both groups of materials (Fig. 9, 10, and S14†). The fourth maximum shown for large dcrystal and large xP,bulk (Fig. 11) unveils the limitation of the models applied since it appears difficult to prepare huge TiO2 crystallites at high phosphate concentrations. Samples exhibiting xP,bulk between 0.148 and 0.180 only contained TiO2 crystals of 10.4–14.5 nm in size (Table S2†). However, as it will be demonstrated below, the accuracy of the models was sufficient to tune catalyst preparation and performance at the same time.
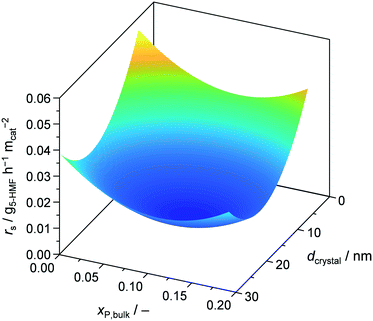 | ||
| Fig. 11 Reaction rate of 5-HMF as a function of mole bulk fraction of P and TiO2 crystallite size at fixed SBET = 17 m2 gcat−1, dpore = 5.4 nm, and Vpore = 0.03 cm3 gcat−1. | ||
Optimisation of catalyst synthesis and catalytic performance
Combination of DoE models for catalyst synthesis (Table S3†) and catalytic reaction (Table S4†) were exploited to simultaneously relate parameters that influence catalyst preparation, catalyst yield, catalyst properties, and catalytic performance (Fig. 2). Optimal catalyst properties (xP,bulk, dcrystal, SBET, dpore, and Vpore) were achieved with the aid of the DoE software by optimising the 5-HMF synthesis models for maximal Xglucose, S5-HMF, and rs. The resulting catalyst properties were subsequently used as target values for optimising catalyst synthesis and obtaining maximal YTiO2 and STYcat. The results of both optimisations (columns ‘optimum’), the synthesis parameters effectively applied, the resulting catalyst properties, and the catalytic performance are summarised in Table 1 (sample ‘P-TiO2-mr’). Synthesis parameters were used to predict resulting catalyst (space–time) yield and catalyst properties. The same was done for the 5-HMF synthesis values (Table 1). It turned out that the DoE models generally underestimated the target parameters by 1.4–25%, which is still, however, a good approximation of the correlations discussed here. The deviation even reached 60% in the case of Vpore; however, we would like to stress that the standard deviation and experimental error were in a similar range. The synthesis of the optimal catalyst P-TiO2-mr was repeated three times and delivered reproducible results, based on a maximal relative standard deviation of ca. 30% for each parameter (except for Vpore; Table 1). This emphasises that a stable process could be established, pointing to a validation of the correlation models in this work, even though the models would benefit from further refinement to better reflect local effects as already mentioned above.From Fig. 12, it can be seen that applying optimal synthesis conditions for P-TiO2 catalysts in the microreactor simultaneously resulted in the highest YTiO2 and STYcat values (98.9% and 26.8 gcat h−1 cmreactor−3, respectively) of all the batch and microreactor prepared samples (Tables 1 and S2†). For comparison purposes, a second phosphate-free TiO2 catalyst (TiO2-mr) was prepared under the conditions that were found to be optimal for the P-TiO2-mr system. YTiO2 and STYcat from this sample were slightly lower (82.9% and 20.5 gcat h−1 cmreactor−3) compared to its phosphate containing counterpart, emphasising that both systems have different optimal synthesis conditions. This appears plausible since we had already discovered that even a small concentration of phosphate was likely to alter the mechanism of the sol–gel process (Fig. 5).
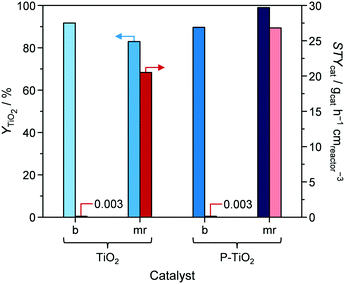 | ||
| Fig. 12 Yield (YTiO2) and space–time yield (STYcat) of pure (TiO2) and phosphated titania (P-TiO2) prepared in batch mode (b) or in the microreactor (mr), respectively. | ||
Surprisingly, the TiO2-mr material featured Xglucose = 21.4%, S5-HMF = 42.4%, and rs = 0.014 g5-HMF h−1 m−2 upon 5-HMF synthesis, which is a considerable improvement compared to the TiO2-b sample (5.6%, 24.5%, 0.008 g5-HMF h−1 m−2, respectively, Fig. 8 and Table 1). We deduced from this result that the microreactor prepared catalyst partially benefitted from catalyst properties which were found to boost catalytic performance, such as lower crystallite size, low porosity (Table 1), and higher acidity (as evidenced by the small propene evolution upon TPSR of n-propylamine, Fig. 10, red dashed line). However, glucose conversion, 5-HMF selectivity, and catalyst efficiency could be maximised towards 95.6%, 55.5%, 0.047 g5-HMF h−1 m−2, respectively, only in case of the optimised P-TiO2-mr sample in relation to the catalytic performance of the batch catalyst P-TiO2-b (Xglucose = 78.7%, S5-HMF = 50.0%, and rs = 0.008 g5-HMF h−1 m−2, Fig. 8 and Table 1). The effect upon phosphorus incorporation into the TiO2 framework on the acid properties elaborated above with respect to the batch samples also applies to the microreactor catalysts; however, a clear difference in the amount and nature of acid centres in the resulting materials could be unravelled based on the catalyst synthesis protocol. Comparison of the phosphated TiO2 samples by FT-IR of pyridine adsorbed (Fig. 9) evidenced a higher concentration of both Brønsted and Lewis acid sites and also a significantly higher ratio of Lewis-to-Brønsted sites in the case of the sample prepared by the microreactor route (P-TiO2-mr). Additionally, the latter also exhibited stronger acid centres as the amount of pyridine adsorbed upon temperature increase on both types of sites was preserved to a larger extent over this sample. This is corroborated by the results from TPSR of n-propylamine (Fig. 10a) since the main peak shifts to higher temperatures for the phosphated TiO2 sample prepared in the batch reactor in comparison to the P-TiO2-mr catalyst. Additionally, higher concentration of Brønsted acid sites are also derived by TPSR (20 mmolC3H6 gcat−1 and 23 mmolC3H6 gcat−1 for P-TiO2-b and P-TiO2-mr, respectively) in line with the infrared analysis. Furthermore, the shift of the band gap in the UV spectra (Fig. 7) and the different shapes of propene evolution upon TPSR (Fig. 10a) as well as of NH3-TPD curves (Fig. S14†) point to distinct microstructural features in both microreactor and batch reactor prepared materials. The 31P NMR spectra of the phosphated samples are given in Fig. 13. The spectra showed a broad signal between ca. 5 ppm and ca. −25 ppm that can be ascribed to the presence of a number of species with different protonation degree.73 The major signal appeared at ca. −4 ppm and corresponds to orthophosphate species in which the degree of P oxidation is +5, followed by contributions from titanium hydrogen phosphate phases, i.e., HPO42− (ca. −10.5 ppm) and H2PO4− (ca. −18 ppm), formed during the synthesis. In the case of the P-TiO2-b sample, the appearance of an additional peak at ca. −9 ppm was observed. Even though the origin of this peak is unclear, the lower acidity of this sample in comparison to that of the P-TiO2-mr catalyst (Fig. 9) made the assignment of this peak to the presence of the Ti(HPO4)2 phase unfeasible but rather due to the occurrence of both titanium phosphate and condensed phosphate species or to the titanium pyrophosphate phase formed by dehydration of adjacent P–OH groups during calcination.74 Thus, catalyst synthesis in the microreactor only appears to favour the formation of phosphorus species providing the necessary amount and ratio of Lewis and Brønsted sites to efficiently catalyse the glucose-to-5-HMF reaction. In addition, TEM (Fig. S9†) and STEM-EDXS (Fig. S19†) revealed a uniform distribution of Ti and P in both samples and they confirm the formation of smaller nanoparticles in the microreactor prepared material. Hence, it appears evident that the well-controlled environment in the channels of the microreactor results in an optimal catalyst which was ca. six times more efficient in catalysing the 5-HMF reaction than the batch catalyst.
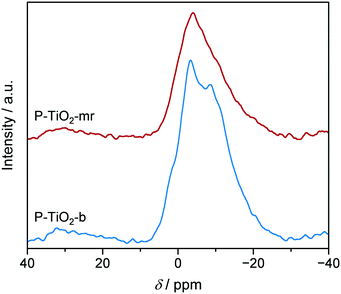 | ||
| Fig. 13 31P MAS NMR spectra of P-TiO2 catalysts prepared in the batch (blue) or in the microreactor (red), respectively. | ||
Reusability of the optimal P-TiO2-mr catalyst was demonstrated by repeating the 5-HMF reaction ten times with the same sample. A filtration–washing–calcination procedure was applied after each run to regenerate the catalytic material. After ten runs both glucose conversion and 5-HMF selectivity were preserved (Xglucose = 92.1 vs. 95.6% and S5-HMF = 53.2 vs. 55.5%, vide Fig. S20†).
Conclusions
In this study, we established a novel one-step sol–gel method for the preparation of a highly active phosphated TiO2 catalyst in a microreactor. Precise control of catalyst synthesis parameters in conjunction with DoE enabled us to identify key parameters that impact catalyst preparation, its properties and performance. The catalyst yield was mainly affected by thermodynamics (i.e., supersaturation) and the hydrolysis ratio. We unravelled that the hydrolysis step was crucial for incorporating the phosphorus into the TiO2 crystals. Furthermore, it influenced the way in which the crystal aggregates were formed, impacting the resulting surface area. The size of the TiO2 crystallites was mainly adjusted by the amount of H3PO4 added: molar flow ratios of ṅH3PO4/ṅTB ≤ 0.2 impeded crystal growth while at ratios above 0.2 a pronounced increase in crystal size was observed, explained by a catalytic effect due to the excessive amounts of acid present. Testing the obtained materials for their catalytic performance upon 5-HMF synthesis in a microwave reactor revealed that selectivity was mainly influenced by reaction conditions rather than by catalyst properties. The interplay of small TiO2 crystallites and low mole bulk fractions of phosphorus (xP,bulk ∼ 0.05) were key to achieve a high activity. Through global optimisation the final catalyst synthesis in the microreactor approached a yield of 98.9% and a space–time yield of 26.8 gcat h−1 cmreactor−3 compared to 89.6% and 0.07 gcat h−1 cmreactor−3 in the batch reactor. The optimal microreactor catalyst featured a significantly higher glucose conversion of 95.6%, a slightly improved selectivity towards 5-HMF of 55.5% and a substantially increased catalytic efficiency of 0.047 g5-HMF h−1 m−2 compared to a batch material (78.7%, 50.0%, 0.008 g5-HMF h−1 m−2) which was attributed to the well-controlled size distribution of the TiO2 crystallites, the larger acid site density, and the enhanced molar Lewis-to-Brønsted centre ratio in the first. This approach is likely applicable to other functionalised solid materials, enabling reproducible and quickly adaptable synthesis, fast optimisation of the targeted product, and providing useful hints in terms of correlations between synthesis and performance parameters.Conflicts of interest
There are no conflicts to declare.Acknowledgements
The authors thank Dr. R. Hauert (EMPA) for conducting XPS analysis, C. Simon (FHS St. Gallen) for his valuable input on DoE evaluation, Dr. A. Armutlulu (ETH Zurich) for TEM/STEM-EDXS microscopy as well as our collaborators from ZHAW Dr. T. Franken for NH3 TPD measurements, Dr. N. Zucchetto for N2 physisorption characterization, Dr. R. Kontic for XRPD analysis, S. Ammann and S. Mühlemann for XRF investigations, and Dr. M. Rothensteiner for experimental support and discussions.Notes and references
- V. Hessel, S. Hardt and H. Löwe, Chemical Micro Process Engineering, Wiley-VCH, Weinheim, 2004, p. 674 Search PubMed.
- D. M. Roberge, M. Gottsponer, M. Eyholzer and N. Kockmann, Chim. Oggi, 2009, 27, 8–11 CAS.
- N. Kockmann, M. Gottsponer, B. Zimmermann and D. M. Roberge, Chem. – Eur. J., 2008, 14, 7470–7477 CrossRef CAS PubMed.
- W. Ehrfeld, Chimia, 2002, 56, 598–604 CrossRef CAS.
- R. Wohlgemuth, I. Plazl, P. Žnidaršič-Plazl, K. V. Gernaey and J. M. Woodley, Trends Biotechnol., 2015, 33, 1–13 CrossRef PubMed.
- V. Kumar and K. D. P. Nigam, Green Process. Synth., 2012, 1, 79–107 CAS.
- R. Porta, M. Benaglia and A. Puglisi, Org. Process Res. Dev., 2016, 20, 2–25 CrossRef CAS.
- N. Kockmann, M. Gottsponer and D. Roberge, Chem. Eng. J., 2011, 167, 718–726 CrossRef CAS.
- P. Anastas and J. Warner, Green Chemistry: Theory and Practice, Oxford University Press, New York, 2000, p. 30 Search PubMed.
- J. Bolivar, J. Wiesbauer and B. Nidetzky, Trends Biotechnol., 2011, 29, 333–342 CrossRef CAS PubMed.
- P. Riedlberger and D. Weuster-Botz, Bioresour. Technol., 2012, 106, 138–146 CrossRef CAS PubMed.
- J. M. Köhler and B. P. Cahill, Micro-Segmented Flow Applications in Chemistry and Biology, Springer, Heidelberg, 2014 Search PubMed.
- H. P. L. Gemoets, Y. Su, M. Shang, V. Hessel, R. Luque and T. Noel, Chem. Soc. Rev., 2016, 45, 83–117 RSC.
- A. Gavriilidis, A. Constantinou, K. Hellgardt, K. Kuok Hii, G. J. Hutchings, G. L. Brett, S. Kuhn and S. P. Marsden, React. Chem. Eng., 2016, 1, 595–612 RSC.
- D. Jussen, H. Soltner, B. Stute, W. Wiechert, E. von Lieres and M. Pohl, J. Biotechnol., 2016, 231, 174–182 CrossRef CAS PubMed.
- Y. Muranaka, H. Nakagawa, R. Masaki, T. Maki and K. Mae, Ind. Eng. Chem. Res., 2017, 56, 10998–11005 CrossRef CAS.
- K.-J. Wu, G. M. De Varine Bohan and L. Torrente-Murciano, React. Chem. Eng., 2017, 2, 116–128 RSC.
- K.-J. Wu, Y. Gao and L. Torrente-Murciano, Faraday Discuss., 2018, 208, 427–441 RSC.
- K.-J. Wu and L. Torrente-Murciano, React. Chem. Eng., 2018, 3, 267–276 RSC.
- H. Jacobsen, in Handbook of Green Chemistry, ed. T. Anastas and R. H. Crabtree, Wiley-VCH, Weinheim, 2013, vol. 2, p. 93 Search PubMed.
- M. Schoenitz, L. Grundemann, W. Augustin and S. Scholl, Chem. Commun., 2015, 51, 8213–8228 RSC.
- M. Mayer, J. Bucko, W. Benzinger, R. Dittmeyer, W. Augustin and S. Scholl, Exp. Heat Transfer, 2014, 28, 222–243 CrossRef.
- K. Wu and S. Kuhn, Chim. Oggi, 2014, 32, 62–66 Search PubMed.
- R. L. Hartman, Org. Process Res. Dev., 2012, 16, 870–887 CrossRef CAS.
- H. Wang, A. Mustaffar, A. N. Phan, V. Zivkovic, D. Reay, R. Law and K. Boodhoo, Chem. Eng. Process., 2017, 118, 78–107 CrossRef CAS.
- M. Hochstrasser, D. Jussen and P. Riedlberger, Chem. Eng. Process., 2017, 121, 15–23 CrossRef CAS.
- P. V. Kamat, J. Phys. Chem. C, 2007, 111, 2834–2860 CrossRef CAS.
- D. P. MacWan, P. N. Dave and S. Chaturvedi, J. Mater. Sci., 2011, 46, 3669–3686 CrossRef CAS.
- L. Atanda, A. Shrotri, S. Mukundan, Q. Ma, M. Konarova and J. Beltramini, ChemSusChem, 2015, 8, 2907–2916 CrossRef CAS PubMed.
- L. Atanda, S. Mukundan, A. Shrotri, Q. Ma and J. Beltramini, ChemCatChem, 2015, 7, 781–790 CrossRef CAS.
- L. Atanda, M. Konarova, Q. Ma, S. Mukundan, A. Shrotri and J. Beltramini, Catal. Sci. Technol., 2016, 6, 6257–6266 RSC.
- P. Y. Dapsens, C. Mondelli and J. Pérez-Ramírez, ACS Catal., 2012, 2, 1487–1499 CrossRef CAS.
- T. Wang, M. W. Nolte and B. H. Shanks, Green Chem., 2014, 16, 548–572 RSC.
- A. A. Rosatella, S. P. Simeonov, R. F. M. Frade and C. A. M. Afonso, Green Chem., 2011, 13, 754–793 RSC.
- A. Mukherjee, M.-J. Dumont and V. Raghavan, Biomass Bioenergy, 2015, 72, 143–183 CrossRef CAS.
- B. Girisuta, L. Janssen and H. Heeres, Ind. Eng. Chem. Res., 2007, 46, 1696–1708 CrossRef CAS.
- C. Castañeda, F. Tzompantzi, R. Gómez and H. Rojas, J. Chem. Technol. Biotechnol., 2016, 91, 2170–2178 CrossRef.
- S. K. Samantaray and K. Parida, Appl. Catal., A, 2001, 220, 9–20 CrossRef CAS.
- E. Ortiz-Islas, R. Gomez, T. López, J. Navarrete, D. H. Aguilar and P. Quintana, Appl. Surf. Sci., 2005, 252, 807–812 CrossRef CAS.
- L. Kőrösi and I. Dékány, Colloids Surf., A, 2006, 280, 146–154 CrossRef.
- E. Ortiz-Islas, T. López, R. Gomez and J. Navarrete, J. Sol-Gel Sci. Technol., 2006, 37, 165–168 CrossRef CAS.
- L. Kőrösi, S. Papp, I. Bertóti and I. Dékány, Chem. Mater., 2007, 19, 4811–4819 CrossRef.
- N. Wetchakun, B. Incessungvorn, K. Wetchakun and S. Phanichphant, Mater. Lett., 2012, 82, 195–198 CrossRef CAS.
- C. Y. Fan, H. Y. Guan, H. Zhang, J. H. Wang, S. T. Wang and X. H. Wang, Biomass Bioenergy, 2011, 35, 2659–2665 CrossRef CAS.
- E. Nikolla, Y. Román-Leshkov, M. Moliner and M. E. Davis, ACS Catal., 2011, 1, 408–410 CrossRef CAS.
- G.-S. Shao, F.-Y. Wang, T.-Z. Ren, Y. Liu and Z.-Y. Yuan, Appl. Catal., B, 2009, 92, 61–67 CrossRef CAS.
- T.-Y. Ma, X.-Z. Lin and Z.-Y. Yuan, Stud. Surf. Sci. Catal., ed. E. M. Gaigneaux, M. Devillers, S. Hermans, P. Jacobs, J. Martens and P. Ruiz, Elsevier, Burlington, 2010, vol. 175, pp. 571–574 Search PubMed.
- P. Goswami and J. N. Ganguli, Bull. Mater. Sci., 2012, 35, 889–896 CrossRef CAS.
- E. Iravani, S. A. Allahyari and M. Torab-Mostaedi, J. Braz. Chem. Soc., 2016, 27, 1766–1773 CAS.
- S. M. Gupta and M. Tripathi, Cent. Eur. J. Chem., 2012, 10, 279–294 CAS.
- S. Dervin and S. C. Pillai, Sol-Gel Materials for Energy, Environment and Electronic Applications, ed. S. C. Pillai and S. Hehir, Springer, Cham, 2017, pp. 1–22 Search PubMed.
- S. Kaluza, M. K. Schröter, R. Naumann d'Alnoncourt, T. Reinecke and M. Muhler, Adv. Funct. Mater., 2008, 18, 3670–3677 CrossRef CAS.
- S. Kaluza, M. Behrens, N. Schiefenhövel, B. Kniep, R. Fischer, R. Schlögl and M. Muhler, ChemCatChem, 2011, 3, 189–199 CrossRef CAS.
- C. A. Emeis, J. Catal., 1993, 141, 347–354 CrossRef CAS.
- K. J. A. Raj, R. Shanmugam, R. Mahalakshmi and B. Viswanathan, Indian J. Chem., Sect. A: Inorg., Bio-inorg., Phys., Theor. Anal. Chem., 2010, 49, 9–17 Search PubMed.
- K. M. Parida, M. Acharya, S. K. Samantaray and T. Mishra, J. Colloid Interface Sci., 1999, 217, 388–394 CrossRef CAS PubMed.
- Y. Román-Leshkov, J. N. Chheda and J. A. Dumesic, Science, 2006, 312, 1933–1937 CrossRef PubMed.
- R. J. Gorte, Catal. Lett., 1999, 62, 1–13 CrossRef CAS.
- G. Caeiro, P. Magnoux, J. M. Lopes, F. Ramôa Ribeiro, S. M. C. Menezes, A. F. Costa and H. S. Cerqueira, Appl. Catal., A, 2006, 314, 160–171 CrossRef CAS.
- V. Kanazirev, K. M. Dooley and G. L. Price, J. Catal., 1994, 146, 228–236 CrossRef CAS.
- L. M. Parker, D. M. Bibby and R. H. Meinhold, Zeolites, 1985, 5, 384–388 CrossRef CAS.
- M. J. Antal, W. S. L. Mok and G. N. Richards, Carbohydr. Res., 1990, 199, 91–109 CrossRef CAS PubMed.
- J. Lewkowski, ARKIVOC, 2001, 2, 17–54 Search PubMed.
- J. Horvat, B. Klaić, B. Metelko and V. Šunjić, Tetrahedron Lett., 1985, 26, 2111–2114 CrossRef CAS.
- B. F. M. Kuster, Starch/Staerke, 1990, 42, 314–321 CrossRef CAS.
- C. V. McNeff, D. T. Nowlan, L. C. McNeff, B. Yan and R. L. Fedie, Appl. Catal., A, 2010, 384, 65–69 CrossRef CAS.
- S. De, S. Dutta and B. Saha, Green Chem., 2011, 13, 2859–2868 RSC.
- S. J. Dee and A. T. Bell, ChemSusChem, 2011, 4, 1166–1173 CrossRef CAS PubMed.
- J. Wang, J. Ren, X. Liu, J. Xi, Q. Xia, Y. Zu, G. Lu and Y. Wang, Green Chem., 2012, 14, 2506–2512 RSC.
- V. V. Ordomsky, J. van der Schaaf, J. C. Schouten and T. A. Nijhuis, J. Catal., 2012, 287, 68–75 CrossRef CAS.
- J. S. Kruger, V. Choudhary, V. Nikolakis and D. G. Vlachos, ACS Catal., 2013, 3, 1279–1291 CrossRef CAS.
- Y.-K. Peng, Y. Hu, H.-L. Chou, Y. Fu, I. F. Teixeira, L. Zhang, H. He and S. C. E. Tsang, Nat. Commun., 2017, 8, 675–687 CrossRef PubMed.
- L. Djafera, A. Ayral, B. Boury and R. M. Laine, J. Colloid Interface Sci., 2013, 393, 335–339 CrossRef PubMed.
- Y. Bereznitski, M. Jaroniec, A. I. Bortun, D. M. Poojary and A. Clearfield, J. Colloid Interface Sci., 1997, 191, 442–448 CrossRef CAS PubMed.
Footnote |
| † Electronic supplementary information (ESI) available: Details of catalyst preparation; equations used herein; details of DoE parameters and results; catalyst synthesis–properties–performance correlation plots; XPS graphs; XRPD patterns; TEM images; FT-IR spectra; NH3-TPD graphs; STEM-EDXS images. See DOI: 10.1039/c8cy02574f |
| This journal is © The Royal Society of Chemistry 2019 |

