Multiscale reactor modelling of total pressure effects on complete methane oxidation over Pd/Al2O3†
Received
5th December 2018
, Accepted 12th May 2019
First published on 13th May 2019
Abstract
A two-dimensional multiscale model is developed for complete methane oxidation in a continuous flow reactor. The model considers mass and heat transfer for a porous alumina supported palladium catalyst coated on a ceramic monolith substrate and the surface kinetics are described by a first-principles microkinetic model for complete methane oxidation over PdO(101). The temperature dependent conversion for a synthetic exhaust gas composition shows a delayed ignition but a higher conversion at elevated temperatures when the total pressure is increased from 1 to 10 atm. The simulations reveal a temperature and total pressure dependent operating point where the methane conversion is maximized. Analysis of the kinetics shows that the reaction is suppressed by bicarbonates, hydroxyl species and water originating from adsorbed carbon dioxide and water from the gas phase. The reaction order with respect to water and carbon dioxide at 1 atm is −0.94 and −0.99, respectively, and decreases with increasing total pressure. The developed model paves the way for exploring how design parameters and reaction conditions influence the complete methane oxidation reaction.
1 Introduction
Natural gas is used for heat and power generation and has received increasing interest in the transportation sector.1,2 Natural gas consists primarily of methane and is combusted with lower levels of nitrogen oxides, sulfur oxides and particulate matter compared to diesel and gasoline.3 Methane is the main component also in biogas which can be produced by gasification or fermentation of bioorganic waste or by-products and later be upgraded using scrubbers to remove hydrogen sulfide, carbon dioxide and moisture. After upgrading, the composition of biomethane is similar to the composition of natural gas and can be used in the natural gas infrastructure.4–7 The increased use of natural and biogas requires improved after treatment technologies since methane is a potent greenhouse gas. It is essential that uncombusted methane is removed before the exhaust is released into the atmosphere.8 Methane combustion is generally performed over supported palladium based catalysts.9–12 Under lean conditions, palladium oxide is reported to be the active phase and PdO(101) has been identified as the most reactive surface for methane dissociation due to the presence of undercoordinated Pd sites.13–16
The possibilities of modelling atomistic behaviour have increased immensely during the last few decades thanks to the large computational power. As a result, computational fluid dynamics and first-principles based models have become more common to describe fluid motion and reaction kinetics, respectively. The kinetic models can be used to describe the reactions in detail and pinpoint bottlenecks for the reaction, allowing the use of a comprehensive optimisation approach for developing high-performance materials and catalytic systems.
The present study aims to develop a multiscale reactor model for complete oxidation of methane over a supported palladium oxide catalyst where the surface reactions are described by first-principles calculations. The reactor geometry is presented as a monolithic flow reactor with porous aluminium oxide supported palladium using a single-channel monolith model. The interactions with the active palladium oxide sites are described by first-principles kinetics, and mass and heat transport effects in the porous catalyst are included in the model.
2 Materials and methods
2.1. Reactor model
The reactor model is based on a model in a previous study where first-principles kinetics are coupled to mass and heat transport in a porous catalyst layer.17 The model has been extended to a two-dimensional (2D) monolith reactor model to include axial variations. The monolith is simulated as a single-channel reactor model, which has been successfully used in the past.18,19 The channel geometry represents a monolith with 400 cpsi. The single-channel monolith is discretised into 10 tanks-in-series while the porous catalyst is divided into 12 layers to account for internal mass and heat transport axially and radially. The length of the tanks and the thickness of the layers increase successively with 30% from the inlet and 50% from the catalyst surface, respectively. In this way a finer resolution is obtained where the gradients are steeper. An illustration of the single-channel reactor is shown in Fig. 1. The chosen number of tanks and layers provides a satisfactory accuracy within a reasonable computational time. The density of the active sites is calculated, maintaining the total palladium loading in each tank and layer, to obtain an even distribution in the coated monolith substrate.
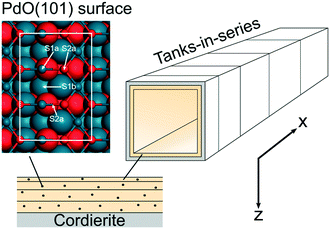 |
| | Fig. 1 An illustration of the discretised monolith reactor. The shown numbers of tanks and layers do not correspond to the numbers used in the model. The atomistic model shows a ball and stick model of the PdO(101) surface. Atoms in the top-most layer are visualised with smaller balls. The white line indicates the surface cell. Atomic color code: blue (Pd) and red (O). | |
The mass balance for the bulk gas phase for component i is described by eqn (1)
| |  | (1) |
where
Ftot is the total bulk molar flow rate,
Ac is the cross sectional area of the porous catalyst,
a is the ratio of the channel surface area to the channel volume,
kc,i is the mass transport coefficient of component i and
Ctot is the total gas phase concentration for the bulk gas.
yi,g and
yi,s are the mole fractions of component i in the bulk gas and at the porous catalyst surface, respectively. The governing heat transport equation in the axial direction is
| |  | (2) |
where
Cp is the heat capacity of the bulk gas,
Tg is the bulk gas temperature,
Ts is the catalyst surface temperature and
hk is the heat transport coefficient.
The mass balance for component i inside the porous catalyst is described by eqn (3).
| |  | (3) |
with boundary conditions as follows
| |  | (4) |
| |  | (5) |
where
Deff,i is the effective diffusivity and
νi is the stoichiometric coefficient for component i,
Csite is the active site density,
ρcat is the density of the porous catalyst,
r is the reaction rate determined from first-principles based microkinetics and
Lwc is the thickness of the porous catalyst. No mass transport proceeds between the porous catalyst and the cordierite substrate, hence the derivative is set to zero at
z =
Lwc in
eqn (5). In accordance to Anderson's criterion,
20 the porous catalyst is assumed to be isothermal in the radial direction. Thus, the generated heat from the exothermic oxidation reaction is transported from the catalyst surface at a temperature of
Ts to the bulk gas phase at a temperature of
Tg, or conducted axially through the solid material. The heat balance of the porous catalyst is described by
eqn (6)| |  | (6) |
with boundary conditions as follows
| |  | (7) |
where
As is the ratio of the external surface area to the volume of the porous catalyst,
Acs is the ratio of the cross sectional area to the volume of the porous catalyst,
λs is the catalyst heat conductivity, Δ
Hr is the reaction enthalpy,
Lmonolith is the monolith length,
ε is the emissivity factor and
σ is the Stefan–Boltzmann constant. The discretized forms of
eqn (1)–(7) that were used in the computations were outlined in the study of Azis
et al.21
2.2. Kinetic parameters
The reaction term in eqn (3)–(6) is determined from a first-principles based microkinetic model of methane oxidation on PdO(101). The kinetics is derived from the transition state theory and based on density functional theory using a dual site mechanism.27 The reaction network considers 43 different surface species and 80 elementary steps. The elementary steps with corresponding kinetic parameters are given in ref. 17 and 27.
2.2.1. Rate coefficients.
Adsorption events are described by kinetic gas theory. The rate of adsorption, kads, is described by eqn (13)| |  | (13) |
where Asite is the area per adsorption site and set to 10 Å2, mads is the mass of the adsorbed molecule, kB is the Boltzmann constant and Ea is the activation energy. The sticking coefficient is composed of two parts, a sticking coefficient at zero coverage (S00) and a dynamic factor (Sdyn). The former is calculated from the transition state theory and originates from the entropy change during the adsorption event. The dynamic part accounts for the fact that a molecule has to approach the active site in a favorable orientation in order to be successfully adsorbed. Sdyn is given a fixed value of 10−2 for methane and unity for all other molecules. Experimental values for Sdyn for CH4 are reported within the range of 10−4–10−1 (ref. 28 and references therein).
The surface reaction rate coefficients, k, are calculated according to the transition state theory29,30 between the reactant (R) and transition state (TS) as described by eqn (14)
| |  | (14) |
where
h is Planck's constant,
Q is the partition functions of translational, vibrational and rotational motions, which are assumed to be separable, and Δ
ETS−R is the electronic energy between the reactant and transition state.
The reaction rate for each elementary step is determined by multiplying the rate coefficient, k, with the coverages of the reacting species. Steady state reaction rates and coverages are obtained by solving the set of differential equations shown in eqn (15)
| |  | (15) |
where
θi(
t) is the coverage of surface species i at time
t and
vij is the reaction stoichiometric coefficient for species i and elementary reaction j.
Eqn (15) is solved to find the steady state coverages, when the rate of change in coverages equals zero, and reaction rates in each tank
k and layer
n, using the SciPy Python package.
2.3. Degree of rate control analysis
The method of degree of rate control analysis is used to obtain information about the surface kinetics at varying temperatures and total pressures. The degree of rate control analysis measures the influence of elementary step i on the catalytic cycle, while keeping the equilibrium constant fixed for elementary step i.31,32 The degree of rate control is determined according to eqn (16)| |  | (16) |
where (χi) is the degree of rate control, ki is the surface reaction rate constant for reaction step i, r is the calculated turn over frequency from the microkinetic model and Ki is the equilibrium constant for reaction step i.
2.4. Reactant conditions and catalyst properties
The methane conversion is simulated through a monolith channel coated with the porous alumina supported palladium catalyst. The feed gas into the monolith is a simulated exhaust gas composed of 1000 vol. ppm CH4, 10 vol% O2, 10 vol% H2O, and 5 vol% CO2 balanced with inert Ar. A gas hourly space velocity (GHSV) of 53![[thin space (1/6-em)]](https://www.rsc.org/images/entities/char_2009.gif) 000 h−1 was used for all simulations. The physical properties of the catalyst are taken as reported values of porous alumina. The palladium loading of the catalyst is set to 1 wt% with a palladium dispersion of 25%. The porous catalyst layer is 100 μm thick.
000 h−1 was used for all simulations. The physical properties of the catalyst are taken as reported values of porous alumina. The palladium loading of the catalyst is set to 1 wt% with a palladium dispersion of 25%. The porous catalyst layer is 100 μm thick.
As stated in section 2.1.1, the effective diffusion is taken as 10% of the bulk diffusion. It is common that the Knudsen diffusion is accounted for according to the Bosanquet equation when calculating the effective diffusivity in porous structures where the molecular mean free path and the pore sizes are comparable.33 However, the Knudsen diffusion is dependent on the porous material and has been discussed, from theoretical and experimental perspectives, to exhibit a relatively low significance on the effective diffusion.34–40 The molecular diffusion has a dominant effect on the effective diffusivity in a mesoporous structure, while in a microporous structure, the Knudsen diffusion should be considered for a correct estimate of the effective diffusion coefficient. In the present study, the porous structure is assumed to populate meso- and macro-pores, and Knudsen diffusion is hence omitted from the Bosanquet correlation. For comparison, the corresponding conversion when Knudsen diffusion is implemented for a pore size of 10 nm is shown in the ESI.† Steady state performance is simulated for temperatures of 350–500 °C in a step of 5 °C, and at total pressures of 1, 2, 4 and 10 atm. The monolith has a length of 15 mm and a diameter of 12 mm. Further, to study if palladium usage can be more efficient, three additional and different scenarios are included: (1) palladium is unevenly distributed in the axial direction in the monolith, 70% of the total amount is deposited in the first 30% of the monolith length; (2) the catalyst layer thickness is reduced to half (50 μm) and the monolith length is twice its original length (to 30 mm), while keeping the number and distribution of palladium atoms unchanged; and (3) a combination of the two previous scenarios, the catalyst layer is reduced to half and the monolith is doubled in length and 70% of palladium is deposited in the first 30% of the monolith length.
3 Results
3.1. Ignition characteristics of complete methane oxidation
The effect of varying the total pressure on the conversion of methane is shown in Fig. 2. With increased total pressure, the ignition of the reaction proceeds at higher temperature and the conversion at higher temperatures increases. The temperature at which 20% of the methane is converted, T20, is 402, 406, 412 and 421 °C for a total pressure of 1, 2, 4 and 10 atm, respectively. The higher ignition temperature with increasing total pressure correlates with a higher surface coverage of bicarbonates (CO3H), hydroxyl species (OH) and adsorbed water that adsorb on the S1(Pd) site which hinders methane adsorption and dissociation. According to the microkinetic model, dissociative methane adsorption occurs on the free S1(Pd) site as a methyl group and a hydrogen onto a free S2(O) site, an S1(Pd)–OH site or an S1(Pd)–O site, depending on the adsorption mechanism. Further, a more complex effect of the total pressure is observed at intermediate temperatures of 420–445 °C. Here, the methane conversion increases when the total pressure is raised from 1 to 2 and 4 atm but is shown to decrease when the total pressure reaches 10 atm. The observed behaviour is explained in section 4.
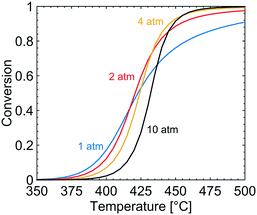 |
| | Fig. 2 Simulated methane conversion profiles over the Pd/Al2O3 catalyst at total pressures of 1 (blue), 2 (red), 4 (yellow) and 10 (black) atm for gas compositions of 1000 vol. ppm CH4, 10 vol% O2, 10 vol% H2O and 5 vol% CO2. | |
3.1.1. Surface coverage dependencies.
In Fig. 3, the coverage of CO3H (solid line), OH (dotted line) and adsorbed H2O (circles) on the catalyst surface is shown for varying temperatures and total pressures. The reported coverages are weighted averages taken over all tanks in the first layer of the catalyst, i.e. at the surface boundary between bulk gas and the catalyst. Two distinct regions are apparent at each examined total pressure. At the lowest temperatures, CO3H is the most common adsorbate while at higher temperatures adsorbed water and hydroxyl are the dominant species on the catalyst surface. The reported surface species are adsorbed on the S1(Pd) site and hence hinder methane to adsorb dissociatively. The coverage of free PdO site pairs, i.e. an unoccupied S1(Pd) site next to an unoccupied S2(O) site, is shown in Fig. 4. As expected, it is observed that the coverage of free PdO site pairs increases with increasing temperature. The low availability of PdO site pairs for dissociative methane adsorption at lower temperatures is explained here by the previous observation of the high probability of finding CO3H, hydroxyl and water on the S1(Pd) site, hence also lowering the presence of free site pairs.
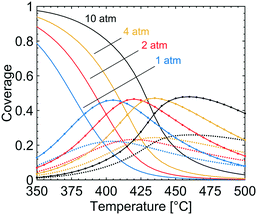 |
| | Fig. 3 The coverages of CO3H (solid lines), OH (dotted lines) and H2O (circles) at total pressures of 1 (blue), 2 (red), 4 (yellow) and 10 (black) atm for gas compositions of 1000 vol. ppm CH4, 10 vol% O2, 10 vol% H2O and 5 vol% CO2. | |
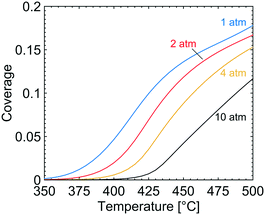 |
| | Fig. 4 The coverage of free PdO site pairs, i.e. an unoccupied S1(Pd) site next to an unoccupied S2(O) site, at total pressures of 1 (blue), 2 (red), 4 (yellow) and 10 (black) atm for gas compositions of 1000 vol. ppm CH4, 10 vol% O2, 10 vol% H2O and 5 vol% CO2. | |
3.2. Kinetics of complete methane oxidation for simulated exhaust gas conditions
To obtain the degree of rate control of the elementary steps, the rate of each step was raised by 0.001%. The degree of rate control analysis was performed for the same gas composition as used in the simulations of the conversion profiles, i.e. 1000 vol. ppm CH4, 10 vol% O2, 10 vol% H2O and 5 vol% CO2 balanced with Ar. Fig. 5 shows that methyl decomposition is the step with the highest rate control for all temperatures and total pressures except around 400 °C and 10 atm, where the dissociative methane adsorption is equally important. During methyl decomposition, a hydrogen is transferred to either S1(Pd)–OH or S2(O) to form CH2 and adsorbed water or a surface hydroxyl, respectively. After methyl decomposition, water desorption or dissociative methane adsorption is the step with the highest rate control depending on temperature and total pressure. In general, the rate control of dissociative methane adsorption increases whereas the rate control of water desorption decreases with temperature and total pressure. This is shown in Fig. 5, where at 1 atm the rate control of water desorption is more significant than that of methane adsorption below 475 °C. At 10 atm the rate control of dissociative methane adsorption is more controlling than that of water desorption for all examined temperatures. Since the examined gas composition includes a high concentration of oxygen, the regeneration of oxygen vacancies shows a low rate control while oxygen dissociation, S1(Pd)–O2 to 2 S1(Pd)–O, shows a negative rate control. The latter is explained by slow methane dissociation on S1–O. Further, surface diffusion of CH3 and CH2 from S1(Pd) to S2(O) also shows a small positive rate control since a free S1(Pd) site is formed. Bicarbonate formation has a low rate control despite the fact that CO2 adsorption blocks the surface sites. The limiting effect of bicarbonate formation is not revealed in the degree of rate control analysis as bicarbonates are not a part of the catalytic cycle. The effect of bicarbonates is instead seen as a negative CO2 reaction order in Fig. 6, examined at 350 °C for 1 and 10 atm. The reaction order for methane displays a small positive total pressure dependency while the reaction orders of both water and carbon dioxide decrease with increasing total pressures. The observation reinforces the previous results of bicarbonate and water species.
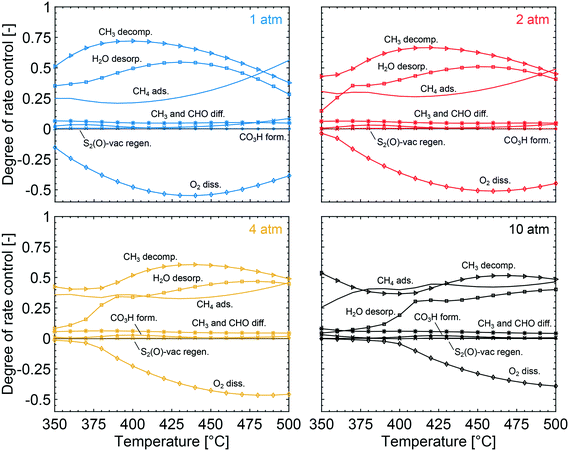 |
| | Fig. 5 The degree of rate control for dissociative methane adsorption (solid lines), decomposition of CH3 (triangles), water desorption (squares), oxygen dissociation over S1(Pd) (diamonds), S2-vac regeneration (crosses), methyl and CHO surface diffusion from S1(Pd) to S2(O) (stars) and bicarbonate formation (dotted lines) at total pressures of 1 (blue), 2 (red), 4 (yellow) and 10 (black) atm and varying temperatures. | |
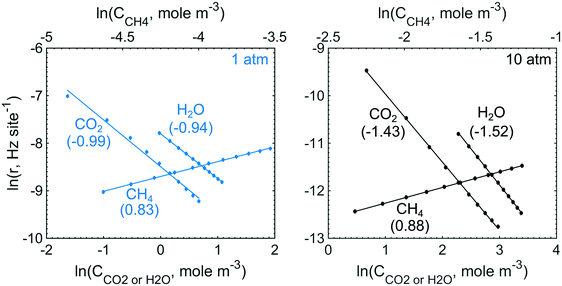 |
| | Fig. 6 The reaction orders for methane, water and carbon dioxide at 350 °C and total pressures of 1 (blue) and 10 (black) atm. | |
3.3. Axial gradients in the monolith channel
Gradients in gas concentration and temperature are evaluated under selected simulation conditions to analyse the complete methane oxidation reaction along the monolith. The selected reaction conditions are at temperatures of 390, 425 and 480 °C, which at a total pressure of 1 atm correspond to methane conversions of 8, 53 and 89%, respectively. The examined total pressures are 1, 2, 4 and 10 atm. The rows in Fig. 7, from top to bottom, show the average reaction rate, bulk gas (diamonds) and catalyst surface temperature (solid line), and the effectiveness factor, respectively, for a total pressure of 1 (blue), 2 (red), 4 (yellow) and 10 (black) atm. The columns in Fig. 7, from left to right, show the results for 390, 425 and 480 °C, respectively. The influence of external and internal mass transport is small and does not induce any significant effects for the examined reaction conditions. When the temperature and the total pressure are increased, the mass transport significance, measured as a comparison of the reaction time constants to the external and internal diffusion time constants, increases but the influence is never strong enough to be reaction rate determining. Further evaluation and discussion of the external and internal mass transport can be found in the ESI.† At 390 °C, the influence of mass transport is insignificant for all total pressures due to a slow reaction rate. This is reinforced by an effectiveness factor of ≈1. The average reaction rate is slow at the lowest temperature and thus the axial variations are small and an increased total pressure suppresses the variations even further. At 480 °C and 1 atm, the axial variations are more pronounced due to the higher reaction rate which decreases along the monolith due to the decreasing methane concentration. An axial temperature increase of the catalyst is observed, due to the release of exothermic heat, which in turn has a positive effect on the average reaction rate along the monolith, according to the Arrhenius expression. When the total pressure is increased, temperature dependent total pressure effects are observed. For the simulations at 390 °C, a negative effect is seen on the average reaction rate through the monolith, which leads to the lower conversion in Fig. 2. The reduced reaction rate is explained by the increased coverage of bicarbonates and the reduced availability of active site pairs (Fig. 3 and 4). Further, a reduced temperature increase of the catalyst surface is displayed as a result of the lower reaction rate. For the simulations at 480 °C, the conversion is shown to be enhanced by an increased total pressure, a higher average reaction rate is observed inside the first part of the monolith. The increased average reaction rate is explained by the availability of active site pairs, where methane can adsorb dissociatively, even at the increased total pressure (Fig. 4). The steep gradient in the average reaction rate along the monolith is explained by the lower methane concentration as the reaction proceeds. When the total pressure is increased the effectiveness factor is significantly reduced as a result of a higher mass transport resistance. The latter is an effect of a higher reaction rate. Interestingly, Fig. 3 shows that for the simulations at 425 °C the conversion increases from 53 to 59% for an increased total pressure from 1 to 2 atm but then drops to 27% when the total pressure is further raised to 10 atm. This effect can be regarded as a transition between the low- and high-temperature effects. Increasing the total pressure from 1 to 2 atm shows that the average reaction rate increases through the entire monolith resulting in the higher conversion. For a total pressure of 4 atm the conversion is the same as for 1 atm but the average reaction rate has leveled out to a steadier value through the monolith. When the total pressure is further increased to 10 atm the average reaction rate decreases due to the increased coverage of hindering species on the catalyst surface, at the cost of a decreased availability of free PdO site pairs (an unoccupied S1(Pd) site next to an unoccupied S2(O) site). The bulk gas and catalyst temperatures follow the same trend as for the average reaction rate where an increased reaction rate results in an increased temperature of the catalyst surface, originating from the exothermic heat, and vice versa. Since the average reaction rate shows a local maximum in total pressure the effectiveness factor displays a local minimum at 2 atm due to increased mass transport resistance.
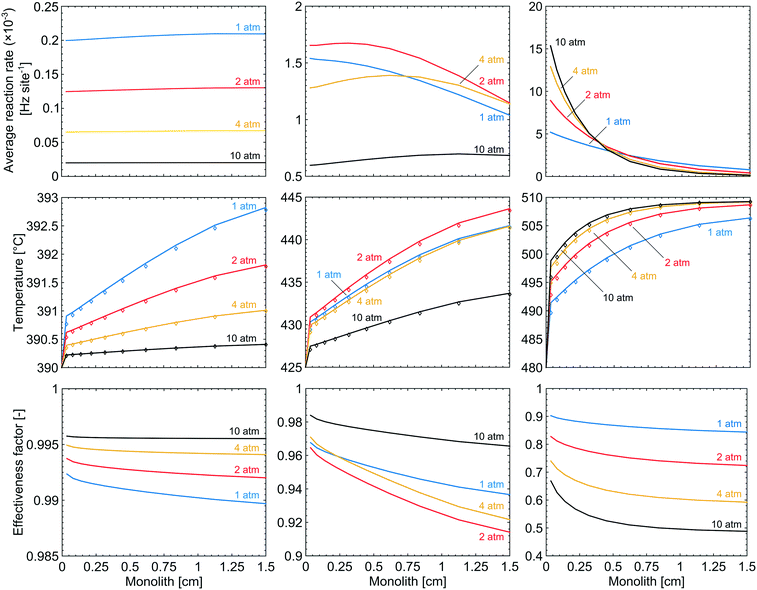 |
| | Fig. 7 The axial variations of the average reaction rate, temperature (the solid lines show the catalyst temperature while the diamonds show the gas temperature) and effectiveness factor in a monolith Pd/Al2O3 reactor for methane oxidation at total pressures of 1 (blue), 2 (red), 4 (yellow) and 10 (black) atm. Left column: 390 °C. Middle column: 425 °C. Right column: 480 °C. | |
3.4. Effects of varied catalyst dimensions and uneven palladium distribution
The effects of redistributing the palladium is evaluated by the three different scenarios described in section 2.4. The methane conversion is shown in Fig. 8 against temperatures above 425 °C for varying total pressures for the three scenarios. None of the three scenarios show an affected methane conversion at temperatures lower than 420 °C but show a positive effect at higher temperatures. In the first scenario the palladium in the catalyst is concentrated to the first part of the monolith and displays a slightly reduced methane conversion at higher temperatures. The largest change is observed at 475 °C and 1 atm where the methane conversion is reduced from 86 to 85%. In the second scenario, where the catalyst layer is reduced to half its original thickness while the monolith length is doubled, an increased methane conversion is observed for all total pressures. The maximum increase is observed at a temperature of 485 °C and 1 atm where the methane conversion increases from 88 to 90%. This maximum increase is shifted down in temperature with increasing total pressure since the original conversion is close to 100% at high temperatures and elevated pressures and hence cannot be improved any further. In other words, there exists an optimal operating temperature point which is between a temperature with a corresponding methane conversion which has the potential to be increased and a higher temperature where full conversion of methane is almost achieved. The maximum is located at 485, 455, 455 and 450 °C for a total pressure of 1, 2, 4 and 10 atm, respectively. The third scenario, which is a combination of the two previous scenarios, shows a similar trend when the catalyst layer is reduced in thickness. It is interesting that the third scenario displays a synergetic effect with the highest potential in enhancing the methane conversion from 86 to 89, at 445 °C and 10 atm. The temperature of the maximum increase in methane conversion decreases with increasing total pressure since the conversion approaches 100% as the total pressure is increased.
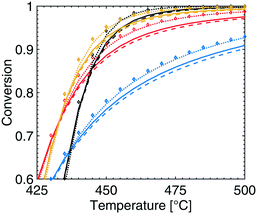 |
| | Fig. 8 Methane conversion for the standard scenario (solid lines), concentrated palladium loading to the first part of the monolith (dashed lines), half the catalyst layer thickness and double monolith length (dotted lines) and a combination of the two latter scenarios (diamonds) for temperatures above 425 °C and total pressures of 1 (blue), 2 (red), 4 (yellow) and 10 (black) atm. | |
4 Discussion
It is shown that the conversion of methane during complete methane oxidation over Pd/Al2O3 in a gas composition consisting of 1000 vol. ppm CH4, 10 vol% O2, 10 vol% H2O and 5 vol% CO2 can be enhanced by increasing the total pressure. The most important effect of the increased total pressure is the enhanced surface coverage of bicarbonates, hydroxyl species and adsorbed water on the active site of the catalyst. The increased coverage of these species is shown to decrease the reaction rate at temperatures below 420 °C. The bicarbonates, hydroxyl species and adsorbed water are, according to the first-principles microkinetics, adsorbed on S1(Pd) sites and compete with the dissociative methane adsorption, which requires a free PdO site pair (an unoccupied S1(Pd) next to an unoccupied S2(O) site) for facile adsorption. When the total pressure is increased, the coverages of these species increase, which results in lower availability of free site pairs at all examined temperatures. The negative total pressure dependence on the reaction rate seen at 390 °C displays the importance of catalyst temperature under the examined gas conditions to maintain a clean catalyst surface. If the total pressure is increased under conditions where the availability of free PdO site pairs is low, a negative effect on the surface reaction rate is to be expected. As shown in Fig. 4 at 390 °C the coverage of free PdO site pairs is low (0.03) and an increased total pressure reduces the possibility for methane to dissociate on the palladium surface close to zero while the coverage of bicarbonates increases from 0.30 to 0.87, see Fig. 3. Since the reaction rate is low the released exothermic heat is not sufficiently high to make a difference to the adsorbate composition. As a result, no positive total pressure effects are seen at 390 °C where bicarbonates, hydroxyl species and adsorbed water are dominant on the catalyst surface. At higher temperatures of above 450 °C (see Fig. 2), a positive effect of increasing the total pressure is observed up to the highest examined total pressure of 10 atm. The result is realised by a high availability of free PdO site pairs in Fig. 4 at all total pressures since thermal energy is supplied to the surface which increases the desorption rate of bicarbionates, hydroxyl species and adsorbed water. The developed multiscale model only considers thermal energy but one may speculate that any energy source or catalyst feature that reduces the coverage of the hindering surface species would yield a similar effect of the total pressure on the catalyst activity. At temperatures between where the negative and positive total pressure dependence are observed, an interesting feature is noticed. At the examined temperature of 425 °C a small increase in total pressure up to 2 atm can enhance the conversion of methane from 53 to 60%. However, if the total pressure is further increased to 10 atm, a significantly lower conversion is seen. The local maximum of methane conversion in total pressure illustrates the interplay between the increased reaction rate and the increased coverage of the hindering surface species bicarbonates, hydroxyl species and adsorbed water. When the total pressure increases from 1 atm to 2 atm the reaction rate is at first enhanced, but above 2 atm the hindering coverage is too high and the reaction rate decreases due to low availability of free active sites. To observe a positive total pressure effect the catalyst surface must not be overwhelmed with the bicarbonates, hydroxyl species and adsorbed water, since the total pressure dependent coverages are the most important factors affecting the reaction rate under the studied reaction conditions. The maximum benefit of increasing the total pressure is achieved at a temperature of 445 °C where the conversion of methane can be increased from 73 to 90% by increasing the total pressure from 1 to 4 atm.
The degree of rate control for the intrinsic reaction rate as outlined in section 3.2 shows that the surface kinetics of complete methane oxidation, in simulated exhaust gas compositions, is controlled by the methyl decomposition at lower total pressures while methane adsorption becomes increasingly controlling as the temperature and total pressure are increased. The high gas concentration of H2O enhances the importance of water desorption, due to a high increased coverage of adsorbed water as seen in Fig. 3, to regenerate a free S1(Pd) site. Since the elementary step of bicarbonate formation is not a part of the reaction cycle but contributes to the formation of a hindering species in an independent parallel pathway, its degree of rate control is low. The negative effects of carbon dioxide are instead revealed in the analysis of the reaction order. Similarly, a negative reaction order is present for water. At atmospheric total pressure, methane, water and carbon dioxide display a reaction order of 0.83, −0.94 and −0.99, respectively. This is in line with similar work by other groups.41–43 It should, however, be noted that the experimental conditions differ from the ones used here, but the general explanations follow similar arguments. When the total pressure is increased to 10 atm the reaction order for methane increases slightly, but more noticeable is the stronger negative effect on the reaction orders of water and carbon dioxide.
As shown in Fig. 7, the average reaction rate is significantly enhanced with increasing total pressure in the first part of the monolith. The high reaction rate leads to a higher catalyst temperature, which has a positive feedback effect on the reaction rate. The higher reaction rate leads to steeper axial and radial methane concentration gradients in the monolith which can be understood from the effectiveness factors in Fig. 7. Steeper radial gradients inside the catalyst result in a less efficient use of the active sites furthest into the catalyst layer and hence lower effectiveness factors. The results illustrate the possibilities and constraints when an increased total pressure is available for a synthetic exhaust gas composition. The total pressure can, thus, be used as a design parameter to find new methane abatement systems for vehicle applications. Hence, if a Pd/Al2O3 monolith geometry with its desirable flow profile and low mass transport resistances is used for the complete methane oxidation reaction, the conversion of methane can be enhanced by increasing the total pressure if the catalyst temperature is sufficiently high to maintain the necessary availability of free PdO site pairs where the dissociative adsorption of methane occurs. The study also illustrates that a low temperature active methane oxidation catalyst should be resistant to water and carbon dioxide adsorption, in agreement with previous studies.27,44,45
The three scenarios shown in section 3.4 demonstrate one way on how this multiscale model can be used to optimise a complex reaction network coupled to mass and heat transport dependencies. Fig. 8 shows that in the first scenario the effect of concentrating the palladium loading to the first part of the monolith (70% of the palladium is distributed into the first 30% of the monolith) only has a minor negative effect on methane conversion. The explanation is found to be an increased mass transport resistance in the palladium dense part of the monolith, due to a higher reaction rate. The increased transport resistance allows more uncombusted methane to slip through into the second part of the monolith with the lower palladium loading. However, the overall effect on methane conversion is low since mass transport has a low impact on the complete methane oxidation reaction under the stated reaction conditions and reactor geometry, see the ESI.† In the second scenario, where the catalyst thickness is reduced and the monolith length is doubled, the methane conversion increases due to a lower impact of mass transport along the entire monolith. This is only observed at higher temperatures since mass transport resistance is insignificant at low temperatures where the reaction rate is low. In the third scenario where the two previous scenarios are combined, a synergetic effect is observed because benefits of lowering the mass transport resistance by a thinner catalyst layer mean a more efficient use of the palladium and at the same time as the length of the palladium dense part of the monolith is made longer. The result is an increased methane conversion not only due to a higher effectiveness factor but also due to a faster temperature increase due to the exothermic heat.
5 Conclusions
A multiscale model based on first-principles surface kinetics shows that the catalyst performance, in terms of methane conversion through a monolith, can be enhanced by increasing the total pressure for a simulated exhaust gas composition from combustion of natural gas. The positive total pressure dependence requires a surface temperature exceeding 420 °C. Below this temperature, a negative total pressure dependence on the methane conversion is displayed. At temperatures of 420–450 °C the conversion exhibits a local maximum in total pressure. The different total pressure dependencies originate from the pressure effects on the coverage of hindering surface species. Bicarbonates, hydroxyl species and adsorbed water originating from gaseous carbon dioxide and water are abundant on the catalyst surface and must desorb or decompose through surface reactions. Otherwise the surface bicarbonates, hydroxyl species and adsorbed water block the active PdO site pairs where methane prefers to adsorb dissociatively. The hindering surface species are adsorbed on the S1(Pd) sites, according to the first-principle microkinetics, while methane prefers adsorption on free PdO site pairs. The latter is an unoccupied S1(Pd) site next to an unoccupied S2(O) site, which are reduced in numbers under low-temperature conditions where the hindering species are abundant on the catalyst surface. The total pressure effects on mass and heat transport are small compared to its effects on surface kinetics. Axial and radial gradients are present at higher temperatures where the reaction rate inside the catalyst is high and the effectiveness factor is lower. Redistributing the palladium in an uneven manner while reducing the thickness of the catalyst layer is shown to exhibit a synergetic positive effect on methane conversion by a more efficient use of the palladium and catalyst dimensions, and more so at elevated pressures. We have shown here that the total pressure should also be regarded as a possible design parameter to find optimal catalyst geometries and washcoat thicknesses for complete methane oxidation.
Notations
|
A
c
| Cross sectional area of the catalyst (m2) |
|
A
cs
| Ratio of cross sectional area to catalyst volume (m2 m−3) |
|
A
s
| Ratio of external surface area to catalyst volume (m2 m−3) |
|
A
site
| Adsorption site area (Å2) |
|
a
| Ratio of external surface area to channel volume (m2 m−3) |
|
C
| Concentration (mole m−3) |
|
C
site
| Active site density (mole kg−1) |
|
C
p
| Bulk gas heat capacity (J mole−1 K−1) |
|
D
| Bulk diffusivity (m2 s−1) |
|
D
eff
| Effective diffusivity (m2 s−1) |
|
D
k
| Knudsen diffusivity (m2 s−1) |
| dh | Open channel diameter (m) |
|
E
a
| Activation energy (eV) |
|
F
| Molar flow rate (mole s−1) |
|
H
r
| Reaction enthalpy (J mole−1) |
|
h
| Planck's constant (J s) |
|
h
k
| Heat transport coefficient (W m−2 K−1) |
|
k
| Rate coefficient for surface reaction (Hz) |
|
k
ads
| Adsorption rate constant (s Pa−1) |
|
k
B
| Boltzmann constant (J K−1) |
|
k
c
| Mass transport coefficient (m s−1) |
|
L
wc
| Porous catalyst thickness (m) |
|
m
ads
| Mass of adsorbed molecule (kg) |
|
m
cat
| Mass of porous catalyst (kg) |
| Nua | Asymptotic Nusselt number |
|
P
| Pressure (Pa) |
| Pr | Prandlt number |
|
Q
| Partition function |
| Re | Reynolds number |
|
r
| Reaction rate/turnover frequency (Hz site−1) |
| Sc | Schmidt number |
|
S
00
| Sticking coefficient at zero coverage |
|
S
dyn
| Dynamic sticking coefficient |
| Sha | Asymptotic Sherwood number |
|
T
| Temperature (K) |
|
x
| Axial direction |
|
y
| Mole fraction |
|
z
| Radial direction |
Greek letters
|
ε
| Emissivity factor |
|
ε
p
| Porosity |
|
η
| Effectiveness factor |
| Θ | Coverage |
|
λ
| Thermal conductivity (W m−1 K−1) |
|
ν
| Stoichiometric coefficient |
|
ρ
| Density (kg m−3) |
|
σ
| Stefan–Boltzmann constant (W m−2 K−4) |
Subscripts
| cat | Catalyst |
| g | Gas |
| i | Component index |
| j | Elementary reaction index |
| k | Tank index |
| n | Catalyst layer index |
| R | Reactant state |
| r | Reaction |
| ref | Reference |
| s | Solid |
| TS | Transition state |
| tot | Total |
| wc | Washcoat |
Conflicts of interest
There are no conflicts to declare.
Acknowledgements
This work has been performed within the Competence Centre for Catalysis, which is hosted by Chalmers University of Technology and financially supported by the Swedish Energy Agency and the member companies AB Volvo, ECAPS AB, Johnson Matthey AB, Preem AB, Scania CV AB, Umicore Denmark ApS and Volvo Car Corporation AB. Additional support from the Swedish Research Council is acknowledged as well as computational resources at C3SE (Göteborg) via an SNIC grant.
References
-
BP, Statistical Review of World Energy, 2018 Search PubMed.
-
IEA, Natural Gas information: Overview, 2017 Search PubMed.
- M. Gambino, R. Cericola, P. Corbo and S. Iannaccone, J. Eng. Gas Turbines Power, 1993, 115, 747–749 CrossRef CAS.
- S. Achinas, V. Achinas and G. J. W. Euverink, Engineering, 2017, 3, 299–307 CrossRef.
- Q. Zhang, J. Hu and D.-J. Lee, Renewable Energy, 2016, 98, 108–119 CrossRef CAS.
-
U.S Department of Energy, Renewable Natural Gas (Biomethane) Production, https://www.afdc.energy.gov/fuels/natural_gas_renewable.html, Accessed on 2018-07-10 Search PubMed.
- H. Li, D. Mehmood, E. Thorin and Z. Yu, Energy Procedia, 2017, 105, 1172–1177 CrossRef CAS.
-
Environmental Protection Agency, Overview of Greenhouse Gases, https://www.epa.gov/ghgemissions/overview-greenhouse-gases, Accessed on 2018-07-10 Search PubMed.
- D. Ciuparu, M. R. Lyubovsky, E. Altman, L. D. Pfefferle and A. Datye, Catal. Rev.: Sci. Eng., 2002, 44, 593–649 CrossRef CAS.
- Z. Li and G. B. Hoflund, J. Nat. Gas Chem., 2003, 12, 153–160 CAS.
- P. Gélin and M. Primet, Appl. Catal., B, 2002, 39, 1–37 CrossRef.
- P. A. Carlsson, E. Fridell and M. Skoglundh, Catal. Lett., 2007, 115, 1–7 CrossRef CAS.
- N. M. Martin, M. Van den Bossche, A. Hellman, H. Grönbeck, C. Hakanoglu, J. Gustafson, S. Blomberg, N. Johansson, Z. Liu, S. Axnanda, J. F. Weaver and E. Lundgren, ACS Catal., 2014, 4, 3330–3334 CrossRef CAS.
- A. Hellman, A. Resta, N. M. Martin, J. Gustafson, A. Trinchero, P.-A. Carlsson, O. Balmes, R. Felici, R. van Rijn, J. W. M. Frenken, J. N. Andersen, E. Lundgren and H. Grönbeck, J. Phys. Chem. Lett., 2012, 3, 678–682 CrossRef CAS.
- A. Antony, A. Asthagiri and J. F. Weaver, J. Chem. Phys., 2013, 139, 104702 CrossRef PubMed.
- A. Trinchero, A. Hellman and H. Grönbeck, Phys. Status Solidi RRL, 2014, 8, 605–609 CrossRef CAS.
- C.-R. Florén, M. Van den Bossche, D. Creaser, H. Grönbeck, P.-A. Carlsson, H. Korpi and M. Skoglundh, Catal. Sci. Technol., 2018, 8, 508–520 RSC.
-
C. Ericson, B. Westerberg and I. Odenbrand, SAE World Congress & Exhibition, 2008 Search PubMed.
- D. Creaser, X. Karatzas, B. Lundberg, L. J. Pettersson and J. Dawody, Appl. Catal., A, 2011, 404, 129–140 CrossRef CAS.
- J. B. Anderson, Chem. Eng. Sci., 1963, 18, 147–148 CAS.
- M. M. Azis, H. Härelind and D. Creaser, Chem. Eng. J., 2013, 221, 382–397 CrossRef CAS.
- R. Hawthorne, AIChE Symp. Ser., 1974, 70, 428 Search PubMed.
- T. Enrico and F. Pio, AIChE J., 1992, 38, 201–210 CrossRef.
- E. N. Fuller, P. D. Schettler and J. C. Giddings, Ind. Eng. Chem. Res., 1966, 58, 18–27 CrossRef CAS.
- K. C. Metaxas and N. G. Papayannakos, Chem. Eng. J., 2008, 140, 352–357 CrossRef CAS.
- A. Şahin, E. Alp, D. Eserci and H. C. Cabbar, Chem. Eng. Commun., 2017, 204, 1129–1142 CrossRef.
- M. Van den Bossche and H. Grönbeck, J. Am. Chem. Soc., 2015, 137, 12035–12044 CrossRef PubMed.
- H. Abbott and I. Harrison, J. Catal., 2008, 254, 27–38 CrossRef CAS.
- M. G. Evans and M. Polanyi, Trans. Faraday Soc., 1935, 31, 875–894 RSC.
- H. Eyring, J. Chem. Phys., 1935, 3, 107–115 CrossRef CAS.
- C. T. Campbell, ACS Catal., 2017, 7, 2770–2779 CrossRef CAS.
- M. Jørgensen and H. Grönbeck, Catal. Sci. Technol., 2017, 7, 4034–4040 RSC.
- W. G. Pollard and R. D. Present, Phys. Rev., 1948, 73, 762–774 CrossRef CAS.
- V. Novák, F. Štěpánek, P. Kočí, M. Marek and M. Kubíček, Chem. Eng. Sci., 2010, 65, 2352–2360 CrossRef.
- V. Novák, P. Kočí, M. Marek, F. Štěpánek, P. Blanco-García and G. Jones, Catal. Today, 2012, 188, 62–69 CrossRef.
- V. Novák, P. Kočí, T. Gregor, J. S. Choi, F. Štěpánek and M. Marek, Catal. Today, 2013, 216, 142–149 CrossRef.
- P. Kočí, F. Štěpánek, M. Kubíček and M. Marek, Chem. Eng. Sci., 2007, 62, 5380–5385 CrossRef.
- P. Kočí, V. Novák, F. Štěpánek, M. Marek and M. Kubíček, Chem. Eng. Sci., 2010, 65, 412–419 CrossRef.
- M. Dudák, V. Novák, P. Kočí, M. Marek, P. Blanco-García and G. Jones, Appl. Catal., A, 2014, 150-151, 446–458 CrossRef.
- B. Lundberg, J. Sjöblom, Å Johansson, B. Westerberg and D. Creaser, Appl. Catal., A, 2016, 191, 116–129 CrossRef CAS.
- R. Monteiro, D. Zemlyanov, J. Storey and F. Ribeiro, J. Catal., 2001, 199, 291–301 CrossRef CAS.
- F. H. Ribeiro, M. Chow and R. A. Dalla Betta, J. Catal., 1994, 146, 537–544 CrossRef CAS.
- G. Zhu, J. Han, D. Y. Zemlyanov and F. H. Ribeiro, J. Chem. Phys., 2005, 109, 2331–2337 CrossRef CAS PubMed.
- R. Burch, F. Urbano and P. Loader, Appl. Catal., A, 1995, 123, 173–184 CrossRef CAS.
-
R. Gholami, M. Alyani and K. Smith, Deactivation of Pd Catalysts by Water during Low Temperature Methane Oxidation Relevant to Natural Gas Vehicle Converters, 2015, vol. 5, pp. 561–594 Search PubMed.
Footnote |
| † Electronic supplementary information (ESI) available: Knudsen diffusion affected conversion plots and evaluation of mass transport effects on the reaction rate of complete methane oxidation. See DOI: 10.1039/c8cy02461h |
|
| This journal is © The Royal Society of Chemistry 2019 |
 Open Access Article
 *a,
Per-Anders
Carlsson
 a,
Derek
Creaser
a,
Henrik
Grönbeck
b and
Magnus
Skoglundh
a,
Derek
Creaser
a,
Henrik
Grönbeck
b and
Magnus
Skoglundh
 a
a


![[thin space (1/6-em)]](https://www.rsc.org/images/entities/char_2009.gif) 000 h−1 was used for all simulations. The physical properties of the catalyst are taken as reported values of porous alumina. The palladium loading of the catalyst is set to 1 wt% with a palladium dispersion of 25%. The porous catalyst layer is 100 μm thick.
000 h−1 was used for all simulations. The physical properties of the catalyst are taken as reported values of porous alumina. The palladium loading of the catalyst is set to 1 wt% with a palladium dispersion of 25%. The porous catalyst layer is 100 μm thick.


