
 Open Access Article
 This Open Access Article is licensed under a
 Creative Commons Attribution 3.0 Unported Licence
In situ XAS study of the local structure and oxidation state evolution of palladium in a reduced graphene oxide supported Pd(II) carbene complex during an undirected C–H acetoxylation reaction†
Ning
Yuan‡
 *ab,
Maitham H.
Majeed‡
c,
Éva G.
Bajnóczi
a,
Axel R.
Persson
cd,
L. Reine
Wallenberg
cd,
A. Ken
Inge
b,
Niclas
Heidenreich
ef,
Norbert
Stock
e,
Xiaodong
Zou
b,
Ola F.
Wendt
*c and
Ingmar
Persson
*a
*ab,
Maitham H.
Majeed‡
c,
Éva G.
Bajnóczi
a,
Axel R.
Persson
cd,
L. Reine
Wallenberg
cd,
A. Ken
Inge
b,
Niclas
Heidenreich
ef,
Norbert
Stock
e,
Xiaodong
Zou
b,
Ola F.
Wendt
*c and
Ingmar
Persson
*a
aDepartment of Molecular Sciences, Swedish University of Agricultural Sciences, P.O. Box 7015, SE-750 07 Uppsala, Sweden. E-mail: ning.yuan@mmk.su.se; ingmar.persson@slu.se
bDepartment of Materials and Environmental Chemistry, Stockholm University, SE-106 91 Stockholm, Sweden
cCentre for Analysis and Synthesis, Department of Chemistry, Lund University, P.O. Box 124, SE-221 00 Lund, Sweden. E-mail: ola.wendt@chem.lu.se
dNational Center for High Resolution Electron Microscopy and NanoLund, Lund University, Box 124, SE-221 00 Lund, Sweden
eInstitut für Anorganische Chemie, Christian-Albrechts-Universität zu Kiel, DE-24118 Kiel, Germany
fDeutsches-Elektronen-Synchrotron DESY, DE-22607 Hamburg, Germany
First published on 25th March 2019
Abstract
In situ X-ray absorption spectroscopy (XAS) investigations have been performed to provide insights into the reaction mechanism of a palladium(II) catalyzed undirected C–H acetoxylation reaction in the presence of an oxidant. A Pd(II) N-heterocyclic carbene complex π-stacked onto reduced graphene oxide (rGO) was used as the catalyst. The Pd speciation during the catalytic process was examined by XAS, which revealed a possible mechanism over the course of the reaction. Pd(II) complexes in the as-synthesized catalyst first go through a gradual ligand substitution where chloride ions bound to Pd(II) are replaced by other ligands with a mean bond distance to Pd matching Pd–C/N/O. Parallel to this the mean oxidation state of Pd increases indicating the formation of Pd(IV) species. At a later stage, a fraction of the Pd complexes start to slowly transform into Pd nanoclusters. The mean average oxidation state of Pd decreases to the initial state at the end of the experiment which means that comparable amounts of Pd(0) and Pd(IV) are present. These observations from heterogeneous catalysis are in good agreement with its homogeneous analog and they support a Pd(II)–Pd(IV)–Pd(II) reaction mechanism.
Introduction
The formation of carbon–oxygen (C–O) bonds directly from carbon–hydrogen (C–H) bonds is an attractive synthetic pathway to many important organic compounds such as pharmaceuticals and agrochemicals.1,2 Such transformations are usually catalyzed by transition metals (TMs) and most examples include homogeneous catalysts, but heterogeneous TM catalysts are in demand, not only because these supported systems are recyclable and easy to separate from the reaction mixture, but also for their potential to introduce novel chemical reactivity.3–5 Reduced graphene oxide (rGO) was successfully applied as a supporting material for different types of transition metal N-heterocyclic carbene (TM–NHC) complexes and applied for many transformations including C–H acetoxylation.6–10 Recently, we developed an anthracene-tagged Pd(II)–NHC complex, 1, supported on rGO through π-stacking (here labeled 1@rGO) according to an adaptation of the procedure proposed by Peris and co-workers.8 The preparation procedure is depicted in Scheme 1.11 It was shown that 1@rGO works as an active heterogeneous catalyst in undirected C–H acetoxylation of benzene and its catalytic efficiency is slightly higher than its homogeneous analog.11 This, together with our previous work,4 shows that Pd(II)–NHC complexes are effective as supported catalysts for arene acetoxylation. Ex situ studies indicate that the catalyst is not reduced during catalysis but there is little information on the mechanism.4,11 It can be noted that there are also systems based on Pd(0) pre-catalysts but these were applied for directed C–H activation.3 | ||
| Scheme 1 Immobilization of 1 on rGO. | ||
Although a previous study by Tato et al. has shed light on our understanding of the reaction mechanism of C–H acetoxylation catalyzed by Pd(II)–NHC complexes,12 such efforts were limited to homogeneous reaction conditions due to the complexity of heterogeneous systems. Also, the oxidation state evolution during directed catalysis with Pd nanoparticles has been studied.13 However, there are few, if any, experimental studies on the nature and particularly oxidation state of the Pd catalytic species during undirected C–H activation. Many of the traditional techniques used for characterization of catalysts are either difficult to conduct under reaction conditions, such as X-ray photoelectron spectroscopy (XPS), or unable to probe the catalytic centres directly, such as Fourier-transform infrared (FTIR) spectroscopy.
To meet the demand of studying the catalytic species in a direct manner on atomic level, X-ray absorption spectroscopy (XAS) has become a suitable experimental approach, as it is element specific with high sensitivity to local structure and valence state of the absorbing element.14 XAS can be applied on all states of aggregation as well as their mixtures, and only millimolar concentrations are required for successful structure analysis around the absorbing atom. Furthermore, a scanning rate of minutes allows in situ XAS measurements to be conducted under various chemical conditions.15–17 In the recent years of in situ XAS research on catalysis, major efforts have been focused on solid–gas heterogeneous catalytic systems due to the manageable design and construction of in situ reactors.18–23 For solid–liquid heterogeneous reactions or liquid homogeneous reactions, it becomes more challenging to build a suitable sample cell because of more demanding reaction conditions and interference from the reaction mixture. The growing interest in in situ XAS measurements on solid–liquid and solution phase reactions has promoted the development of the reactors.24,25 With improved control of the chemical conditions several successful examples have been reported.26–29 These studies have proven that in situ XAS is a powerful tool to study the catalytic species in solution and solution–solid reaction mixtures.
In the current study we aim to elucidate the palladium species and their oxidation states over the course of the undirected C–H acetoxylation of benzene catalyzed by 1@rGO using in situ XAS spectroscopy and gain insights into the reaction mechanism. The focus is on the heterogeneous system and the homogeneous analog is used for comparison.
Experimental section
Materials
1@rGO (2.5 wt% Pd loading) and 1 were used as catalysts and synthesized according to procedures reported previously.8,11 All reagents and solvents used in the experiments were purchased from commercial suppliers without further purification.Catalytic reactions for in situ XAS experiments
Benzene (1.75 g, 22.44 mmol, 21.77 equiv.), (diacetoxyiodo)benzene (oxidant, 0.33 g, 1.03 mmol, 1 equiv.), 1@rGO (0.10 g, 2.3 mol% with respect to the oxidant) and 1 (0.07 g, 9.2 mol% with respect to the oxidant), glacial acetic acid (1.50 mL), and acetic anhydride (0.17 mL) were transferred into a reaction vessel which was sealed in the preparation room and transported immediately to the hutch for measurements. The reaction mixture was stirred at 92 °C during the in situ XAS measurements.Reactor for in situ experiments
In situ XAS data were collected using a custom-made reactor designed for investigations under solvothermal conditions.24 The remotely controlled reactor was used to heat and stir the reaction mixture in a sealed 5 mL glass vial with 1 mm thick walls, allowing the synchrotron radiation to penetrate the sample in transmission mode. The target temperature is typically achieved within two minutes, and a thermocouple was immersed into the reaction mixture to monitor the temperature throughout the experiment. Fig. S1 in Section S1† shows the exploded-view illustration of the reactor.XAS experiments
All XAS data were collected at beamline P64 at Petra III Extension, Deutsches Elektronen-Synchrotron (DESY), Hamburg, Germany. The XAS measurements were conducted in transmission mode at the Pd K-edge (24.349 keV) with an energy range from 24.00 to 25.15 keV for dry samples or 25.00 keV for in situ measurement.30 A palladium metal foil was measured simultaneously and its first inflection point on the absorption edge was used to individually calibrate all the XAS spectra during the measurements. As-synthesized 1@rGO, 1, and recycled 1@rGO were measured using a standard sample holder for powders. For the in situ measurements, each XAS scan was set to ca. 6 min with considerations of both time resolution and data quality. More technical details and data analysis are described in Section S1.†Results and discussion
The successful preparation of 1@rGO is confirmed by both X-ray absorption near edge structure (XANES) and extended X-ray absorption fine structure (EXAFS) spectra of the as-synthesized 1 and 1@rGO (Fig. S2-a in Section S2 and Fig. S3 in Section S3†). The structure of 1 was described in a previous work. Each Pd binds two chloride ions (Cl−), one carbene and one pyridine ligand. The oxidation state of Pd was determined to +II.11 This information is consistent with the analysis of the XANES spectra of 1 and its structure determined by EXAFS (Table 1). The XANES and EXAFS spectra of 1@rGO are similar to those of 1 indicating a successful immobilization of 1 onto rGO. EXAFS refinement of 1@rGO reveals one Pd–C bond with a length of 1.95 Å which corresponds to the bond between Pd and the NHC ligand. Another bond distance to Pd with a relatively large error, 0.08 Å, is observed at 2.18 Å. This bond length is close to the distance between Pd and pyridine ligand in 1. However, our previous results based on XPS show that the pyridine ligand dissociates from Pd and is stacked on the support.11 One possibility is that Pd atoms are pi-bound to a C![[double bond, length as m-dash]](https://www.rsc.org/images/entities/char_e001.gif) C double bond and 2.18 Å is a reasonable bond length in such configuration.31–33Scheme 1 describes the immobilization process based on our understanding.
C double bond and 2.18 Å is a reasonable bond length in such configuration.31–33Scheme 1 describes the immobilization process based on our understanding.
| Catalyst | d(Pd–N/C/O)a | N | σ 2 | d(Pd–Cl)a | N | σ 2 | d(Pd–Pd)a | N | σ 2 |
|---|---|---|---|---|---|---|---|---|---|
| a The standard deviations in parentheses were obtained from k3 weighted least-squares refinements of the EXAFS function χ(k) and do not include systematic errors of the measurement. b The estimated error of the N values is ca. 25%. The values were optimized from several trials and were fixed in each single refinement. | |||||||||
| As-synth. 1@rGO | 1.953(6) | 1.0 | 0.0017(7) | 2.293(9) | 2.0 | 0.0045(9) | — | — | — |
| 2.18(8) | 1.0 | 0.007(8) | |||||||
| 6 min (22, 80 min) | 2.013(6) | 3.0 | 0.009(1) | 2.320(6) | 1.0 | 0.007(2) | — | — | — |
| 3.5 h | 2.020(4) | 4.0 | 0.006(1) | — | — | — | 2.68(2) | 0.8 | 0.007(2) |
| 8 h (6 h) | 2.015(7) | 3.5 | 0.005(2) | — | — | — | 2.70(4) | 1.0 | 0.005(4) |
| Recycled (24 h) | 1.966(4) | 2.0 | 0.004(2) | — | — | — | 2.652(4) | 3.5 | 0.010(4) |
| As-synth. 1 | 1.95(1) | 1.0 | 0.003(2) | 2.301(6) | 2.0 | 0.0015(9) | — | — | — |
| 2.17(8) | 1.0 | 0.005(9) | |||||||
| 6 min | 2.00(1) | 2.5 | 0.009(1) | 2.293(8) | 1.5 | 0.0023(7) | — | — | — |
| 40 min | 2.017(7) | 3.0 | 0.003(1) | 2.29(3) | 1.0 | 0.003(1) | — | — | — |
| 78 min | 2.034(3) | 4.0 | 0.0036(2) | — | — | — | 2.65(2) | 0.5 | 0.005(1) |
| 5.5 h | 2.032(2) | 3.5 | 0.0043(4) | — | — | — | 2.709(7) | 1.0 | 0.010(1) |
| 33 h | 2.025(9) | 3.0 | 0.007(2) | — | — | — | 2.69(1) | 3.0 | 0.012(2) |
In the previous study, we have shown that 1@rGO is an effective catalyst in the acetoxylation of benzene and a few other arenes. The reaction conditions were optimized and used for the in situ XAS measurement as described in Scheme 2. Benzene was chosen as a model substrate with excess amount of oxidant PhI(OAc)2.
 | ||
| Scheme 2 1@rGO catalyzed undirected C–H acetoxylation reaction of benzene for in situ measurement. | ||
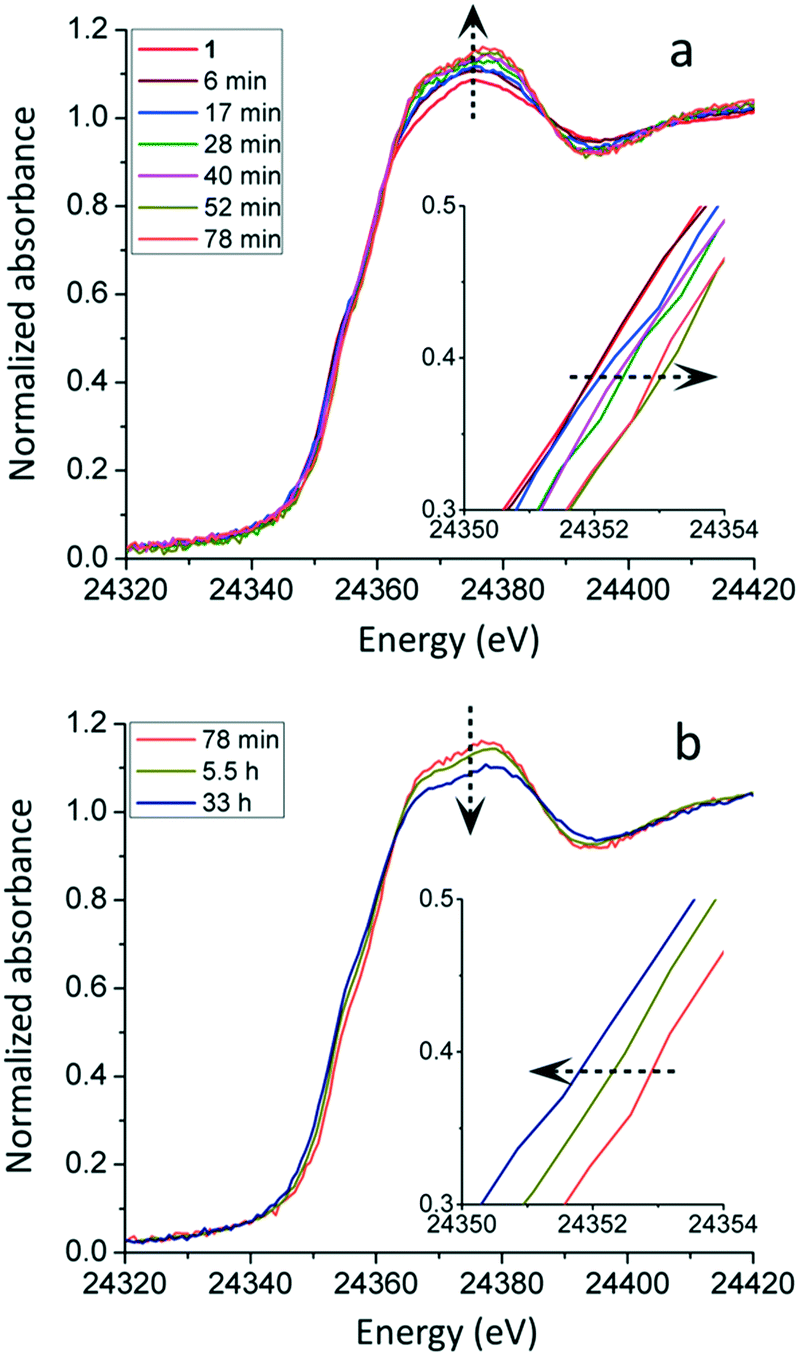
1@rGO was added to the reaction mixture and the XAS data collection started when the reaction was initiated with a time resolution of ca. 6 min. Due to the low concentration of Pd (ca. 7 mM) and low signal/noise (S/N) ratio, groups of XAS spectra with identical features were averaged to improve the statistics. Fig. 1 displays the selected Pd K-edge XANES spectra during the in situ measurement which is divided into two parts. The first part of the measurement is from the beginning of the reaction to ca. 80 min as presented in Fig. 1a. The main changes of the XANES spectra captured here are the increased white line intensity, especially during the first six minutes of the reaction, and a continuous shift of edge position towards higher energies. The increase in white line intensity has been proposed to be caused by an increase in the oxidation state of palladium in molecular complexes.34,35 Regarding the edge shift observation, theoretically, it can be caused either by a partial oxidation of Pd(II) to Pd(IV), or a change of bound ligands from covalently bound to more electrostatically bound ones. In this system the only strong electron-pair donor to Pd in 1@rGO is the NHC ligand and the Pd–NHC bond is very stable with a calculated bond energy of 45–50 kcal mol−1.36 Therefore, it is expected to remain bound to Pd during the reaction. Furthermore, the 1@rGO catalyst showed good recyclability and could be reused up to four runs with only slight decrease in the activity which attests to the stable Pd–C(NHC) bond. Hence, a partial oxidation of Pd(II) complexes seems to take place by the shift towards higher energy, together with the increased white line intensity. Even though the edge shift is small, ca. 1 eV, and corresponds to a mean oxidation state change less than one, it is clearly observable. However, XAS spectra display a mean value of the radiated absorbing species, and a shift of ca. 1 eV, ca. 25% of an expected shift between Pd(II) and Pd(IV), implies a reasonable scenario where a minor fraction of the Pd(II) complexes have been oxidized to Pd(IV), considering the relatively short lifetime of Pd(IV) in the catalytic redox cycle. The argument to propose Pd(IV) instead of Pd(III) is that no back Fourier transformed EXAFS spectra indicating Pd---Pd dimers with short Pd---Pd bonds were observed; the common form of Pd(III) species is dimers.37,38 Interestingly, the first in situ XANES spectrum displayed changes in comparison to as-synthesized 1@rGO, and thereafter the observed changes slow down significantly. This implies a process of pre-catalyst activation in the beginning of the reaction which has been realized as an important procedure for the catalyst which will be further discussed in the EXAFS analysis.29,39
 | ||
| Fig. 1 In situ Pd K-edge XANES spectra of 1@rGO catalyzed C–H acetoxylation reaction. (a) First part of measurement when edge position shifts towards higher energy. (b) Second part of measurement when edge position shifts towards lower energy. The edge shifts are magnified as inset. | ||
Selected XANES spectra of the second part of the in situ measurement, 80 min–24 h, are given in Fig. 1b. As the measurement proceeds, the edge position shifts backward to lower energies. The shift continues until the end of the measurement at 24 h. The XANES spectrum of the recycled 1@rGO has an edge position and shape after the edge identical to the catalyst at 24 h. This indicates that the evolution of the Pd species ceases after 24 h, and that the recycling procedure does not introduce further changes of the Pd species. It is noted that the edge position of Pd at the end of the measurement returns to a position very close to the one of as-synthesized 1@rGO (Fig. 1 and Fig. S2-b in Section S2†). This means that the mean oxidation state of Pd at the end of the measurement is +II. Meanwhile, the white line intensity has a general trend of declining even though the S/N ratio is low. The shape of the absorption edge appears to more resemble that of metallic Pd even though it is damped due to the small fraction.
These observations indicate that the mean oxidation state of the Pd species changes in the opposite direction in the second part as compared to the first one, and that the Pd(IV) species is mostly reduced to Pd(II) and to a small extent to Pd(0) as the reaction proceeds to the end. Interestingly, a small fraction of Pd(IV) species should remain considering the mean oxidation state of +II. Kim and co-workers have shown the co-existence of Pd(0), Pd(II) and Pd(IV) species by oxidizing Pd nanoparticles at controlled conditions where Pd(IV) formed polymeric species with enhanced stability.13 Although such Pd(IV) signals are not observed in the EXAFS of our material, it can be attributed to its low content.
The specific coordination environment of the Pd species in 1@rGO during the reaction was also studied by EXAFS and the Fourier transformed spectra are presented in Fig. 2a. The k range of all the EXAFS spectra is 2–9 Å−1 for easier comparison of the data at different reaction stages. The EXAFS spectra in full treatable range and their refinements are reported in Table 1 and Fig. S4 in Section S3.† From the as-synthesized 1@rGO to 6 min an obvious shift of the main peak towards shorter distance is observed indicating a change in the coordination environment of Pd, Fig. 2a. The refinement of the EXAFS spectrum of the catalyst at 6 min shows that on average each Pd centre is bound to three L ligands (L ligands: C, N and/or O ligands) at a mean distance of ca. 2.01 Å and one Cl− ligand at ca. 2.32 Å. Because of the average nature of EXAFS the refinement parameters can be also interpreted as half of the palladium centres have four coordinated L ligands and no Cl− ligands, while the other half retain the coordination structure of the as-synthesized catalyst. However, the second scenario does not seem reasonable considering the local structural change of Pd slows down immediately after 6 min and certain transformations should be completed. As the changes of the XANES spectra after 6 min in Fig. 1a are less pronounced, the differences of EXAFS spectra from 6 to 80 min are also very small and cannot be resolved by refinements at the current resolution. This implies that the local structure of the palladium centre remains the same after activation while a fraction of them have been further oxidized and bound to ligands with a Pd–L bond length of ca. 2.0 Å.
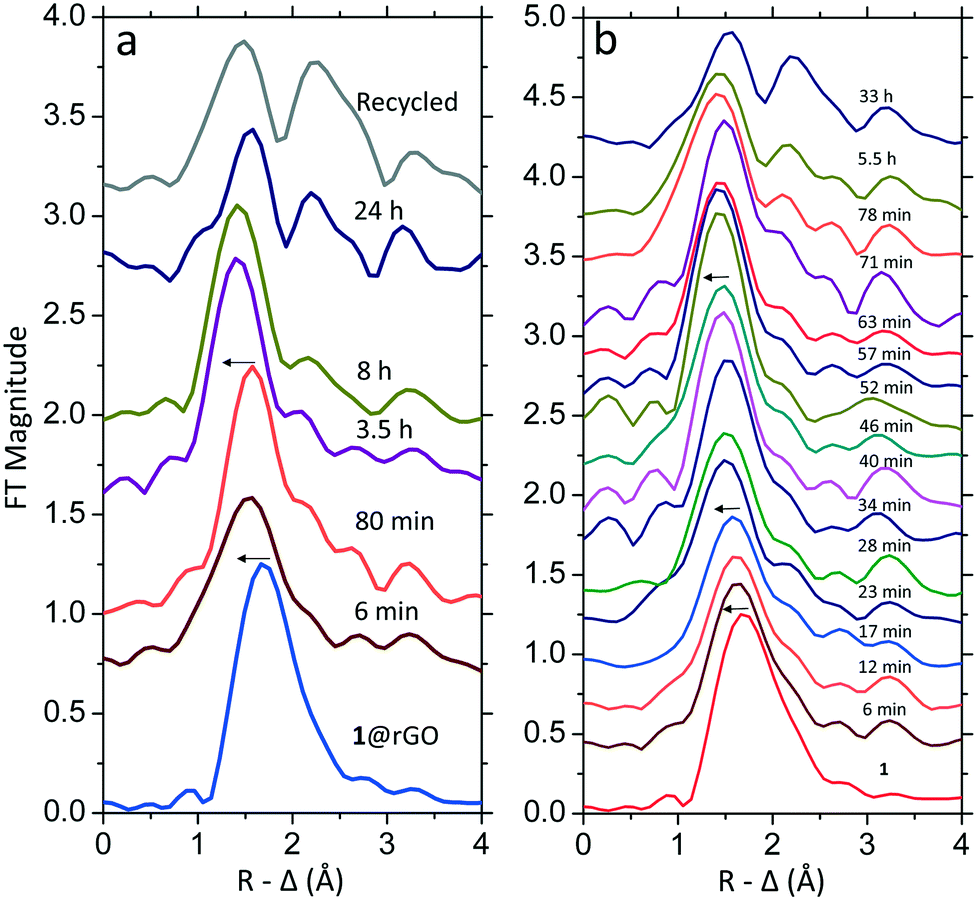 | ||
| Fig. 2 Fourier transformed k3-weighted EXAFS data as a function of measurement time showing the coordination environment of Pd in (a) 1@rGO and (b) 1. The spectra are not phase corrected and the k range used is fixed at 2–9 Å−1 for comparison. The arrows indicate the stepwise dissociation of Cl− ligands. | ||
Another change occurs from 80 min to 3.5 h where the main peak moves further towards shorter distances. The refinement reveals that the remaining Cl− is replaced by another L ligand resulting in Pd complexes with four L ligands after 3.5 h. At the same time, the introduction of a Pd–Pd bond distance of 2.7 Å corresponding to Pd nanoclusters with a mean coordination number of ca. 0.8 is necessary to achieve a proper fit of the EXAFS spectrum. This signal can be observed as the relatively small peak at ca. 2.3 Å (without phase correction) after the main peak. It strongly implies that a small fraction of the Pd complexes have been reduced to metallic Pd nanoclusters; this could be caused by a reductive elimination of ligands. Interestingly, the contribution of Pd–Pd bond distances is not rapidly growing between 6 and 8 hours, and the local environment of Pd seems to be stable. This observation is in contrast to a previously investigated system where the transformation of mononuclear Pd complexes to Pd nanoclusters was much faster.29 Although the local structure of the Pd appears to be the same during this process, the nature of the L ligands bound to Pd seems to change as the edge position shifts towards lower energies. At 24 h the peak at 2.7 Å (after phase correction) became more pronounced indicating an increased amount of metallic Pd nanoclusters. Meanwhile, the first main peak shifts towards longer distance at 24 h. It is known that the Pd–Pd bond has a satellite peak with similar appearance as a Pd–Cl bond and it becomes more pronounced when the applied k range is shortened.29 Due to limited EXAFS data quality for the catalyst at 24 h, the satellite peak of Pd–Pd bond distances and the Pd–L peak merge causing the abnormal peak position. The spectrum of the recycled catalyst is similar to the one at 24 h and a small amount of Pd nanoclusters were observed, while the remaining palladium is in the form of Pd(II) complexes with a small amount of Pd(IV) complexes. The Pd species in the recycled 1@rGO are further proven by transmission electron microscopy (TEM) and X-ray energy dispersive spectroscopy (EDS) showing the presence of Pd well dispersed over the whole observing area of the catalyst, including Pd aggregates (Section S4†). The oxidant is thermally degraded over time which means that towards the end of the reaction there is no or little oxidant left.4 In the absence of oxidant Pd may be reduced which could lead to the formation of metallic Pd nanoclusters although these were not observed in the previous ex situ investigation.11
Previously, it was also found that 1@rGO mostly retained its activity for at least four runs in the un-directed acetoxylation of benzene. However, the GC yield of acetoxybenzene showed a slow decreasing trend from 50% (first cycle) to 46% (fourth cycle). The solutions separated from the catalyst after each cycle contained less than 0.011 ppm Pd.11 Since there is little Pd leaching, we propose that the slight decrease of productivity using recovered catalyst could be related to the formation of Pd nanoclusters which should be an inactive species under the current reaction conditions. Although the oxidant is in excess in the in situ measurement, its relative amount is lower than in the reported catalysis conditions, meaning that the formation of Pd nanoclusters in this work is expected to be more extensive.
The homogeneous analog of 1@rGO was also investigated to compare with the observations and conclusions from 1@rGO. 1 was used as catalyst and the in situ experiment was repeated under the same condition as for 1@rGO except that the concentration of Pd in the homogeneous reaction mixture was increased to ca. 35 mM to improve the absorbance and the S/N ratio of the individual in situ XAS scans. Fig. 3 shows selected Pd K-edge XANES spectra of 1 during the reaction. The same strategy as for 1@rGO was used where the measurement is divided into two parts. The first part is from the beginning of the reaction to 78 min. It is noted that the white line intensity increases continuously until 52 min, while the edge position is shifting towards higher energy, a shift that also ceases at 52 min. There is no additional change from 52 to 78 min. From 78 min to 33 h after the start of the reaction, the white line intensity and the edge position return to the starting point. These observations are in good agreement with the observations using 1@rGO. The oxidation state of Pd in 1 also increases at first, followed by a decrease at the later stage of the measurement.
 | ||
| Fig. 3 In situ Pd K-edge XANES spectra of 1 catalyzed C–H acetoxylation reaction. (a) First part of measurement when edge position shifts towards higher energy. (b) Second part of measurement when edge position shifts towards lower energy. The edge shifts are magnified as insets. | ||
The corresponding EXAFS spectra of 1 catalyzed reaction were analyzed as well, and their Fourier transformed spectra are displayed in Fig. 2b. The k range used for 1 and 1@rGO is the same for proper comparison. Due to the better S/N ratio each individual in situ scan could be analyzed and they are presented as function of reaction time. In general, the change in local structure around Pd in 1 is the same as in 1@rGO. The first main peak gradually shifts towards shorter bond lengths corresponding to a stepwise dissociation of Cl− ligands, after which the peak corresponding to Pd–Pd single scattering appears and grows at a later stage of the measurement indicating the formation of metallic Pd nanoclusters. It is also noted that the intensity of the white line in Fig. 3a increases more smoothly than in the case of 1@rGO. This might be a consequence of the higher Pd concentration in the 1 catalyzed reaction. However, the earlier catalysis study showed that 1@rGO lead to higher yield of acetoxybenzene compared to 1 and this observation might also be correlated to the slower activation rate of 1 in the beginning of the reaction.11 The results of the refinements of the EXAFS spectra are summarized in Table 1, and the fits are shown in Fig. S5 in Section S3.† A small amount of Pd nanoclusters were observed at the end of the measurement. As outlined above this fraction is probably higher in the in situ measurements than in the actual catalysis because of the higher mol% of the catalyst with respect to the oxidant loading in the former.
To further improve the understanding of the activation of the pre-catalyst, the XAS spectrum of 1 in the reaction mixture at room temperature was collected and it is identical to the as-synthesized 1. This demonstrates that the induced heat triggers the exchange of the ligands bound to Pd leading to the activation of the catalyst.
Conclusions
In conclusion, we have used in situ XAS to probe the speciation and the mean oxidation state of palladium over the course of an undirected C–H acetoxylation reaction. The heterogeneous catalyst 1@rGO and its homogeneous analog 1 were examined. In both cases, a stepwise exchange of Cl− ions by L ligands (L: carbon, nitrogen and/or oxygen) is observed. Meanwhile a small fraction of Pd(II) is oxidized to Pd(IV). At a later stage of the reaction, when less or no oxidant (PhI(OAc)2) remains, Pd(0) nanoclusters are slowly formed resulting in a relatively stable mixture of mononuclear Pd complexes and Pd metal nano-sized aggregates. During this process the mean oxidation state of Pd returns to the starting state resulting in a mixture dominated by the Pd(II) species, and smaller amounts of Pd(0) nanoclusters and Pd(IV) species. Overall, our observations provide evidence for a mechanism including oxidation state changes Pd(II)–Pd(IV)–Pd(II) during the undirected C–H acetoxylation reaction as proposed through computational methods.40,41Conflicts of interest
There are no conflicts to declare.Acknowledgements
This work has been supported by the MATsynCELL project through Röntgen-Ångström Cluster, the Swedish Research Council (VR, project no. 2013-580) and the German Federal Ministry of Education and Research (BMBF). We are also thankful to the Berzelii Center EXSELENT on Porous Materials, the Swedish Research Council (VR, project no. 2017-0432) and the Project Management Organization at DESY (Deutsches Elektronen-Synchrotron). The allocation of beamtime at P64, Petra III Extension, DESY is gratefully acknowledged. We thank the staff at beamline P64, particularly Dr. Vadim Murzin and Dr. Wolfgang Caliebe for the assistance during the data collection.Notes and references
- G. Dyker, Handbook of C-H transformations, Wiley-VCH, Weinheim, 2005 Search PubMed.
- J.-Q. Yu and Z. Shi, C-H Activation, Springer, Berlin, 2010 Search PubMed.
- V. Pascanu, F. Carson, M. V. Solano, J. Su, X. Zou, M. J. Johansson and B. Martín-Matute, Chem. – Eur. J., 2016, 22, 3729–3737 CrossRef PubMed.
- M. H. Majeed, P. Shayesteh, L. R. Wallenberg, A. R. Persson, N. Johansson, L. Ye, J. Schnadt and O. F. Wendt, Chem. – Eur. J., 2017, 23, 8457–8465 CrossRef CAS PubMed.
- E. Pérez-Mayoral, V. Calvino-Casilda and E. Soriano, Catal. Sci. Technol., 2016, 6, 1265–1291 RSC.
- D. Ventura-Espinosa, A. Carretero-Cerdán, M. Baya, H. García and J. A. Mata, Chem. – Eur. J., 2017, 23, 10815–10821 CrossRef CAS PubMed.
- S. Sabater, J. A. Mata and E. Peris, Organometallics, 2015, 34, 1186–1190 CrossRef CAS.
- S. Sabater, J. A. Mata and E. Peris, ACS Catal., 2014, 4, 2038–2047 CrossRef CAS.
- S. Ruiz-Botella and E. Peris, Organometallics, 2014, 33, 5509–5516 CrossRef CAS.
- S. Gonell and E. Peris, ACS Catal., 2014, 4, 2811–2817 CrossRef CAS.
- M. H. Majeed, P. Shayesteh, A. R. Persson, L. R. Wallenberg, J. Schnadt and O. F. Wendt, Eur. J. Inorg. Chem., 2018, 4742–4746 CrossRef CAS.
- F. Tato, A. García-Domínguez and D. J. Cárdenas, Organometallics, 2013, 32, 7487–7494 CrossRef CAS.
- K. Kim, Y. Jung, S. Lee, M. Kim, D. Shin, H. Byun, S. J. Cho, H. Song and H. Kim, Angew. Chem., Int. Ed., 2017, 56, 6952–6956 CrossRef CAS PubMed.
- L. Liu and A. Corma, Chem. Rev., 2018, 118, 4981–5079 CrossRef CAS PubMed.
- J. Singh, C. Lamberti and J. A. Van Bokhoven, Chem. Soc. Rev., 2010, 39, 4754–4766 RSC.
- S. Bordiga, E. Groppo, G. Agostini, J. A. van Bokhoven and C. Lamberti, Chem. Rev., 2013, 113, 1736–1850 CrossRef CAS PubMed.
- S. Bordiga, F. Bonino, K. P. Lillerud and C. Lamberti, Chem. Soc. Rev., 2010, 39, 4885–4927 RSC.
- S. K. Matam, M. H. Aguirre, A. Weidenkaff and D. Ferri, J. Phys. Chem. C, 2010, 114, 9439–9443 CrossRef CAS.
- W. van Beek, O. V. Safonova, G. Wiker and H. Emerich, Phase Transitions, 2011, 84, 726–732 CrossRef CAS.
- J.-D. Grunwaldt and B. S. Clausen, Top. Catal., 2002, 18, 37–43 CrossRef CAS.
- S. Øien, G. Agostini, S. Svelle, E. Borfecchia, K. A. Lomachenko, L. Mino, E. Gallo, S. Bordiga, U. Olsbye, K. P. Lillerud and C. Lamberti, Chem. Mater., 2015, 27, 1042–1056 CrossRef.
- J.-D. Grunwaldt, M. Caravati, S. Hannemann and A. Baiker, Phys. Chem. Chem. Phys., 2004, 6, 3037–3047 RSC.
- C. Barzan, A. Piovano, L. Braglia, G. A. Martino, C. Lamberti, S. Bordiga and E. Groppo, J. Am. Chem. Soc., 2017, 139, 17064–17073 CrossRef CAS PubMed.
- N. Heidenreich, U. Rütt, M. Köppen, A. K. Inge, S. Beier, A.-C. Dippel, R. Suren and N. Stock, Rev. Sci. Instrum., 2017, 88, 104102 CrossRef CAS PubMed.
- J.-D. Grunwaldt, M. Ramin, M. Rohr, A. Michailovski, G. R. Patzke and A. Baiker, Rev. Sci. Instrum., 2005, 76, 054104 CrossRef.
- S. G. Fiddy, J. Evans, T. Neisius, M. A. Newton, N. Tsoureas, A. A. D. Tulloch and A. A. Danopoulos, Chem. – Eur. J., 2007, 13, 3652–3659 CrossRef CAS PubMed.
- P. J. Ellis, I. J. S. Fairlamb, S. F. J. Hackett, K. Wilson and A. F. Lee, Angew. Chem., Int. Ed., 2010, 49, 1820–1824 CrossRef CAS PubMed.
- S. Reimann, J. Stötzel, R. Frahm, W. Kleist, J.-D. Grunwaldt and A. Baiker, J. Am. Chem. Soc., 2011, 133, 3921–3930 CrossRef CAS PubMed.
- N. Yuan, V. Pascanu, Z. Huang, A. Valiente, N. Heidenreich, S. Leubner, A. K. Inge, J. Gaar, N. Stock, I. Persson, B. Martín-Matute and X. Zou, J. Am. Chem. Soc., 2018, 140, 8206–8217 CrossRef CAS PubMed.
- G. N. George and I. J. Pickering, EXAFSPAK – A Suite of Computer Programs for Analysis of X-ray Absorption Spectra, SSRL, Stanford, CA, 1993 Search PubMed.
- K. T. Horak, S. Lin, J. Rittle and T. Agapie, Organometallics, 2015, 34, 4429–4432 CrossRef CAS.
- S. Suseno and T. Agapie, Organometallics, 2013, 32, 3161–3164 CrossRef CAS PubMed.
- T. Murahashi, M. Fujimoto, M.-A. Oka, Y. Hashimoto, T. Uemura, Y. Tatsumi, Y. Nakao, A. Ikeda, S. Sakaki and H. Kurosawa, Science, 2006, 313, 1104–1107 CrossRef CAS PubMed.
- S. H. Eitel, M. Bauer, D. Schweinfurth, N. Deibel, B. Sarkar, H. Kelm, H.-J. Krüger, W. Frey and R. Peters, J. Am. Chem. Soc., 2012, 134, 4683–4693 CrossRef CAS PubMed.
- G. Guilera, M. A. Newton, C. Polli, S. Pascarelli, M. Guinó and K. K. Hii, Chem. Commun., 2006, 4306–4308 RSC.
- R. Jagadeesan, G. Velmurugan and P. Venuvanalingam, RSC Adv., 2015, 5, 80661–80667 RSC.
- T. W. Lyons and M. S. Sanford, Chem. Rev., 2010, 110, 1147–1169 CrossRef CAS PubMed.
- D. C. Powers and T. Ritter, Nat. Chem., 2009, 1, 419–419 CrossRef CAS.
- M. C. Warner and J.-E. Bäckvall, Acc. Chem. Res., 2013, 46, 2545–2555 CrossRef CAS PubMed.
- Y. Dang, S. Qu, J. W. Nelson, H. D. Pham, Z.-X. Wang and X. Wang, J. Am. Chem. Soc., 2015, 137, 2006–2014 CrossRef CAS PubMed.
- W. Liu, J. Zheng, Z. Liu, W. Hu, X. Wang and Y. Dang, ACS Catal., 2018, 8, 7698–7709 CrossRef CAS.
Footnotes |
| † Electronic supplementary information (ESI) available: Details about XAS data collection and analysis, XANES spectra of the complex under study, free and bound to rGO, and EXAFS data treatment of data collected in in situ mode. See DOI: 10.1039/c8cy02430h |
| ‡ These authors contributed equally to this work. |
| This journal is © The Royal Society of Chemistry 2019 |