
Eosin Y-sensitized partially oxidized Ti3C2 MXene for photocatalytic hydrogen evolution†
Yuliang
Sun
a,
Yuan
Sun
a,
Xing
Meng
ac,
Yu
Gao
a,
Yohan
Dall'Agnese
a,
Gang
Chen
ab,
Chunxiang
Dall'Agnese
 a and
Xiao-Feng
Wang
*a
a and
Xiao-Feng
Wang
*a
aKey Laboratory of Physics and Technology for Advanced Batteries (Ministry of Education), College of Physics, Jilin University, Changchun 130012, PR China. E-mail: xf_wang@jlu.edu.cn
bState Key Laboratory of Superhard Materials, Jilin University, Changchun 130012, PR China
cA. J. Drexel Nanomaterials Institute and Department of Materials Science and Engineering, Drexel University, Philadelphia, Pennsylvania 19104, USA
First published on 23rd November 2018
Abstract
Ti3C2, though one of the most extensively studied 2D MXenes, is rarely reported in dye-sensitized photocatalysis. Platinum is commonly used as a co-catalyst in photocatalytic hydrogen evolution but it increases the cost and hence restricts the commercialization of this technology. Eosin Y (EY) is widely studied in dye-sensitized systems as it is not only low-cost and easily commercially available, but also exhibits excellent visible light absorption ability. Herein, we oxidized Ti3C2 MXene in water at 60 °C for different times, to form TiO2/Ti3C2 on amorphous carbon (AC) composites. The oxidized MXene was used as a photocatalyst in a dye-sensitized system for hydrogen evolution to replace noble metal co-catalysts such as Pt. The highest hydrogen production rate of 33.4 μmol h−1 g−1 was achieved by the TiO2/Ti3C2@AC-48h composite with the sensitization of 1 mM EY, which was 110 times higher than that of oxidized Ti3C2 without EY. This work shows the potential of 2D MXenes used in dye-sensitized photocatalysis for hydrogen evolution.
Introduction
Energy shortage is becoming a serious problem in the near future as the global economy growth requires increasing consumption of energy, while natural fossil fuel resources are decreasing. Solar energy is clean and has the potential to fulfill the energy gap between the consumption and the traditional energy sources. Photocatalytic water splitting for hydrogen evolution is a potential way to meet the energy demand because of both the infinite incoming sunlight and water resources. Nevertheless, the conversion of solar energy into hydrogen by this catalytic process usually needs noble metal co-catalysts, such as Pt, Ru, Rh, and Pd, which increases the cost of produced hydrogen energy, limiting the large scale commercialization.1The newly discovered 2D MXenes family with outstanding physicochemical properties has attracted great attention in various applications such as energy storage,2,3 water purification,4 electromagnetic interference shielding5 and catalysis.6–8 The general formula of MXenes is Mn+1XnTx (n = 1–3), where M represents an early transition metal such as Ti, V, Nb, Ta and Mo, X means carbon and/or nitrogen, and T is the surface termination group, e.g., –O, –F, and –OH.9,10 MXenes are produced by etching the MAX phase to remove the A element, i.e., Al and Si, using HF or similar chemicals.11,12 Ti3C2 is the most widely investigated MXene due to its outstanding properties, such as strong connection with other semiconductors and strong interaction with H2O molecules caused by its good hydrophilicity, high charge-carrier transfer ability induced by the excellent metallic conductivity, good redox reactivity originating from the terminal metal sites, and good stability in aqueous solutions. These distinguished features of Ti3C2 make it highly promising for use as a low-cost co-catalyst to replace Pt for hydrogen energy production. Hydrothermally synthesized TiO2/Ti3C2 nanocomposites facilitated the hydrogen evolution reaction (HER) with pure Ti3C2 as a co-catalyst.13 Similarly, hydrothermally synthesized TiO2/MXene composites with different mass ratios were reported for hydrogen evolution and TiO2/Nb2CTx (5 wt%) showed the best performance for the HER.14 Ti3C2Tx could be oxidized by heating at 1150 °C in air for 30 seconds15 and treating with H2O2 at room temperature16 and in flowing CO2 at 850 °C,17 where the resulting amorphous carbon with nanocrystalline TiO2 was used as a Li-ion battery anode. Oxidation of Ti3C2 was also used to prepare nanocrystalline TiO2 for dye-sensitized solar cells.18
The introduction of dye molecules with visible absorption into the HER can be a useful means to improve the yield of the HER, thanks to the enhancement of the light harvesting efficiency of the HER systems in which the photocatalysts are wide band gap semiconductors with poor light absorption.19 In brief, the dye is excited to generate excited electrons under light irradiation. The excited electrons are injected into the conduction band of the semiconductor and finally react with H+ at the active site of the co-catalyst.20 Semiconductor photocatalysts such as TiO2, ZnO, and g-C3N4 are usually used in dye-sensitized HER. Transition metal-based dyes exhibit high efficiency but are not suitable for commercial and industrial applications because of their high cost and toxicity, whereas organic dyes such as eosin Y (EY), rose bengal (RB), rhodamine B (RhB) and methylene blue (MB) attract much attention to sensitize photocatalysts. EY is one of the most often investigated dyes due to its simple structure and commercial availability. EY and RB co-sensitized 2D graphene/Pt for the HER was reported and the graphene sheets assisted the separation of the photogenerated electrons.21 Sb-doped SnO2 with different band gaps showed efficient HER under the sensitization of EY. The fast electron transfer from EY to Sb-doped SnO2 contributed to the high efficiency.22 EY sensitized g-C3N4/Pt/GO also showed increased charge separation efficiency.23 Interestingly, EY sensitized TiO2 was used for photoreduction of cadmium (Cd(II)) which is a toxic element.24
Herein, we synthesized TiO2/Ti3C2 on amorphous carbon (AC, TiO2/Ti3C2@AC) composites by in situ hydrothermal oxidation in the presence of H2O and O2. The EY-sensitized composites were used for the HER. EY was simply dissolved in water directly, which was different from the adsorption method. The results show that precious metal co-catalysts could be replaced by earth abundant elements, decreasing the cost of the HER technology. This work paves the way for the development of dye-sensitized photocatalytic water splitting for hydrogen production.
Experimental section
2.1 The synthesis of Ti3C2 and TiO2/Ti3C2@AC composites
Ti3C2 MXene was prepared by etching Ti3AlC2 (Forsman, 98%) as previously reported.25 Briefly, 1 g Ti3AlC2 was added to 10 mL HF (49%, Aladdin) in 5 minutes and the mixture was stirred at a rate of 200 rpm for 24 hours at 30 °C. The mixture was washed by centrifugation in deionized water until the pH reached ≈7. Then the Ti3C2 powder was dried in a vacuum oven at 60 °C overnight.To prepare the TiO2/Ti3C2@AC composites, 1 g Ti3C2 powder was dispersed in 100 mL deionized water and the mixture was kept stirring in air at 60 °C. Approximately 33 mL of the dispersion was collected after stirring for 24 h, 48 h, and 72 h, respectively. Each dispersion was centrifuged to collect the resulting powders, which were then dried in a vacuum oven at 60 °C overnight. The different composites were labeled TiO2/Ti3C2@AC-24h, TiO2/Ti3C2@AC-48h and TiO2/Ti3C2@AC-72h.
The EY-adsorbed sample was prepared as follows: 10 mg TiO2/Ti3C2@AC-48h was dispersed in 10 mL deionized water with an EY concentration of 1 mM, stirred at room temperature for 24 h, and then centrifuged and dried in a vacuum oven at 60 °C overnight.
Different EY concentrations (0.1, 0.5, 1, 2 and 5 mM) were used to optimize the hydrogen production activity of the TiO2/Ti3C2@AC-48h sample, and TiO2 P25 (Degussa) was used as a comparison under the optimal concentration of EY (1 mM).
2.2 Characterization
An X-ray diffractometer (XRD, Bruker, D8 Advance) was operated at 40 kV and 40 mA with Cu Kα radiation (λ = 0.15406 nm) to characterize the structure of Ti3C2 and the composites. The morphologies of the samples were observed by scanning electron microscopy (SEM, JSM-6700F) and high-resolution transmission electron microscopy (HRTEM, JEM-2200FS). Specific surface area was typically measured under the Brunauer–Emmett–Teller (BET) model based on N2 sorption (Kubo-X1000) with a pretreatment at 120 °C. Fourier transform infrared spectra (FTIR, Vertex 70, Bruker, Germany) were recorded in the range of 400 to 4000 cm−1. Raman spectroscopy (LabRAM HR evolution Raman spectrometer) was carried out with a 523 nm diode-pumped solid state laser. Thermogravimetric analysis (TGA, SDT Q600, TA, US) was conducted in the range of 20 °C to 900 °C in air with a heating rate of 10 °C min−1 in a corundum pot and the weight of the samples was between 10 mg and 15 mg. Photoluminescence emission spectra (PL, Shimadzu RF-5301) were measured at an excitation wavelength of 340 nm and the powder samples were tested directly. Ultraviolet-visible absorption spectra (Specord 210 plus, Analytikjena, Germany) were measured for the absorption of 1 μM EY water solution.2.3 Photo-electrochemical activity measurements
A 6 mL photoreactor and a cut-off filter (λ > 400 nm) were used to measure the photocatalytic hydrogen evolution under irradiation of a 350 W xenon lamp (AHD 350, ShenzhenAnhongda Opto Technology Co. Ltd., China). The samples were controlled to be 3 mg in 3 mL aqueous solution with 29 mg mL−1 ascorbic acid (AA) and different concentrations of EY. A magnetic bar was used to disperse the composites during 6 h measurement. Argon was bubbled to remove the O2 before the measurements. H2 was measured by gas chromatography (SP-3420A, Beifen-Ruili, China) using argon as the carrier gas. 3 mg TiO2 with 1% Pt (H2PtCl6) in 29 mg mL−1 AA aqueous solution was used to test the hydrogen production as a comparison with and without 1 mM EY.Electrochemical impedance spectroscopy (EIS) was performed using an electrochemical workstation (Bio – Logic SAS) over the range of 0.1 Hz to 100 kHz with an amplitude of 5 mV under the irradiation of the xenon lamp. A three-electrode configuration was used in 0.5 M Na2SO4, 11 mM AA and 0.1 mM EY aqueous electrolytes, with Ag/AgCl as the reference electrode and indium tin oxide coated glass (ITO) as the counter electrode. The working electrode was prepared by an electrodeposition method, adapted from a previous report.26 Briefly, 40 mg of the sample was dispersed in 100 mL acetone containing 20 mg dissolved I2, then a voltage of 10 V was set between two ITO electrodes for 10 min, and finally the depositional electrode was dried in an oven at 60 °C for 1 h. The ITO was washed in water and ethanol for 20 min, respectively.
Results and discussion
3.1 Characterization of the structures and morphology
Fig. 1 shows the XRD patterns and Raman spectra of the samples with different oxidation times. Obvious differences can be observed with the variation of the H2O/O2 treatment time in Fig. 1a. Compared with the Ti3AlC2 (Fig. S1†), the HF etched Ti3C2 shows a peak downshift to 2θ = 9° and the lack of a peak at 39°, demonstrating the successful removal of Al element from Ti3AlC2.25 During the H2O/O2 treatment at 60 °C, the titanium in Ti3C2 is oxidized into TiO2, as evidenced by the appearance of the strong TiO2 anatase peak at 2θ = 25°. The peak at 2θ = 9° nearly disappears with the increase of the oxidation time, because the TiO2 particles are generated on the surface of the layered material and the Ti3C2 crystal structure is destroyed.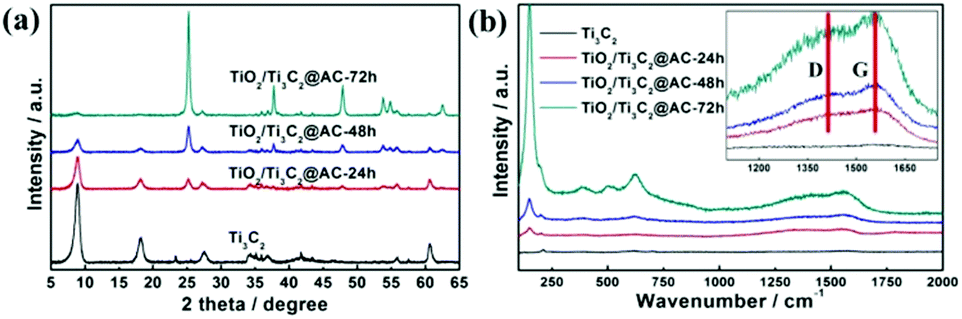 | ||
| Fig. 1 (a) The XRD patterns and (b) Raman spectra of Ti3C2, TiO2/Ti3C2@AC-24h, TiO2/Ti3C2@AC-48h and TiO2/Ti3C2@AC-72h. | ||
Fig. 1b shows the Raman spectra of the samples. The peaks at 143 cm−1 (Eg), 392 cm−1 (B1g), 512 cm−1 (A1g + B1g) and 633 cm−1 (Eg) present in the H2O/O2 treated samples are characteristic peaks of TiO2 (Fig. S2†), confirming the formation of anatase TiO2.15,27,28 The mass ratio of TiO2 increases with the oxidation time as evidenced by the increasing peak intensity of TiO2, which is consistent with the XRD results. The peaks at 1340 cm−1 and 1550 cm−1 are considered as the D- and G-bands of graphitic carbon.15,29–31 In our samples, the intensity ratios of the D- and G-bands, ID/IG, are about 0.9. The ratio does not significantly change with the increase of the oxidation time, thus the amorphous carbon structures such as the disorder and defects of the graphene plane are similar in all treated samples.32 The formation of amorphous carbon in the oxidized samples was further demonstrated by the peaks at 561 cm−1, 586 cm−1 and 651 cm−1 in the FT-IR spectra (Fig. S3†).
Fig. 2a–d show the SEM images of Ti3C2, TiO2/Ti3C2@AC-24h, TiO2/Ti3C2@AC-48h and TiO2/Ti3C2@AC-72h. The layered structure of Ti3C2 is clearly shown in Fig. 2a. With increasing time of H2O/O2 treatment, the amount of TiO2 particles increased, covering the layered Ti3C2 and amorphous carbon uniformly. This morphology was obtained because the orderly arranged Ti atoms in Ti3C2 were oxidized into TiO2 nanoparticles.
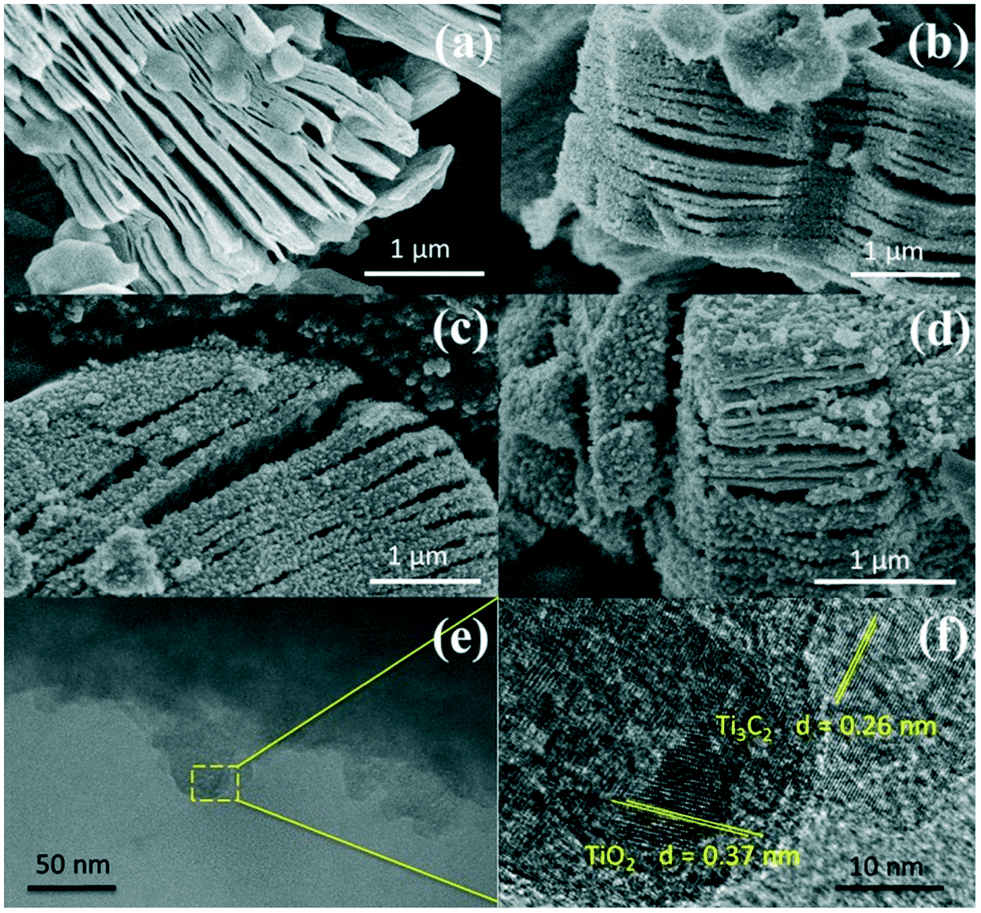 | ||
| Fig. 2 SEM images of (a) Ti3C2, (b) TiO2/Ti3C2@AC-24h, (c) TiO2/Ti3C2@AC-48h and (d) TiO2/Ti3C2@AC-72h. TEM (e) and HRTEM (f) images of TiO2/Ti3C2@AC-48h. | ||
Fig. 2e and f show the TEM images of the TiO2/Ti3C2@AC-48h sample. The layered structure of Ti3C2 along with the TiO2 nanoparticles can be observed. TiO2 and Ti3C2 are identifiable in the HRTEM image by their corresponding crystal plane distances, 0.37 nm and 0.26 nm, respectively.33,34
TGA of the samples were carried out in air from 20 °C to 900 °C and the data are displayed in Fig. 3. The mass ratios among Ti3C2, TiO2, and AC of the samples are listed in Table 1. The slight decrease before 200 °C in Fig. 3a is mainly caused by the removal of the adsorbed water and crystalline water and the change of surface termination groups in the samples.35 The weight increasing above 200 °C is considered the oxidation of Ti atoms and TiO2 formation. The TiO2/Ti3C2@AC-72h sample shows no increase of weight demonstrating the oxidation from Ti3C2 to TiO2, which is in accordance with the XRD patterns and Raman spectra. Table 1 shows consistent results that the oxidation degree of Ti3C2 is increased with the increase of H2O/O2 treatment time and the TiO2/Ti3C2@AC-72h sample is almost completely oxidized, which is in agreement with the XRD and Raman results. Interestingly, Ti3C2 shows the highest temperature of oxidation, 473 °C, as shown in Fig. 3b, demonstrating the better stability of Ti3C2 than partially oxidized Ti3C2. As the H2O/O2 treatment at 60 °C takes place, the titanium atoms will be soon oxidized into TiO2 at the most active flake edge of Ti3C2.36 TiO2/Ti3C2@AC-48h shows a higher oxidation temperature (370 °C) than TiO2/Ti3C2@AC-24h (298 °C). This is mainly because there is a longer distance for H2O and O2 to diffuse into the less active flake center of the TiO2/Ti3C2@AC-48h sample to oxidize the Ti atoms of Ti3C2, due to the more oxidized flake edge. The amorphous carbon of TiO2/Ti3C2@AC-72h was oxidized in the range of 250 °C to 900 °C, thus nearly no Ti3C2 phase can be observed. In addition, the specific surface areas (SSAs) of these samples were measured and presented in Table 2. The SSA values of pure Ti3C2 and partially oxidized samples increase with the oxidation time, because of the formation of TiO2 particles on amorphous carbon. It is interesting to see that the SSA value of TiO2/Ti3C2@AC-72h is decreased in comparison with those of the less oxidized samples, although it is the most oxidized. One possible reason is that the produced TiO2 filled the space between the Ti3C2 layers. Large SSA values enhance the amount of adsorbed dye molecules and increase the number of active sites for H2 production, thus enhancing the hydrogen production activity.
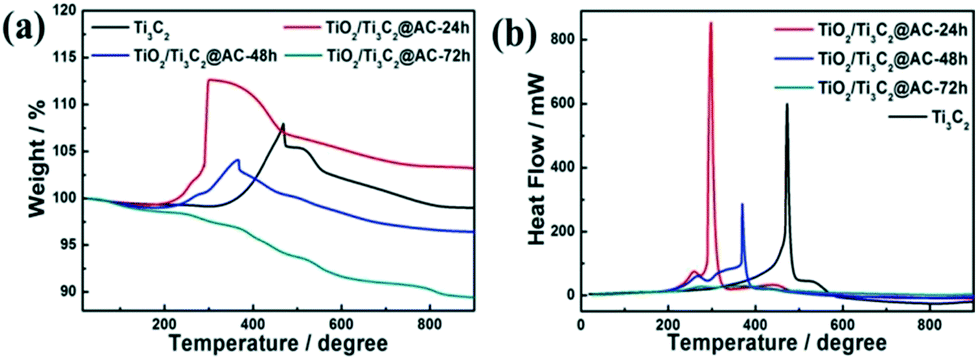 | ||
| Fig. 3 (a) The weight and (b) heat flow from TGA of Ti3C2, TiO2/Ti3C2@AC-24h, TiO2/Ti3C2@AC-48h and TiO2/Ti3C2@AC-72h. | ||
| Samples | Ti3C2 | TiO2 | C |
|---|---|---|---|
| Ti3C2 | 100 | 0 | 0 |
| TiO2/Ti3C2@AC-24h | 46.34 | 48.15 | 4.80 |
| TiO2/Ti3C2@AC-48h | 22.9 | 69.1 | 6.91 |
| TiO2/Ti3C2@AC-72h | 1.35 | 89.04 | 9.61 |
| Samples | SSA (m2 g−1) |
|---|---|
| Ti3C2 | 21 |
| TiO2/Ti3C2@AC-24h | 38 |
| TiO2/Ti3C2@AC-48h | 43 |
| TiO2/Ti3C2@AC-72h | 31 |
3.2 Photo-electrochemical performance
Fig. 4a shows the hydrogen production with and without EY (1 mM). Without the sensitization of EY, H2 is produced as low as 0.3 μmol h−1 g−1 by partially oxidized Ti3C2. When EY is used to sensitize the samples, the highest H2 production rate of 33.4 μmol h−1 g−1 is achieved based on the sample oxidized for 48 h, which is 110 times higher than the one without EY. This is mainly attributed to the ratio between TiO2 and Ti3C2. The excited EY transfers the photo-generated electrons to the TiO2 and then to the surface of Ti3C2, which enhances the charge separation of EY and thus increases the hydrogen production. The photocatalytic activity generally enhanced with the increase of SSA values. While in the TiO2/Ti3C2@AC-72h sample, when the amount of Ti3C2 is very low, the hydrogen production activity decreases. This could be partially explained by the low amount of adsorbed dye molecules and less active sites owing to its low SSA value, leading to inefficient charge transfer. One can also see that the photocatalytic activity of pure Ti3C2 sensitized with EY is better than that of the TiO2/Ti3C2@AC-72h sample although it has a lower SSA value. Possible reasons are the good contact of Ti3C2 with water molecules due to its hydrophilic functionalities and efficient interfacial charge transfer due to its excellent metallic conductivity. Commercial TiO2 nanoparticles (P25) with 1% Pt were used as a comparison with and without 1 mM EY, but only 0.7 μmol h−1 g−1 H2 production was observed with 1 mM EY, which was significantly lower than that of TiO2/Ti3C2@AC-48h.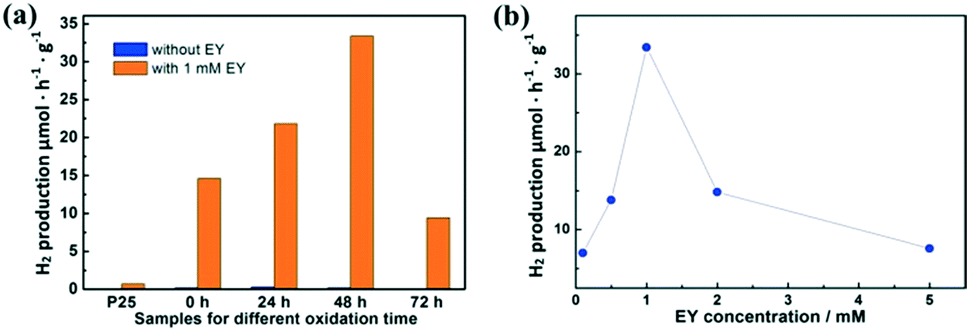 | ||
| Fig. 4 The hydrogen production for (a) Ti3C2, TiO2/Ti3C2@AC-24h, TiO2/Ti3C2@AC-48h and TiO2/Ti3C2@AC-72h with and without EY, and (b) TiO2/Ti3C2@AC-48h with different EY concentrations. | ||
Different concentrations of EY were used to optimize the hydrogen production rate based on the TiO2/Ti3C2@AC-48h sample, as shown in Fig. 4b. The concentration of 1 mM EY shows the best hydrogen production. The hydrogen production is increased as the concentration of EY increases from 0.1 mM to 1 mM. This is due to the enhanced adsorption of EY, leading to more photo-generated electrons transferred from EY to TiO2. When the EY concentration increases above 1 mM, the excited electrons cannot be transferred to TiO2 in time. Thus, the recombination of the electrons and holes generated by EY upon light absorption increases, resulting in the decrease of hydrogen production. For comparison, an EY-adsorbed sample was prepared and also used for hydrogen production. It exhibited only 1.2 μmol h−1 g−1 H2 production, which is much lower than those of samples with dissolved EY.
Fig. S4† shows the EIS Nyquist plots of the samples, and the equivalent electrical circuit is shown in the inset. The fitting parameters are displayed in Table S1,† where RS and RCT are the solution resistance and the interface charge-transfer resistance, respectively, and CPE is the constant phase element. The result of pure Ti3C2 is different from others, as it exhibits MXene pseudo-capacitive behavior (it is a well-known electrode material for supercapacitors)37 and less contribution to photo-generated electron separation because of the lack of TiO2. The TiO2/Ti3C2@AC-48h sample has the smallest semi-circle radius among the composites, meaning the smallest interfacial charge-transfer resistance, implying a more efficient photo-generated electron transfer from EY to TiO2/Ti3C2@AC-48h, which supports the higher HER results.
Fig. 5 shows the PL spectra of pure Ti3C2 and the partially oxidized Ti3C2 samples. The peaks near 490 nm are attributed to TiO2, as confirmed by the PL spectra of commercial TiO2 (Fig. S5†). These samples all showed the appearance of TiO2, but the TiO2 peaks of TiO2/Ti3C2@AC-24h and TiO2/Ti3C2@AC-48h are weak. The strong peak of Ti3C2 at 490 nm is attributed to the –O surface termination groups, forming the structure of Ti–O–Ti, which is similar to the behavior of TiO2.2 The peak near 580 nm is considered the recombination of electrons and holes on the amorphous carbon. Higher PL intensity means more charge recombination.14,23 The highest PL spectra intensity of TiO2/Ti3C2@AC-72h demonstrates the strongest recombination of electrons and holes. This is regarded as the main reason for the lowest hydrogen production activity of TiO2/Ti3C2@AC-72h. Both Ti3C2 and amorphous carbon can receive electrons from TiO2 (ref. 13, 34, 38 and 39) and provide active sites for hydrogen production. Compared to TiO2/Ti3C2@AC-72h with a very low amount of Ti3C2, other samples show weaker PL intensities, suggesting that they have more efficient charge separation. Thus TiO2/Ti3C2@AC-72h shows worse photocatalytic activity than the other three samples (Fig. 4a). Besides, although TiO2/Ti3C2@AC-24h shows weaker recombination compared with TiO2/Ti3C2@AC-48h, it gives lower photocatalytic activity, which can be attributed to its lower SSA value and higher charge transfer resistance.
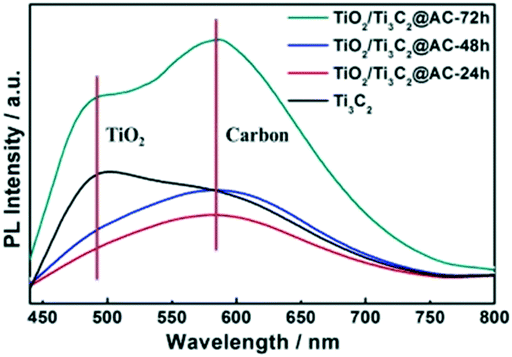 | ||
| Fig. 5 The PL spectra of Ti3C2, TiO2/Ti3C2@AC-24h, TiO2/Ti3C2@AC-48h and TiO2/Ti3C2@AC-72h. | ||
3.3 Photocatalytic mechanism
To investigate the mechanism of the photocatalytic process, the HOMO and LUMO levels of EY are calculated from the UV-vis absorption spectra in Fig. S6.† The absorption edge is observed at λabs = 540 nm, thus the band gap of EY is 2.3 eV according to eqn (1). The LUMO of EY is considered to be −3.7 eV as reported.40,41 The HOMO of EY is calculated using the following equations:42| Eg (eV) = 1240/λabs (nm) | (1) |
| LUMO (eV) = HOMO + Eg | (2) |
Thus, the HOMO and LUMO levels of EY are −6.0 and −3.7 eV, respectively.
A possible mechanism for the EY-sensitized hydrogen production system is depicted in Fig. 6. EY is excited by the visible light absorption and singlet excited state EY1* is formed. Subsequently, EY1* changed into the triplet excited state EY3* by fast intersystem crossing (ISC). In the presence of an electron provided by AA, EY3* then changed into EY˙−. EY˙− injects an electron into the conduction band of TiO2, as the reduction potential of EY is higher than that of TiO2 (−4.1 eV).22,35,43 The electron is finally transferred to Ti3C2 and amorphous carbon to react with H+ to produce H2.
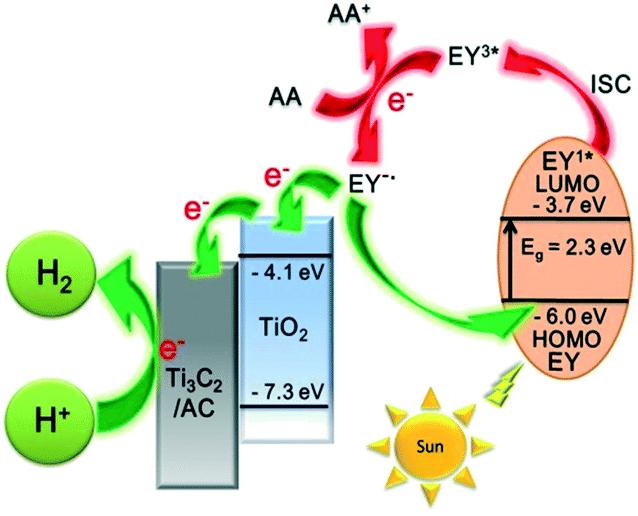 | ||
| Fig. 6 The schematic diagram of hydrogen production for an EY-sensitized TiO2/Ti3C2@AC composite under visible light irradiation. | ||
Conclusions
In conclusion, Ti3C2 was partially oxidized in water at 60 °C for 24 h, 48 h and 72 h and used in EY sensitized systems for hydrogen evolution under visible light irradiation. The hydrogen production rate of EY-sensitized composites follows the order: TiO2/Ti3C2@AC-48h > TiO2/Ti3C2@AC-24h > Ti3C2 > TiO2/Ti3C2@AC-72h. This is mainly because of the different TiO2/Ti3C2 ratios and SSA values. The PL spectra demonstrated that the major reason for the low photocatalytic activity of TiO2/Ti3C2@AC-72h is due to the inefficient charge separation. EY-sensitized TiO2/Ti3C2@AC-48h shows the best hydrogen production performance with an EY concentration of 1 mM, as high as 33.4 μmol h−1 g−1, which is 110 times higher than that of TiO2/Ti3C2@AC-48h without EY. This work gives a novel idea about the use of Ti3C2 MXene as a co-catalyst for hydrogen production.Conflicts of interest
There are no conflicts to declare.Acknowledgements
This work was supported by the National Natural Science Foundation of China (No. 11574111 to X.-F. W.) and the Natural Science Foundation of Jilin Province (No. 20160101303JC to X.-F. W.).Notes and references
- J. Ran, J. Zhang, J. Yu, M. Jaroniec and S. Z. Qiao, Chem. Soc. Rev., 2014, 43, 7787–7812 RSC.
- M. Naguib, J. Come, B. Dyatkin, V. Presser, P. L. Taberna, P. Simon, M. W. Barsoum and Y. Gogotsi, Electrochem. Commun., 2012, 16, 61–64 CrossRef CAS.
- N. Kurra, B. Ahmed, Y. Gogotsi and H. N. Alshareef, Adv. Energy Mater., 2016, 6, 1601372 CrossRef.
- Y. Ying, Y. Liu, X. Wang, Y. Mao, W. Cao, P. Hu and X. Peng, ACS Appl. Mater. Interfaces, 2015, 7, 1795–1803 CrossRef CAS.
- F. Shahzad, M. Alhabeb, C. B. Hatter, B. Anasori, H. S. Man, C. M. Koo and Y. Gogotsi, Science, 2016, 353, 1137 CrossRef CAS.
- X. Lu, K. Xu, P. Chen, K. Jia, S. Liu and C. Wu, J. Mater. Chem. A, 2014, 2, 18924–18928 RSC.
- Z. W. Seh, K. D. Fredrickson, B. Anasori, J. Kibsgaard, A. L. Strickler, M. R. Lukatskaya, Y. Gogotsi, T. F. Jaramillo and A. Vojvodic, ACS Energy Lett., 2016, 1, 589–594 CrossRef CAS.
- J. Ran, G. Gao, F. T. Li, T. Y. Ma, A. Du and S. Z. Qiao, Nat. Commun., 2017, 8, 13907 CrossRef CAS PubMed.
- M. A. Hope, A. C. Forse, K. J. Griffith, M. R. Lukatskaya, M. Ghidiu, Y. Gogotsi and C. P. Grey, Phys. Chem. Chem. Phys., 2016, 18, 5099–5102 RSC.
- Y. Sun, D. Jin, Y. Sun, X. Meng, Y. Gao, Y. Dall'Agnese, G. Chen and X.-F. Wang, J. Mater. Chem. A, 2018, 6, 9124–9131 RSC.
- M. Naguib, V. N. Mochalin, M. W. Barsoum and Y. Gogotsi, Adv. Mater., 2014, 26, 992–1005 CrossRef CAS.
- B. Anasori, M. R. Lukatskaya and Y. Gogotsi, Nat. Rev. Mater., 2017, 2, 16098 CrossRef CAS.
- Y. Gao, L. Wang, A. Zhou, Z. Li, J. Chen, H. Bala, Q. Hu and X. Cao, Mater. Lett., 2015, 150, 62–64 CrossRef CAS.
- H. Wang, R. Peng, Z. D. Hood, M. Naguib, S. P. Adhikari and Z. Wu, ChemSusChem, 2016, 9, 1490–1497 CrossRef CAS PubMed.
- M. Naguib, O. Mashtalir, M. R. Lukatskaya, B. Dyatkin, C. Zhang, V. Presser, Y. Gogotsi and M. W. Barsoum, Chem. Commun., 2014, 50, 7420–7423 RSC.
- B. Ahmed, D. H. Anjum, M. N. Hedhili, Y. Gogotsi and H. N. Alshareef, Nanoscale, 2016, 8, 7580–7587 RSC.
- C. J. Zhang, S. J. Kim, M. Ghidiu, M.-Q. Zhao, M. W. Barsoum, V. Nicolosi and Y. Gogotsi, Adv. Funct. Mater., 2016, 26, 4143–4151 CrossRef CAS.
- C. Dall'Agnese, Y. Dall'Agnese, B. Anasori, W. Sugimoto and S. Mori, New J. Chem., 2018, 42, 16446–16450 RSC.
- P. Chowdhury, G. Malekshoar and A. Ray, Inorganics, 2017, 5, 34 CrossRef.
- J. Moser and M. Graetzel, J. Am. Chem. Soc., 1984, 106, 6557–6564 CrossRef CAS.
- S. Min and G. Lu, Int. J. Hydrogen Energy, 2012, 37, 10564–10574 CrossRef CAS.
- L. Yang, J. Huang, L. Shi, L. Cao, W. Zhou, K. Chang, X. Meng, G. Liu, Y. Jie and J. Ye, Nano Energy, 2017, 36, 331–340 CrossRef CAS.
- P. Wang, Z. Guan, Q. Li and J. Yang, J. Mater. Sci., 2017, 53, 774–786 CrossRef.
- P. Chowdhury, S. Athapaththu, A. Elkamel and A. K. Ray, Sep. Purif. Technol., 2017, 174, 109–115 CrossRef CAS.
- M. Naguib, M. Kurtoglu, V. Presser, J. Lu, J. Niu, M. Heon, L. Hultman, Y. Gogotsi and M. W. Barsoum, Adv. Mater., 2011, 23, 4248–4253 CrossRef CAS PubMed.
- S. Xu, G. Wei, J. Li, Y. Ji, N. Klyui, V. Izotov and W. Han, Chem. Eng. J., 2017, 317, 1026–1036 CrossRef CAS.
- H. Ghassemi, W. Harlow, O. Mashtalir, M. Beidaghi, M. R. Lukatskaya, Y. Gogotsi and M. L. Taheri, J. Mater. Chem. A, 2014, 2, 14339 RSC.
- X. Shao, W. Lu, R. Zhang and F. Pan, Sci. Rep., 2013, 3, 3018 CrossRef PubMed.
- A. C. Ferrari and J. Robertson, Phys. Rev. B: Condens. Matter Mater. Phys., 2000, 61, 14095–14107 CrossRef CAS.
- P. González-García, E. Urones-Garrote and L. García-González, Mater. Chem. Phys., 2018, 211, 270–277 CrossRef.
- A. Hajalilou, E. Abouzari-Lotf, V. Abbasi-Chianeh, T. R. Shojaei and E. Rezaie, J. Alloys Compd., 2018, 737, 536–548 CrossRef CAS.
- K. Wang, J. Wang, Y. Wu, S. Zhao, Z. Wang and S. Wang, Org. Electron., 2018, 56, 221–231 CrossRef CAS.
- R. Hao, G. Wang, C. Jiang, H. Tang and Q. Xu, Appl. Surf. Sci., 2017, 411, 400–410 CrossRef CAS.
- C. Peng, X. Yang, Y. Li, H. Yu, H. Wang and F. Peng, ACS Appl. Mater. Interfaces, 2016, 8, 6051–6060 CrossRef CAS PubMed.
- Z. Li, L. Wang, D. Sun, Y. Zhang, B. Liu, Q. Hu and A. Zhou, Mater. Sci. Eng., B, 2015, 191, 33–40 CrossRef CAS.
- C. J. Zhang, S. Pinilla, N. McEvoy, C. P. Cullen, B. Anasori, E. Long, S.-H. Park, A. Seral-Ascaso, A. Shmeliov, D. Krishnan, C. Morant, X. Liu, G. S. Duesberg, Y. Gogotsi and V. Nicolosi, Chem. Mater., 2017, 29, 4848–4856 CrossRef CAS.
- Y. Dall'Agnese, P. Rozier, P.-L. Taberna, Y. Gogotsi and P. Simon, J. Power Sources, 2016, 306, 510–515 CrossRef.
- C. Peng, H. Wang, H. Yu and F. Peng, Mater. Res. Bull., 2017, 89, 16–25 CrossRef CAS.
- Y. Yang, P. Gao, Y. Wang, L. Sha, X. Ren, J. Zhang, Y. Chen, T. Wu, P. Yang and X. Li, Nano Energy, 2017, 33, 29–36 CrossRef CAS.
- Y. Wang, J. Hong, W. Zhang and R. Xu, Catal. Sci. Technol., 2013, 3, 1703 RSC.
- H. Zhang, S. Li, R. Lu and A. Yu, ACS Appl. Mater. Interfaces, 2015, 7, 21868–21874 CrossRef CAS PubMed.
- Y. Li, W. Zhao, M. Li, G. Chen, X. F. Wang, X. Fu, O. Kitao, H. Tamiaki, K. Sakai, T. Ikeuchi and S. I. Sasaki, Chem. – Eur. J., 2017, 23, 10886–10892 CrossRef CAS PubMed.
- C. Kong, Y. Han, L. Hou and Y. Li, J. Photochem. Photobiol., A, 2017, 345, 92–97 CrossRef CAS.
Footnote |
| † Electronic supplementary information (ESI) available. See DOI: 10.1039/c8cy02240b |
| This journal is © The Royal Society of Chemistry 2019 |