
 Open Access Article
 This Open Access Article is licensed under a
 Creative Commons Attribution 3.0 Unported Licence
New insights for the valorisation of glycerol over MgO catalysts in the gas-phase†
Louise R.
Smith
,
Paul J.
Smith
,
Karl S.
Mugford
,
Mark
Douthwaite
,
Nicholas F.
Dummer
 *,
David J.
Willock
,
Mark
Howard
,
David W.
Knight
,
Stuart H.
Taylor
and
Graham J.
Hutchings
*
*,
David J.
Willock
,
Mark
Howard
,
David W.
Knight
,
Stuart H.
Taylor
and
Graham J.
Hutchings
*
Cardiff Catalysis Institute, School of Chemistry, Cardiff University, Main Building, Park Place, Cardiff, CF10 3AT, UK. E-mail: MugfordK1@cardiff.ac.uk; dummernf@cardiff.ac.uk; hutch@cardiff.ac.uk
First published on 4th March 2019
Abstract
Aqueous glycerol solutions of up to 50 wt% were reacted over magnesium oxide catalysts at temperatures greater than 300 °C, the reactivity of which was compared to catalyst-free reactions. Under catalyst-free conditions, modest levels of dehydration to hydroxyacetone were observed at temperatures >400 °C in a steel reactor tube and >320 °C over silicon carbide. For reactions over MgO, the product distribution becomes more diverse, resulting in the formation of methanol, acetaldehyde, ethylene glycol, 1,2-propanediol and acetic acid. The methanol space–time–yield over MgO catalyst samples (0.5 g) was found to be highest at 400 °C (205 g h−1 kgcat−1) with a 50 wt% solution of glycerol, or with a glycerol concentration of 10 wt%; 255 g h−1 kgcat−1 over 0.1 g of catalyst. Despite the high glycerol conversion achieved, the MgO catalyst was found to be stable over 48 h, following a modest decrease in glycerol conversion during the initial 2 h of reaction. Post-reaction characterisation revealed that the level of coking at high glycerol conversions (>90%) was ≥120 mg gcat−1. The carbon mass balance determined by GC analysis for a typical reaction was 75% and so the carbon lost from catalyst coking only represents a modest quantity of the missing carbon; typically <10%. MgO was also found to promote the formation of high molecular weight products via condensation reactions, which were responsible for the remainder of the missing carbon; ca. 15%. Therefore, the total organic content of the post-reaction mixture and coke was calculated to be 94% of the starting solution. We conclude that the catalyst surface directs the formation of methanol, however, the results indicate that the reaction conditions are crucial to obtain optimum yields.
1. Introduction
The growing concerns regarding the contribution of CO2 emissions to climate change and global warming have encouraged researchers to invest in the discovery of green and sustainable routes for the production of liquid fuels.1,2 The contribution of ‘renewable’ liquid fuels to final energy demand in the transport sector during 2015 comprised ethanol at 1.6% and biodiesel at 0.8%, with all other liquid biofuels contributing 0.4%.3 Biodiesel is manufactured via the transesterification of natural triglyceride oils with methanol, giving approximately 90 wt% yield of fatty acid methyl esters (biodiesel) and a 10 wt% crude glycerol by-product.4,5 Future growth in renewable fuel production based on virgin oils, such as palm, soy or rapeseed, is challenged by concerns over sustainability, actual carbon footprint, competition for land, and land use change effects. This has led to uncertain regulatory support and limited investment, as well as increased use of recycled oils and fats. There is therefore growing interest in alternative sources of triglyceride oils, for example from oil crops with potentially improved sustainability (e.g. camelina, jatropha), or from microalgae, despite the very considerable cost challenges.6,7 Transesterification to biodiesel (fatty acid methyl esters) remains one of two main options for conversion of these potentially more sustainable triglyceride feedstocks to finished transport fuel, with hydrogenation/isomerisation to hydrocarbon fuels being the other. Adding value to the crude glycerol by-product from triglyceride based biodiesel manufacture is one way of improving the overall economics of such routes, and therefore their future potential.The valorisation of glycerol to value-added chemicals is not a novel concept. Numerous reviews have been published highlighting the diverse range of compounds into which glycerol can be upgraded.8–10 Such processes include the selective oxidation and reduction of glycerol,11–13 esterification,14,15 etherification,16,17 cyclisation,18 dehydration,19–22 and reforming.23,24 These remain interesting options where scale and processing costs are consistent with the relevant chemicals markets can be achieved. An alternative approach could be to convert the crude glycerol by-product into blendable liquid fuel components, which may include methanol either for direct gasoline blending or for a feedstock into transesterification. It is important to emphasise that crude glycerol would be required as a feedstock to make such a process economical.
There are numerous examples in the literature of catalytic systems which utilize hydrogen as a means of transforming glycerol into lower carbon-containing alcohols by reductive routes.25,26 Whilst these offer potential, the requirement for co-fed hydrogen will inevitably impact process costs and impart an energy/environmental penalty. The surface properties of the catalyst predominantly dictate the reaction selectivity, for example, Brønsted acidic surface sites typically favour dehydration routes to form hydroxyacetone and acrolein.20,21,27,28 However, the absence of a gaseous oxidant or reductant ultimately reduces experimental control, leading to a large variety of products.
As discussed previously, many different strategies can be invoked to valorise glycerol.8–10 However, establishing which transformations are economically viable is challenging, but can be assessed by the careful implementation of life cycle analysis methodologies.29–31 Unfortunately, the most economic approach for the up-grading of glycerol is often variable and driven by the market value of the reaction products. We therefore consider it vitally important that research and development is under taken to offer as many options for the valorisation of glycerol, so that technologies can be implemented swiftly when deviations in the market occur. The primary aim of this work is to develop an efficient method of producing methanol from glycerol and over a simple metal oxide catalyst. Methanol is used as a chemical reagent in the production of bio-diesel; a process in which glycerol is an un-desirable by-product of. One could therefore envisage how bio-diesel companies could reduce feedstock costs by generating methanol in-house, should they wish to invest and adopt such a technology. This work expands on our previous research in this area, accounting for any changes in the chemistry taking place which arise from the higher glycerol feed concentration and reaction temperatures used previously.
We have previously shown, that under specific reaction conditions, it is possible to achieve a reasonably high selectivity to methanol with dilute aqueous solutions of glycerol over MgO, CeO2 and other metal oxides without the need for additional gaseous hydrogen.32 In our previous study, preliminary results also revealed that higher glycerol concentrations in the feed resulted in a significant increase in the quantity of side reactions. This was common to both pure and crude glycerol solutions with a feed concentration of 50 wt% of glycerol. A reaction mechanism was subsequently proposed to rationalise the formation of the major products observed. In the present study, we have established that in addition to the reactions proposed previously, numerous other side reactions can also occur on this MgO catalyst, particularly when high concentrations of glycerol are present in the feed. We have focused on the influence of reaction temperature and partial pressures of water and glycerol on the product distribution. Additionally, analysis protocols suitable for the analysis of the complex product mixture and a total carbon content of a typical reaction are reported in an attempt to close the carbon balance. We consider that this increased understanding of the parameters that promote the competing pathways, provides us with solid foundation to begin further optimisation of the system.
2. Experimental section
2.1. Materials
Magnesium(II) nitrate hexahydrate (≥99.0%), magnesium(II) hydroxide (≥99.0%), sodium carbonate (anhydrous, ≥99.0%), and glycerol (≥99.5%) were all purchased from Sigma-Aldrich. Argon gas was supplied by BOC. All purchased materials were used as received. Deionised water was provided in-house. Silicon carbide (98%, Alfa Aesar, 40–50 mesh size) was washed with deionised water and dried prior to use at 110 °C for 24 h.2.2. Catalyst preparation
MgO catalysts were prepared using a reflux technique we reported previously.32 The as-received metal hydroxide was calcined to 450 °C for 24 h (10 °C min−1, static air). The resulting metal oxide was refluxed in deionised water (15 ml g−1) for 3 h to form a slurry and then dried at 110 °C for 24 hours. The materials were then calcined (600 °C at 10 °C min−1 and held for 3 h in flowing nitrogen) to obtain the final oxide catalyst.2.3. Catalyst testing
Catalytic reactions were performed using a gas-phase plug flow micro-reactor. Typically, aqueous glycerol solutions (50 wt%) were introduced into a preheater and vaporiser (305 °C) using an HPLC pump at a flow rate of 0.016 mL min−1. The glycerol feed was swept through the reactor using argon as carrier gas (50 mL min−1). All lines were heated to 300 °C pre-catalyst bed and 100 °C post-catalyst bed to prevent any condensation taking place. Catalysts were pelleted, crushed and sieved to a uniform particle size (250–425 μm) prior to testing. Typically, 0.5 g of catalyst was combined with silicon carbide to a uniform volume (1 mL) and packed into an 8 mm inner diameter stainless steel tube between two plugs of quartz wool. The resultant mass velocities and space velocities studied were between 6000–29![[thin space (1/6-em)]](https://www.rsc.org/images/entities/char_2009.gif) 850 LAr h−1 kgcat−1 and 4615–20000 LAr h−1 Lcat−1 respectively. Reactions were carried out between 320–480 ± 1 °C in an oven controlled by a PID temperature controller with a thermocouple placed in the catalyst bed. Liquid reaction products were collected using an ice cold stainless steel trap. A gas bag was attached at the exit line to collect the gaseous products.
850 LAr h−1 kgcat−1 and 4615–20000 LAr h−1 Lcat−1 respectively. Reactions were carried out between 320–480 ± 1 °C in an oven controlled by a PID temperature controller with a thermocouple placed in the catalyst bed. Liquid reaction products were collected using an ice cold stainless steel trap. A gas bag was attached at the exit line to collect the gaseous products.
Liquid reaction products were analysed offline using a Varian CP 3800 gas chromatograph (GC1) equipped with a capillary column (ZB-Wax plus, 30 m × 0.53 mm × 1 μm). Cyclohexanol was used as an external standard. Carbon based gas reaction products were analysed offline using a Varian 450-GC gas chromatograph (GC2) equipped with a capillary column (CP-Sil5CB, 50 m × 0.32 mm × 5 μm). H2 and O2 were analysed using a Varian CP3380 gas chromatograph (GC3) equipped with a Porapak Q column. A full product list and retention times according to GC used is displayed in Table S1.† Some additional qualitative analysis of the post reaction effluent was conducted by liquid chromatography-mass spectrometry (LCMS). This was conducted on a Bruker Amazon SL ion trap mass spectrometer which was operated in positive electrospray ion mode and coupled to a Thermo Ultimate HPLC system. The HPLC was equipped with a C-18 column (maintained at 40 °C) and utilized a stepped elution consisting of 0.1% formic acid in H2O (A) and 0.1% formic acid in acetonitrile. 10 μL of sample was injected and the gradient elution was performed as illustrated in Table 1.
| Time (min) | A (%) | B (%) |
|---|---|---|
| A = 0.1% formic acid in H2O and B = 0.1% formic acid in acetonitrile. | ||
| 0.0 | 98 | 2 |
| 1.0 | 98 | 2 |
| 15.0 | 2 | 98 |
| 17.0 | 2 | 98 |
| 18.0 | 98 | 2 |
| 20.0 | 98 | 2 |
2.4. Calculations
Eqn (1) was used to calculate the glycerol conversion (CGLY) based on the molar difference between the carbon moles of glycerol fed into the reactor, gmi, and that detected at the outlet, gmo: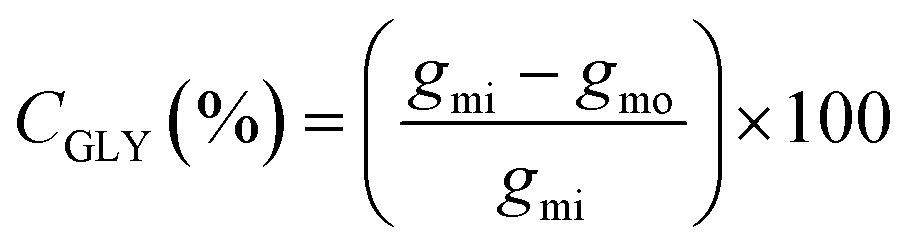 | (1) |
The product selectivity (Sp(x), carbon mol%) for any product, x, was calculated from the moles of carbon recovered of x (xCm) divided by the total moles of carbon in all products, yCm (eqn (2)).
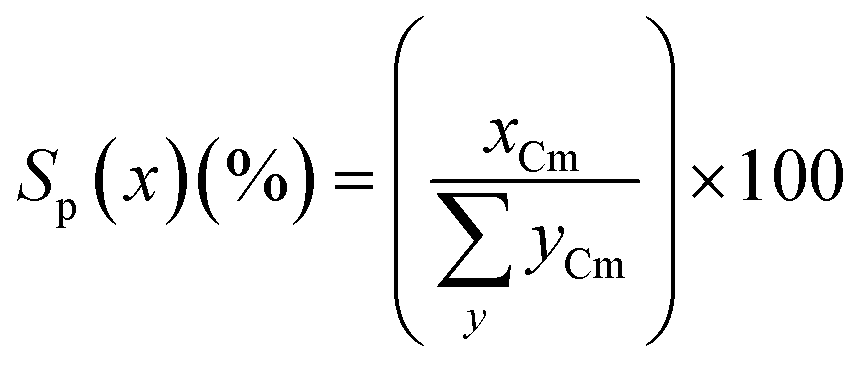 | (2) |
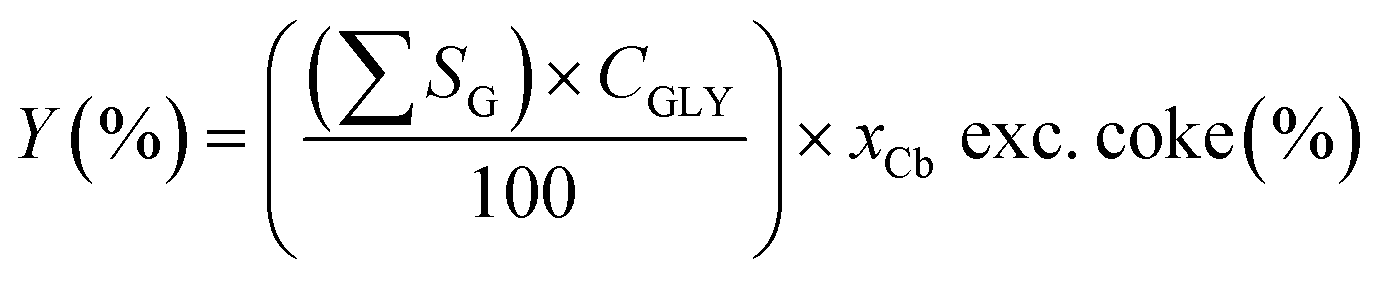
Functional group yield (Y, carbon mol%) data were calculated by the sum of the selectivities of that functional group SG, multiplied by conversion CGLY, multiplied by the carbon balance xCb, excluding coke (eqn (3)).
 | (3) |
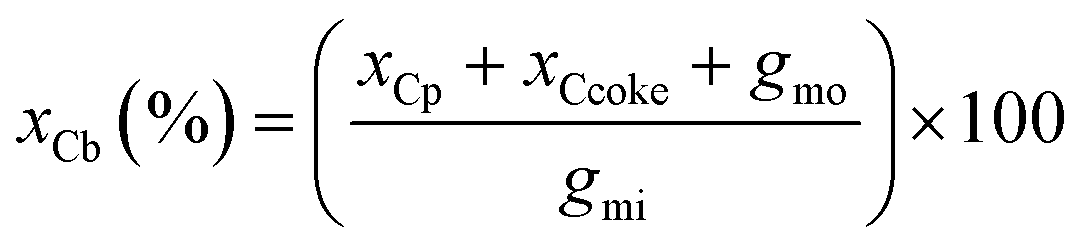
The carbon balance xCb was calculated (eqn (4)) by dividing the sum of the carbon moles of products xCp, coke xCcoke and unreacted glycerol gmo by the carbon moles of glycerol injected in the reactor gmi.
 | (4) |
Carbon deposition (coke) on the catalyst was calculated by dividing the mass loss as analysed by TGA of the used catalyst mLOST, by the carbon moles of glycerol feed over the catalyst gmi (eqn (5)).
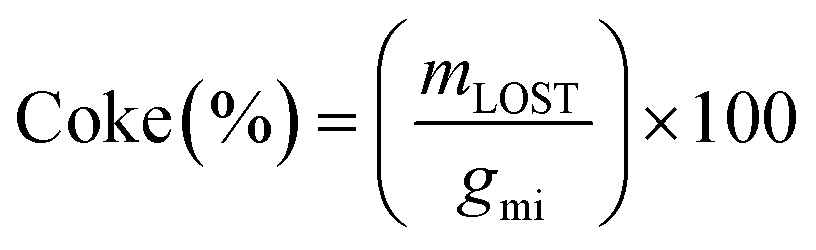 | (5) |
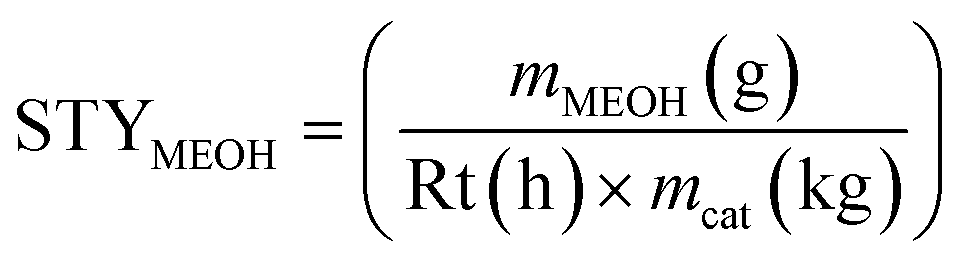
The methanol space–time–yield STYMEOH, was calculated (eqn (6)) from the mass of methanol mMEOH, produced per h (reaction time Rt), per mass of catalyst (mcat, kg).
 | (6) |
2.5. Material characterisation
Powder X-ray diffraction (XRD) analysis was performed using a PANalytical X'pert Pro diffractometer with a copper X-ray source operating at 40 keV and 40 mA, and Kα1 X-rays were selected using a Ge (111) single crystal monochromator. Patterns were recorded over the 2θ angular range 10–80° using a step size of 0.016°.Carbon deposition on catalysts post-reaction was determined using thermal gravimetric analysis (TGA) and differential thermal analysis (DTA) and was performed using a Setaram Labsys 1600 instrument. Samples (20–50 mg) were loaded into alumina crucibles and heated to 800 °C (5 °C min−1) in a flow of synthetic air (50 mL min−1). For all specified TGA runs, blank runs were subtracted from the relevant data to remove buoyancy effects.
Brunauer Emmett Teller (BET) surface area analysis was performed using a Micromeritics Gemini 2360 surface analyser. A five point analysis was performed using N2 as the adsorbate gas at −196 °C. Samples were degassed for 60 min at 105 °C prior to analysis.
3. Results and discussion
3.1. Catalyst-free reactions
Vapour-phase reactions of dilute glycerol over metal oxide catalysts have been reported by other workers from 250 to 700 °C.27,33 Catalyst free reactions were reported by Hernandez et al. indicating that significant quantities of glycerol can react in the absence of any catalyst at temperatures above 400 °C.34 However, the corresponding product distributions of these experiments were not discussed. In the present study, catalyst-free reactions were carried out over a temperature range of 320–480 °C. Reactions were conducted with a 50 wt% glycerol feed (0.016 mL h−1) and an Ar flow rate of 50 mL min−1 with both an empty stainless-steel tube and with a plug of silicon carbide (1 mL) in place. The glycerol conversion and the distribution of recovered products are displayed in Table 2. There is no reaction at 320 °C in the blank tube, however, at 400 and 480 °C glycerol conversions were calculated to be 6 and 11% respectively. The major products at both these reaction temperatures are allyl alcohol with a carbon mole selectivity (hereafter selectivity) of ca. 17% and hydroxyacetone with a selectivity of ca. 30% (see Table S2a† for full product selectivity). These both contribute to a respective yield of 2.5% and 3.1% to alcohols and ketones at 480 °C (Table 2; entry 3). Methanol, acetaldehyde, ethylene glycol, acetic and propionic acids, and 1,2-propanediol are present in the recovered reaction mixture (Table S2a†). The relatively high concentration of hydroxyacetone observed at both temperatures suggests that dehydration of glycerol to acrolein is unlikely to be the principle pathway. We consider that hydroxyacetone forms through the thermal dehydration of glycerol, and the modestly reductive atmosphere at the reaction temperatures used maintains the carbonyl functionality. Unidentified products are defined as the collected, unidentified signals (GC-FID peak areas) from the liquid product mixture, analysed in GC1. The carbon, oxygen and hydrogen mass balances are high and remain over 95% at all temperatures. Furthermore, the implication of these results is that glycerol can undergo both C–C and C–O scission in the gas phase, potentially via a radical mechanism initiated by the heated surfaces within the reactor tube. As such, it is important to consider this contribution when assessing the products formed from reactions at high temperatures, as comparable product distributions are observed in the reactions over metal oxide catalysts.35| Entry | Condition (°C) | C GLY (%) | Mass balanceb (%) | Yieldc (%) | ||||||||
|---|---|---|---|---|---|---|---|---|---|---|---|---|
| C | H | O | Alc. | Diols | Ald. | Ket. | Ac. | COx | Unk. | |||
| a Glycerol conversion. b Carbon mass balance (±3%) of products detected in GC1 and GC2. c Yield of products detected in GC1 and GC2; Alc., alcohols; Ald., aldehydes; Ket., ketones; Ac., acids; Unk., unknowns (full product list in Table S2). Reaction conditions; 50 wt% glycerol (0.016 mL min−1), 50 mL min−1 Ar, 3 hours. | ||||||||||||
| 1 | 320 | 0.0 | 102 | 102 | 102 | — | — | — | — | — | — | — |
| 2 | 400 | 6.1 | 95 | 95 | 95 | 1.1 | 0.5 | 0.4 | 1.8 | 0.1 | 0.2 | 1.3 |
| 3 | 480 | 11.0 | 98 | 98 | 98 | 2.5 | 1.4 | 1.1 | 3.1 | 0.5 | 0.3 | 2.1 |
| 4 | 320 w/SiC | 1.6 | 99 | 98 | 99 | 0.7 | 0.0 | 0.0 | 0.9 | 0.0 | 0.0 | 0.0 |
| 5 | 360 w/SiC | 4.4 | 97 | 97 | 97 | 1.6 | 0.2 | 0.2 | 1.6 | 0.2 | 0.2 | 0.2 |
| 6 | 400 w/SiC | 11.9 | 95 | 93 | 92 | 3.8 | 0.7 | 0.9 | 3.9 | 0.5 | 0.4 | 1.0 |
| 7 | 480 w/SiC | 17.9 | 95 | 93 | 90 | 5.0 | 1.9 | 3.5 | 4.2 | 0.3 | 0.4 | 1.7 |
To investigate the conversion of glycerol under catalyst-free conditions further, silicon carbide (40–50 mesh) was used to assess the effect of increased contact with a hot surface (Table 2; entries 4–6). Additionally, the residence time in the heated zone of the reactor has decreased with the associated reduction in volume within the reactor. The residence time was calculated to be 1.2 s across the 1 mL bed-length in the empty tube, this was reduced to 0.59 s with the presence of silicon carbide. Silicon carbide is used as a diluent in the catalyst bed and therefore should ideally have no impact on the chemistry taking place. At a lower reaction temperature (320 °C) over silicon carbide, the glycerol conversion is less than 2%; however, at 480 °C the conversion increases to ca. 18%. The modest glycerol conversion suggests that the SiC is not necessarily inert; however, we consider that the enhanced contact between the gaseous reactants in the heated zone of the reactor over the SiC bed greatly contributes to the increased glycerol conversion, which can be said to be thermally initiated, particularly at 480 °C. In the empty reactor-tube the majority of the gas stream will have no contact with a hot surface due to the increased available volume. The main products over the temperature range studied (320–480 °C) were hydroxyacetone and allyl alcohol (Table S2b†), which is comparable to the product distribution observed with only the empty reactor tube (Table S2a†). In addition, the selectivity (Table S2b†) to hydroxyacetone was comparable to the reaction selectivity observed in an empty tube: 37% at 360 °C, which decreased to 23% at 480 °C. Interestingly, with the SiC present, the selectivity to allyl alcohol was found to be higher when compared to the reaction in the empty reactor: 35% at 360 °C, which decreased to 22% at 480 °C. Potentially, this was due to a decreased selectivity to unknown products over SiC and can be attributed to the increased contact with SiC, resulting in a greater proportion of substrate and/or intermediate activation on a hot surface in the reactor.
At the higher reaction temperatures, significant quantities of acetaldehyde, acrolein, 1,2-propanediol and ethylene glycol were detected. As noted above, the implication of these results further complicates the origin of products formed over metal oxides and suggests that a high surface area catalyst promotes the conversion of glycerol and the reaction intermediates. The formation of allyl alcohol as a major product under these conditions suggests that glycerol reacts via dehydration at the primary positions (C1 or C3) to produce hydroxyacetone or via the C2 position to form acrolein,22 however, hydrogen is required to complete these reactions to allyl alcohol. Therefore, as hydrogen is not added to the feed-stream an alternative pathway can be proposed to form allyl alcohol according to a radical mechanism as described in Fig. 1. Given that significantly lower selectivity to acrolein and allyl alcohol is observed in reactions over MgO, it is likely that MgO promotes the activation of a primary alcohol group and a radical reaction to allyl alcohol is inhibited.
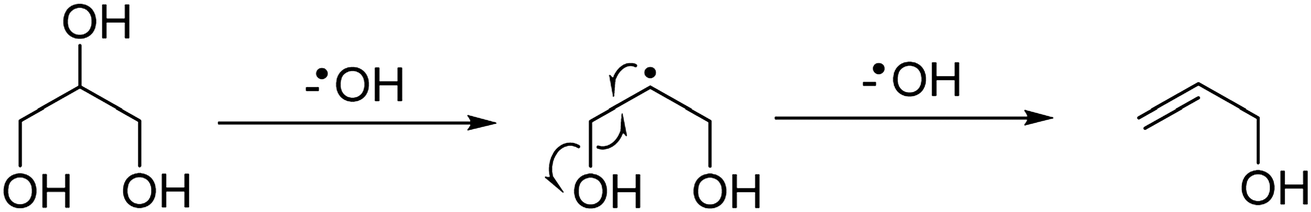 | ||
| Fig. 1 Potential reaction scheme for the formation of allyl alcohol via a radical mechanism, which initially dehydroxylates at the C2 position of glycerol then at the C3 position. | ||
3.2. Reactions over MgO
| Entry | Condition (°C) | C GLY (%) | Mass balanceb (%) | Yieldc (%) | MeOH S.T.Y. (g1 h−1 kgcat−1) | Carbon deposition (mg g−1) | ||||||||
|---|---|---|---|---|---|---|---|---|---|---|---|---|---|---|
| C | H | O | Alc. | Diols | Ald. | Ket. | Ac. | COx | Unk. | |||||
| a Glycerol conversion. b Carbon mass balance (±3%) of products detected in GC1 and GC2, values in parenthesis include coke deposited on catalyst. c Yield of products detected in GC1 and GC2; Alc., alcohols; Ald., aldehydes; Ket., ketones; Ac., acids; Unk., unknowns (full product list in Table S3). Reaction conditions; 50 wt% glycerol (0.016 mL min−1), 0.5 g MgO, 50 mL min−1 Ar, 3 hours. | ||||||||||||||
| 1 | 360 | 74 | 74 (77) | 72 | 67 | 14.4 | 8.0 | 6.1 | 15.4 | 1.2 | 3.9 | 5.9 | 131 | 81 |
| 2 | 400 | 90 | 73 (77) | 71 | 61 | 21.2 | 5.2 | 11.0 | 13.6 | 1.7 | 6.6 | 6.2 | 205 | 122 |
| 3 | 440 | 100 | 68 (73) | 61 | 55 | 21.3 | 2.7 | 15.9 | 13.1 | 1.8 | 7.8 | 5.4 | 204 | 125 |
The product distribution varied with temperature, with the main groupings of product distributions summarised in Fig. 2. At the lower reaction temperatures, the major product formed was hydroxyacetone (reaction selectivity equal to 26%), which decreased with increasing temperature and conversion, suggesting this is an intermediate in the reaction. The diol yield, which is a combined sum of the yields to 1,2-propanediol, 1,3-propanediol and ethylene glycol, also decreased with increasing temperature and conversion, suggesting that these too are further converted.
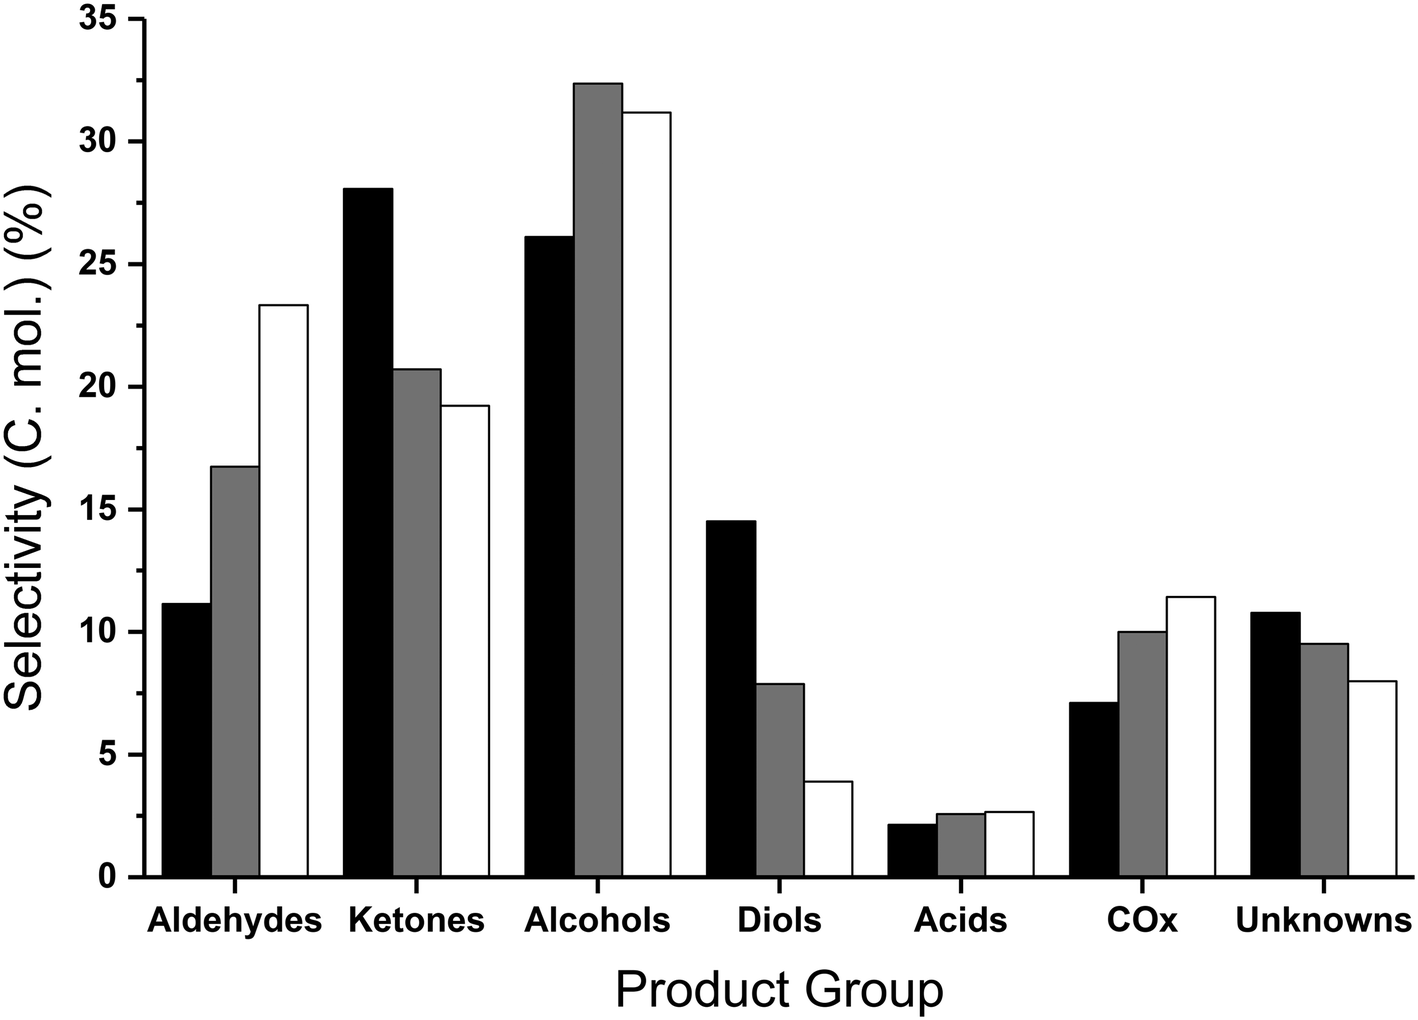 | ||
| Fig. 2 Collected product selectivities expressed as carbon mole selectivity following reaction at 360 °C (black), 400 °C (grey) and 440 °C (white) over MgO. Reaction conditions; 50 wt% glycerol (0.016 mL min−1), 0.5 g MgO, 50 mL min−1 Ar, 3 hours. | ||
Similarly to the catalyst free reactions, the aldehyde selectivity increased steadily with increasing temperature over MgO, largely attributed to the significant quantities of acetaldehyde produced (17% selectivity at 440 °C), with smaller amounts of propionaldehyde and acrolein present. In contrast to the aldehyde selectivity, the alcohol selectivity reached a maximum at 400 °C, where the methanol selectivity was 28%, corresponding to a methanol space time yield of 205 g h−1 kgcat−1. Due to the increasing selectivity towards undesirable by-products such as acetaldehyde and COx at temperatures exceeding 400 °C, and methanol selectivity being at a maximum at this temperature; higher temperatures were not explored. Increasing or decreasing the flow rate of the carrier gas and hence varying the glycerol contact time with the catalyst results in comparable product distributions. That is, with a higher contact time the effect is comparable to higher reaction temperatures and vice versa. Standard reaction conditions utilize a GHSV of 4615 h−1 and were compared to the reaction data obtained with GHSVs of 2300 h−1 and 6920 h−1. The conversion of glycerol and product distribution observed in these experiments were influenced by the flow-rate change. For example; a GHSV of 6920 h−1 resulted in a lower glycerol conversion and greater reaction selectivity to intermediate products such as hydroxyacetone and 1,2-propanediol and a reduction in selectivity to terminal reaction products such as acetaldehyde and methanol (Table S4†). In contrast, with a GHSV of 2300 h−1 a higher glycerol conversion was observed and a greater selectivity to terminal products was observed at the expense of the intermediates.
The above experiments and enhanced analytical methods used in this work has led to a greater understanding of the chemistry taking place in this reaction. Based on our experimental observations, a reaction map has been developed (Fig. 3), comprising of the major products observed in these reactions, and proposed routes to their formation.
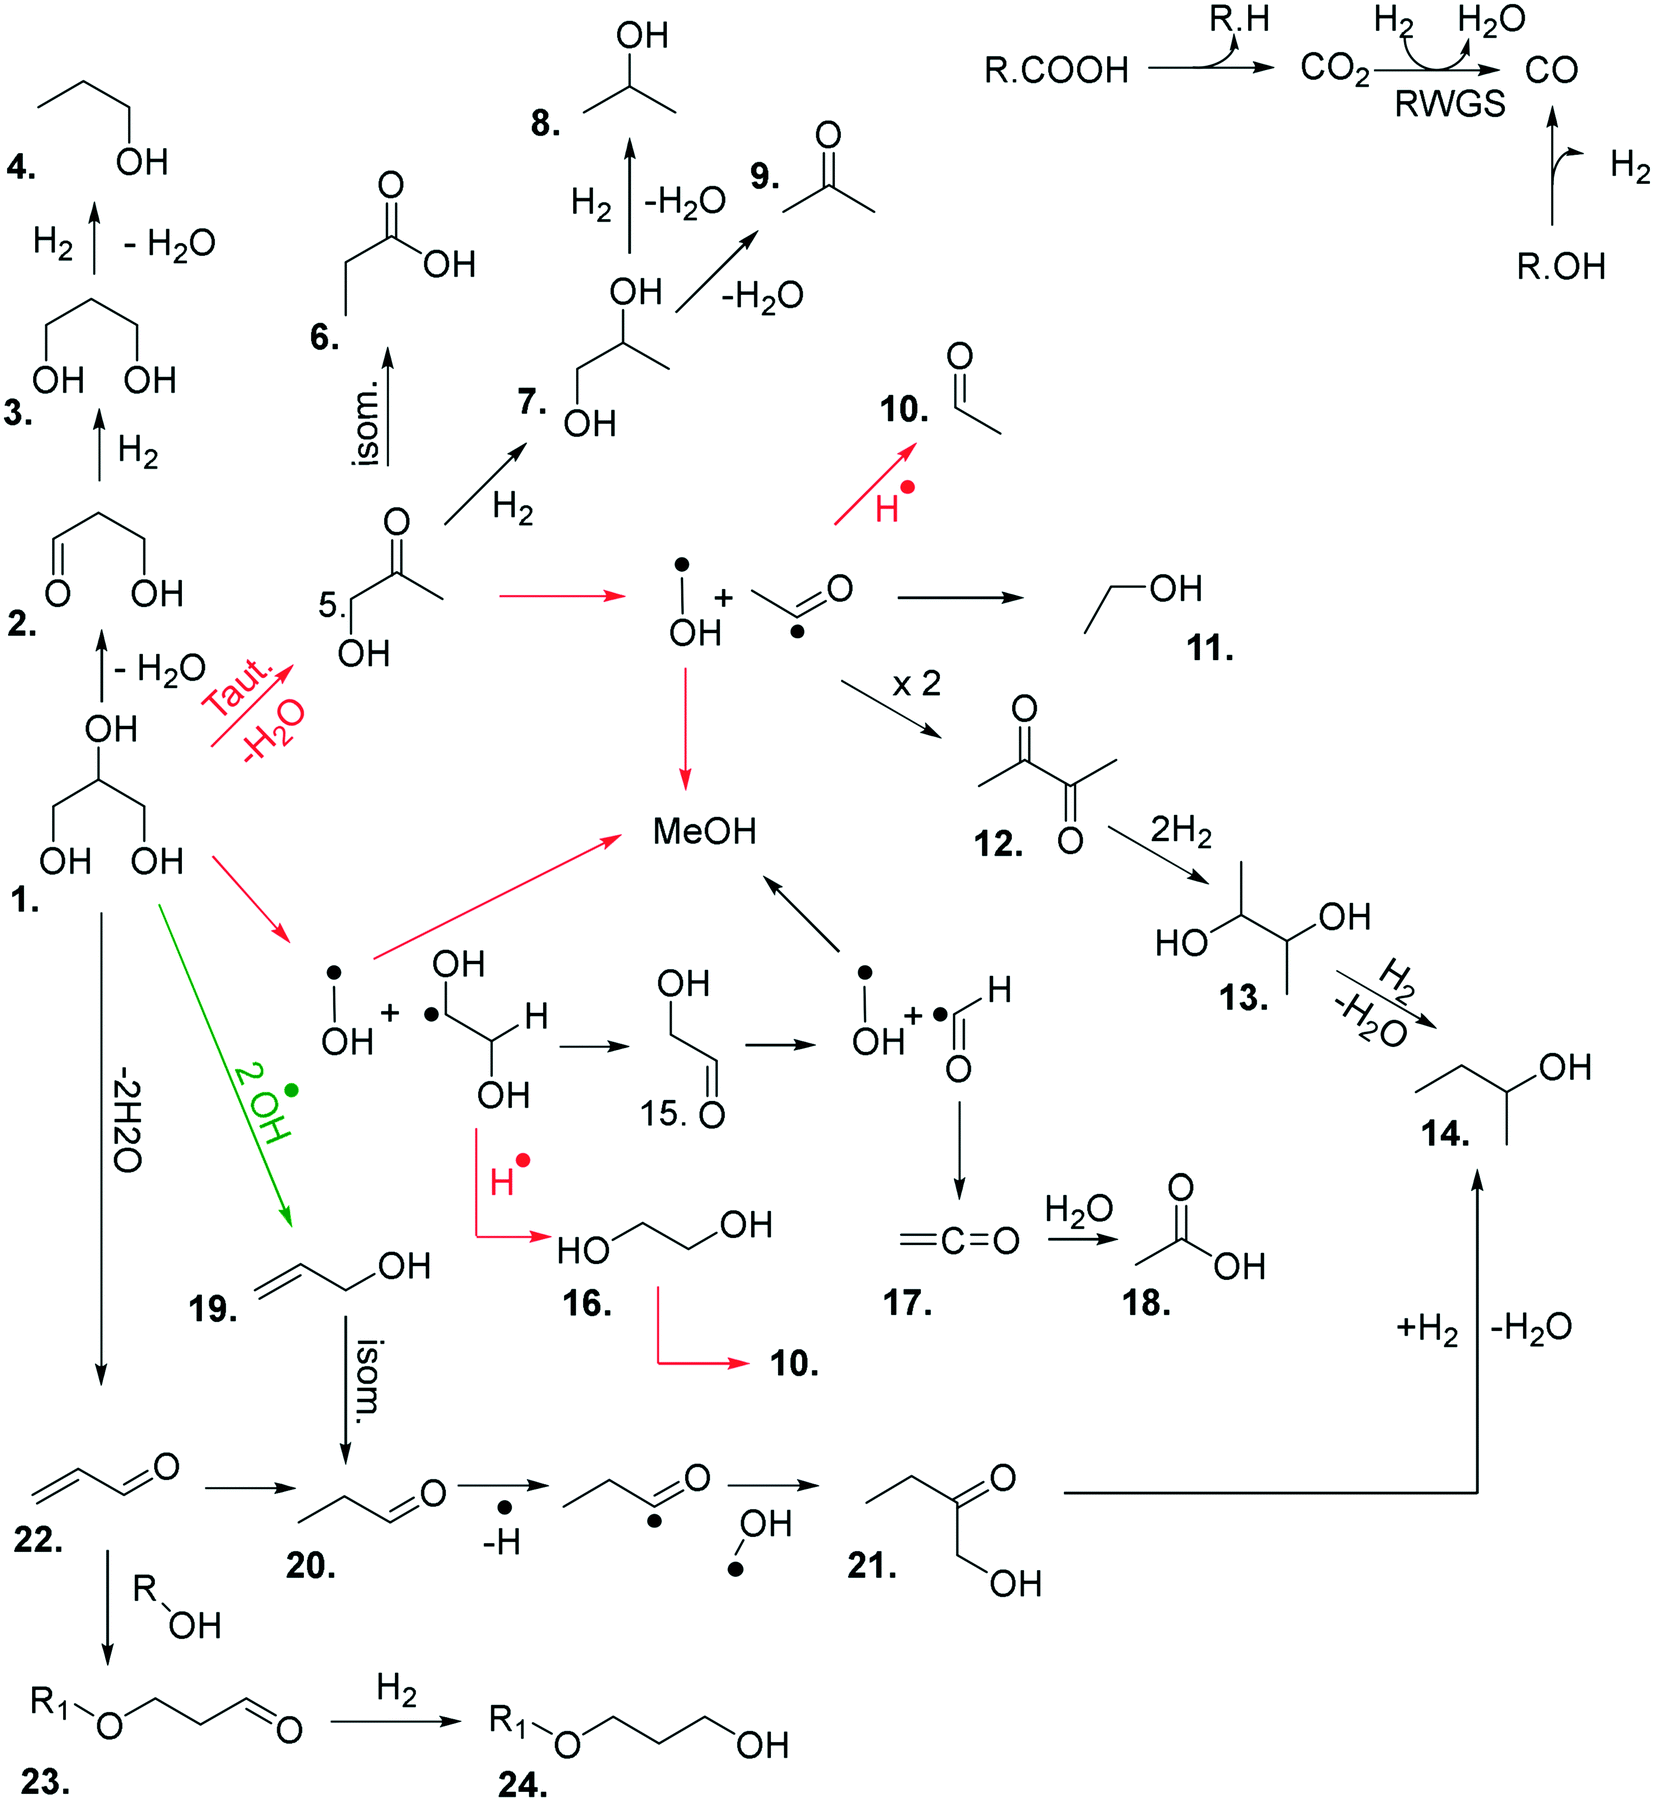 | ||
| Fig. 3 Proposed reaction network for the catalytic transformation of glycerol into a range of different products over MgO under N2. Red arrows correspond to dominant reaction pathways over MgO. The green arrow corresponds to a dominant pathway occurring in the absence of MgO. 1. Glycerol; 2. 3-hydroxypropenal; 3. 1,3-propanediol; 4. 1-propanol; 5. hydroxyacetone; 6. propanoic acid; 7. 1,2-propanediol; 8. 2-propanol; 9. acetone; 10. acetaldehyde; 11. ethanol; 12. 2,3-butanedione; 13. 2,3-butandiol; 14. 2-butanol; 15. glycolaldehyde; 16. ethylene glycol; 17. ethenone; 18. acetic acid; 19. allyl alcohol; 20. 1-propanal; 21. 1-hydroxyl-2-butanone; 22. acrolein; 23. 3-alkoxypropanal; 24. 3-alkoxy propanol. | ||
The glycerol conversion and the yield of the different product groups are displayed in Table 4, where the glycerol to catalyst ratio was varied. Only traces of unconverted glycerol were detected for a 40 wt% feedstock, with complete conversion of glycerol observed with the more dilute feedstocks. Whilst the carbon balance was 77% with a 50 wt% feedstock, a reduction in the glycerol concentration resulted in improved carbon balances. This was to be anticipated, since the formation of high molecular weight products, which are not quantified and therefore not counted in the carbon balance, has been shown to increase with more concentrated glycerol feed-stocks.44,45 Furthermore, the presence of water has been reported to prevent condensation reactions,45 and the reduction in the partial pressure of glycerol and products resulting from more dilute feedstocks could reduce the formation of high molecular weight products. Similar products were observed in each of the reactions; however, the relative yield of the products (Table 4) and product selectivities (Table S5†) did vary. An increase in the catalyst to glycerol ratio did result in an increase in selectivity to aldehydes and alcohols (Fig. 4) particularly acetaldehyde and methanol (Table S5†). The selectivity towards two of the major reaction intermediates, hydroxyacetone and ethylene glycol,35 reduced from 17.9% and 3.6% to 3.6% and 0.2% respectively, upon increasing the ratio of catalyst to glycerol from 0.3 to 1.8 (Table S5†). Additionally, a higher proportion of catalyst (cat:gly 0.8–1.8) resulted in decreased propanediol selectivity (both 1,2- and 1,3-propanediol), with almost complete diol conversion or non-formation with the highest ratio of catalyst to glycerol. These observations are comparable to findings by Montassier et al. where it was reported that ethylene glycol could be readily converted to C1 products after the complete glycerol conversion was achieved.46
| Entry | Glycerol weight% | Cat:gly ratio (g/g) |
C GLY (%) | Mass balanceb (%) | Yieldc (%) | MeOH S.T.Y. (g h−1 kgcat−1) | Carbon deposition (mg g−1) | ||||||||
|---|---|---|---|---|---|---|---|---|---|---|---|---|---|---|---|
| C | H | O | Alc. | Diols | Ald. | Ket. | Ac. | COx | Unk. | ||||||
| a Glycerol conversion. b Carbon mass balance (±3%) of products detected in GC1 and GC2, values in parenthesis include coke deposited on catalyst. c Yield of products detected in GC1 and GC2; Alc., alcohols; Ald., aldehydes; Ket., ketones; Ac., acids; Unk., unknowns (full product list in Table S4). d 100 mg catalyst used. Reaction conditions; 400 °C, glycerol/water flow 0.016 mL min−1, 0.5 g MgO, 50 mL min−1 Ar, 3 hours. | |||||||||||||||
| 1 | 10 | 1.8 | 100 | 83 (84) | 80 | 68 | 36.5 | 0.5 | 20.0 | 8.2 | 0.9 | 8.4 | 8.4 | 61 | 55 |
| 2 | 10 | 0.3d | 96 | 83 (98) | 84 | 67 | 31.2 | 6.9 | 13.9 | 16.3 | 1.0 | 2.7 | 7.8 | 255 | 75 |
| 3 | 20 | 0.8 | 100 | 80 (88) | 76 | 67 | 31.1 | 1.2 | 19.3 | 9.3 | 1.8 | 8.6 | 8.5 | 105 | 80 |
| 4 | 40 | 0.4 | 99 | 78 (81) | 74 | 62 | 27.2 | 2.9 | 17.2 | 14.1 | 1.6 | 6.0 | 7.4 | 219 | 87 |
| 5 | 50 | 0.3 | 90 | 73 (77) | 71 | 61 | 21.4 | 5.2 | 11.0 | 13.6 | 1.7 | 5.1 | 6.2 | 205 | 122 |
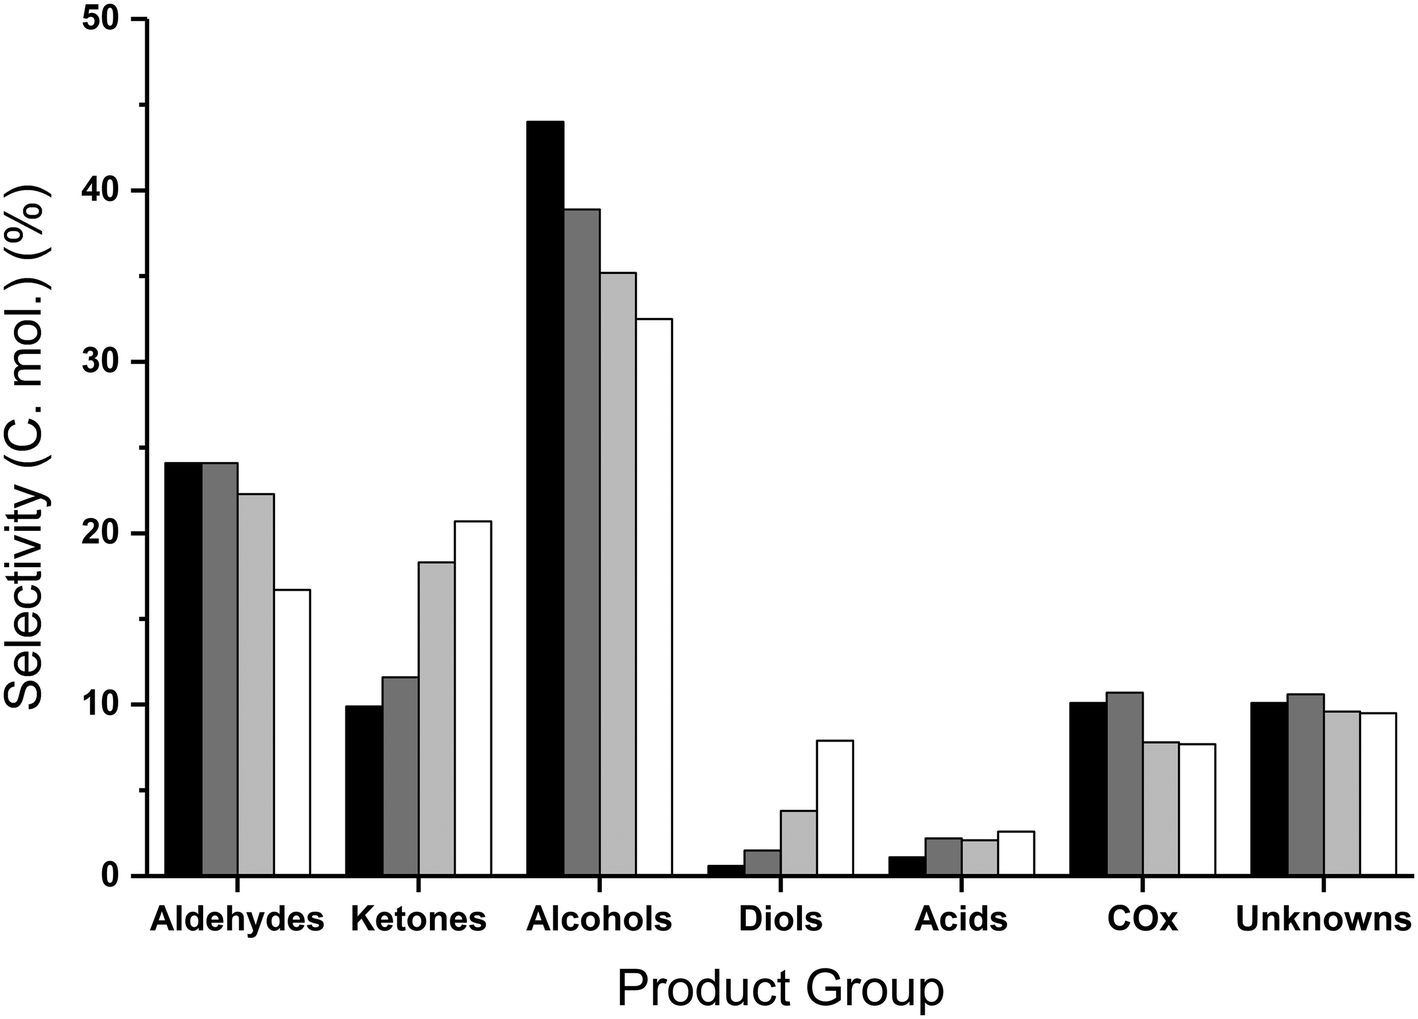 | ||
| Fig. 4 Collected product selectivities expressed as carbon mole selectivity following reaction with 10 wt% (black; catalyst to glycerol {g/g} ratio of 1.8), 20 wt% (dark grey, 0.8) and 40 wt% (light grey, 0.4) and 50 wt% (white, 0.3) over MgO. Reaction conditions; 400 °C, glycerol/water flow 0.016 mL min−1, 0.5 g MgO, 50 mL min−1 Ar, 3 hours. | ||
The increased conversion of reaction intermediates at increased catalyst to glycerol ratios resulted in a decrease in the ketone and diol selectivities and corresponded to an increase in the selectivity to alcohols, aldehydes and COx (Table 4). The methanol selectivity steadily increased with increasing proportions of catalyst, reaching a maximum of 34.9% with a 10 wt% glycerol feedstock and 500 mg of MgO (Table S5†); in addition to methanol, the selectivity towards other mono-alcohols, namely ethanol, 1-propanol and 3-ethoxy propanol, increased with decreasing quantities of glycerol to catalyst. The increased aldehyde yield can be attributed to increasing selectivity to acetaldehyde and propionaldehyde. Where the catalyst mass was kept constant (entries 1 and 3–5 in Table 4), the methanol space time yield reached a maximum using a 40 wt% glycerol feed (219 g h−1 kgcat−1); higher methanol yields were achieved from 40 wt% glycerol compared with 50 wt%, due to the increased glycerol conversion and improved carbon balance. Since complete glycerol conversion was achieved for both 20 and 10 wt% feedstocks, the amount of catalyst present was reduced proportionally. Comparing entries 2 and 4, where the catalyst to glycerol ratio was kept constant, an improved methanol space time yield (255 g h−1 kgcat−1) was achieved from a more dilute feedstock and reduced amount of catalyst. This was attributed to the improved carbon balance and slightly higher methanol selectivity and glycerol conversion. Interestingly, the product selectivities were largely comparable when the glycerol to catalyst ratio was kept the same (Table S5†). For example the selectivity to hydroxyacetone, considered an intermediate, was found to be highest when the GLY:cat was 0.3, suggesting that contact time or the glycerol partial pressure to catalyst surface area ratio are important variables in this reaction to achieve a high methanol selectivity. However, more work is required in order to accurately deconvolute the influence of the contact time and the glycerol partial pressure on the yield of methanol observed.
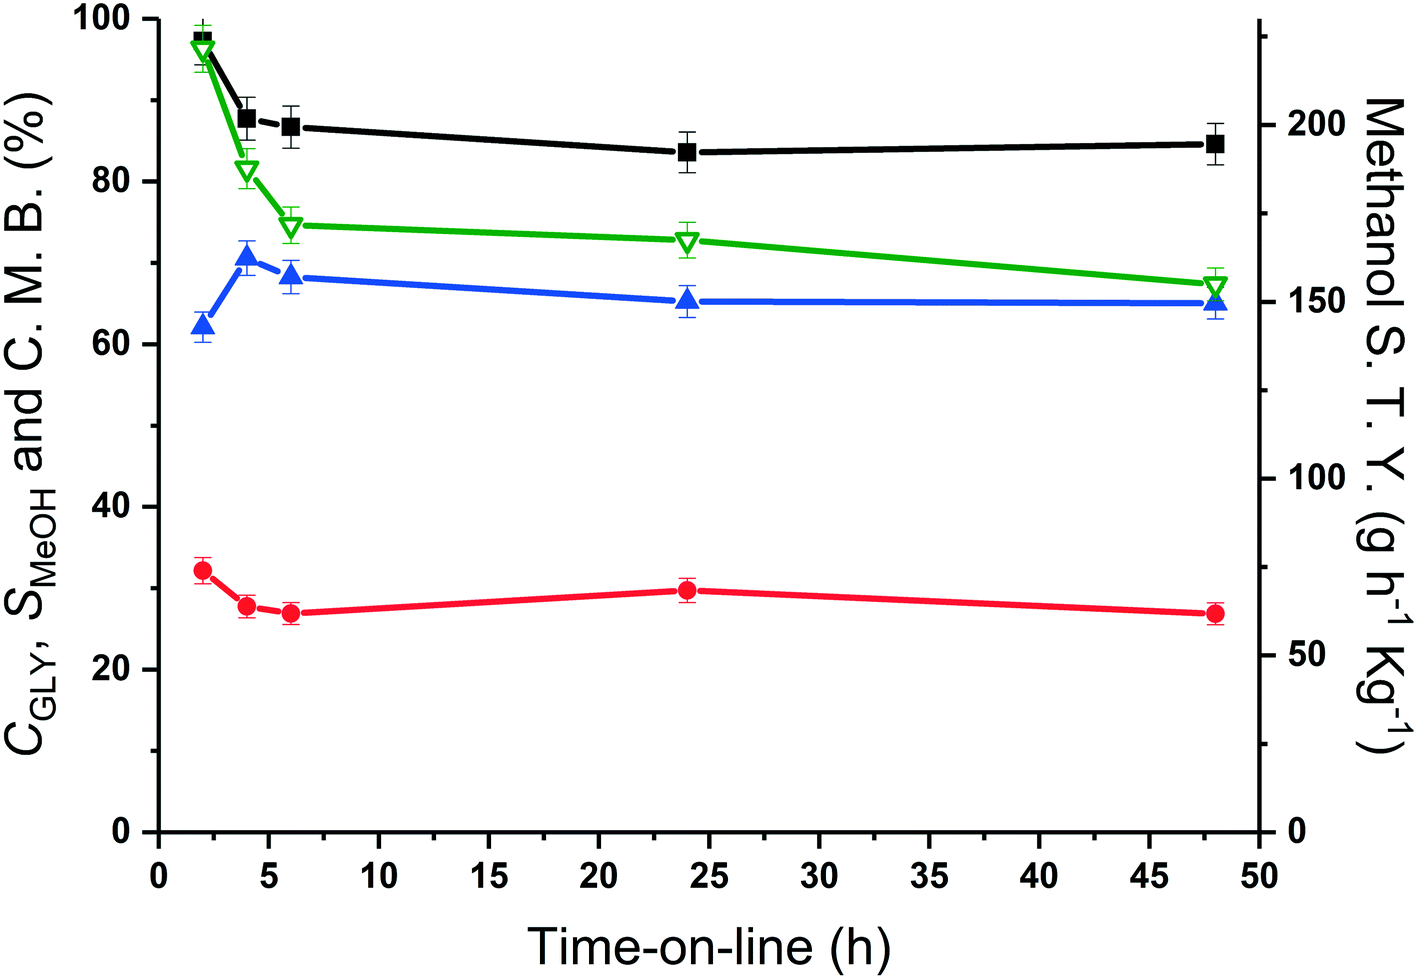 | ||
| Fig. 5 Glycerol conversion (■), methanol selectivity (●), carbon mass balance (▲) and methanol space time yield (▽) over MgO catalyst as a function of reaction time. Reaction conditions; 400 °C, glycerol flow (0.016 mL min−1), 0.5 g MgO, 50 mL min−1 Ar. | ||
The methanol selectivity and space time yield aligned with the trends observed for the glycerol conversion, indicating a period of 4 hours is required for the system to approach steady-state, after which, both conversion levels and product selectivities are quite stable (full product list in Table S6†). This provides further evidence to suggest that only modest catalyst deactivation occurs over the duration of our experiments, despite the low carbon balances observed throughout this period. This is further evidenced by the XRD patterns of the pelleted fresh and used catalyst, displayed in Fig. 6. The Scherrer equation was used to estimate the crystallite size of each material from the (200) reflection; there was no indication of MgO sintering (Table S7†). Large losses in carbon were also observed under similar reaction conditions by Batiot-Dupeyrat and co-workers when studying the conversion of glycerol over basic lanthanum-based materials.34,47
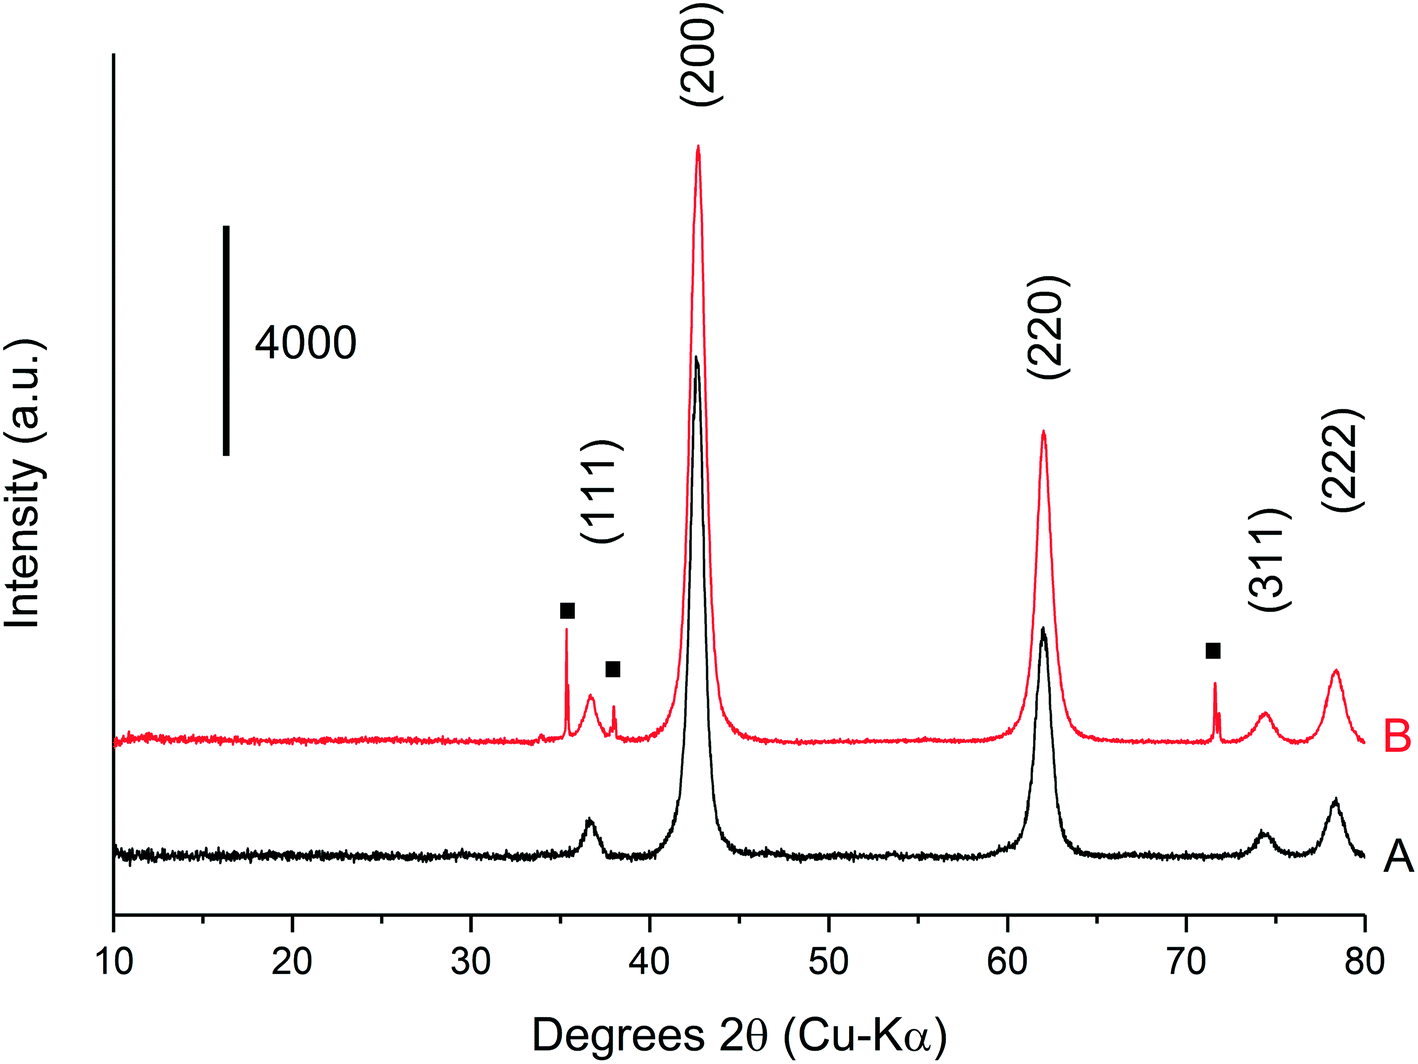 | ||
| Fig. 6 X-Ray diffraction patterns for (A) the fresh, pelleted MgO catalyst and (B) a used pelleted MgO catalyst after reaction with 50 wt% glycerol in H2O for 3 h at 400 °C. Residual SiC from the catalyst bed denoted with (■). | ||
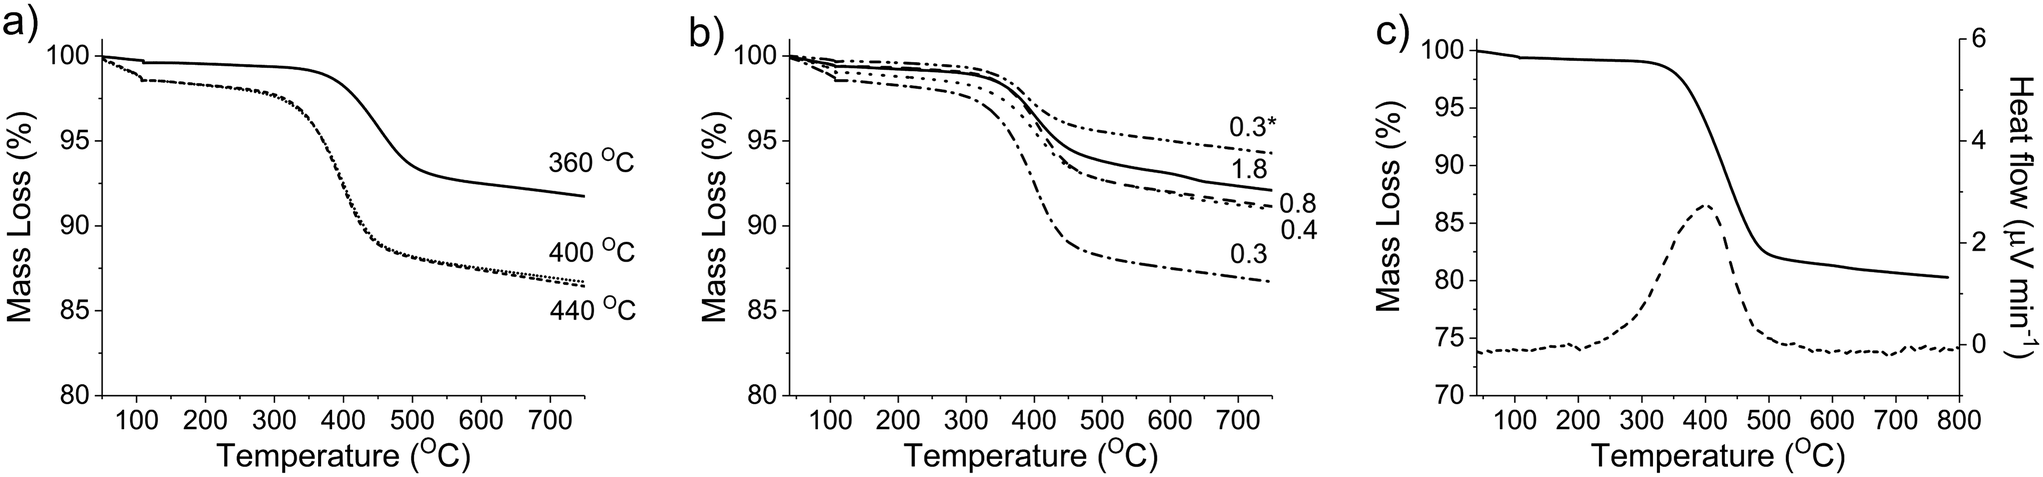 | ||
| Fig. 7 Thermal gravimetric analysis of post reaction samples of MgO; investigating the influence of reaction temperature (a) and glycerol to catalyst ratio (b). The values next to each line refer to the reaction temperature in (a) and the values in (b) refer to glycerol to catalyst ratio. Mass loss and heat flow of a post-reaction MgO sample following a 48 h reaction (solid line = mass loss, dashed line = heat flow) highlighting removal of carbon deposition (c). | ||
From the time-online experiment in Fig. 5, it is evident that the carbon mass balance is lower at the initial stages of the reaction. To investigate this further, an additional TGA experiment was conducted on the MgO catalyst, retrieved after 135 minutes of reaction (Fig. S2†), prior to the onset of a steady glycerol flow. The quantity of coke in this period (80 mg g−1) evidences a non-proportionate correlation between the quantity of coke deposited and reaction time; more coke is deposited during the initial stages of the reaction. As such, it is likely that a proportion of the active sites responsible for the coking and/or production of unknown products are blocked during the initial stages of the reaction and the coke deposited during this initial period assists with the stabilisation of the catalyst surface.
XRD was conducted on a pre- and post-reaction catalyst to ensure that the observed mass losses could not be attributed to a phase change from MgO to Mg(OH)2. It is known that MgO readily hydrates to Mg(OH)2 when exposed to liquid phase water even at room temperature.48 The corresponding XRD is displayed in Fig. 7, and indicates that the post-reaction catalyst from the experiment in Table 4, entry 5 is MgO and confirms that any mass losses observed in the TGA experiments can be attributed to deposition of carbon on the surface of the catalysts during the reaction. Accordingly, the mass lost at 400 °C (Fig. 7) appears to have a positive correlation with the concentration of glycerol in the feed confirming the source of coke is based on the reaction concentration.
The formation of large organic species via intermolecular condensation reactions could also be responsible for some of the missing carbon in the system. The formation of these species typically have reaction orders ≥1.5 with respect to the substrate in the presence of hydrophilic reaction solvents49 and as such, the rate of their formation would likely be dependent on the concentration of reactive substrate/intermediates in the feed. Given that larger quantities of carbon do appear to be lost as the partial pressure of glycerol is increased, it is therefore feasible to suggest that condensation reactions of this nature do occur in the present system. Previous esterification and dimerization reactions have been reported to readily occur in the gas phase with glycerol at comparable reaction temperatures.50 LC-MS was subsequently utilized in an attempt to derive some qualitative evidence for the presence of these larger compounds in a post reaction solution. A reaction was run for 6 h, analysed by GC-FID and subsequently submitted for LC-MS. The calculated carbon mass balance for this sample, based on products observed by GC in the liquid and gas phase, was 68%. The corresponding LC-MS chromatogram is displayed in Fig. S3.† Despite only screening for products and fragments between 100 and 1000 m/z, the chromatogram appears to be extremely complex, which ultimately made compound identification extremely challenging. This does however confirm the presence of numerous large compounds in the post reaction sample. CHN analysis was subsequently carried out on the post reaction solution to determine the total carbon content. By combining the contributions of carbon from coke on the surface of the catalyst, COx and CHN analysis, a total carbon balance of 94.0% was obtained (Table S8†). We consider that the missing carbon (6.0%) is lost through reactor fouling. This further supports the theory that a significant quantity of high molecular weight compounds are present in the post reaction solution, which are not observed by GC-FID analysis. MgO is a basic metal oxide and has been widely studied as a heterogeneous catalyst for base-catalysed reactions.51,52 As such, it seems appropriate to consider whether this property could promote some of the undesirable side reactions, which are evidently occurring. It is known that aldol condensation reactions can readily occur in the gas phase over solid basic oxides53–55 and over MgO in particular, these condensation reactions are typically attributed to the population of basic sites.56 We can conclude that a large quantity of the missing carbon in these reactions is likely attributed to the formation of larger organic species via such intermolecular condensation and/or esterification reactions. These undesirable side reactions appear to be promoted by increasing the reaction temperature and glycerol partial pressure in the feed. Therefore, the challenge from a catalyst design and engineering approach would be to establish a means of reducing these competitive pathways, without influencing the formation of any of the high value products.
4. Conclusions
The formation of methanol from glycerol is a complex reaction with multiple, competing pathways resulting in a diverse range of products. We have attempted to fully analyse the effluent stream by different analytical techniques in order to close the mass balance of a typical reaction. To identify a more complete product list, reaction conditions such as reaction temperature or glycerol concentration were investigated to determine the optimal reaction conditions to form methanol. In general, low reaction temperatures result in high hydroxyacetone selectivities which reduces when the temperature is increased. The reduction of hydroxyacetone concentration is accompanied by an increase in the concentration of undesirable aldehydes. Preventing the formation of aldehydes such as acetaldehyde is crucial as these products could be responsible for the formation of high molecular weight products via condensation reactions over basic sites. As these products are not routinely detected in the GC-FID setup used for reaction analysis, the mass balance calculations do not take these in to account. Despite the relatively high reaction temperatures used, catalyst fouling by carbon deposition on the catalyst was found to be modest and does not appear to be detrimental to the catalyst activity over 48 h. The low mass balance of the reaction at ca. 75% is in part due to the formation of high molecular weight products, the presence of which in the post reaction effluent was confirmed by LC-MS and TOC analysis. Optimisation of the catalyst surface in order to reduce aldehyde formation should be a priority going forward.Conflicts of interest
The authors declare no competing financial interest.Acknowledgements
We would like to thank the EPSRC for funding this work (Grant reference codes: EP/P033695/1 and EP/L027240/1). The authors would also like to thank Exeter Analytical UK Ltd. for the Total Organic Content analysis. We would also like to acknowledge Thomas Williams for assistance with the operation of and processing of the LC-MS data. Information on the data underpinning the results presented here can be found in the Cardiff University data catalogue at [http://doi.org/10.17035/d.2018.0049493818].References
- D. M. Alonso, J. Q. Bond and J. A. Dumesic, Green Chem., 2010, 12, 1493–1513 RSC.
- P. M. Mortensen, J. D. Grunwaldt, P. A. Jensen, K. G. Knudsen and A. D. Jensen, Appl. Catal., A, 2011, 407, 1–19 CrossRef CAS.
- IRENA, Renewable Energy Policies in a Time of Transition, 2018, ISBN 978-92-9260-061-7 Search PubMed.
- E. Lotero, Y. J. Liu, D. E. Lopez, K. Suwannakarn, D. A. Bruce and J. G. Goodwin, Ind. Eng. Chem. Res., 2005, 44, 5353–5363 CrossRef CAS.
- D. E. Lopez, J. G. Goodwin and D. A. Bruce, J. Catal., 2007, 245, 381–391 CrossRef CAS.
- IRENA, Boosting Biofuels. Sustainable Paths to Greater Energy Security, 2016, 978-92-95111-84-4 Search PubMed.
- IRENA, Innovation Outlook. Advanced Liquid Biofuels, 2016, 978-92-95111-52-3 Search PubMed.
- C. H. C. Zhou, J. N. Beltramini, Y. X. Fan and G. Q. M. Lu, Chem. Soc. Rev., 2008, 37, 527–549 RSC.
- M. Pagliaro, R. Ciriminna, H. Kimura, M. Rossi and C. Della Pina, Angew. Chem., Int. Ed., 2007, 46, 4434–4440 CrossRef CAS PubMed.
- Q. He, J. McNutt and J. Yang, Renewable Sustainable Energy Rev., 2017, 71, 63–76 CrossRef CAS.
- G. L. Brett, Q. He, C. Hammond, P. J. Miedziak, N. Dimitratos, M. Sankar, A. A. Herzing, M. Conte, J. A. Lopez-Sanchez, C. J. Kiely, D. W. Knight, S. H. Taylor and G. J. Hutchings, Angew. Chem., Int. Ed., 2011, 50, 10136–10139 CrossRef CAS PubMed.
- D. Sun, Y. Yamada, S. Sato and W. Ueda, Appl. Catal., B, 2016, 193, 75–92 CrossRef CAS.
- S. A. Kondrat, P. J. Miedziak, M. Douthwaite, G. L. Brett, T. E. Davies, D. J. Morgan, J. K. Edwards, D. W. Knight, C. J. Kiely, S. H. Taylor and G. J. Hutchings, ChemSusChem, 2014, 7, 1326–1334 CrossRef CAS PubMed.
- S. T. Williamson, K. Shahbaz, F. S. Mjalli, I. M. AlNashef and M. M. Farid, Renewable Energy, 2017, 114, 480–488 CrossRef CAS.
- R. K. P. Purushothaman, J. van Haveren, D. S. van Es, I. Melian-Cabrera and H. J. Heeres, Green Chem., 2012, 14, 2031–2037 RSC.
- F. Frusteri, F. Arena, G. Bonura, C. Cannilla, L. Spadaro and O. Di Blasi, Appl. Catal., A, 2009, 367, 77–83 CrossRef CAS.
- J. A. Melero, G. Vicente, G. Morales, M. Paniagua, J. M. Moreno, R. Roldan, A. Ezquerro and C. Perez, Appl. Catal., A, 2008, 346, 44–51 CrossRef CAS.
- M. Rueping and V. B. Phapale, Green Chem., 2012, 14, 55–57 RSC.
- B. Katryniok, S. Paul, V. Belliere-Baca, P. Rey and F. Dumeignil, Green Chem., 2010, 12, 2079–2098 RSC.
- M. H. Haider, N. F. Dummer, D. Z. Zhang, P. Miedziak, T. E. Davies, S. H. Taylor, D. J. Willock, D. W. Knight, D. Chadwick and G. J. Hutchings, J. Catal., 2012, 286, 206–213 CrossRef CAS.
- M. H. Haider, C. D'Agostino, N. F. Dummer, M. D. Mantle, L. F. Gladden, D. W. Knight, D. J. Willock, D. J. Morgan, S. H. Taylor and G. J. Hutchings, Chem. – Eur. J., 2014, 20, 1743–1752 CrossRef CAS PubMed.
- A. Talebian-Kiakalaieh, N. A. S. Amin and H. Hezaveh, Renewable Sustainable Energy Rev., 2014, 40, 28–59 CrossRef CAS.
- K. N. Papageridis, G. Siakavelas, N. D. Charisiou, D. G. Avraam, L. Tzounis, K. Kousi and M. A. Goula, Fuel Process. Technol., 2016, 152, 156–175 CrossRef CAS.
- L. Pastor-Perez and A. Sepulveda-Escribano, Fuel, 2017, 194, 222–228 CrossRef CAS.
- C. T. Wu, K. M. K. Yu, F. L. Liao, N. Young, P. Nellist, A. Dent, A. Kroner and S. C. E. Tsang, Nat. Commun., 2012, 3, 1050 CrossRef PubMed.
- Y. H. Feng, H. B. Yin, L. Q. Shen, A. L. Wang, Y. T. Shen and T. S. Jiang, Chem. Eng. Technol., 2013, 36, 73–82 CrossRef CAS.
- S. H. Chai, H. P. Wang, Y. Liang and B. Q. Xu, Green Chem., 2007, 9, 1130–1136 RSC.
- Y. T. Kim, K. D. Jung and E. D. Park, Appl. Catal., B, 2011, 107, 177–187 CrossRef CAS.
- M. Morales, P. Y. Dapsens, I. Giovinazzo, J. Witte, C. Mondelli, S. Papadokonstantakis, K. Hungerbühler and J. Pérez-Ramírez, Energy Environ. Sci., 2015, 8, 558–567 RSC.
- S. C. D'Angelo, A. Dall'Ara, C. Mondelli, J. Pérez-Ramírez and S. Papadokonstantakis, ACS Sustainable Chem. Eng., 2018, 6, 16563–16572 CrossRef.
- G. M. Lari, G. Pastore, M. Haus, Y. Ding, S. Papadokonstantakis, C. Mondelli and J. Pérez-Ramírez, Energy Environ. Sci., 2018, 11, 1012–1029 RSC.
- M. H. Haider, N. F. Dummer, D. W. Knight, R. L. Jenkins, M. Howard, J. Moulijn, S. H. Taylor and G. J. Hutchings, Nat. Chem., 2015, 7, 1028–1032 CrossRef CAS PubMed.
- C. L. Lima, S. J. S. Vasconcelos, J. Mendes, B. C. Viana, M. G. C. Rocha, P. Bargiela and A. C. Oliveira, Appl. Catal., A, 2011, 399, 50–62 CrossRef CAS.
- D. Hernandez, M. Velasquez, P. Ayrault, D. Lopez, J. J. Fernandez, A. Santamaria and C. Batiot-Dupeyrat, Appl. Catal., A, 2013, 467, 315–324 CrossRef CAS.
- M. H. Haider, N. F. Dummer, D. W. Knight, R. L. Jenkins, M. Howard, J. Moulijn, S. H. Taylor and G. J. Hutchings, Nat. Chem., 2015, 7, 1028–1032 CrossRef CAS PubMed.
- D. C. Foyt and J. M. White, J. Catal., 1977, 47, 260–268 CrossRef CAS.
- S. H. Liang and I. D. Gay, Langmuir, 1985, 1, 593–599 CrossRef CAS.
- J. S. Francisco, J. Chem. Phys., 1992, 96, 1167–1175 CrossRef CAS.
- N. Akiya and P. E. Savage, AIChE J., 1998, 44, 405–415 CrossRef CAS.
- T. Shido, K. Asakura and Y. Iwasawa, J. Catal., 1990, 122, 55–67 CrossRef CAS.
- B. Katryniok, S. Paul, M. Capron and F. Dumeignil, ChemSusChem, 2009, 2, 719–730 CrossRef CAS PubMed.
- W. Yan and G. J. Suppes, Ind. Eng. Chem. Res., 2009, 48, 3279–3283 CrossRef CAS.
- R. B. Mane and C. V. Rode, Org. Process Res. Dev., 2012, 16, 1043–1052 CrossRef CAS.
- A. Talebian-Kiakalaieh and N. A. S. Amin, Ind. Eng. Chem. Res., 2015, 54, 8113–8121 CrossRef CAS.
- C. Liu, R. Liu and T. F. Wang, Can. J. Chem. Eng., 2015, 93, 2177–2183 CrossRef CAS.
- C. Montassier, D. Giraud and J. Barbier, Stud. Surf. Sci. Catal., 1988, 41, 165–170 CrossRef CAS.
- M. Velasquez, A. Santamaria and C. Batiot-Dupeyrat, Appl. Catal., B, 2014, 160, 606–613 CrossRef.
- M. Douthwaite, X. Huang, S. Iqbal, P. J. Miedziak, G. L. Brett, S. A. Kondrat, J. K. Edwards, M. Sankar, D. W. Knight, D. Bethell and G. J. Hutchings, Catal. Sci. Technol., 2017, 7, 5284–5293 RSC.
- F. J. Doering and G. F. Schaefer, J. Mol. Catal., 1987, 41, 313–328 CrossRef CAS.
- M. Kapkowski, T. Siudyga, R. Sitko, J. Lelatko, J. Szade, K. Balin, J. Klimontko, P. Bartczak and J. Polanski, PLoS One, 2015, 10 Search PubMed.
- A. O. Menezes, P. S. Silva, E. P. Hernandez, L. E. P. Borges and M. A. Fraga, Langmuir, 2010, 26, 3382–3387 CrossRef CAS PubMed.
- C. L. Xu, J. K. Bartley, D. I. Enache, D. W. Knight and G. J. Hutchings, Synthesis, 2005, 3468–3476, DOI:10.1055/s-2005-918467.
- A. M. Hernandez-Gimenez, J. Ruiz-Martinez, B. Puertolas, J. Perez-Ramirez, P. C. A. Bruijnincx and B. M. Weckhuysen, Top. Catal., 2017, 60, 1522–1536 CrossRef CAS.
- J. Quesada, L. Faba, E. Diaz and S. Ordonez, Appl. Catal., A, 2017, 542, 271–281 CrossRef CAS.
- A. Chieregato, J. V. Ochoa, C. Bandinelli, G. Fornasari, F. Cavani and M. Mella, ChemSusChem, 2015, 8, 377–388 CrossRef CAS PubMed.
- J. I. DiCosimo, V. K. Diez and C. R. Apesteguia, Appl. Catal., A, 1996, 137, 149–166 CrossRef CAS.
Footnote |
| † Electronic supplementary information (ESI) available. See DOI: 10.1039/c8cy02214c |
| This journal is © The Royal Society of Chemistry 2019 |