 Open Access Article
Prominent role of mesopore surface area and external acid sites for the synthesis of polyoxymethylene dimethyl ethers (OME) on a hierarchical H-ZSM-5 zeolite†
Christophe J.
Baranowski
 a,
Ali M.
Bahmanpour
a,
Florent
Héroguel
a,
Jeremy S.
Luterbacher
a,
Ali M.
Bahmanpour
a,
Florent
Héroguel
a,
Jeremy S.
Luterbacher
 a and
Oliver
Kröcher
 *ab
*ab
aInstitute of Chemical Sciences and Engineering, École polytechnique fÉdÉrale de Lausanne (EPFL), route cantonale, 1015 Lausanne, Switzerland
bBioenergy and Catalysis Laboratory, Paul Scherrer Institut, 5232 Villigen PSI, Switzerland. E-mail: oliver.kroecher@psi.ch; Tel: +41 (0)56 310 20 66
First published on 18th December 2018
Abstract
H-ZSM-5 zeolite has been shown to be an active catalyst for the synthesis of polyoxymethylene dimethyl ethers (OME). However, we demonstrated – by passivation of the zeolite's external surface – that the reaction rate is limited due to severe internal diffusion limitations of the reactants and products. External acid sites thus played a more prominent role in the observed overall reaction rate compared to the acid sites in the zeolite's micropores. Through controlled introduction of an intercrystalline network of mesopores the zeolite's activity was significantly enhanced by allowing a more significant part of the reaction to take place within the zeolite's micropores. By optimising alkaline treatment and consequent acid wash of H-ZSM-5, we achieved a two-fold increase in the initial reaction rate and a 10% increase in selectivity towards OME with 3 to 5 oxymethylene units (OME3–5), which are the more desirable products.
Introduction
Due to their high surface area and adjustable Si/Al ratio, zeolites are attractive for a wide range of applications ranging from catalytic cracking to water softening.1,2 These aluminosilicate materials are structured to provide ordered, uniform channels of molecular dimensions. Their Ångstrom-level size results in pronounced shape-selectivity widely applied in various processes including alkylation of toluene and isomerization of n-butene.3,4 However, these small channels often induce mass transport limitations, lowering the effective active zeolite volume.5 This limitation reduces their performance as catalysts for reactions involving bulky molecules, especially in the liquid-phase.6–8 Recently, this drawback was circumvented by the addition of an auxiliary network of mesopores leading to a hierarchical material.9,10 Amongst several possible treatment strategies, desilication by alkaline treatment prevails as an affordable and scalable post-synthetic treatment.11 Besides accelerating the reaction by improving access to the zeolite crystals, mesoporosity can also influence the selectivity.12 Notably, using supported ruthenium nanoparticles on mesoporous zeolites, Cheng et al. reported a deviation from the Anderson–Schulz–Flory (ASF) distribution during the Fischer–Tropsch synthesis.13Polyoxymethylene dimethyl ethers (OME) are a promising, new type of biofuels that recently demonstrated remarkable properties as green alternatives to Diesel.14–18 They are oligomers capped by methyl- and methoxy-groups and composed of a varying number of oxymethylene units that defines their chain length. The latter property controls their physico-chemical properties. OME possessing a chain length between 3–5 (OME3–5) are most attractive due to their compatibility with diesel engines and existing fuel infrastructure.19,20 Their synthesis process is acid-catalysed and requires both a methyl- and an oxymethylene group provider. Various synthesis paths exist but the anhydrous route (Scheme 1), involving trioxane (TRI) and dimethoxymethane (OME1), was shown to achieve the maximal yield of OME3–5 with the highest reaction rate.21 Water is known to affect the kinetics and the thermodynamic equilibrium of OME synthesis.22 Lautenschütz et al. demonstrated that through complete drying of the reactants, the equilibrium can be reached in under 15 min at 25 °C using H-Beta zeolite as the catalyst.23 However, fulfilling these conditions on an industrial scale is difficult. Additionally, the reaction mechanism of OME synthesis from TRI and OME1 still remains elusive.
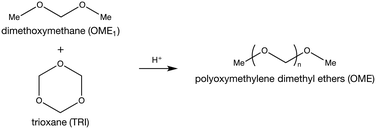 | ||
| Scheme 1 Synthesis of polyoxymethylene dimethyl ether (OME) from dimethoxymethane (OME1) and trioxane (TRI). | ||
It is believed that the OME synthesis occurs via insertion of formaldehyde units, generated by TRI decomposition, into OME1.24 Studies have demonstrated that OME1 is activated to form a carbocation or a hemiformal.24 Recently, Goncalves et al. demonstrated that TRI insertion into OME1 on H-Beta is more favourable than insertion of formaldehyde units formed from TRI decomposition.25 However, a statistical ASF distribution is still observed, since the transfer of oxymethylene units between two OME molecules (i.e. transacetalyzation) occur faster than TRI insertion. The high rate of transacetalyzation prevents a preferential OME chain length distribution (i.e. a higher concentration of OME4 or OME7 compared to other OME).
Various types of aluminosilicates were found to be active for OME synthesis. H-Y, H-ZSM-5, H-Beta and H-MCM-22 were proposed as active catalysts for the OME synthesis process.26 Wu et al. identified H-ZSM-5 with a high Si/Al ratio as an efficient catalyst.27 Fu et al. achieved a superior performance using super-microporous aluminosilicates.28 Al-SBA-15, an ordered mesoporous material containing mainly aluminium, also catalysed the reaction demonstrating the activity of Lewis acidity in this reaction.29 Despite having a superior surface area and a high concentration of acidic sites, zeolites typically have lower activities compared to acidic resins for OME synthesis.30 One of the reasons might be that OME are bulky molecules having a gauche preferential conformation due to anomeric stabilization, hampering diffusion into a zeolite's micropores.31,32
Therefore, in this study we focused on the following two unaddressed questions on the synthesis of OME: firstly, how does mass-transfer limitation affect the performance of the catalyst? Secondly, do external sites have a more prominent role compared to the internal sites in the catalytic reaction? We addressed these questions by varying the active sites accessibility on a H-ZSM-5 zeolite using two strategies (Scheme 2) in order to change the internal diffusion limitations. On the one hand, we introduced a secondary network of mesopores by desilication and subsequent acid wash to decrease the effect of internal diffusion limitations in the zeolite crystals. On the other hand, we passivated the external surface of the zeolite by selective silanation and epitaxial growth of a silicate-1 layer to block all the sites that are unaffected by internal diffusion. Precise quantification of mass transfer limitations within the zeolite crystal is out of the scope of this study, nevertheless, it aims to investigate the overall, qualitative effect of internal mass transfer in a H-ZSM-5 zeolite for OME synthesis.
Experimental section
Chemicals and materials synthesis
All reagents were of analytical grade and obtained from commercial suppliers. They were used without further purification. H-ZSM-5 and 2,6-di-tert-butyl-pyridine (97%) were purchased from ABCR. Trioxane (99%), dimethoxymethane (99.0%), tetraethyl orthosilicate (99.999%), tetrapropylammonium hydroxide (1.0 M), ammonium nitrate (99.0%) and methyl formate (anhydrous, 99%) were obtained from Sigma Aldrich. Hydrochloric acid (1.0 M) was purchased from Fluka. NaOH (99.0%) was obtained from Roth. 3-Aminopropyl-triethoxylsilane (99%) was purchased from Acros. OME2 to OME6 (99.0%) were purchased from ASG Analytics.Introduction of mesoporosity
Mesoporous H-ZSM-5 zeolites were synthesized by 30 min of alkaline treatment (AT30) as described by Verboekend et al.33 Typically, the H-ZSM-5 zeolite (3.3 g) was stirred in a NaOH solution (100 mL, 0.2–1.0 M) for 30 min at 65 °C. After quenching the solution with ice, the powder was filtered and washed with DI water (samples are denoted H-ZSM-5-AT30). If the alkaline concentration is not mentioned, a 0.2 M NaOH solution was used for the treatment. Some samples were subsequently dealuminated with an acid wash (AW) during which the powder was stirred in a 0.02 M HCl solution (100 mL g−1 zeolite) at 65 °C (samples are denoted H-ZSM-5-AT30-AW). The powder was recovered by filtration. The protonic form of the sample was then obtained by three successive ion-exchange with NH4NO3 (100 mL g−1 zeolite, 65 °C). Finally, the sample was calcined under static air for 5 h at 550 °C with a 5 °C min−1 heating ramp.Passivation of H-ZSM-5 crystals
Passivation of external Brønsted acid sites was carried out by two methods: selective silanation and epitaxial growth of silicalite-1. Selective silanation of the external sites was performed according to the protocol presented by Ding et al.34 H-ZSM-5 (3.3 g) was stirred with an ethanol solution (33 mL) containing 0.49 g of 3-aminopropyl-triethoxylsilane. After 2 min of sonication to break agglomerates, the solvent was evaporated at 60 °C. The sample (H-ZSM-5@SiO2) was then calcined under static air for 5 h at 550 °C with a 5 °C min−1 heating ramp. The bulky organosilane molecule only reacts with external acidic hydroxyl groups to form SiOx species after calcination. The second passivation method was performed by epitaxial growth of silicalite-1 according to the method of Ghorbanpour et al.35 A growth solution (225 g) was prepared with a molar ratio of 17 tetraethyl orthosilicate (TEOS)![[thin space (1/6-em)]](https://www.rsc.org/images/entities/char_2009.gif) :
:![[thin space (1/6-em)]](https://www.rsc.org/images/entities/char_2009.gif) 14 tetrapropylammonium hydroxide (TPAOH)
14 tetrapropylammonium hydroxide (TPAOH)![[thin space (1/6-em)]](https://www.rsc.org/images/entities/char_2009.gif) :
:![[thin space (1/6-em)]](https://www.rsc.org/images/entities/char_2009.gif) 9500 H2O by adding TEOS dropwise in a TPAOH solution. After stirring overnight, 2.25 g of untreated H-ZSM-5 was added and the solution was sonicated for 5 min. The solution was transferred in a Teflon-lined Parr reactor and hydrothermally treated at 100 °C for 24 h. Then, the solution was filtered and washed with deionised water. Finally, the zeolite was obtained in its protonic form (H-ZSM-5@S-1) by three successive ion-exchange treatments for 16 h in a 0.2 M NH4NO3 solution at 65 °C.
9500 H2O by adding TEOS dropwise in a TPAOH solution. After stirring overnight, 2.25 g of untreated H-ZSM-5 was added and the solution was sonicated for 5 min. The solution was transferred in a Teflon-lined Parr reactor and hydrothermally treated at 100 °C for 24 h. Then, the solution was filtered and washed with deionised water. Finally, the zeolite was obtained in its protonic form (H-ZSM-5@S-1) by three successive ion-exchange treatments for 16 h in a 0.2 M NH4NO3 solution at 65 °C.
Material characterization
N2 physisorption experiments were performed using a Micrometrics 3Flex apparatus at liquid nitrogen temperature and N2 relative pressures between 10−5 and 0.99. Typically, samples (ca. 150 mg) were dried at 120 °C (temperature ramp 5 °C min−1) for 5 h. A leak test was performed before the analysis. Brunauer–Emmett–Teller (BET) surface, Barrett–Joyner–Halenda (BJH) and t-plot (Harkins and Jura model) methods were used to calculate the specific surface area, mesoporous and microporous volume, respectively.Elemental analyses were performed using inductively coupled plasma optical emission spectrometry (ICP-OES) on a Vista pro AX Varian instrument. 50 mg of zeolites were digested in a 10 mL aqueous solution containing 0.5 mL of 65% nitric acid, 0.5 mL of 40% hydrofluoric acid and 0.25 mL of 30% hydrochloric acid for 2 h at 95 °C.
X-ray diffraction (XRD) patterns were recorded using a D8 advance Bruker instrument (Cu Kα radiation, no monochromator, Ni filter) equipped with a 1D-LynxEye detector. XRD patterns were recorded with a step size of 0.01.
Magic angle spinning (MAS) solid-state nuclear magnetic resonance (NMR) spectra were collected on a 400 MHz Bruker AVANCEIIIHD Bruker instrument spectrometer equipped with a Bruker 2.5 mm solid probe H/X/Y at a spinning speed of 35 kHz and a recording frequency of 104.26 MHz with a 2 s time interval.
The structures of the samples were observed by high-angle annular dark-field scanning transmission electron microscopy (HAADF-STEM) on a FEI Tecnai Osiris with 200 kV acceleration voltage using the atomic number contrast (Z contrast). Samples were prepared by directly depositing a drop of solution containing the powder on a Lacey carbon grid. The results of the energy-dispersive X-ray spectroscopy were analyzed using Bruker Esprit Software.
The concentration of the acid sites was calculated using NH3 temperature programmed desorption (TPD) technique on a Micromeritics Autochem 2920 II instrument. Typically, the samples (ca. 100 mg) were loaded in a U-shaped quartz cell and dried with a He flow (50 mL min−1) at 500 °C (2 °C min−1; hold time of 120 min). Saturation of the samples with NH3 was done using a 1![[thin space (1/6-em)]](https://www.rsc.org/images/entities/char_2009.gif) :
:![[thin space (1/6-em)]](https://www.rsc.org/images/entities/char_2009.gif) 99 NH3
99 NH3![[thin space (1/6-em)]](https://www.rsc.org/images/entities/char_2009.gif) :
:![[thin space (1/6-em)]](https://www.rsc.org/images/entities/char_2009.gif) He (volumetric ratio) during 1 h at 100 °C. Physisorbed NH3 was then removed with He (50 mL min−1). The temperature was then increased to 500 °C (10 ° C min−1) and NH3 was monitored using a calibrated thermal conductivity detector. Acidity of the external surfaces was characterized by temperature programmed desorption of 2,6-di-tert-butyl-pyridine (DTBPy). The same method as our NH3-TPD technique was used except that the saturation of the samples was done using 50 loops of 0.1 mL of saturated vapor of DTBPy at 150 °C instead of NH3
He (volumetric ratio) during 1 h at 100 °C. Physisorbed NH3 was then removed with He (50 mL min−1). The temperature was then increased to 500 °C (10 ° C min−1) and NH3 was monitored using a calibrated thermal conductivity detector. Acidity of the external surfaces was characterized by temperature programmed desorption of 2,6-di-tert-butyl-pyridine (DTBPy). The same method as our NH3-TPD technique was used except that the saturation of the samples was done using 50 loops of 0.1 mL of saturated vapor of DTBPy at 150 °C instead of NH3![[thin space (1/6-em)]](https://www.rsc.org/images/entities/char_2009.gif) :
:![[thin space (1/6-em)]](https://www.rsc.org/images/entities/char_2009.gif) He mixture. An MKS Cirrus II mass spectrometer monitored the desorption (mass 149 corresponding to 2-tert-butyl-6-methylpyridine). As no calibration was performed, the measurements were only qualitative.
He mixture. An MKS Cirrus II mass spectrometer monitored the desorption (mass 149 corresponding to 2-tert-butyl-6-methylpyridine). As no calibration was performed, the measurements were only qualitative.
Diffuse reflectance infrared Fourier transform (DRIFT) spectra were recorded using a high temperature Harrick DRIFT cell mounted on a Perkin Elmer Frontier spectrometer equipped with a mercury cadmium telluride detector. Typical pyridine adsorption experiments were carried out with the following procedure. Samples were dried for 2 h under a 20 mL min−1 He flow at 400 °C. They were then saturated with pyridine at 50 °C using a 20 mL min−1 He flow passing through a pyridine bubbler. Physisorbed pyridine was removed at 50 °C by flowing pure He (20 mL min−1) for 30 min. The temperature was increased to 150 °C and finally 300 °C with a 5 °C min−1 ramp rate. Spectra were recorded with 32 scans at a resolution of 4 cm−1.
Catalytic tests
Synthesis of OME was performed in 450 mL stirred batch reactor (Parr) manufactured in 316 stainless steel under a pressure of 5 bar of N2 (Fig. 1). Typically, 30.83 g of TRI and 85.93 g of OME1 were loaded into the reactor which was then purged 3 times with 5 bar of N2 before beginning the stirring at 450 RPM and heating the mixture to the reaction temperature. The temperature was measured by a J-type thermocouple and the pressure by a membrane pressure gauge. The reactor was thermostated with an electrically heated jacket. The catalyst (0.5 wt%) was loaded using a solid charging system and the catalyst injection was considered as the starting time of the reaction. Samples (0.3 μl) were taken using a dip tube combined with a heat exchanger to cool the samples to 30 °C.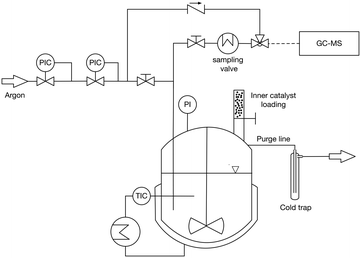 | ||
| Fig. 1 Schematic of the 450 mL stirred batch reactor. PI, pressure indicator, TIC, temperature indicator and control; PIC, pressure indicator and control. | ||
An Agilent 7890B/5977A series gas chromatograph-mass spectrometer (GC-MS) equipped with an HP-5 capillary column (length 30 m, outer diameter 0.32 mm, film 1.05 μm) and an automated liquid sampler was used for the analysis of the liquid samples. A dean switch was used to send the eluent to a flame ionization detector (FID) or to the mass spectrometer. OME1–6, methanol and methyl formate were quantified by means of a calibration curve obtained with pure reference samples. OME7–8 calibration curves were based on the effective carbon number method and extrapolated from the response factors of OME1–6. Conversion of trioxane (XTRI), selectivity towards OME3–5 (S(OME3–5)) and growth probability (α)36 were calculated from:
 | (1) |
 | (2) |
 | (3) |
Experimental data were fitted with the ExpAssoc function using ORIGIN software. Initial reaction rates (mol min−1 gcat−1) were then calculated based on the value of the derivative at t = 0 of [OME2–8] vs. time divided by the catalyst concentration.
Reaction network and kinetic model for OME synthesis
A simplified pseudo-homogeneous kinetic model for the synthesis of OME was derived from a study done by Burger et al.37 The model considered that OME are formed from OME1 and TRI according to: | (4) |
 | (5) |
Its value can be modelled using the van't Hoff equation:
 | (6) |
The values of a and b (respectively 0.2404 and −0.8728) were determined by fitting the experimentally obtained  value at various temperatures (Fig. S1, ESI†). kOME,f and kOME,b are also assumed to be independent of OME chain length. For reaction (4), the reaction rate is:
 | (7) |

Finally, the evolution of the concentration of component A over time is calculated based on:
 | (8) |
 | (9) |
Results and discussion
Physicochemical properties of the catalyst
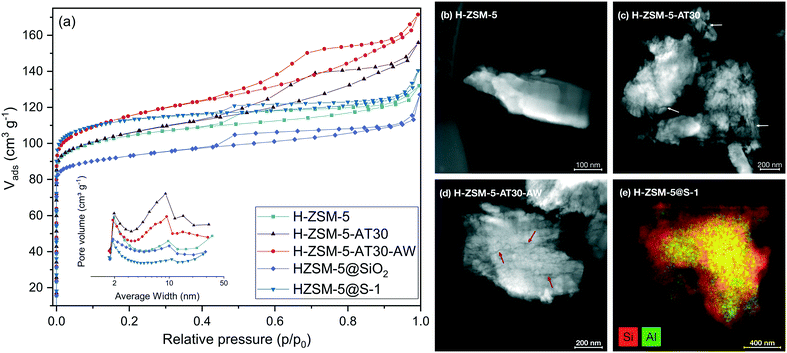
The XRD patterns (Fig. S2†) of the untreated, mesoporous and passivated H-ZSM-5 all have reflections representative of the MFI structure. Textural properties were investigated by N2 physisorption with clear differences visible in the isotherms (Fig. 2a). All zeolites possessed a type II isotherm with a hysteresis loop. The untreated H-ZSM-5 also possessed some initial mesoporosity, evidenced by a H4 loop in the isotherm, generated from intercrystallite space between aggregates.39 Alkaline treatment increased the total N2 uptake and mesopore surface area (Smeso) from 54 to 80 m2 g−1 with a concomitant, slight decrease in micropore surface area (Smicro) from 294 to 280 m2 g−1. Aluminium-rich debris can be formed upon desilication on Al-rich H-ZSM-5 (Si/Al < 20) and cause micropore blockage.33 Adding a subsequent acid wash step partially restored Smicro (287 m2 g−1) and increased Smeso (99 m2 g−1). Both samples exhibited a broad peak in the pore size distribution around 9 nm indicating the presence of mesopores (Fig. 2a, inset). Scanning transmission electron microscopy (STEM) confirmed the presence of intracrystalline mesopores within the entire crystal for alkaline-treated H-ZSM-5 (Fig. 2c and d) in comparison with the untreated zeolite (Fig. 2b).The effect of desilication and dealumination treatments on the coordination of aluminium was investigated by solid state NMR (Fig. S3†). Signals from tetrahedral AlIV, pentahedral AlV and octahedral AlVI have chemical shifts at 50 ppm, 30 ppm and 0 ppm, respectively.40–42 Alkaline treatment led to an increase in the AlV and AlVI signal at the expense of the AlIV signal. Tetrahedral aluminium was thus partially converted upon desilication into extra-framework aluminium (EFAl) and aluminium-rich debris, which can lead to partial micropores blockage.33 An additional acid wash step decreased EFAl signals but also slightly decreased the AlIV signal. Dealumination was thus required to regenerate the initial crystallinity. The FTIR spectra (Fig. S4†) of the silanol region showed peaks assigned to isolated Si–OH (3740 cm−1), Al–OH (3660 cm−1), bridging hydroxyl (3590 cm−1) and internal Si–OH (3495 cm−1).43
Overall, the bridging hydroxyl signals remained constant for the three samples but higher Al–OH signals were observed for the alkaline-treated zeolites. Dealumination also increased the signal of terminal Si–OH bonds, due to the removal of Al from the zeolite framework. The initial Si/Al ratio (Table S1†) decreased with the alkaline treatment (from 11.3 to 10.9) and reached a value above its initial level with the additional acid wash (12.7).
The influence of the extent of desilication was studied by using NaOH solutions with various concentration (0.2 to 1.0 M) for the alkaline-treatment with and without a subsequent acid wash. The textural properties of the resulting samples were characterized by N2 physisorption and the results are quantified in Table S2.† As observed in Fig. 3, increasing the extent of desilication by increasing the concentration of NaOH during alkaline treatment led to an increase in mesopore surface area at the expense of the micropore surface area. Severe pore blocking occurred at concentrations higher than 0.4 M, highlighted by the loss of more than 40% of Smicro. Adding an additional step of mild dealumination after desilication regenerated the access to the micropores while preserving the mesopores. A too severe alkaline treatment (i.e. 1.0 M) resulted in a sharp drop in micro- and mesopore surface area.
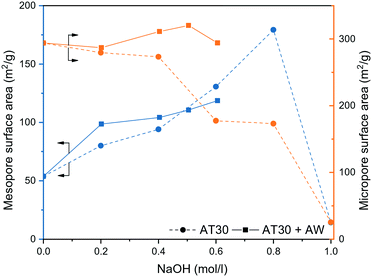 | ||
| Fig. 3 Mesopore and micropore surface area of H-ZSM-5 (AT: alkaline treatment, AW: acid wash) derived from N2 physisorption measurements. | ||
Passivated zeolites samples had distinctive textural properties. As shown on Fig. 2a, silanation of H-ZSM-5 decreased the Smicro (272 m2 g−1) while preserving the Smeso (47 m2 g−1). However, epitaxial growth of S-1 resulted in an increase in Smicro (345 m2 g−1) at the expense of Smeso (43 m2 g−1). Both passivated samples possessed a larger Si/Al ratio compared to the untreated H-ZSM-5 due to the addition of silicon. The coordination of Si was investigated by NMR (Fig. S5†). H-ZSM-5 possessed a prominent peak at −110 ppm corresponding to framework tetrahedral silicon (Q4).44 Overall, both passivated zeolites exhibited a signal shift from Q3 and Q4(Al) (between −97 and −108 ppm) to Q4 (between 108 and −116 ppm) indicating a larger proportion of tetrahedral silicon present in the passivated zeolites.45 The presence of an outer layer of S-1 was confirmed by STEM-EDS (Fig. 2e).
We studied the acidity of the mesoporous and passivated zeolites by NH3-temperature programmed desorption (TPD), pyridine adsorption FTIR spectroscopy (Py-FTIR) and di-tert-butyl-pyridine – temperature programmed desorption (DTBPy-TPD). NH3-TPD typically showed low- and high temperature peaks for the protonic form of zeolites (Fig. 4a and S6†) and the results of the peak area quantification are summarized in Table S3.† Alkaline treatment increased the acidity with H-ZSM-5-AT30 (1.07 mmol g−1) having 9% additional acidity compared to the untreated H-ZSM-5 (0.98 mmol g−1). EFAl located on the crystal surface resulting from silicon extraction likely accounted for this increase.46
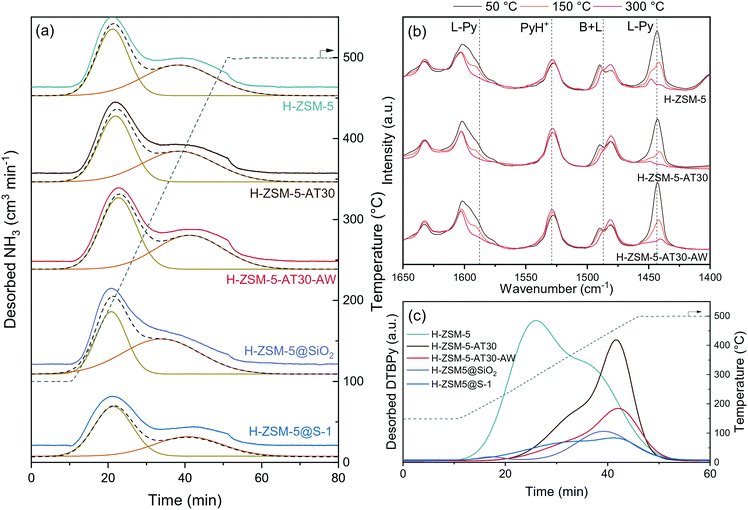 | ||
| Fig. 4 Characterization of the acidity of mesoporous and passivated H-ZSM-5 zeolites by (a) NH3-TPD, (b) pyridine-FTIR spectroscopy (PyH+ and L-Py indicates pyridinium ion and pyridine bonded to a Lewis site, respectively) and (c) DTBPy-TPD (only the cumulative peaks from Gaussian peak deconvolution is displayed for clarity and the measured spectra are presented in Fig. S7†). | ||
The additional acid wash step diminished the acidity to a level below that of the untreated H-ZSM-5 (4% decrease). Their strength was however enhanced as reflected by the shift towards higher desorption temperature. Augmenting the extent of desilication is detrimental to the acidity of the zeolite, despite the acid wash step to restore the micropore surface area. H-ZSM-5-AT300.6M-AW possessed the lowest acidity of all prepared mesoporous zeolites even though it displayed one of the highest BET surface area. There is thus a limit to the introduction of an auxiliary network of mesopores without damaging the acidic properties of the zeolites. The two different methods of passivation had different effects on acidity. Despite having the same total acidity as H-ZSM-5@SiO2 (0.86 mmol g−1), H-ZSM-5@S-1 had a larger portion of weak acid sites, which is due to the addition of the S-1 layer that does not contain bridging hydroxyl groups.
Py-FTIR was applied to study the nature and strength of the catalyst's acidic sites (Fig. 4b). After exposure of H-ZSM-5 to an excess of pyridine vapour at 50 °C, the characteristic bands of pyridine adsorbed on Brønsted acid sites (1530 cm−1) and Lewis acid sites (1445 and 1580 cm−1) were observed.47 The signal corresponding to Brønsted acid sites remained constant with the increase in temperature, while the signal corresponding to Lewis acid sites disappeared at temperature above 150 °C.
It was thus concluded that the untreated H-ZSM-5 possessed strong Brønsted and mild Lewis acid sites. A similar trend was observed for H-ZSM-5-AT30 and H-ZSM-5-AT30-AW Py-FTIR spectra. Therefore, neither the alkaline treatment nor the acid wash affected the type of acidity.
The external acidity of the samples was probed by DTBPy-TPD (Fig. 4c and S7†). DTBPy is a bulky base that cannot enter the micropores and is selective to Brønsted acid sites due to steric constrains preventing its coordination to Lewis sites.48 It is thus a suitable probe for quantification of external Brønsted acidity. All treatments on H-ZSM-5 showed a significant effect on its external acidity. Desilication lowered the signal by 24% and shifted it towards higher temperatures. This change in acidity can arise from two concomitant effects. First, as NaOH preferentially attacks Si–OH, i.e. there is a decrease in the number of external silanol groups. Second, silicon extraction can expose bridging hydroxyl groups and produce EFAl on the surface, leading to an increase of surface acidity.49
The addition of an acid wash particularly affected the external acidity with a 73% decrease compared to the untreated H-ZSM-5 signal. This treatment dealuminated the external surface thereby removing strong acid sites. As a consequence, the external acidity was more severely affected than the overall acidity. This observation is in line with Fernandez et al., who found that EFAl present on the external surface are more disposed to be extracted during dealumination than tetrahedrally coordinated Al.50 Lastly, both methods of passivation efficiently reduced external acidity based on a signal drop of 86% and 81% for H-ZSM-5@SiO2 and H-ZSM-5@S-1, respectively. The overall acidity was found to be the same for the two samples but H-ZSM-5@SiO2 had a higher number of strong acid sites.
Catalytic properties for OME synthesis
The performance of the synthesized catalysts was tested for the synthesis of OME from TRI and OME1 in a batch reactor (Fig. 5). All catalysts were able to synthesize OME but with major differences in kinetics. Their performance followed the trend: mesoporous > untreated > passivated. Compared to H-ZSM-5, H-ZSM-5-AT30 and H-ZSM5-AT30-AW were more active catalysts. The initial reaction rate using H-ZSM-5-AT30-AW almost doubled compared to the untreated H-ZSM-5 from 0.015 to 0.028 mol min−1 gcat−1.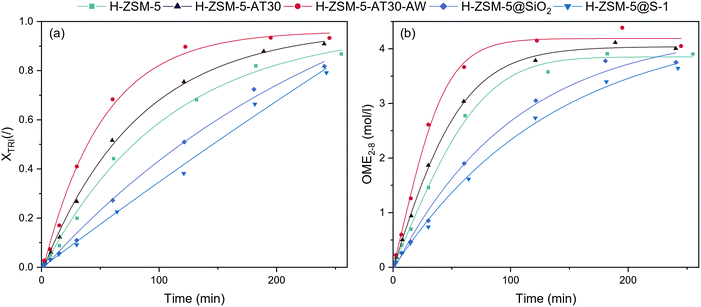 | ||
| Fig. 5 (a) TRI conversion and (b) concentration of OME2–8 in the batch reactor (OME1/TRI: 3.3; 0.5 wt% catalyst; 70 °C) obtained with untreated, mesoporous and passivated H-ZSM-5 zeolites. | ||
Using H-ZSM-5-AT30-AW as the catalyst, the reaction reached equilibrium between 120 and 180 min while by using H-ZSM-5 and H-ZSM-5-AT30, it required more than 180 min to reach the equilibrium. The opposite effect occurred with the passivation of the external surface where a significant decrease in performance was observed. Initial reaction rates diminished to 0.009 and 0.007 mol gcat−1 min−1, respectively, for H-ZSM-5@SiO2 and H-ZSM-5@S-1. Furthermore, the order of the reaction seemed to change from a first order reaction to a zeroth-order reaction. This suggests that the reaction rate does not depend on the reactants' concentrations and that the rate-limiting step may be internal diffusion within the zeolite micropores. Both catalysts did not enable to reach equilibrium under 240 min.
Methyl formate (MF) is a byproduct of OME synthesis and is formed through the condensation of two formaldehyde units. The production of MF (Fig. S8†) was higher for mesoporous and passivated zeolites than for untreated H-ZSM-5. Since a higher proportion of the reaction took place in the micropores, there was a higher probability of MF formation.37
Reusability of H-ZSM-5-AT30-AW was assessed by performing 4 consecutive runs (Fig. 6). The conversion of trioxane and the OME size distribution remained constant. The latter was calculated using the growth probability (α), which is a parameter representative of this distribution (see definition in the Experimental section); a larger value implies that larger OME are produced.
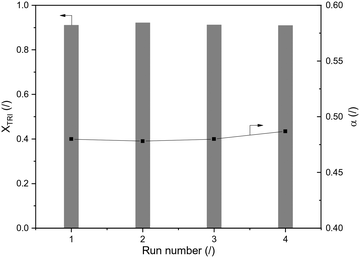 | ||
| Fig. 6 Reusability test of H-ZSM-5-AT30-AW with TRI conversion and α (OME1/TRI: 3.3; 1.0 wt% catalyst; 70 °C; 120 min reaction time). | ||
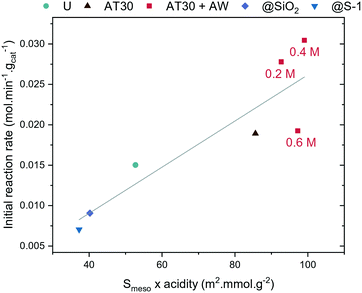
Alkaline-treated and acid-washed H-ZSM-5 zeolites exhibited the most suitable textural properties for OME synthesis, i.e. high mesopore surface area and preserved crystallinity. The catalytic performance of candidates with varying degrees of desilication was thus also tested to better understand the effects and benefits of mesopores for OME synthesis (Fig. S9†). The relationship between the initial reaction rate and the extent of alkaline treatment displays a maximum value reached with H-ZSM-5-AT300.4M-AW (Fig. S10a†). This catalyst showed a two-fold increase from 0.015 to 0.031 mol min−1 gcat−1 in the initial reaction rate compared to untreated H-ZSM-5. Alkaline treatment with a concentration above 0.4 M resulted in a more modest increase in activity despite having the highest mesopores surface area. Moreover, all mesoporous zeolites displayed an increase in S(OME3–5) before the equilibrium was reached during the experiments. The maximum value S(OME3–5,max) was around 10% higher for alkaline-treated and acid-washed H-ZSM-5 zeolites (Fig. S10b†). Despite a modest increase, it seems that mesopores supported the formation of OME3–5 at the expense of larger OME. We suggest that mesopores facilitate the diffusion of OME3–5.
Finally, we investigated the effect of the treatments on α. A small influence of mesopores was also observed on α with a maximum value of α at 250 min obtained for H-ZSM-5-AT300.4M-AW (Fig. S10c†). All catalysts led to an OME product distribution at equilibrium following the ASF distribution.
Structure–activity relationship
The intracrystalline network of mesopores showed to improve the activity of H-ZSM-5 for the synthesis of OME. However, it is not the only important aspect: there is a trade-off between overall acidity and accessibility. At a certain extent of alkaline treatment (i.e. using a 0.6 M NaOH solution for desilication), the concentration of acid sites decreased, which caused a decrease in the catalyst activity. A correlation was found between the initial reaction rate at 70 °C and the product of Smeso and the acid sites concentrations (Fig. 7), which highlights the importance of both factors for OME synthesis.Another important aspect is the obstruction of the zeolite's micropores. H-ZSM-5-AT30 or H-ZSM-5-AT300.6M-AW are both less active, which could be due to the presence of Al-rich debris causing micropore blockage. The acid-wash step is crucial to restore the crystallinity and access to micropores but could be insufficient to remove all Al-rich debris produced when performing a desilication step using the more concentrated alkaline treatment (i.e. 0.6 M). The higher amount of Al-rich debris produced upon a stronger alkaline treatment requires in turn acid wash with a more concentrated HCl solution. However, this could also remove Brønsted acidity and thus be detrimental to the overall zeolite acidity. The acid site strength could also be playing an important role. H-ZSM-5-AT30 and H-ZSM-5-AT30-AW both displayed enhanced acid strength that could also contribute to their overall increased performance.
Finally, considering the characterization data showing that the passivated samples lost most of their external acidity with a small decrease in the overall acidity, it becomes obvious that the external acid sites must play a more prominent role in OME synthesis than the sites within the micropores. These external sites are more easily accessible to the bulky OME1 and TRI molecules.
It is difficult, however, to exactly quantify this difference as both passivation treatments also induced some changes to the bulk of the material. The least active catalyst was H-ZSM-5@S-1 for three reasons. First, the original intercrystalline volume was filled with newly generated S-1 phase, decreasing the mesoporous volume. Second, the internal acid sites of the H-ZSM-5 crystals are only accessible after diffusion through the pores of the S-1 external layer. Finally, as the S-1 layer does not contain any bridging hydroxyl group, an increasing thickness of S-1 layer also progressively lowers the fraction of strong Brønsted sites in the zeolite.
To investigate further the effect of passivation and introduction of mesoporosity on the synthesis of OME, a kinetic study was performed on the untreated and passivated (H-ZSM-5@S-1) zeolites as well as on the best mesoporous candidate (H-ZSM-5-AT300.4M-AW). They were tested at various temperatures. Each run with a specific catalyst at a certain temperature was fitted to our kinetic model to yield a value of the effective kinetic constant kOME,f (Table S4, Fig. S11 to Fig. S19†). The value of Eapp was then calculated for each catalyst using the linearized Arrhenius equation (Fig. 8):
 | (10) |
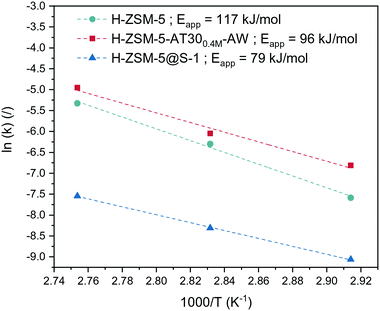 | ||
| Fig. 8 Arrhenius plot for various catalysts based on the kinetic constants extracted from the kinetic model with the apparent energy of activation. | ||
H-ZSM-5 showed the highest Eapp of 117 kJ mol−1, which is within the range of values (117 to 126 kJ mol−1) calculated by Wang et al. for the activation energy required for insertion of a formaldehyde unit into an OME molecule.24 The lower dependency of the reaction rate on temperature for H-ZSM-5@S-1 was confirmed by its relatively low Eapp (79 kJ mol−1). When the intraparticle diffusion is the rate-determining step, the slope of the Arrhenius plot changes from −Ea/R to −(Ed + Ea)/2R where Ed is the activation energy for the effective diffusion.51 The activation energy for molecular diffusion in the H-ZSM-5 channels is in the range of 5–20 kJ mol−1.52
Comparing these two values thus shows that the overall reaction rate using H-ZSM-5 is dictated by reaction taking place solely on the surface. Acid sites located inside the micropores were subjected to severe diffusion limitation and participated minimally in the reaction. In the case of the passivated catalyst, the inactive external surface led the reaction to be solely dependent on internal sites, which revealed their limitation on mass transfer.
E app for H-ZSM-5-AT300.4M-AW was found to be 96 kJ mol−1, which reflected that both mass transfer and kinetics were controlling the observed reaction rate. Counterintuitively, this catalyst was more influenced by internal diffusion compared to H-ZSM-5 despite having higher overall performance. In this case, the external sites probably possessed similar activity to the external acid sites of H-ZSM-5 but were largely removed by the acid wash. Also, introduction of mesopores into the zeolite structure likely caused a higher proportion of the internal zeolite acid sites to participate in the reaction. The overall reaction rate was thus partly governed by internal diffusion, resulting in a lower Eapp.
Alternatively, the reaction could take place mostly on the acid sites located inside the mesopores where moderate mass diffusion limitation occurs. A mesoporous diffusion limited regime could explain an intermediate value of Eapp. However, this explanation is rather unlikely due to the much higher reactants' diffusivity in the mesopores compared to the micropores. This consideration is supported by the fact that mesoporous diffusion limitation has not been reported in the literature to the best of our knowledge.
Scheme 3 summarizes the findings of our study. The reaction mostly took place on the surface and edges of the H-ZSM-5 zeolite crystal while the bulk of the crystal was almost completely unutilized. Therefore, the resulting Eapp was closer to the real activation energy of the reaction. Due to the addition of an external S-1 layer for H-ZSM-5@S-1, the reaction was forced to occur within the micropores, leading to a lower Eapp. Finally, the effect of internal diffusion was seen more severely on the hierarchical candidate compared to the untreated one with an intermediate Eapp value. Owing to its intracrystalline network of mesopores, the bulk of the crystal was more accessible and a larger proportion of the reaction likely took place within the micropores.
 | ||
| Scheme 3 Schematic representation of the synthesis of OME on the passivated, untreated and mesoporous zeolites. | ||
Conclusions
We demonstrated that controlled insertion of intracrystalline mesopores in H-ZSM-5 led to the formation of a hierarchical material that exhibited superior catalytic performance for the synthesis of OME. Access to the active sites in H-ZSM-5 micropores was found to be of high importance since large OME molecules experienced internal diffusion limitation in the zeolite's micropores. The inner volume of the untreated zeolite was thus less accessible compared to the hierarchical zeolites that have advantageous diffusion properties. A two-fold enhancement in initial reaction rate alongside a 10% increase in the selectivity towards the OME with 3 to 5 oxymethylene units (OME3–5) was achieved with the best catalyst (H-ZSM-5-AT300.4M-AW).That being said, care must be taken to choose the appropriate treatment. A too severe desilication led to severe pore blocking due to aluminium debris while a mild dealumination regenerated the crystallinity. Furthermore, a trade-off was observed between mesopores insertion and acidity; a too intense alkaline treatment was detrimental to Brønsted acidity which is essential for OME synthesis. Passivation treatments highlighted the prominent role of external acidity. Silanation or growth of silicate-1 on ZSM-5 caused a sharp drop in performance despite having a similar overall concentration of acid sites. Neither the introduction of mesopores nor the passivation significantly alters the ASF distribution which was previously established.
In conclusion, in order to tailor optimum zeolite catalyst post-treatments and design other similar materials for OME synthesis, it is highly important to consider both the accessibility of active sites and the prominent role that external acid sites play.
Conflicts of interest
There are no conflicts to declare.Acknowledgements
This research project is financially supported by the Swiss Innovation Agency lnnosuisse and is part of the Swiss Competence Center for Energy Research SCCER BIOSWEET. The authors are grateful to Martin Elsener, Emilie Baudat, Pascal Schouwink for help characterizing data. Florent Héroguel and Jeremy S. Luterbacher acknowledge funding from the Swiss National Science Foundation through grant PYAPP2_154281.References
-
R. M. Milton, in Zeolite Synthesis, 1989, pp. 1–10 Search PubMed
.
- V. Blay, B. Louis, R. Miravalles, T. Yokoi, K. A. Peccatiello, M. Clough and B. Yilmaz, ACS Catal., 2017, 7, 6542–6566 CrossRef CAS
.
- W. W. Kaeding, C. Chu, L. B. Young and S. A. Butter, J. Catal., 1981, 69, 392–398 CrossRef CAS
.
- W. Q. Xu, Y. G. Yin, S. L. Suib, J. C. Edwards and C. L. O'Young, J. Phys. Chem., 1995, 99, 9443–9451 CrossRef CAS
.
-
J. Kärger and D. M. Ruthven, in Handbook of Zeolite Science and Technology, 1992, vol. 341, pp. 329–366 Search PubMed
.
- J. Pérez-Ramírez, C. H. Christensen, K. Egeblad, C. H. Christensen and J. C. Groen, Chem. Soc. Rev., 2008, 37, 2530 RSC
.
- G. Bellussi, G. Pazzuconi, C. Perego, G. Girotti and G. Terzoni, J. Catal., 1995, 157, 227–234 CrossRef CAS
.
- C. H. Christensen, K. Johannsen, E. Törnqvist, I. Schmidt, H. Topsøe and C. H. Christensen, Catal. Today, 2007, 128, 117–122 CrossRef CAS
.
- J. C. Groen, W. Zhu, S. Brouwer, S. J. Huynink, F. Kapteijn, J. A. Moulijn and J. Pérez-Ramírez, J. Am. Chem. Soc., 2007, 129, 355–360 CrossRef CAS PubMed
.
- L. Zhao, B. Shen, J. Gao and C. Xu, J. Catal., 2008, 258, 228–234 CrossRef CAS
.
- J. Pérez-Ramírez, S. Mitchell, D. Verboekend, M. Milina, N. L. Michels, F. Krumeich, N. Marti and M. Erdmann, ChemCatChem, 2011, 3, 1731–1734 CrossRef
.
- X. Zhu, L. L. Lobban, R. G. Mallinson and D. E. Resasco, J. Catal., 2010, 271, 88–98 CrossRef CAS
.
- K. Cheng, J. Kang, S. Huang, Z. You, Q. Zhang, J. Ding, W. Hua, Y. Lou, W. Deng and Y. Wang, ACS Catal., 2012, 2, 441–449 CrossRef CAS
.
- J. Burger, M. Siegert, E. Ströfer and H. Hasse, Fuel, 2010, 89, 3315–3319 CrossRef CAS
.
- B. Lumpp, D. Rothen, C. Pastötter, R. Lämmermann and E. Jacob, Motortech. Z., 2011, 72, 34–39 CrossRef
.
- A. Feiling, M. Münz and C. Beidl, Motortech. Z., 2016, 16–21 Search PubMed
.
- C. J. Baranowski, A. M. Bahmanpour and O. Kröcher, Appl. Catal., B, 2017, 407–420 CrossRef CAS
.
- M. Härtl, K. Gaukel, D. Pélerin and G. Wachtmeister, MTZ Worldwide, 2017, 2, 52–58 CrossRef
.
- L. Lautenschütz, D. Oestreich, P. Seidenspinner, U. Arnold, E. Dinjus and J. Sauer, Fuel, 2016, 173, 129–137 CrossRef
.
- E. Jacob and W. Maus, MTZ Worldwide, 2017, 78(3), 52–57 CrossRef
.
- N. Schmitz, F. Homberg, J. Berje, J. Burger and H. Hasse, Ind. Eng. Chem. Res., 2015, 54, 6409–6417 CrossRef CAS
.
- R. Wang, Z. Wu, Z. Qin, C. Chen, H. Zhu, J. Wu, G. Chen, W. Fan and J. Wang, Catal. Sci. Technol., 2016, 6, 993–997 RSC
.
- L. Lautenschütz, D. Oestreich, P. Haltenort, U. Arnold, E. Dinjus and J. Sauer, Fuel Process. Technol., 2017, 165, 27–33 CrossRef
.
- F. Wang, G. Zhu, Z. Li, F. Zhao, C. Xia and J. Chen, J. Mol. Catal. A: Chem., 2015, 408, 228–236 CrossRef CAS
.
- T. J. Goncalves, U. Arnold, P. N. Plessow and F. Studt, ACS Catal., 2017, 7, 3615–3621 CrossRef CAS
.
- Q. Zhao, H. Wang, Z. Qin, Z. Wu, J. Wu, W. Fan and J. Wang, J. Fuel Chem. Technol., 2011, 39, 918–923 CrossRef CAS
.
- J. Wu, H. Zhu, Z. Wu, Z. Qin, L. Yan, B. Du, W. Fan and J. Wang, Green Chem., 2015, 17, 2353–2357 RSC
.
- W. H. Fu, X. M. Liang, H. Zhang, Y. M. Wang and M. Y. He, Chem. Commun., 2015, 51, 1449–1452 RSC
.
- Z. Xue, H. Shang, Z. Zhang, C. Xiong, C. Lu and G. An, Energy Fuels, 2016, 31, 279–286 CrossRef
.
- D. Oestreich, L. Lautenschütz, U. Arnold and J. Sauer, Chem. Eng. Sci., 2017, 163, 92–104 CrossRef CAS
.
- H. Matsuura and H. Murata, J. Raman Spectrosc., 1982, 12, 144–148 CrossRef CAS
.
- V. Venkatesan, K. Sundararajan, K. Sankaran and K. S. Viswanathan, Spectrochim. Acta, Part A, 2002, 58, 467–478 CrossRef CAS
.
- D. Verboekend, S. Mitchell, M. Milina, J. C. Groen and P. Javier, CrystEngComm, 2011, 14193–14203 CAS
.
- W. Ding, G. D. Meitzner and E. Iglesia, J. Catal., 2002, 206, 14–22 CrossRef CAS
.
- A. Ghorbanpour, A. Gumidyala, L. C. Grabow, S. P. Crossley and J. D. Rimer, ACS Nano, 2015, 9, 4006–4016 CrossRef CAS PubMed
.
- R. B. Anderson, R. A. Friedel and H. H. Storch, J. Chem. Phys., 1951, 19, 313–319 CrossRef CAS
.
- J. Burger, E. Ströfer and H. Hasse, Ind. Eng. Chem. Res., 2012, 51, 12751–12761 CrossRef CAS
.
- H. Li, H. Song, F. Zhao, L. Chen and C. Xia, J. Energy Chem., 2015, 24, 239–244 CrossRef
.
- M. Thommes, K. Kaneko, A. V. Neimark, J. P. Olivier, F. Rodriguez-Reinoso, J. Rouquerol and K. S. W. Sing, Pure Appl. Chem., 2015, 87, 1051–1069 CAS
.
- Z. Wang, Y. Jiang, O. Lafon, J. Trébosc, K. Duk Kim, C. Stampfl, A. Baiker, J. P. Amoureux and J. Huang, Nat. Commun., 2016, 7, 1–5 Search PubMed
.
- F. Deng, Y. Du, C. Ye, J. Wang, T. Ding and H. Li, J. Phys. Chem., 1995, 99, 15208–15214 CrossRef CAS
.
- Z. Yu, S. Li, Q. Wang, A. Zheng, X. Jun, L. Chen and F. Deng, J. Phys. Chem. C, 2011, 115, 22320–22327 CrossRef CAS
.
- P. Sazama, B. Wichterlova, J. Dedecek, Z. Tvaruzkova, Z. Musilova, L. Palumbo, S. Sklenak and O. Gonsiorova, Microporous Mesoporous Mater., 2011, 143, 87–96 CrossRef CAS
.
- W. Song, J. F. Woodworth, V. H. Grassian and S. C. Larsen, Langmuir, 2005, 21, 7009–7014 CrossRef CAS PubMed
.
- J. Casanovas, F. Illas and G. Pacchioni, Chem. Phys. Lett., 2000, 326, 523–529 CrossRef CAS
.
- D. Verboekend, A. M. Chabaneix, K. Thomas, J.-P. Gilson and J. Pérez-Ramírez, CrystEngComm, 2011, 13, 3408 RSC
.
- T. Barzetti, E. Selli, D. Moscotti and L. Forni, J. Chem. Soc., Faraday Trans., 1996, 92, 1401 RSC
.
- K. Góra-marek, K. Tarach and M. Choi, J. Phys. Chem. C, 2014, 118, 12266–12274 CrossRef
.
- R. Bartolomeu, R. Bértolo, S. Casale, A. Fernandes, C. Henriques, P. Da Costa and F. Ribeiro, Microporous Mesoporous Mater., 2013, 169, 137–147 CrossRef CAS
.
- C. Fernandez, I. Stan, J. P. Gilson, K. Thomas, A. Vicente, A. Bonilla and J. Pérez-Ramírez, Chem. – Eur. J., 2010, 16, 6224–6233 CrossRef CAS PubMed
.
-
F. Schüth, K. S. W. Sing and J. Weitkamp, Handbook of Porous Solids, 2008, vol. 4 Search PubMed
.
- V. R. Choudhary, V. S. Nayak and T. V. Choudhary, Ind. Eng. Chem. Res., 1997, 36, 1812–1818 CrossRef CAS
.
Footnote |
| † Electronic supplementary information (ESI) available. See DOI: 10.1039/c8cy02194e |
| This journal is © The Royal Society of Chemistry 2019 |


