On the stability of a dipole-bound state in the presence of a molecule†
Maria Elena
Castellani
 ,
Cate S.
Anstöter
 and
Jan R. R.
Verlet
 *
*
Department of Chemistry, Durham University, DH1 3LE, Durham, County of Durham, UK. E-mail: j.r.r.verlet@durham.ac.uk
First published on 24th October 2019
Abstract
Dipole-bound states (DBSs) are diffuse non-valence molecular orbitals of anions where the electron is bound by the permanent dipole moment of the neutral core. Here, an experimental study of the stability of such orbitals under the influence of a perturbing molecular alkyl chain is presented. Photodetachment action and photoelectron imaging spectroscopy of five para-substituted phenolate anions with progressively longer alkyl chains show that the DBS survives in all cases, suggesting that the perturbation of the orbital is not critical to the existence of the DBS.
First described by Fermi and Teller in 1947,1 a dipole-bound state (DBS) is a non-valence electronic state of an anion in which the electron is bound by the permanent dipole moment of a neutral molecule, typically in excess of 2.5 D.2–4 Because of the weak non-valence interaction, the DBS orbital is a highly diffuse atomic-like orbital, akin to a Rydberg state in a neutral molecule.5 The DBS can be the ground state or an excited state of the anion. In addition to being a scientific curiosity, non-valence anionic states have been implicated as “door-way” states to electron attachment6–11 and are involved in excited state dynamics of anions.9,12–17 These studies have focussed exclusively on isolated anions as it is generally accepted that a DBS cannot survive in the condensed phase because of the excluded volume imposed by the surrounding molecules. Yet, to the best of our knowledge, there have been no experiments aimed at testing this accepted belief. Here, we probe the effect of an excluded volume imposed by an alkyl chain on the stability of a DBS and show that the DBS remains observable.
The spectroscopic observation of DBSs can be achieved through action and photoelectron (PE) spectroscopy. Early experiments by Brauman and colleagues uncovered their presence in photodetachment yield spectra,18,19 and such features have been seen in many other action spectra20–24 and in PE spectra.21,25–30 More recently, Wang and co-workers have elegantly exploited resonant excitation to a DBS as a sensitive probe of the vibrational structure of the corresponding neutral, using both action and PE spectroscopy.31–36 A DBS can also be accessed by Rydberg electron-transfer spectroscopy, which has been extensively used to probe their role in electron attachment dynamics.26,37 While many experiments have assessed the effect of the overall permanent dipole moment and of rotational motion19,38–42 of the neutral core on the binding energy of the DBS, there have been far fewer studies on the interaction of a DBS with molecular fragments. A recent study by Zhu et al.43 showed how a small overlap between a valence system and a DBS can lead to non-radiative decay of the DBS.
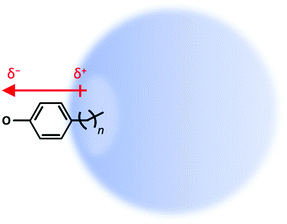
Here we address how a “non-interacting” molecular fragment alters the binding of a DBS. Specifically, our test model uses para-substituted phenolates in which an alkyl chain of varying length can “poke” into the DBS orbital to a variable extent, as shown schematically in Fig. 1. As the saturated alkyl chain has no dipole moment of its own (see ESI† for calculated comparison), it can be viewed as non-interacting with the DBS, except through the excluded volume that the chain will impose on the orbital. The phenolate anion (C6H5O−) was selected as it is known to support an excited DBS and because it has been extensively studied the Wang group.44,45
 | ||
| Fig. 1 Picture of dipole-bound state (DBS) of para-substituted alkyl-phenolate with varying chain length, n-ph−. | ||
The details of the experiment have been described previously.46 Phenol (ph), 4-ethylphenol (2-ph), 4-propylphenol (3-ph), 4-pentylphenol (5-ph) and 4-octylphenol (8-ph) were purchased from Sigma Aldrich and 4-butylphenol (4-ph) from Tokyo Chemical Industry. The para-substituted phenolate anions, n-ph−, were produced by deprotonation of their methanolic solution (∼1 mM) through electrospray ionization. Ions were transferred by a capillary into a vacuum region, guided by a set of ring-electrode ion guides that also served as ion trap.47 Ion packets were introduced in a collinear time-of-flight mass spectrometer48 at 10 Hz and the mass-selected ion-packets were irradiated with laser pulses from a Nd:YAG pumped optical parametric oscillator. Ejected PEs were captured and imaged by a velocity-map imaging assembly.49,50 Photodetachment action spectra were acquired by monitoring the total electron yield as a function of wavelength. PE spectra and angular distributions were derived from the raw images using Polar Onion Peeling.51 The spectra were calibrated using phenolate, which has an electron affinity (EA) of 2.235(6) eV.52 The PE spectral resolution was ∼5%.
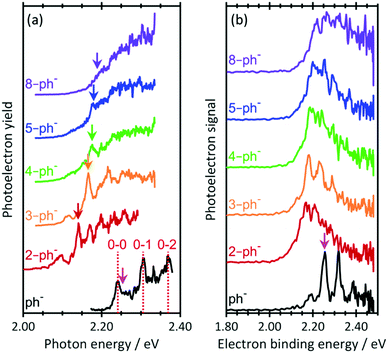
Fig. 2(a) shows the photodetachment action spectrum of ph− and the five para-substituted phenolates around their respective thresholds. The spectrum of ph− includes transitions observed by the Wang group44 at much higher resolution with cryogenically cooled ions. The 0–0, 0–1 and 0–2 transitions from the ground state to the DBS can be clearly identified as well as an offset starting just after the 0–0 transition, which corresponds to direct detachment into the continuum (i.e., only the 0–0 transition is bound and all others are vibrational Feshbach resonances). Addition of a short alkyl-chain to form 2-ph− leads to a clear red-shift but the onset of signal steadily shifts towards higher photon energy as more –CH2– units are added to the alkyl chain. With increasing n, the 0–0 transition becomes progressively less distinguishable as the chain length increases. Specifically, for 2-ph− and 3-ph−, the 0–0 transition can be clearly discerned, while it is less so for 4-ph− and essentially becomes unresolved for 5-ph− and 8-ph−. Note that hot bands can be seen on the red side of the 0–0 transition for all ions. These are expected because the ions are generated with an internal temperature of at least 300 K.
 | ||
| Fig. 2 (a) Photodetachment action spectra for n = 0, 2–5, and 8 near the photodetachment threshold. Vertical lines dashed lines indicate transitions measured by Liu et al.44 Vertical arrows indicate excitation energy for resonance-enhanced photoelectron spectra in Fig. 3. (b) Photoelectron spectra of phenolate and para-substituted alkyl-phenolate anions at hv =2.48 eV. All spectra have been vertically offset for clarity. The electron affinity (EA) is indicated by the vertical pink arrow. | ||
The relative shifts of the 0–0 transition to the DBS arises from an increase in the EA as the chain length is increased. Fig. 2(b) shows PE spectra of the n-ph− species at hv = 2.48 eV. The EA of ph sharply decreases upon para-substitution and then gradually increases as the chain becomes longer. Hence, assuming that the dipole-moment of n-ph remains constant, which is supported by our calculations (see ESI†), larger n (for n ≥ 2) have a higher 0–0 transition energy for the DBS peak, consistent with the shift seen in Fig. 2(a).
The most striking observation of Fig. 2(a) is the loss of resolution of the 0–0 peak. We expect a signal rise near the 0–0 transition regardless of whether the DBS is excited because of the proximity of the opening of the direct detachment channel to the DBS. Hence, a possible explanation for the observed loss in resolution is that the DBS becomes completely disrupted as a sufficiently long chain perturbs its orbital.
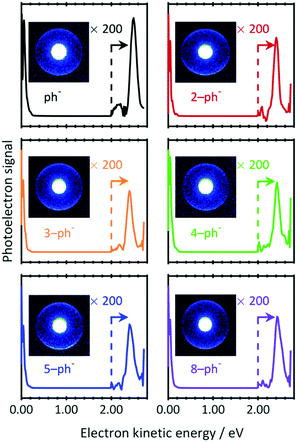
To investigate whether the DBS still exists for larger n-ph−, PE images were recorded at photon energies resonant with the 0–0 transition energies to the DBS (downward arrows in Fig. 2(a)). The resulting PE spectra are shown in Fig. 3 with raw PE images included as insets. The PE images exhibit two features. The bright inner feature has been intentionally saturated to enable a second larger ring to be visible. The corresponding PE spectra show the dominance of the low energy peak. This peak arises from direct detachment, which is the main detachment process. Although the extracted PE spectra seem to contain only this feature, a smaller peak can be seen around 2.5 eV. Magnifications of the kinetic energy range beyond 2.0 eV are included in Fig. 3 and shows the peak arising from the large radii features in the images. The kinetic energy of this peak indicates that two photons have been absorbed via an intermediate state.
 | ||
| Fig. 3 Two-photon resonance-enhanced photoelectron spectra of phenolate and para-substituted alkyl-phenolate anions recorded at photon energies that are resonant with a DBS (see Fig. 2(a)). The signal has been amplified at higher electron kinetic energies (>2.0 eV) for clarity. Inset are the raw photoelectron images from which the spectra have been extracted. The central feature has been intentionally saturated to emphasise the outer narrow and anisotropic ring. | ||
There are a number of notable features associated with the two-photon peak. Firstly, the peak is very close to the photon energy. Hence, the state that is responsible for resonance-enhancement is weakly-bound. Secondly, the peak is spectrally narrow. This suggests that the potential energy surface of the intermediate state is very similar to the final neutral state. Thirdly, the PE angular distribution associated with the peak has maxima parallel to the polarization axis (β2 ∼ 1). Such emission anisotropy indicates that the outgoing PE is predominantly of p-wave character, so that the initial orbital is an s- or d-like state. Taken together, these observations are consistent with photodetachment from a non-valence state, i.e., the DBS of n-ph−. Indeed, our data are fully consistent with the much higher-resolution work from the Wang group on ph−.44 Given that the same resonance enhancement via a DBS is seen for all n-ph−, we can conclude that the DBS remains intact, despite the presence of the alkyl chain.
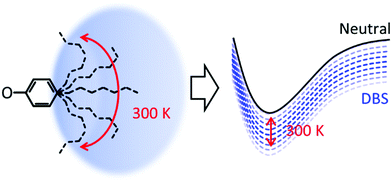
Considering that the DBS is retained in each compound, why is a loss in resolution observed in the action spectra? The alkyl groups are conformationally flexible, especially at 300 K. For 5-ph, DFT calculations suggest that the energy difference between geometries optimised from a fully extended and fully curled alkyl chain is only ∼0.12 eV (see ESI†). Moreover, we have calculated the barrier for rotation of 2-ph− to be <80 meV and this will only be smaller for longer chains.53 Hence, we anticipate that at 300 K there are many conformations ranging from ones with an extended chain to ones with a compact shape. Each conformation is likely to interact differently with the DBS, leading to a range of electron binding energies of the DBS, as shown schematically in Fig. 4. The consequence of this is a decrease in resolution for excitation to the DBS. As the tail becomes longer, the number of available conformers increases and the more the chain can interact with the DBS orbital, thus explaining the loss of resolution with increased chain length.
 | ||
| Fig. 4 Schematic diagram of effect of temperature on the conformational freedom of alkyl chain and the corresponding effect on the binding energy of the dipole-bound state. | ||
An alternative explanation for the loss of resolution of the 0–0 transition is that the EA differs for different conformations, which would lead to a change in excitation energy to the DBS. However, the PE spectra in Fig. 2(b) do not appear to support this. A variation in EA with conformational flexibility would lead to a reduction in the gradient of the PE signal's rising edge. This is not quite observed, although there is a clear loss in resolution also of the PE spectra, starting with the smallest chains. This loss of resolution has previously been noted also for ethyl-phenolate.54 Finally, it is also possible that the experiment only samples a sub-set of conformers. Specifically, if only certain conformers support a DBS, then only those would be observable. For instance, one might envisage that an alkyl chain that points into the DBS might be disruptive to the orbital and, hence, these conformers are not observed. However, one would expect that such a selectivity would also lead to a noticeable reduction in the relative signal of resonance-enhanced signal in Fig. 3, which is not observed.
Loss of DBS resonances in photodetachment spectra have previously been noted by Brauman and co-workers.19,38,39 The loss was attributed to the rotational motion of the neutral core; when the dipole moment rotates then the DBS electron lags behind and the effective dipole moment is reduced. If sufficiently fast, the reduction in dipole moment renders the DBS unbound. In the present case, an increase in n is expected to reduce the rotational speed of the dipole moment. Hence, it seems unlikely that rotational motion is the cause of the reduced resolution. Interestingly, Walthall et al. also noticed a loss of resolution in the photodetachment spectra of 4-X cyclohex-1-enolate when X = methyl was replaced by X = ethyl.39 This was considered to be a consequence of the coupling of the ethyl twisting to the rotational motion of the molecule, making the DBS unstable. However, we have shown here that such loss of resolution does not necessarily mean that the DBS is not present. It would be of interest to revisit some of these previous studies using resonance-enhanced PE spectroscopy.
The observation of a PE angular distribution with maxima parallel to the polarisation axis is consistent with photoemission from a DBS.14,15,55 Perhaps surprisingly, however, there is no qualitative change in the β2 parameter as a function of chain length. We had suspected that perhaps an alkyl chain “poking” a hole into a DBS orbital might alter the PE angular distribution, but this appears not to be the case, although we stress that our experiments measure an average of all conformations and so we might not be sensitive to such small effects.
While our 300 K experiments are of much reduced resolution compared to the experiments by the Wang group,44 there may be some advantages. Under cryogenic conditions, only a few conformations will be present, and these may be the ones that avoid the DBS orbital. Nevertheless, such cold experiments will be valuable, especially when combined with computational studies which are much more difficult at 300 K.
We have shown that a DBS is not destroyed by the presence of an alkyl chain, but can it survive in the bulk? In an apolar solvent, the density of molecules is too large and the excluded volume will not allow a DBS to exist. In polar solvents, the solvent itself can provide a dipolar stabilisation as is the case for charge-transfer-to-solvent (CTTS) states,56–58 which may be viewed as a DBS. However, much of biology exists as soft-matter, for which the molecular density can be much lower. For example, proteins contain large vacant pockets, which could accommodate a DBS that may have small molecular fragments poking into it. It is also noteworthy that the most stable conformation of tyrosine is the para-substituted phenolate anion rather than the carboxylic acid.59
Conflicts of interest
There are no conflicts to declare.Acknowledgements
This project has received funding from the European Union's Horizon 2020 research and innovation programme under grant agreement no. 765266.Notes and references
- E. Fermi and E. Teller, Phys. Rev., 1947, 72, 399–408 CrossRef CAS.
- K. D. Jordan and F. Wang, Annu. Rev. Phys. Chem., 2003, 54, 367–396 CrossRef CAS PubMed.
- J. Simons, J. Phys. Chem. A, 2008, 112, 6401–6511 CrossRef CAS PubMed.
- O. H. Crawford and W. R. Garrett, J. Chem. Phys., 1977, 66, 4968–4970 CrossRef CAS.
- R. F. Stebbings and F. B. Dunning, Rydberg states of atoms and molecules, Cambridge University Press, Cambridge Cambridgeshire, New York, 1983 Search PubMed.
- T. Sommerfeld, J. Phys.: Conf. Ser., 2005, 4, 245–250 CrossRef CAS.
- P. J. Sarre, Mon. Not. R. Astron. Soc., 2000, 313, L14–L16 CrossRef CAS.
- V. K. Voora and K. D. Jordan, J. Phys. Chem. A, 2014, 118, 7201–7205 CrossRef CAS PubMed.
- J. P. Rogers, C. S. Anstöter and J. R. R. Verlet, Nat. Chem., 2018, 10, 341–346 CrossRef CAS PubMed.
- J. M. Weber, M. W. Ruf and H. Hotop, Z. Phys. D: At., Mol. Clusters, 1996, 37, 351–357 CrossRef CAS.
- A. Kunin and D. M. Neumark, Phys. Chem. Chem. Phys., 2019, 21, 7239–7255 RSC.
- M. A. Yandell, S. B. King and D. M. Neumark, J. Am. Chem. Soc., 2013, 135, 2128–2131 CrossRef CAS PubMed.
- J. P. Rogers, C. S. Anstöter and J. R. R. Verlet, J. Phys. Chem. Lett., 2018, 9, 2504–2509 CrossRef CAS PubMed.
- J. N. Bull and J. R. R. Verlet, Sci. Adv., 2017, 3, e1603106 CrossRef PubMed.
- J. N. Bull, C. W. West and J. R. R. Verlet, Chem. Sci., 2016, 7, 5352–5361 RSC.
- F. Lecomte, S. Carles, C. Desfrancois and M. A. Johnson, J. Chem. Phys., 2000, 113, 10973–10977 CrossRef CAS.
- J. H. Hendricks, S. A. Lyapustina, H. L. de Clercq and K. H. Bowen, J. Chem. Phys., 1998, 108, 8–11 CrossRef CAS.
- R. D. Mead, K. R. Lykke, W. C. Lineberger, J. Marks and J. I. Brauman, J. Chem. Phys., 1984, 81, 4883–4892 CrossRef CAS.
- E. A. Brinkman, S. Berger, J. Marks and J. I. Brauman, J. Chem. Phys., 1993, 99, 7586–7594 CrossRef CAS.
- J. N. Bull, J. T. Buntine, M. S. Scholz, E. Carrascosa, L. Giacomozzi, M. H. Stockett and E. J. Bieske, Faraday Discuss., 2019, 217, 34–46 RSC.
- C. L. Adams, H. Schneider, K. M. Ervin and J. M. Weber, J. Chem. Phys., 2009, 130, 074307 CrossRef PubMed.
- S. T. Edwards, M. A. Johnson and J. C. Tully, J. Chem. Phys., 2012, 136, 154305 CrossRef PubMed.
- G. H. Gardenier, J. R. Roscioli and M. A. Johnson, J. Phys. Chem. A, 2008, 112, 12022–12026 CrossRef CAS PubMed.
- E. Matthews and C. E. H. Dessent, J. Phys. Chem. Lett., 2018, 9, 6124–6130 CrossRef CAS PubMed.
- C. G. Bailey, C. E. H. Dessent, M. A. Johnson and K. H. Bowen, J. Chem. Phys., 1996, 104, 6976–6983 CrossRef CAS.
- E. G. Diken, N. I. Hammer and M. A. Johnson, J. Chem. Phys., 2004, 120, 9899–9902 CrossRef CAS PubMed.
- E. F. Belogolova, G. Liu, E. P. Doronina, S. M. Ciborowski, V. F. Sidorkin and K. H. Bowen, J. Phys. Chem. Lett., 2018, 9, 1284–1289 CrossRef CAS PubMed.
- S. M. Ciborowski, G. Liu, J. D. Graham, A. M. Buytendyk and K. H. Bowen, Eur. Phys. J. D, 2018, 72, 139 CrossRef.
- J. H. Hendricks, H. L. de Clercq, S. A. Lyapustina and K. H. Bowen, J. Chem. Phys., 1997, 107, 2962–2967 CrossRef CAS.
- J. H. Hendricks, S. A. Lyapustina, H. L. d. Clercq, J. T. Snodgrass and K. H. Bowen, J. Chem. Phys., 1996, 104, 7788–7791 CrossRef CAS.
- D. L. Huang, G. Z. Zhu and L. S. Wang, J. Chem. Phys., 2015, 142, 091103 CrossRef PubMed.
- D. L. Huang, G. Z. Zhu, Y. Liu and L. S. Wang, J. Mol. Spectrosc., 2017, 332, 86–93 CrossRef CAS.
- D. L. Huang, H. T. Liu, C. G. Ning, P. D. Dau and L. S. Wang, Chem. Phys., 2017, 482, 374–383 CrossRef CAS.
- J. Czekner, L. F. Cheung, G. S. Kocheril and L. S. Wang, Chem. Sci., 2019, 10, 1386–1391 RSC.
- H. T. Liu, C. G. Ning, D. L. Huang and L. S. Wang, Angew. Chem., Int. Ed., 2014, 53, 2464–2468 CrossRef CAS PubMed.
- G. Z. Zhu, D. L. Huang and L. S. Wang, J. Chem. Phys., 2017, 147, 013910 CrossRef PubMed.
- N. I. Hammer, K. Diri, K. D. Jordan, C. Desfrançois and R. N. Compton, J. Chem. Phys., 2003, 119, 3650–3660 CrossRef CAS.
- D. A. Walthall, J. M. Karty and J. I. Brauman, J. Phys. Chem. A, 2005, 109, 8794–8799 CrossRef CAS PubMed.
- D. A. Walthall, J. M. Karty, B. Romer, O. Ursini and J. I. Brauman, J. Phys. Chem. A, 2005, 109, 8785–8793 CrossRef CAS PubMed.
- J. Simons, J. Chem. Phys., 1989, 91, 6858–6865 CrossRef CAS.
- A. S. Mullin, K. K. Murray, C. P. Schulz, D. M. Szaflarski and W. C. Lineberger, Chem. Phys., 1992, 166, 207–213 CrossRef CAS.
- W. R. Garrett, Phys. Rev. A: At., Mol., Opt. Phys., 1971, 3, 961–972 CrossRef.
- G.-Z. Zhu, L. F. Cheung, Y. Liu, C.-H. Qian and L.-S. Wang, J. Phys. Chem. Lett., 2019, 4339–4344 CrossRef CAS PubMed.
- H. T. Liu, C. G. Ning, D. L. Huang, P. D. Dau and L. S. Wang, Angew. Chem., Int. Ed., 2013, 52, 8976–8979 CrossRef CAS.
- G. Z. Zhu, C. H. Qian and L. S. Wang, J. Chem. Phys., 2018, 149, 164301 CrossRef.
- J. Lecointre, G. M. Roberts, D. A. Horke and J. R. R. Verlet, J. Phys. Chem. A, 2010, 114, 11216–11224 CrossRef CAS PubMed.
- L. H. Stanley, C. S. Anstöter and J. R. R. Verlet, Chem. Sci., 2017, 8, 3054–3061 RSC.
- W. C. Wiley and I. H. Mclaren, Rev. Sci. Instrum., 1955, 26, 1150–1157 CrossRef CAS.
- A. T. J. B. Eppink and D. H. Parker, Rev. Sci. Instrum., 1997, 68, 3477–3484 CrossRef CAS.
- D. A. Horke, G. M. Roberts, J. Lecointre and J. R. R. Verlet, Rev. Sci. Instrum., 2012, 83, 063101 CrossRef PubMed.
- G. M. Roberts, J. L. Nixon, J. Lecointre, E. Wrede and J. R. R. Verlet, Rev. Sci. Instrum., 2009, 80, 053104 CrossRef CAS PubMed.
- R. F. Gunion, M. K. Gilles, M. L. Polak and W. C. Lineberger, Int. J. Mass Spectrom., 1992, 117, 601–620 CrossRef CAS.
- C. S. Anstöter, C. R. Dean and J. R. R. Verlet, J. Phys. Chem. Lett., 2017, 8, 2268–2273 CrossRef PubMed.
- C. S. Anstöter, C. R. Dean and J. R. R. Verlet, Phys. Chem. Chem. Phys., 2017, 19, 29772–29779 RSC.
- J. P. Rogers, C. S. Anstöter, J. N. Bull, B. F. E. Curchod and J. R. R. Verlet, J. Phys. Chem. A, 2019, 123, 1602–1612 CrossRef CAS PubMed.
- P. J. Nowakowski, D. A. Woods and J. R. R. Verlet, J. Phys. Chem. Lett., 2016, 7, 4079–4085 CrossRef CAS PubMed.
- S. E. Bradforth and P. Jungwirth, J. Phys. Chem. A, 2002, 106, 1286–1298 CrossRef CAS.
- D. Serxner, C. E. H. Dessent and M. A. Johnson, J. Chem. Phys., 1996, 105, 7231–7234 CrossRef CAS.
- Z. Tian, X. B. Wang, L. S. Wang and S. R. Kass, J. Am. Chem. Soc., 2009, 131, 1174–1181 CrossRef CAS PubMed.
Footnote |
| † Electronic supplementary information (ESI) available: Supporting calculations. See DOI: 10.1039/c9cp04942h |
| This journal is © the Owner Societies 2019 |
