Structure, electrical conductivity and oxygen transport properties of perovskite-type oxides CaMn1−x−yTixFeyO3−δ†
Received
4th September 2019
, Accepted 18th September 2019
First published on 18th September 2019
Abstract
Calcium manganite-based perovskite-type oxides hold promise for application in chemical looping combustion processes and oxygen transport membranes. In this study, we have investigated the structure, electrical conductivity and oxygen transport properties of perovskite-type oxides CaMn1−x−yTixFeyO3−δ. Distinct from previous work, data of high-temperature X-ray diffraction (HT-XRD) in the temperature range 600–1000 °C (with intervals of 25 °C) demonstrates that CaMnO3−δ (CM) transforms from orthorhombic to a mixture of orthorhombic and tetragonal phases between 875 °C and 900 °C. Rietveld refinements show the formation of a pure tetragonal phase at 975 °C and of a pure cubic phase at 1000 °C. Partial substitution of manganese by iron and/or titanium to yield CaMn0.875Ti0.125O3−δ (CMT), CaMn0.85Fe0.15O3−δ (CMF) or CaMn0.725Ti0.125Fe0.15O3−δ (CMTF) leads to different phase behaviours. While CMT remains orthorhombic up to the highest temperature covered by the HT-XRD experiments, CMF and CMTF undergo an orthorhombic → tetragonal → cubic sequence of phase transitions. Electrical conductivity relaxation measurements are conducted to determine the chemical diffusion coefficient (Dchem) and the surface exchange coefficient (kchem) of the materials. The results demonstrate that oxygen transport is hindered in the tetragonal phase, when occurring, which is attributed to a possible ordering of oxygen vacancies. The small polaron electrical conductivity of CM in the cited temperature range is lowered upon partial manganese substitution, by about 10% for CMF and up to half an order of magnitude for CMT and CMTF.
1. Introduction
Chemical looping combustion (CLC) is a combustion technology for power and heat generation integrated with CO2 capture.1–6 The gaseous fuel is oxidized by lattice oxygen from a solid oxide, typically a transition metal-containing oxide. The oxygen carrier material (OCM) is circulated between the fuel reactor and an adjacent air reactor, where it is re-oxidized by air for the next cycle. The combustion reaction produces CO2 and H2O, which can easily be separated by condensation, hence producing a pure CO2 stream. CLC technology is conceptually linked to membrane-based oxyfuel combustion, where oxygen is supplied to the fuel by an oxygen transport membrane (OTM), separating oxygen from air.7–10 Both applications rely on solid oxides (referring to the OCM and OTM materials), showing fast oxygen transport kinetics and reliable operation in atmospheres containing CO2, SO2, and/or water.
Calcium manganite, in which 12.5 mol% of manganese is substituted by titanium, was shown to hold promise for CLC applications.11–13 Recently, we demonstrated an improved performance for CaMn0.875−xTi0.125FexO3−δ.14 The partial co-substitution of manganese by titanium and iron enhances both the oxygen storage capacity and release kinetics and lowers the degradation rate. Optimal performance was found for the composition with 15 mol% iron.14 Asymmetric OTM membranes based on CaMn0.25Ti0.6Fe0.15O3−δ operated in CO2-containing atmospheres showed a stable oxygen flux over 6 months, without significant degradation.15 In the present study, we have determined the evolution of structure and oxygen transport properties of CaMnO3−δ (CM), CaMn0.875Ti0.125O3−δ (CMT), CaMn0.85Fe0.15O3−δ (CMF), and CaMn0.725Ti0.125Fe0.15O3−δ (CMTF) with temperature, using high-temperature X-ray diffraction, differential thermal analysis, thermogravimetry and electrical conductivity relaxation measurements.
2. Experimental
2.1 Powder synthesis and sintering
Powders of CM, CMT, CMF and CMTF were synthesized as described elsewhere.4 The powders were milled in ethanol for 30 min using a planetary ball mill (Retsch PM 100) with a 150 mm diameter zirconia bowl and 5 mm zirconia balls operated at 250 rpm. The powder was dried and sieved, and the fraction below 45 μm was uniaxially pressed into a pellet, which was further compacted using a cold isostatic press at 400 MPa. Further densification was achieved by the following procedure: the green pellet was placed onto a platinum foil inside a tubular furnace and heated (200 K h−1) under a flow of 2% H2 in nitrogen up to ∼800 °C. Upon reaching that temperature, the atmosphere was changed to a flow of pure nitrogen, and the sample further heated with an unchanged rate until the sintering temperature was reached (1450 °C for CM and CMT, 1400 °C for CMF and CMTF), followed by a dwell of 12 h at this temperature.16 Subsequently, the sample was cooled at a rate of 5 °C min−1 to 1250 °C, at which the gas flow was changed to 10% oxygen in nitrogen. The sample was kept for 6 h at the temperature of 1250 °C, and subsequently slowly cooled down at 1 °C min−1 to room temperature to avoid the formation of cracks. Dense ceramic pellets were obtained with relative densities in excess of 99%, as measured by Archimedes’ method.
2.2 X-ray diffraction
Room temperature powder X-ray diffraction (XRD) measurements were performed on a Rigaku SmartLab X-Ray Diffractometer in Bragg–Brentano mode (Cu Kα radiation). Finely ground and sieved powder (<90 μm) was dispersed onto the sample holder and data was collected from 15 to 60° with a step size of 0.02° and 0.5° per minute min scanning speed. For high-temperature X-ray diffraction measurements (HT-XRD) measurements, a Rigaku Ultima IV instrument with CuKα radiation accelerated at 40 kV and 40 mA was employed. The powder samples were heated to 975 °C under a 30 ml min−1 flow of synthetic air. XRD patterns were recorded from 975 °C or 1000 °C down to 600 °C with 25 °C intervals. At each temperature the sample was allowed to equilibrate for 10 min. Data were acquired in the 2θ range 10–75° with a step size of 0.02° and a scan speed of 1 °C min−1. The Full Prof software package was used for Rietveld refinements of the obtained patterns.17 Room temperature XRD patterns of sintered ceramic bodies were recorded on a Bruker D2 Phaser instrument with Cu-Kα radiation (λ = 1.54184 Å).
2.3 Thermal analysis
Differential thermal analysis (DTA) and thermogravimetric analysis (TGA) data were collected on a Netzsch STA 449 F3 Jupiter instrument. Prior to experiments, the samples held in alumina crucibles were heated to 1000 °C under a synthetic air flow to remove any adsorbed species. After a dwell of 30 min at this temperature, the sample was cooled to 100 °C. For DTA experiments, about 50 mg of powder was used. Measurements were performed in the range 100–1000 °C, with heating and cooling rates of 10 °C min−1. Data were corrected for the instrumental background obtained by recording data for an empty crucible under the same conditions. Throughout the experiments, the flow rate was kept constant at 100 ml min−1.
For determining accurately changes in the oxygen stoichiometry of the samples, TGA experiments were conducted using about 175 mg of powder. Data were collected during cooling from 1000 to 650 °C, with intervals of 25 °C, at 4.5, 10, 21, 42 and 90% O2 in N2, maintaining a total flow rate of 200 ml min−1 (STP). Heating and cooling rates were set at 10 °C min−1. The chosen partial pressures of oxygen correspond with those used in the electrical conductivity relaxation (ECR) experiments. At each temperature and oxygen partial pressure, the sample was allowed to equilibrate. Dwell stages were 30 min in the range 1000–775 °C, 45 min at 750 and 725 °C, 60 min at 700 and 675 °C, and 90 min at 650 °C. The measured mass was corrected for the buoyancy effect by subtracting the data for an empty crucible under the same conditions.
2.4 Electrical conductivity and conductivity relaxation measurements
Thin rectangular bars with approximate dimensions 12 × 6 × 0.5 mm3 were cut out of the sintered sample pellets, and the two largest surfaces polished until a mirror-like finish was obtained. The final thicknesses of the samples were 0.64 mm, 0.57 mm, 0.47 mm and 0.46 mm for CM, CMT, CMF, and CMTF, respectively. A four-probe dc method was used to collect data on electrical conductivity. To this end two gold wires (Alfa Aesar, 99.999%, 0.25 mm in diameter and approximately 4 cm in length) were wrapped around the sample close to the bar ends to serve as current leads. Two additional gold wires were wrapped around the sample, about 2 mm remote from the previously fixed electrodes, as voltage probes. Prior to mounting, four indents were cut using a diamond blade along each long side of the sample for fixing of the electrodes. Sulphur-free gold paste (MaTeck GmbH, Jülich, Germany) was applied to improve electrical contact between electrodes and sample. Finally, the sample was thermally treated in air to sinter the gold paste, using a chamber furnace at a temperature of 950 °C. Heating and cooling rates throughout the experiments were set at 1 °C min−1.
The sample was suspended above an alumina rod functioning as the sample holder by tightly wrapping the sample electrodes around the Au wires of the sample holder. Care was taken that gas could flow freely around the sample. The sample holder was slid into the Al2O3 reactor with a diameter of 12 mm, thereby confining the sample to a chamber with a volume of 2.58 cm3. Using a gas flow rate of 280 ml min−1 and assuming a continuously ideally stirred tank reactor, the small reactor volume ensures a flush time between 0.13 s at 925 °C and 0.16 s at 650 °C. A K-type thermocouple was placed a few millimetres beneath the sample and used to continuously monitor the temperature. Two parallel gas streams, each with a total flow rate of 280 ml min−1, with different pO2 values (between 0.01 and 1 atm) were created by mixing dried oxygen and nitrogen in the desired ratios using Brooks GF040 mass flow controllers. One of the streams was led through the reactor and, subsequently, through an oxygen sensor (Systech Zr893/4). A pneumatically-operated four-way valve was utilised to rapidly switch between both gas streams to achieve an instantaneous change in pO2. A Keithley 2400 SourceMeter® was used to provide a current of 30–100 mA through the sample, the magnitude depending on the sample conductivity. Another instrument of the same type was used to measure the voltage over the sample with a sampling rate of about 10 Hz.
The sample was heated to 925 °C under a 280 ml min−1 flow of synthetic air (pO2 = 0.21 atm). Electrical conductivity relaxation (ECR) measurements were performed after step changes in pO2 between 0.147 to 0.215 atm. It was assumed that equilibrium was reached after a time of 15τc, where τc is the characteristic time when the transient conductivity is fitted to a regular exponential function of the elapsed time. A series of five oxidation and reduction steps was performed for each temperature in the range 925–650 °C. The temperature was changed stepwise, with intervals of 25 °C. To check the reproducibility, the same series of oxidation and reduction steps was repeated by increasing the temperature back to 925 °C and measuring again at each 25 °C interval. The series of measurements was set up with a custom-made LabVIEW program, which was also used for data acquisition. Data on the electrical conductivity of the samples was collected at each temperature.
The transient conductivity after each pO2 step change was normalized according to eqn (1). Normalized data were cut off at 10τc and fitted to eqn (2)–(4) to obtain the chemical diffusion coefficient Dchem and the surface exchange coefficient kchem.
| |  | (1) |
| |  | (2) |
| |  | (3) |
| |  | (4) |
In these equations,
g(
t) is the normalized conductivity,
σ0 and
σ∞ are the conductivities
σ(
t) at time
t = 0 and
t = ∞, respectively,
τf the flush time constant of the reactor, and 2
bi the sample dimension along coordinate
i, whilst
βm,i are the non-zero roots of
eqn (4). The critical thickness
Lc =
Dchem/
kchem is the critical thickness below which oxygen surface exchange prevails over bulk oxygen diffusion in determining the rate of re-equilibration rate after a
pO
2 step change. The flush time
τf was calculated from
| |  | (5) |
in which
Vr is the volume (2.58 cm
3) of the chamber in which the sample is located,
θv the gas flow rate through the reactor,
Tr the temperature in the reactor, and
TSTP the temperature at standard conditions.
Dchem and
kchem, together with
t0, were fitted using a non-linear least-squares program based on the Levenberg–Marquardt algorithm. To prevent finding local minima in the fitting routine, initial estimates for the fitting parameters were calculated, using
| |  | (6) |
| |  | (7) |
where
Dinit and
kinit are the initial values for the fitting parameters
Dchem and
kchem, respectively, and
bz is half the sample thickness, noting that
bz ≪
bx,
by.
Eqn (6) assumes that diffusion governs the relaxation, while
eqn (7) assumes that surface exchange governs the relaxation. The intersection between the tangent line of the conductivity before the
pO
2 step and that of the conductivities between
g = 0.005 and
g = 0.05 served as the initial value for the parameter
t0. Values of
Dchem and
kchem obtained from fitting data of at least three subsequent reduction steps were averaged. Additional descriptions of the ECR technique and the model used for data fitting are given elsewhere.
18,19
3. Results and discussion
3.1 Structure and phase stability
Room temperature XRD powder diffractograms of CM, CMT, CMF and CMTF are shown in Fig. 1. The corresponding structural parameters and reliability factors obtained from Rietveld refinements in the orthorhombic space group Pnma are listed in Table 1. Analysis reveals that all four compositions are single phase. The cell parameters obtained for CM are found to be in good agreement with a = 5.281(1) Å, b = 7.453(1) Å and c = 5.266(1) Å reported by Leonidova et al.,20a = 5.274(3) Å, b = 7.467(5) Å and c = 5.277(2) Å by Rørmark et al.,21 and a = 5.282 Å, b = 7.452 Å and c = 5.265 Å by Taguchi et al.22 The small differences between the obtained data in each of these studies and the current study might be related to a different oxygen stoichiometry of the samples, depending on the atmosphere and cooling rate. Analysis of the room temperature XRD patterns of sintered ceramic bodies of CM, CMT, CMF and CMTF revealed no apparent differences with those of the corresponding powders displayed in Fig. 1.
 |
| | Fig. 1 Measured (red symbols) and calculated (black line) XRD patterns for CM, CMT, CMF and CMTF at room temperature. Bragg positions and the residual plot are indicated. Extra peaks attributed to copper Kβ are labelled with a star (*). | |
Table 1 Structural parameters and reliability factors obtained from Rietveld refinements of room temperature XRD patterns. The numbers in parentheses denote standard deviations in units of the least significant digits
|
|
a [Å] |
b [Å] |
c [Å] |
V [Å3] |
R
Bragg [%] |
R
wp [%] |
χ
2 [−] |
| CM |
5.2803(2) |
7.4527(3) |
5.2639(2) |
207.154(2) |
3.382 |
14.62 |
1.42 |
| CMT |
5.2965(5) |
7.4754(9) |
5.2779(5) |
208.982(4) |
4.972 |
16.90 |
1.25 |
| CMF |
5.2964(1) |
7.4778(2) |
5.2835(1) |
209.263(1) |
5.878 |
15.20 |
1.51 |
| CMTF |
5.3138(7) |
7.4970(6) |
5.3002(5) |
211.154(4) |
3.709 |
15.30 |
1.14 |
Fig. S1 (ESI†) shows the HT-XRD patterns of CM recorded in air on cooling from 1000 °C to 600 °C. On the basis of a combined DTA and HT-XRD (at room temperature, 900 °C and 920 °C) study, Taguchi et al.22 proposed a phase transition sequence for CM from orthorhombic (Pnma) to tetragonal (I4/mcm) at 896 °C, and from tetragonal to cubic (Pm![[3 with combining macron]](https://www.rsc.org/images/entities/char_0033_0304.gif) m) at 913 °C. In subsequent thermal analysis studies,21,23 the two sequential peaks observed in this temperature region were assigned to these phase transitions. Pseudo-cubic lattice parameters obtained from Rietveld refinements of the HT-XRD patterns recorded for CM (with intervals of 25 °C) in this study are given in Fig. 2a. Our results reveal that CM remains orthorhombic up to 875 °C. Refinements of the patterns obtained in the range 900–950 °C yield a mixture of orthorhombic and tetragonal phases. Only at 975 °C a pure tetragonal phase, and at 1000 °C a pure cubic phase is obtained. Results from DTA carried out in this study as shown in Fig. 3a confirm the presence of two sequential endothermic phase transitions on heating of CM in air, albeit that the second peak is significantly less distinct than observed in some of the above-cited studies.21–23 There are only small discrepancies between the onset temperatures found in this study (903 °C and 921 °C) and those reported by Taguchi et al.22 (896 °C and 913 °C) and Rørmark et al.21 (904 °C and 923 °C).
m) at 913 °C. In subsequent thermal analysis studies,21,23 the two sequential peaks observed in this temperature region were assigned to these phase transitions. Pseudo-cubic lattice parameters obtained from Rietveld refinements of the HT-XRD patterns recorded for CM (with intervals of 25 °C) in this study are given in Fig. 2a. Our results reveal that CM remains orthorhombic up to 875 °C. Refinements of the patterns obtained in the range 900–950 °C yield a mixture of orthorhombic and tetragonal phases. Only at 975 °C a pure tetragonal phase, and at 1000 °C a pure cubic phase is obtained. Results from DTA carried out in this study as shown in Fig. 3a confirm the presence of two sequential endothermic phase transitions on heating of CM in air, albeit that the second peak is significantly less distinct than observed in some of the above-cited studies.21–23 There are only small discrepancies between the onset temperatures found in this study (903 °C and 921 °C) and those reported by Taguchi et al.22 (896 °C and 913 °C) and Rørmark et al.21 (904 °C and 923 °C).
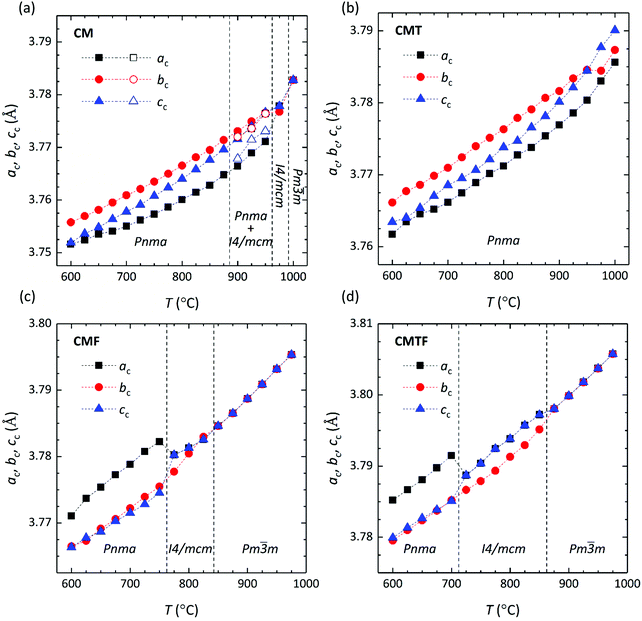 |
| | Fig. 2 Pseudo cubic lattice parameters as a function of temperature for (a) CM, (b) CMT, (c) CMF, and (d) CMFT. Lattice parameters were calculated, using  , ,  and ac = cortho/2 for the orthorhombic (Pnma) structure, and and ac = cortho/2 for the orthorhombic (Pnma) structure, and  and cc = ctetra/2 for the tetragonal (I4/mcm) structure. For the cubic (Pmm) structure ac = bc = cc = acubic. and cc = ctetra/2 for the tetragonal (I4/mcm) structure. For the cubic (Pmm) structure ac = bc = cc = acubic. | |
 |
| | Fig. 3 DTA curves for (a) CM, (b) CMT, (c) CMF, and (d) CMTF recorded under heating and cooling in synthetic air. The insets in (a) and (b) show magnified regions around the endothermic phase transitions occurring upon heating in CM and CMT, respectively. | |
Lattice parameters from Rietveld refinements of the HT-XRD patterns for CMT are given in Fig. 2b. The DTA curve recorded for this material is shown in Fig. 3b, from which it is obvious that the endothermic phase transitions observed on heating of CM are shifted to slightly higher temperatures (927 °C and 942 °C) in CMT. The Rietveld refinements for CMT, however, do not give evidence for a phase transition in this material. The HT-XRD patterns can be indexed orthorhombic up to the maximum temperature of 1000 °C covered by the experiments (see Fig. 2b). The refinements of the HT-XRD patterns for CMF and CMTF (see Fig. 2c and d, respectively) show an orthorhombic → tetragonal → cubic sequence of transitions occurring upon heating of both materials, which is consistent with that found for parent CM by Taguchi et al.;22 the indexing of the patterns is found compatible with space groups Pnma, I4/mcm and Pmm, respectively. The same sequence of phase transitions has been reported for CaFexTi1−xO3−δ.24,25 Structural parameters and reliability factors obtained from typical Rietveld refinements for every space group of CMF and CMTF are given in Tables S1 and S2 (ESI†), respectively. The DTA curves recorded for CMF and CMTF are shown in Fig. 3c and d, respectively. No peaks can be discerned, indicating that the structural transitions in both materials are continuous.
3.2 Oxygen nonstoichiometry
Although data of high-temperature neutron diffraction could resolve apparent ambiguities, the temperature-induced phase transitions as observed in CM, CMF and CMTF are believed to result from cooperative tilting of BO6 octahedra, which is the most commonly observed distortion in perovskite structures.26,27 The orthorhombic Pnma structure, in Glazer's notation28,29 denoted by a−a−c+, is one of the most common perovskite variants with a three-tilt system.26,27 With increasing temperature, materials with this structure lose their tilts via a series of transitions, ending up with the ideal cubic Pmm structure, in which there are no tilts (a0a0a0).30 Several authors have discussed that the sequence of structural phase transitions in parent CM is influenced by the degree of oxygen nonstoichiometry exhibited by the material.20,21 From the pO2-T-δ phase diagram of CM published by Leonidova et al.20 it may be inferred that the intermediate tetragonal I4/mcm structure with tilt configuration a0a0c− is absent at ideal oxygen stoichiometry. Results of density functional theory (DFT) calculations indicate that the phase may appear as a result of ordering of oxygen vacancies.30
The temperature and oxygen partial pressure dependence of the oxygen nonstoichiometry of CM, CMT, CMF and CMTF in this work was studied by TGA. Fig. 4 shows the corresponding weight changes as a function of temperature during heating in synthetic air (pO2 = 0.21 atm). The weight changes are found reversible on heating and cooling (not shown). Oxygen loss for CMF and CMTF starts around 350–400 °C, while for CM and CMT oxygen is not released below about 650 °C. The degree of oxygen nonstoichiometry at equal temperatures is notably more pronounced for the former two materials, which is ascribed to the presence of the more reducible iron cations.
 |
| | Fig. 4 TGA of CM, CMT, CMF and CMTF during heating and cooling in synthetic air at 10 °C min−1. The inset shows a magnification of the temperature region where phase transitions occur in CM and CMT. | |
The inset in Fig. 4 shows that the slope of the temperature dependence of the weight change in both CM and CMT changes slightly after the apparent phase transitions occurring in both materials. For CM, this observation is consistent with the phase diagram published by Leonidova et al.20 The observed onset temperatures, 902 °C and 927 °C for CM and 921 °C and 950 °C for CMT, are in fair agreement with the corresponding results from DTA (see Fig. 3).
As shown by Leonidova et al.20 and Rørmark et al.,21 the phase transition temperatures in CM decrease with increasing oxygen deficiency. It is therefore postulated here that the lower transition temperatures observed for CMF and CMTF (cf.Fig. 2c and d, respectively) compared to those reported for CM by, e.g., Taguchi et al.22 might be related to the comparatively high oxygen deficiencies exhibited by the former two materials. This further suggests that the transition temperatures can be tuned by the degree of manganese substitution. Additional research is required to demonstrate our hypothesis.
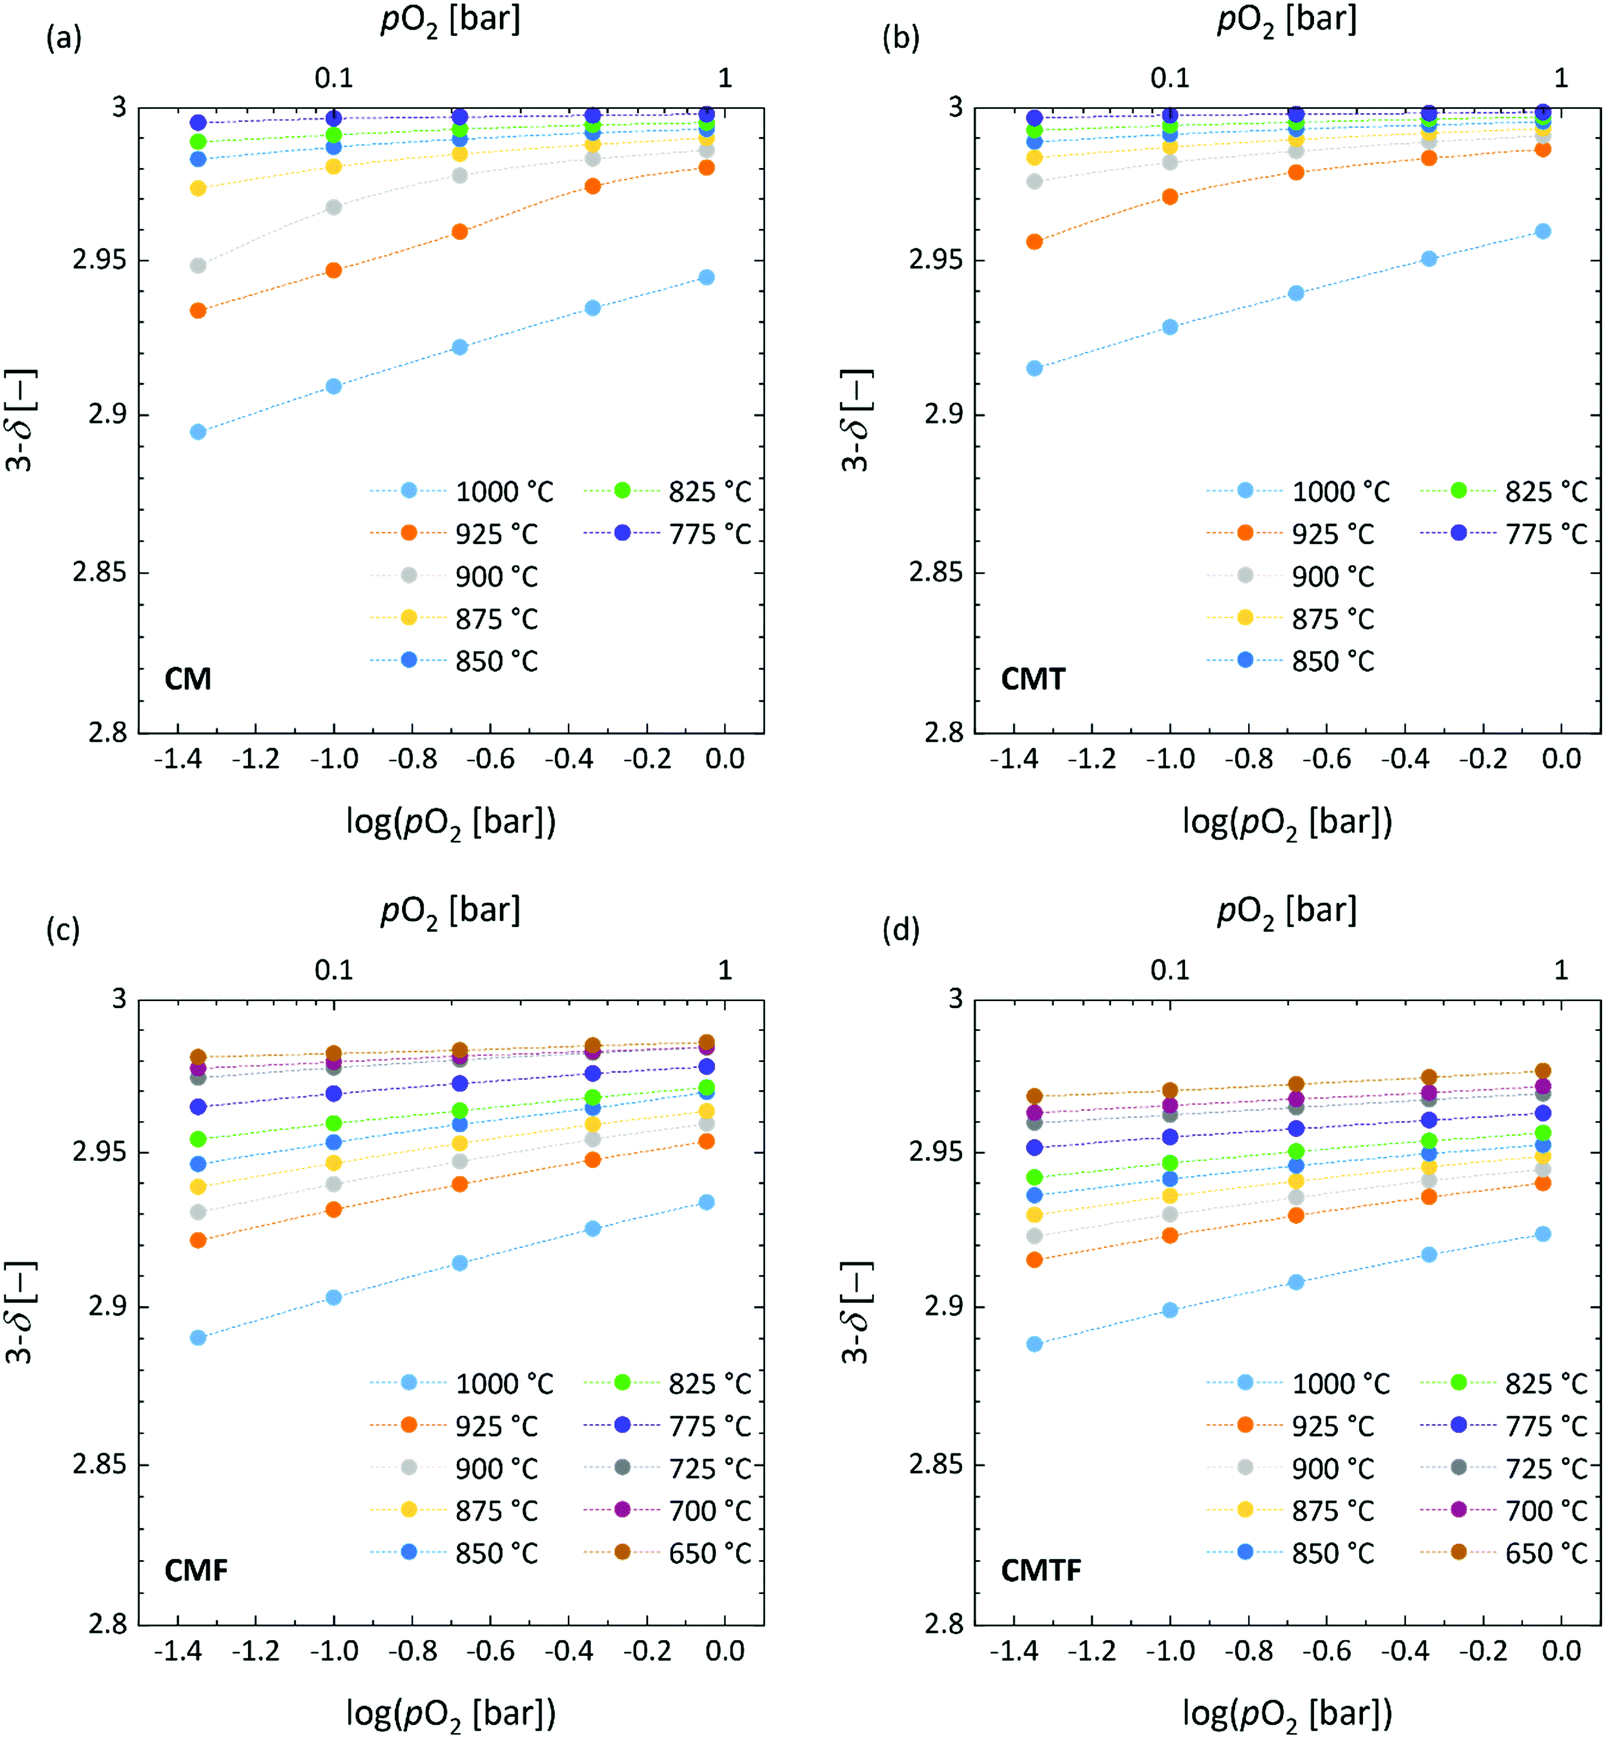
The oxygen stoichiometry (3 − δ) as a function of log (pO2) for the different materials is presented in Fig. 5. The corresponding TGA measurements were performed to support analysis of data obtained from ECR measurements as will be discussed below. For the evaluation it was assumed that δ = 0 at room temperature.
 |
| | Fig. 5 Oxygen stoichiometry (3 − δ) at different temperatures for (a) CM, (b) CMT, (c) CMF and (d) CMTF calculated from data of TGA. Dashed lines are drawn to guide the eye. | |
3.3 Electrical conductivity
Fig. 6 shows the temperature dependences of the electrical conductivity of the investigated materials in this study as a function of temperature at pO2 = 0.21 atm. The conductivity of CM, CMF and CMTF show Arrhenius behaviour with activation energies in the range 80–92 kJ mol−1. For CMT, a change in activation energy is apparent at about 875 °C.
 |
| | Fig. 6 Total electrical conductivity as a function of temperature measured at pO2 = 0.21 atm. | |
Electrical conductivity in undoped CM is due to the formation of small polarons, which migrate via thermally activated hopping.24,25 Charge disproportionation, involving the transfer of an electron between adjacent Mn4+ ions,
| |  | (8) |
leads to the formation of localized electrons

and electron holes Mn
5+ (

) that are trapped by local lattice distortions due to electron–phonon coupling: these are the n- and p-type small polarons, respectively. Throughout this paper standard Kröger–Vink notation is used to describe defect chemical reactions. The negative sign of the Seebeck coefficient confirms that the n-type polarons are the dominant charge carriers in CM.
20,31 The p-type polaronic charge carriers in CM appear to be effectively immobile.
20 The electrical conductivity in CM is thus expected to obey:

, the latter denoting the product of the number of charge carriers and the number of sites to which they can hop. Since variations in

are very small,
32 the conductivity is thus essentially governed by the concentration of Mn
3+ cations

. In addition to
reaction (8), their concentration is affected by the exchange of oxygen between the gas phase and the oxide,
| |  | (9) |
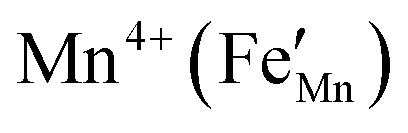
and by aliovalent doping. Charge neutrality requirements predict that acceptor doping,
e.g., Fe
3+ substituted for

will lower the electrical conductivity, which is accord with the observation that the electrical conductivity decreases on going from CM to CMF (
Fig. 6). Such an explanation is also consistent with the increase in electrical conductivity observed upon donor doping of CM with Nb
5+.
33 It is further seen from
Fig. 6 that the electrical conductivity of CM drops almost half an order of magnitude after the isovalent substitution of Mn
4+ with Ti
4+ ions, suggesting that it is the mobility of the n-type small polarons that is highly affected by the titanium substitution. A detailed study, however, is required to substantiate this conclusion and to provide further insights into the mechanism of electrical conduction in these solids. Additional investigations are also required to clarify the origin of the change in activation energy of the electrical conductivity found for CMT at about 875 °C (
Fig. 6).
3.4 Electrical conductivity relaxation
The oxygen transport properties of CM, CMT, CMF and CMTF were evaluated by ECR experiments. Normalized conductivity curves acquired from 925 to 650 °C after a pO2 step change from 0.215 to 0.146 atm for CMT are shown in Fig. 7. Excellent reproducibility was found during heating and cooling experiments. Similar results were obtained for the other compositions. In general, faster re-equilibration times after a pO2 step change are obtained with increase of temperature, although it should be noted that in the specific case of CMT (as can be inferred from Fig. 7) and that of CM (not shown) the re-equilibration times at the highest temperatures are observed to increase again with further increase of temperature.
 |
| | Fig. 7 Normalized conductivity curves for CMT. Data are acquired from 925 to 650 °C, with 25 °C intervals, after a pO2 step change from 0.215 to 0.146 atm. | |
Measurement accuracy.
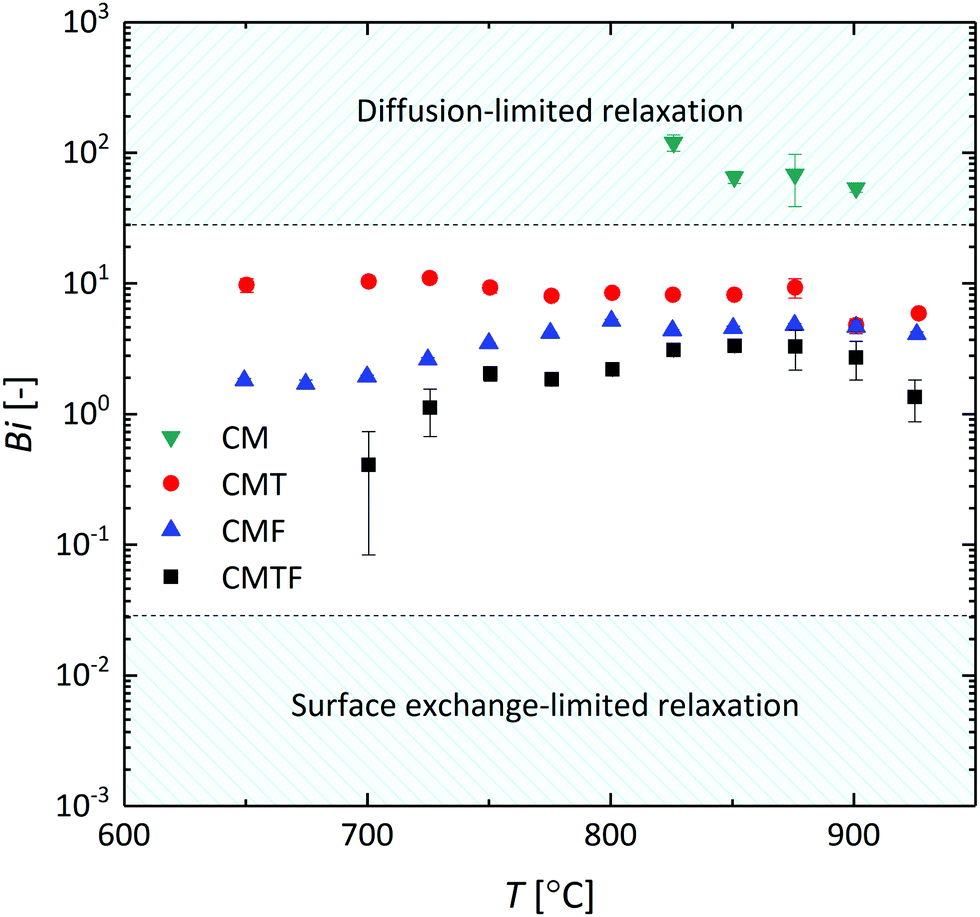
A typical fit and associated error colour map obtained from fitting of the data of a single relaxation experiment are shown in Fig. S2 (ESI†). Analysis of experimental data allows simultaneous determination of Dchem and kchem provided that both processes contribute in a quantifiable manner to the overall relaxation process. The latter is constrained by the accuracy of measurements, e.g., the noise of data, but also by the extent to which the re-equilibration after a pO2 step change is determined by diffusion and by surface exchange. A useful quantity in this respect is bz/Lc = bzkchem/Dchem (cf.eqn (4), noting that bz ≪ bx, by), which can be identified with the Biot number (Bi) commonly used in analysis of mass transport, and which parameter represents the ratio between two characteristic times: bz2/Dchem for diffusion and bz/kchem for surface exchange. A Biot plot for the data obtained in this study is given in Fig. 8, showing that for given thicknesses and conditions (see the Experimental section) oxygen transport in CMT, CMF and CMTF over the entire range in temperature is in the mixed controlled region (0.03 ≤ Bi ≤ 30),7 whereas that of CM is in the diffusion-controlled region. Over a large range in temperature it was not possible to extract values of kchem for CM from the data of experiments.
 |
| | Fig. 8 Biot number (Bi) as a function of temperature. Error bars indicate the standard error calculated based on averaging at least three experiments per temperature. Following Den Otter et al.18 the mixed-controlled region is found for 0.03 ≤ Bi ≤ 30. | |
Chemical diffusion and surface exchange coefficients.
Arrhenius plots of Dchem and kchem derived from the data of ECR measurements on CM, CMT, CMF and CMTF are shown in Fig. 9. A reasonable to good agreement of the values extracted from data of oxidation and reduction runs is obtained, suggesting that at given experimental conditions the constancy of Dchem and kchem over the applied pO2 step change as assumed in the fitting procedure is satisfied accordingly.18Fig. 9 shows that the Arrhenius plots of Dchem and kchem for all four compositions studied are subject to significant curvature. The curvature of the plots appears to be highly similar for both parameters, which holds for CMT, CMF and CMTF, suggesting that for each of these materials Dchem and kchem are strongly correlated. Other authors have arrived at similar conclusions on the basis of studies on different materials. For example, see ref. 34, 35, 36 and 37. A similar statement cannot be made for CM since, as was mentioned above, accurate values for kchem for CM could not be obtained from the fitting procedure.
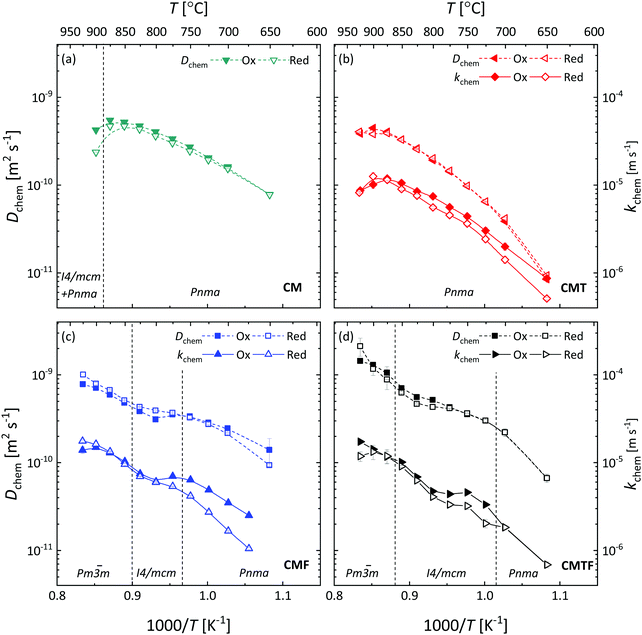 |
| | Fig. 9 Inverse temperature dependence of the chemical diffusion coefficient (Dchem) and the surface exchange coefficient (kchem) for (a) CM, (b) CMT, (c) CMF, and (d) CMTF. Dashed lines serve as a guide to the eye. The filled and open symbols represent the data of oxidation and reduction step changes, respectively. The structures occurring in the different temperature regions are designated by their space groups. The vertical dashed lines denote by approximation the temperatures at which the phase transitions occur. | |
Oxygen self-diffusion and vacancy diffusion coefficients.
To further analyse the data, the oxygen self-diffusion coefficients, Ds, and the oxygen vacancy diffusion coefficients, DV, for CM, CMT, CMF and CMTF were evaluated from the measured values of Dchem, using the relationshipswhere γO and γV are the thermodynamic factors,8| |  | (12) |
| |  | (13) |
which can be derived from corresponding data of the oxygen nonstoichiometry for each of the compositions (Fig. 5). Strictly speaking, eqn (10) and (11) hold for materials with predominant electronic conductivity.8 Corresponding results for DS and DV for all four compositions are given in Fig. 10 and 11, respectively. The results reveal that for CMT (Fig. 10b and 11b) both parameters show Arrhenius behaviour over the entire range in temperature covered by the experiments. For CM (Fig. 10a and 11a), the linear behaviour extends up to 875 °C, above which temperature the material transforms partially from orthorhombic (Pnma) to a mixture of orthorhombic (Pnma) and tetragonal (I4/mcm) phases. The high values observed for the average activation energies of DS, 240 ± 19 kJ mol−1 and 275 ± 15 kJ mol−1 for CM and CMT, respectively, confirm that there are very few oxygen vacancies in both materials. The latter is reflected in the much lower activation energies found for DV of both compositions, 75 ± 17 kJ mol−1 and 113 ± 16 kJ mol−1 for CM and CMT, respectively.
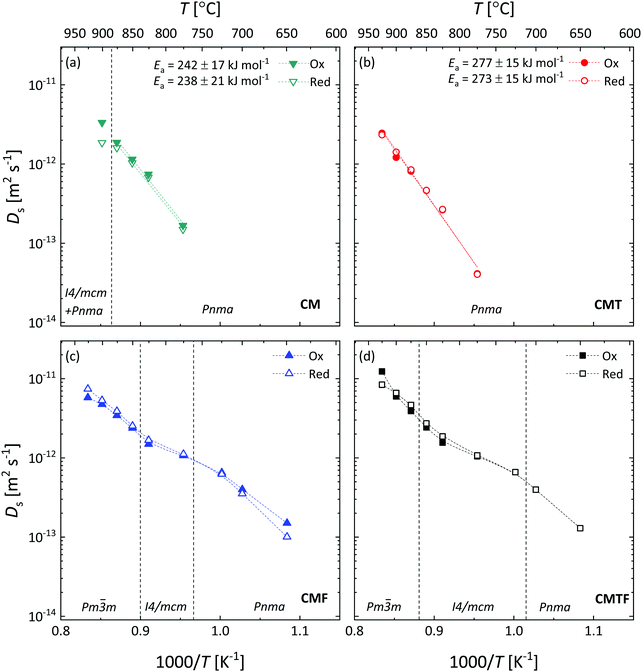 |
| | Fig. 10 Inverse temperature dependence of the oxygen self-diffusion coefficient (Ds) for (a) CM, (b) CMT, (c) CMF, and (d) CMTF. Dashed lines serve as a guide to the eye. The filled and open symbols represent the data of oxidation and reduction step changes, respectively. The structures occurring in the different temperature regions are designated by their space groups. The vertical dashed lines denote by approximation the temperatures at which the phase transitions occur. | |
 |
| | Fig. 11 Inverse temperature dependence of the oxygen vacancy coefficient (DV) for (a) CM, (b) CMT, (c) CMF, and (d) CMTF. Dashed lines serve as a guide to the eye. The filled and open symbols represent the data of oxidation and reduction step changes, respectively. The structures occurring in the different temperature regions are designated by their space groups. The vertical dashed lines denote by approximation the temperatures at which the phase transitions occur. | |
The temperature dependences of DS (Fig. 10c and d, respectively) and DV (Fig. 11c and d, respectively) for CMF and CMTF show significant departures from linear Arrhenius behaviour. For both compositions, the log(DS) vs. 1/T and log(DV) vs. 1/T plots show a reverse S-shape, i.e., the log(DS) and log(DV) values levelling off in the intermediate temperature region, while increasing again at higher temperatures. The different temperature regions can be linked to the orthorhombic → tetragonal → cubic transformations occurring in both materials.
Overall, the results in this study suggest that oxygen transport in the tetragonal I4/mcm phase, which occurs in CM, CMF and CMTF, and possibly also in CMT at higher temperatures than those covered by the present investigations, is reduced, e.g., by (partial) ordering of oxygen vacancies. The latter would be consistent with the results of recent DFT calculations on the parent phase CM by Klarbring and Simak,30 in which the authors show that it is unlikely that the tetragonal phase appears as a result of a purely displacive mechanism, but rather may appear as a result of an ordering of oxygen vacancies. Further structural investigations using high-temperature neutron diffraction would be required to confirm these findings.
4. Conclusions
The present study reveals that CaMnO3−δ (CM) transforms from orthorhombic to a mixture of orthorhombic and tetragonal phases at temperatures exceeding ∼875 °C. The Rietveld refinements yield formation of a pure tetragonal phase at 975 °C and of a pure cubic phase at 1000 °C. It is further found that in the temperature range 600–1000 °C CaMn0.85Fe0.15O3−δ (CMF) and CaMn0.725Ti0.125Fe0.15O3−δ (CMTF) undergo a sequence of phase transitions from orthorhombic to tetragonal to cubic. CaMn0.875Ti0.125O3−δ (CMT) is found to remain orthorhombic up to the highest temperatures covered by the HT-XRD experiments. The small polaron hopping conductivity of CM is reduced by partial manganese substitution with iron and/or titanium. Distinct departures of the temperature dependences of the oxygen self-diffusion and oxygen vacancy diffusion coefficients for CM, CMF and CMFT from Arrhenius-type of behaviour are interpreted to reflect reduced oxygen transport in the tetragonal phases occurring in these materials. The latter is consistent with recent results of DFT calculations on the parent phase CM showing that the tetragonal phase may appear as a result of an ordering of oxygen vacancies.
Conflicts of interest
There are no conflicts to declare.
Acknowledgements
Financial support from the EU FP7 research project GREEN-CC (GA 608524) is gratefully acknowledged. The performed work was part of the BIGCLC Phase III project supported by the Research Council of Norway (id 224866 and id 193816). J. S. acknowledges financial support by the Chinese Scholarship Council (CSC 201406340102). The authors would like to thank Youngsung Lee and Hiroshige Matsumoto of the Kyushu University (Japan) for assistance with the HT-XRD measurements.
References
- P. Wang, N. Means, D. Shekhawat, D. Berry and M. Massoudi, Energies, 2015, 8, 10605–10635 CrossRef CAS.
- A. Thursfield, A. Murugan, R. Franca and I. S. Metcalfe, Energy Environ. Sci., 2012, 5, 7421–7459 RSC.
- J. Hu, V. V. Galvita, H. Poelman and G. B. Marin, Materials, 2018, 11, 1187 CrossRef PubMed.
- L. Zeng, Z. Cheng, J. A. Fan, L.-S. Fan and J. Gong, Nat. Rev. Chem., 2018, 2, 349–364 CrossRef CAS.
- H. Yang, Z. Xu, M. Fan, R. Gupta, R. B. Slimane, A. E. Bland and I. Wright, J. Environ. Sci., 2008, 20, 14–27 CrossRef CAS.
- M. E. Boot-Handford, J. C. Abanades, E. J. Anthony, M. J. Blunt, S. Brandani, N. Mac Dowell, J. R. Fernandez, M. C. Ferrari, R. Gross, J. P. Hallett, R. S. Haszeldine, P. Heptonstall, A. Lyngfelt, Z. Makuch, E. Mangano, R. T. J. Porter, M. Pourkashanian, G. T. Rochelle, N. Shah, J. G. Yao and P. S. Fennell, Energy Environ. Sci., 2014, 7, 130–189 RSC.
- J. Sunarso, S. Baumann, J. M. Serra, W. A. Meulenberg, S. Liu, Y. S. Lin and J. C. D. da Costa, J. Membr. Sci., 2008, 320, 13–41 CrossRef CAS.
-
H. J. M. Bouwmeester and A. J. Burggraaf, in The CRC Handbook of Solid State Electrochemistry, ed. P. J. Gellings and H. J. M. Bouwmeester, CRC Press, Boca Raton, 1996, p. 481, 1997 Search PubMed.
- X. Dong, W. Jin, N. Xu and K. Li, Chem. Commun., 2011, 47, 10886–10902 RSC.
- W. Deibert, M. E. Ivanova, S. Baumann, O. Guillon and W. A. Meulenberg, J. Membr. Sci., 2017, 543, 79–97 CrossRef CAS.
- P. Hallberg, D. Jing, M. Rydén, T. Mattisson and A. Lyngfelt, Energy Fuels, 2013, 27, 1473–1481 CrossRef CAS.
- H. Leion, Y. Larring, E. Bakken, R. Bredesen, T. Mattisson and A. Lyngfelt, Energy Fuels, 2009, 23, 5276–5283 CrossRef CAS.
- S. Sundqvist, H. Leion, M. Rydén, A. Lyngfelt and T. Mattisson, Energy Technol., 2013, 1, 338–344 CrossRef CAS.
- V. Thoréton, M. Pishahang, T. Mokkelbost, K. Wiik and Y. Larring, Energy Technol., 2017, 5, 1579–1587 CrossRef.
- W. Xing, M.-L. Fontaine, Z. Li, J. M. Polfus, Y. Larring, C. Denonville, E. Nonnet, A. Stevenson, P. P. Henriksen and R. Bredesen, J. Membr. Sci., 2018, 548, 372–379 CrossRef CAS.
-
N. M. Mazur, Microstructural design of CaMnO3 and its thermoelectric properties, Master thesis, Norwegian University of Science and Technology (NTNU), Trondheim, Norway, 2015 Search PubMed.
- J. Rodríguez-Carvajal, Phys. B, 1993, 192, 55–69 CrossRef.
- M. W. den Otter, H. J. M. Bouwmeester, B. A. Boukamp and H. Verweij, J. Electrochem. Soc., 2001, 148, J1–J6 CrossRef CAS.
-
G. Watterud, PhD Thesis, Norwegian University of Science
and Technology (NTNU), Norway, 2005.
- E. I. Leonidova, I. A. Leonidov, M. V. Patrakeev and V. L. Kozhevnikov, J. Solid State Electrochem., 2011, 15, 1071–1075 CrossRef CAS.
- L. Rørmark, K. Wiik, S. Stolen and T. Grande, J. Mater. Chem., 2002, 12, 1058–1067 RSC.
- H. Taguchi, M. Nagao, T. Sato and M. Shimada, J. Solid State Chem., 1989, 78, 312–315 CrossRef CAS.
- P. Thiel, S. Populoh, S. Yoon and A. Weidenkaff, J. Solid State Chem., 2015, 229, 62–67 CrossRef CAS.
- A. I. Becerro, S. A. T. Redfern, M. A. Carpenter, K. S. Knight and F. Seifert, J. Solid State Chem., 2002, 167, 459–471 CrossRef CAS.
- S. A. T. Redfern, J. Phys.: Condens. Matter, 1996, 8, 8267–8275 CrossRef CAS.
- C. J. Howard and H. T. Stokes, Acta Crystallogr., Sect. B: Struct. Crystallogr. Cryst. Chem., 1998, 54, 782–789 CrossRef.
- C. J. Howard and H. T. Stokes, Acta Crystallogr., Sect. A: Found. Crystallogr., 2005, 61, 93–111 CrossRef PubMed.
- A. M. Glazer, Acta Crystallogr., Sect. B: Struct. Crystallogr. Cryst. Chem., 1972, 28, 3384–3392 CrossRef CAS.
- A. M. Glazer, Acta Crystallogr., Sect. A: Found. Crystallogr., 1975, 31, 756–762 CrossRef.
- J. Klarbring and S. I. Simak, Phys. Rev. B, 2018, 97, 024108 CrossRef CAS.
- M. Schrade, R. Kabir, S. Li, T. Norby and T. G. Finstad, J. Appl. Phys., 2014, 115, 103705 CrossRef.
- E. I. Goldyreva, I. A. Leonidov, M. V. Patrakeev and V. L. Kozhevnikov, J. Solid State Electrochem., 2012, 16, 1187–1191 CrossRef CAS.
- L. Bocher, M. H. Aguirre, R. Robert, D. Logvinovich, S. Bakardjieva, J. Hejtmanek and A. Weidenkaff, Acta Mater., 2009, 57, 5667–5680 CrossRef CAS.
- J. A. Kilner, R. A. De Souza and I. C. Fullarton, Solid State Ionics, 1996, 86–88, 703–709 CrossRef CAS.
- R. A. De Souza and J. A. Kilner, Solid State Ionics, 1999, 126, 153–161 CrossRef CAS.
- L. M. van der Haar, M. W. den Otter, M. Morskate, H. J. M. Bouwmeester and H. Verweij, J. Electrochem. Soc., 2002, 149, J41–J46 CrossRef CAS.
- S. Saher, M. Meffert, H. Störmer, D. Gerthsen and H. J. M. Bouwmeester, J. Mater. Chem. A, 2017, 5, 4982–4990 RSC.
Footnote |
| † Electronic supplementary information (ESI) available. See DOI: 10.1039/c9cp04911h |
|
| This journal is © the Owner Societies 2019 |
Click here to see how this site uses Cookies. View our privacy policy here. 
 Open Access Article
 This Open Access Article is licensed under a Creative Commons Attribution-Non Commercial 3.0 Unported Licence
 a,
Vincent
Thoréton
*b,
Sathya Prakash
Singh
b,
Kjell
Wiik
b,
Yngve
Larring
c and
Henny J. M.
Bouwmeester
a,
Vincent
Thoréton
*b,
Sathya Prakash
Singh
b,
Kjell
Wiik
b,
Yngve
Larring
c and
Henny J. M.
Bouwmeester


 ,
,  and ac = cortho/2 for the orthorhombic (Pnma) structure, and
  and cc = ctetra/2 for the tetragonal (I4/mcm) structure. For the cubic (Pm


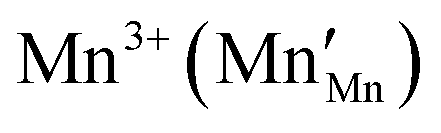 and electron holes Mn5+ (
 ) that are trapped by local lattice distortions due to electron–phonon coupling: these are the n- and p-type small polarons, respectively. Throughout this paper standard Kröger–Vink notation is used to describe defect chemical reactions. The negative sign of the Seebeck coefficient confirms that the n-type polarons are the dominant charge carriers in CM.20,31 The p-type polaronic charge carriers in CM appear to be effectively immobile.20 The electrical conductivity in CM is thus expected to obey:
  , the latter denoting the product of the number of charge carriers and the number of sites to which they can hop. Since variations in
  are very small,32 the conductivity is thus essentially governed by the concentration of Mn3+ cations
  . In addition to reaction (8), their concentration is affected by the exchange of oxygen between the gas phase and the oxide,
 will lower the electrical conductivity, which is accord with the observation that the electrical conductivity decreases on going from CM to CMF (Fig. 6). Such an explanation is also consistent with the increase in electrical conductivity observed upon donor doping of CM with Nb5+.33 It is further seen from Fig. 6 that the electrical conductivity of CM drops almost half an order of magnitude after the isovalent substitution of Mn4+ with Ti4+ ions, suggesting that it is the mobility of the n-type small polarons that is highly affected by the titanium substitution. A detailed study, however, is required to substantiate this conclusion and to provide further insights into the mechanism of electrical conduction in these solids. Additional investigations are also required to clarify the origin of the change in activation energy of the electrical conductivity found for CMT at about 875 °C (Fig. 6).