
 Open Access Article
 This Open Access Article is licensed under a Creative Commons Attribution-Non Commercial 3.0 Unported Licence
Relationship between Li+ diffusion and ion conduction for single-crystal and powder garnet-type electrolytes studied by 7Li PGSE NMR spectroscopy†
Kikuko
Hayamizu
 *a,
Yasuhiko
Terada
a,
Kunimitsu
Kataoka
b,
Junji
Akimoto
b and
Tomoyuki
Haishi
c
*a,
Yasuhiko
Terada
a,
Kunimitsu
Kataoka
b,
Junji
Akimoto
b and
Tomoyuki
Haishi
c
aInstitute of Applied Physics, Tsukuba University, Tennodai, Tsukuba 305-8573, Japan. E-mail: hayamizu.k3@gmail.com
bNational Institute of Advanced Industrial Science and Technology, AIST Tsukuba Centre 5, Tsukuba 305-8565, Japan
cMRTechnology Inc., Tengen, Tsukuba 300-0047, Japan
First published on 2nd October 2019
Abstract
Ion-conducting garnets are important candidates for use in all-solid Li batteries and numerous materials have been synthesized with high ionic conductivities. For understanding ion conduction mechanisms, knowledge on Li+ diffusion behaviour is essential. The proposed nano-scale lithium pathways are composed of tortuous and narrow Li+ channels. The pulsed gradient spin-echo (PGSE) NMR method provides time-dependent 7Li diffusion on the micrometre space. For powder samples, collision-diffraction echo-attenuation plots were observed in a short observation time, which had not been fully explained. The diffraction patterns were reduced or disappeared for single-crystal garnet samples of Li6.5La3Zr1.5Ta0.5O12 (LLZO-Ta) and Li6.5La3Zr1.5Nb0.5O12 (LLZO-Nb). The inner morphology and grain boundaries affect importantly the collision-diffraction behaviours which is inherent to powder samples. The 7Li diffusion observed by PGSE-NMR depends on the observation time (Δ) and the pulsed field gradient (PFG) strength (g) in both powder and single-crystal samples, and the anomalous effects were reduced in the single-crystal samples. The scattered Li diffusion constants converged to a unique value (DLi) with a long Δ and a large g, which is eventually the smallest value. The DLi activation energy was close to that of the ionic conductivity (σ). The DLi values are plotted versus the σ values measured for four powder and two single-crystal garnet samples. Assuming the Nernst–Einstein (NE) relation which was derived for isolated ions in solution, the carrier numbers (NNE) were estimated from the experimental values of DLi and σ. The NNE values of metal-containing garnets were large (<1023 cm−3) and insensitive to temperature. They were larger than Li atomic numbers in cm3 calculated from the density, molecular formula and Avogadro number for LLZOs except for cubic LLZO (Li7La3Zr2O12, NNE ∼ 1020 cm−3).
Introduction
From the first discovery of Li ion conduction in a garnet by Murugan et al. in 2007,1 numerous studies of lithium garnets have focused on the intention to use solid-state lithium batteries as summarized by review articles.2–4 In 2009, we were engaged in the synthesis and structural analysis of tetragonal Li7La3Zr2O12 (LLZO) with a single-crystal sample.5 The crystal structure of cubic LLZO was determined for which the Li ion migration pathway was proposed in 2011.6 The molecular dynamics simulation of LLZO by Klenk and Lai suggested that finite size effects exist for ion dynamics.7 In 2018, we reported the growth of centimetre-sized single crystals of Ta-containing Li6.5La3Zr1.5Ta0.5O12 (LLZO-Ta).8 The highest ionic conductivity of the powder LLZO-Ta was reported for the Li6.6La3Zr1.6Ta0.4O12 sample.9 Among the single-crystal samples of Nb-containing Li7−xLa3Zr2−xNbxO12 (x = 0.2–0.8), the highest ionic conductivity was obtained for the x = 0.5 composition sample (LLZO-Nb). The crystal structure of the single-crystal Li6.5La3Zr1.5Nb0.5O12 suggested the existence of continuous Li pathways.10 The ionic conductivities of the powder samples of the LLZO-Nb were reported to have the highest value for the x = 0.25 sample.11 The stability of LLZO-Nb to Li metal was examined.12 The Li ion dynamics in powder LLZO-Nb samples were studied by positive muon-spin relaxation (μ+SR) and quasi elastic neuron scattering (QENS) and the activation energies obtained by the μ+SR and QENS methods were smaller than those of the ionic conductivity.13,14From the early stage of investigations on solid conductors, 6,7Li NMR spectroscopy has been recognized to be important in the study of Li ion dynamics, and review articles have described temperature-dependent spectral patterns and relaxation times precisely and widely.15–17 For single-crystal garnet samples, 7Li relaxation times have been reported.18,19 The 6,7Li relaxation phenomena are related to atomic-level Li migrations.
By contrast, pulsed-gradient spin-echo (PGSE) 7Li NMR spectroscopy measures longer time and wider distance migration on the micrometre space. Actually, 7Li diffusion constants have been measured for solution electrolytes used in Li ion batteries (LIBs), ionic liquids, viscous liquid electrolytes, and inorganic solid electrolytes.20 Because Li diffusion is important for understanding ion conduction, the PGSE-NMR method has been recognized as one of the important techniques to study Li dynamics. Li diffusion coefficients can be assumed to be physical constants in homogenous solution electrolytes. However, Li diffusion in solid electrolytes was found to be anomalous that the diffusion phenomena depend on the measurement parameters, such as observation time (Δ) and the strength (g) of the pulsed field gradient (PFG). In addition, collision-diffractive patterns were observed for short Δ in powder electrolytes21–25 including garnet-type electrolytes. For garnet- and NASICON-type powder electrolytes, we have described Δ- and g-dependent Li diffusion, and also Li diffusion and carrier number were plotted versus ion conduction, but unexplainable questions remained.24 To understand the anomalous Li diffusion, it was extremely useful to observe single-crystal garnet LLZO-Ta.26 In this study, we observed 7Li diffusion behaviours of single-crystal LLZO-Nb and related samples to confirm the experimental findings for single-crystal LLZO-Ta. Deeper understanding will be gained on the anomalous Li diffusion in garnet-type electrolytes. Because of short 7Li T2 (generally less than 5 ms in powder samples and longer in single-crystal samples at room temperature) and slow Li diffusion, setting of the measurement conditions is severe and sophisticated hardware is required for PFG equipment.
Using the crushed sample of single-crystal LLZO-Nb, collision-diffraction patterns were observed with very short Δ (at 2 ms shortest). The powder samples having grain boundaries are related to the collision-diffraction patterns in the echo-attenuation plots, because the collision-diffraction phenomena were reduced or disappeared in single-crystal samples. Using our data on Li diffusion constant (DLi) obtained with long Δ and large g for four powder and two single crystal samples, the relationship between the DLi and the ionic conductivity σ is discussed for garnet-type electrolytes. The Li+ carrier numbers (NNE) of the Nernst–Einstein (NE) equation calculated from the experimental values of σ and DLiversus temperature are shown for the single-crystal and powder garnet-type electrolytes.
Experimental
Sample preparation
Single-crystal cubic LLZO-Nb (Li6.5La3Zr1.5Nb0.5O12) was grown by the floating zone method.10 The single-crystal sample was placed in an NMR sample tube (ϕ 5 mm) with a height of about 6 mm. After Li diffusion measurements, the sample was cut into two 3 mm-high pieces. A crushed sample (fine powder) was prepared manually in a dry room from the single-crystal sample. A powder sample, cubic Li6.75La3Zr1.76Nb0.25O12, was prepared by Toshima Manufacturing Co., Ltd. The crushed and the powder samples were inserted into an NMR sample tube with a height of 6 mm.PGSE-NMR pulse sequence
7Li diffusion was measured with the stimulated-echo pulse sequence for the short 7Li T2 samples as shown in Fig. 1.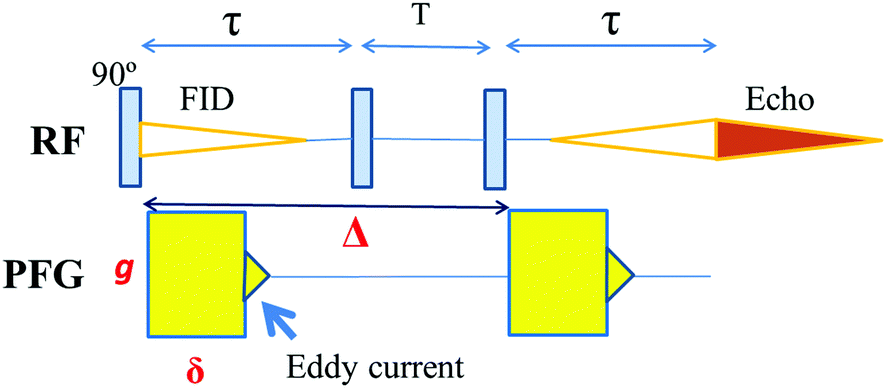 | ||
| Fig. 1 Stimulated pulse sequence in which two equivalent PFGs of the strength g and duration time δ are included with observation time interval Δ. The eddy current effect due to the PFG is inevitable and active shield coils must be equipped to minimize it. The time interval τ corresponds to the T2 process and is related strictly to the sensitivity of echo signals. The time T is related to the T1 process and the sensitivity of the echo signal decreases as T becomes longer. | ||
The echo attenuation, E, is observed with the parameters g, δ, and Δ, and the diffusion constant D is described by the Stejskal and Tanner equation (eqn (1)) for a homogeneous system.
 | (1) |
7Li NMR measurements
7Li NMR spectra and 7Li diffusion measurements were recorded using a tuneable PFG probe and an amplifier (50 A) purchased from JEOL, Tokyo, Japan. The probe was inserted into a wide-bore 4.7 Tesla superconducting magnet and the 7Li resonance was 78.5 MHz. The 90° pulse width was about 10 μs. The temperature was determined using ethylene glycol. The PFG has a rectangular shape and the results obtained using a fixed g with varying δ agreed well with those observed for a fixed δ with varying g in solution electrolytes. The two PFGs applied with a short interval (10 ms or shorter) and large g (10 T m−1 or larger) were equivalent. The eddy current effects disappeared after 0.35 ms induced by the application of the PFG with a strength g = 14 T m−1. The PGSE-NMR measurements were performed generally with a fixed g and varying δ from 0.1 to 4.0 ms (in a special case, to 8.0 ms), between g = 5.6 and 14.3 T m−1 and Δ = 10 and 100 ms. Two types of additional measurements were performed for the crushed sample at 65 °C, in the first case, with a fixed Δ = 5 ms for g = 2.7 to 10.0 T m−1 (6 points) and secondly, with a fixed g = 10.0 T m−1 for Δ = 2 to 30 ms (9 points). The spectra were measured using a Tecmag Apollo and NTNMR system (Houston, TX, USA). Origin 9.1 software was used to plot the measured data.Results
7Li spectral patterns
The 7Li spectra of the single-crystal, crushed and powder samples of LLZO-Nb at 38 °C are shown in Fig. S1 (ESI†). The 7Li spectrum of the single-crystal LLZO-Nb was composed of narrow (LW = 0.066 kHz) and broad components (LW = 0.58 kHz). For the powder and crushed samples, the two components were observed. The line widths of the narrow components were 0.25 and 0.36 kHz accompanied by broad components of line widths with 3 and 8 kHz for the crushed and powder samples, respectively.7Li T1 and T2
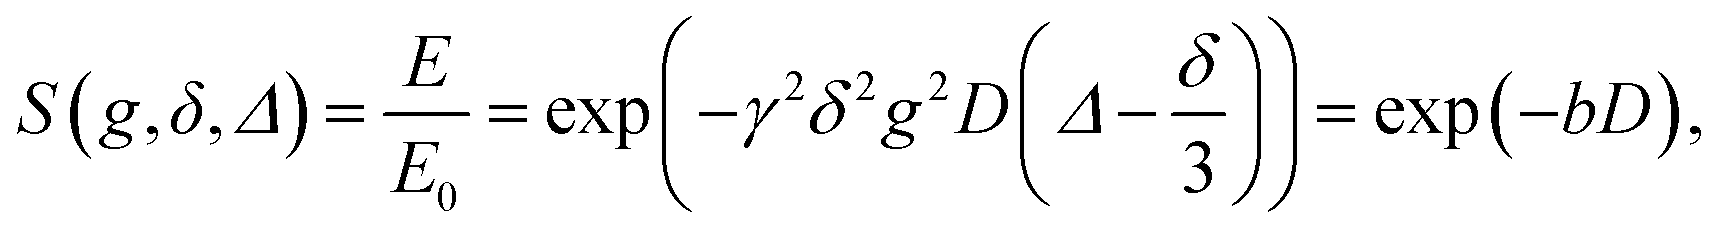
To determine the measurement parameters, 7Li T1 and T2 are important and the temperature dependences are shown in Fig. 2(a) for T1 and Fig. 2(b) for T2 of the three LLZO-Nb samples. In the present temperature region, the T1 values decreased as the temperature increased and the powder sample showed the longest T1, next was the crushed sample, and the T1 of the single-crystal sample was shortest at the same temperature. By contrast, the single-crystal sample showed the longest T2, next was the crushed sample, and the powder sample had the shortest T2 (0.8 ms at 30 °C). The longer T2 has an advantage of giving better sensitivity in echo signals for diffusion measurements. In the higher temperature region, a small component with a shorter T2 was observed additionally for the single-crystal and crushed samples, although the spectral patterns appeared as a single component. The fast T2 components did not contribute to the echo signals.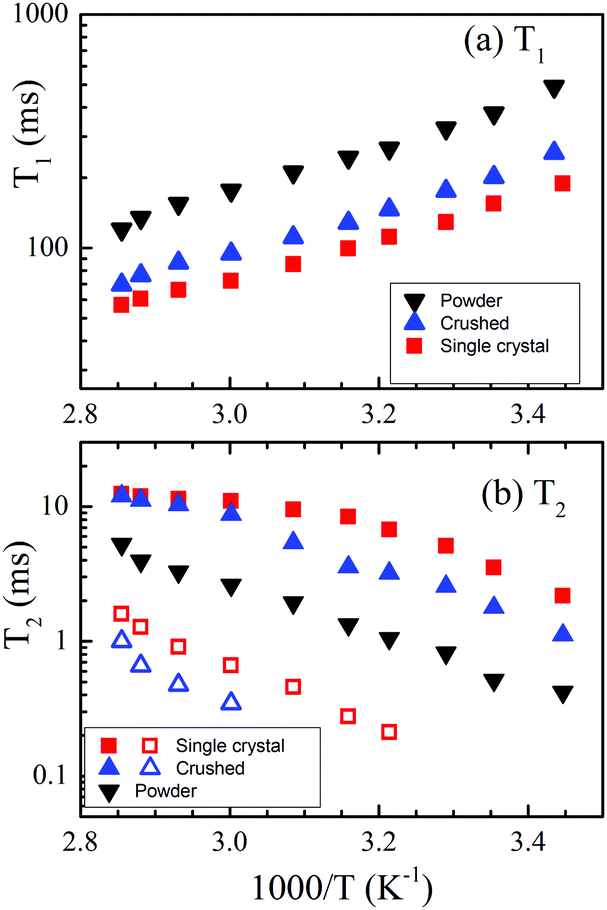 | ||
| Fig. 2 Arrhenius plots of (a) T1 and (b) T2 for the single-crystal (squares), crushed (up-triangles) and powder (down-triangles) samples. | ||
Li diffusion in short Δ
The single-crystal sample of LLZO-Nb (height 6 mm) was used for the whole measurements because of the sensitivity of the echo attenuation plots for long Δ (50 to 100 ms), and in the final stage the sample was cut into two pieces to observe the echo-attenuation plots for shorter Δ. The collision-diffraction echo-attenuation plots are shown in Fig. 3 for (a) a 6 mm-high single-crystal sample and (b) two cut samples two months after the cutting. The measurement conditions were used following a previous study on the single-crystal LLZO-Ta (Li6.5La3Zr1.5Ta0.5O12),26 with Δ = 10 ms and g = 10.0 T m−1 by varying δ = 0.1 to 8.0 ms. The echo-attenuation plot of the 6 mm-high single-crystal LLZO-Nb sample gave a distorted diffractive pattern, whereas short samples I and II showed smooth patterns without clear diffraction. The collision-diffraction patterns of the 3 mm-high samples observed soon after the cutting are shown in Fig. S2 (ESI†), in which multiple diffractions were observed for sample II. Clearly, structure relaxation took place in single-crystal sample II. We did not expect such structural relaxation in the single-crystal sample observed in short Δ, which confirmed the consistency of the diffusion data at long Δs after two months. | ||
| Fig. 3 Collision-diffraction patterns of the echo attenuation plots in the q-space for the LLZO-Nb single crystal samples at 38 °C with different sample sizes, (a) 6 mm-high sample and (b) 3 mm-high samples I and II, two months after the cutting. The measurement conditions were g = 10 T m−1, Δ = 10 ms, δ = 0.1 to 8.0 ms (60 points). | ||
Although the collision-diffraction pattern was observed for the 6 mm-high sample, the cut samples did not show a clear diffraction pattern. This suggests that the 6 mm-high sample included the origin of the diffraction, such as cracks or single-crystal imperfections, in its inner morphology. The echo-attenuation plots of sample I (3 mm-high sample) were almost unchanged soon after cutting and two months later, whereas sample II showed a smooth curve in Fig. 3(b) two months later, recovered from multiple diffractions (Fig. S2 (ESI†)). Structural relaxation took place and removed cracks inside the single-crystal sample. The collision-diffraction patterns can be used to estimate the inner morphologies in the micrometre level.
The diffractive echo-attenuation plots for the crushed and powder samples were compared at 65 °C, because of the short T2 of the powder sample at room temperature. The plots at 10.0 T m−1 and Δ = 10 ms for the single-crystal (sample I), crushed and powder samples are shown in Fig. 4, measured by varying δ from 0.1 to 8.0 ms (60 points). The single-crystal sample showed a smooth curve, while multiple diffraction patterns were observed for the crushed and powder samples. For reference, the echo attenuation spectral patterns are shown for the single-crystal (sample I) and crushed samples of LLZO-Nb in Fig. S3 and S4 (ESI†), respectively. Owing to long 7Li T2,long trajectories could be observed with a long δ of 8 ms for the samples of LLZO-Nb as well as LLZO-Ta23 and diffraction patterns were not observed for the single-crystal samples. The diffractions of the crushed and powder samples must have originated from the inner morphologies of cracks or grain boundaries. The collision-diffraction phenomena are assumed to take place mainly by spontaneous Li migration with small thermal activation. For reference, the diffractive echo-attenuation plots of the crushed sample are shown in Fig. S5 (ESI†) measured at 30 and 65 °C.
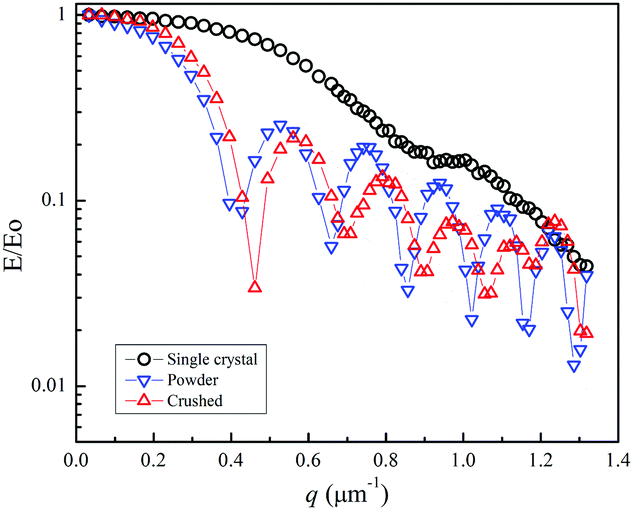 | ||
| Fig. 4 Echo-attenuation plots for the LLZO-Nb samples at 65 °C with Δ = 10 ms and g = 10.0 T m−1 for the 3 mm-high single-crystal (circles), crushed (up-triangles), and powder samples (down-triangles). | ||
Experimentally, we tried to pursue the characteristics of the collision-diffractions phenomena using the crushed sample of LLZO-Nb. In the q-space plots, the inverse of the q-value at a diffraction point is defined as Rdiffraction [m]. The main interest is what is the longest Rdiffraction value. Previously, we indicated that at a fixed g-value, the Rdiffraction values became smaller for a longer Δ.21–25 Then, we tried to observe the echo-attenuation plots for shorter Δ values of 5, 4, 3, and 2 ms at a fixed g = 10.0 T m−1 with δ varying up to 4, 3, 2 and 1 ms, respectively (Fig. 5(a)). The measurements were performed by using the Hahn echo pulse sequence (90°–τ–180°–τ-echo). A comparison was carried out to observe the echo attenuation plots with the STE and Hahn echo pulse sequences (Fig. S6 (ESI†)).
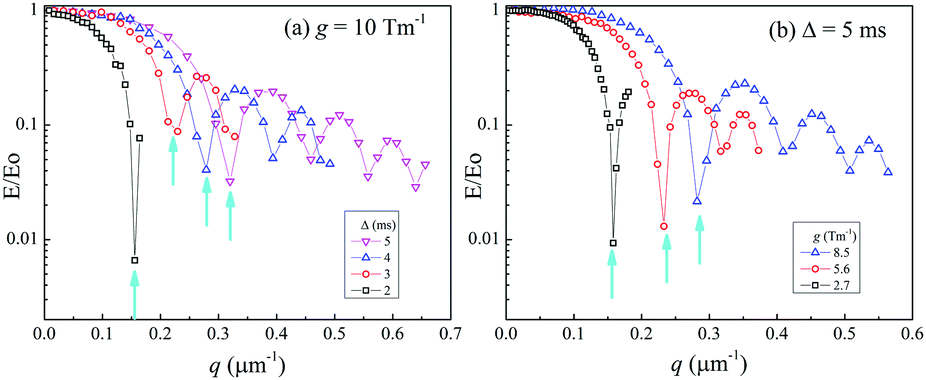 | ||
| Fig. 5 Echo-attenuation plots with diffractions of the crushed LLZO-Nb at 65 °C for (a) fixed g = 10 T m−1 with Δ = 2 to 5 ms and (b) a fixed Δ = 5 ms with various g values of 2.7, 5.6 and 8.5 T m−1. | ||
These measurements were our first trials to challenge the observation of short Δ with large g values such as 10 T m−1, because short Δ experiments were not necessary to obtain diffusion constants in homogeneous liquid systems. All the plots looked reasonable in our machine, and were hardly affected by hardware artifacts of non-equivalent PFGs for short Δ and large g. We previously noticed that the echo-attenuation plots were dependent on g, and in this study, g was set at values from 10.0 to 2.7 T m−1 with Δ = 5 ms, as partly shown in Fig. 5(b). The q value of the diffraction point became smaller when g became smaller; the Rdiffraction values increased for smaller g.
The Rdiffraction values of the crushed LLZO-Nb were obtained in each plot at 65 °C and are summarized in Fig. 6(a) with a fixed g of 10.0 T m−1 for various Δ values from 2 to 30 ms and Fig. 6(b) with a fixed Δ = 5 ms with various g = 2.7 to 10.0 T m−1. When multiple diffractions were observed, each Rdiffraction value was included. The largest Rdiffraction values were 6.2 and 6.3 μm for g = 10.0 T m−1 with Δ = 2 ms and g = 2.7 T m−1 with Δ = 5 ms, respectively. Approximate apparent Li diffusion constants obtained from the initial linear plots were 8 and 2 × 10⁻¹⁰ m2 s−1 for Δ = 2 ms/g = 10 T m−1 and Δ = 5 ms/g = 2.7 T m−1 measurements, respectively.
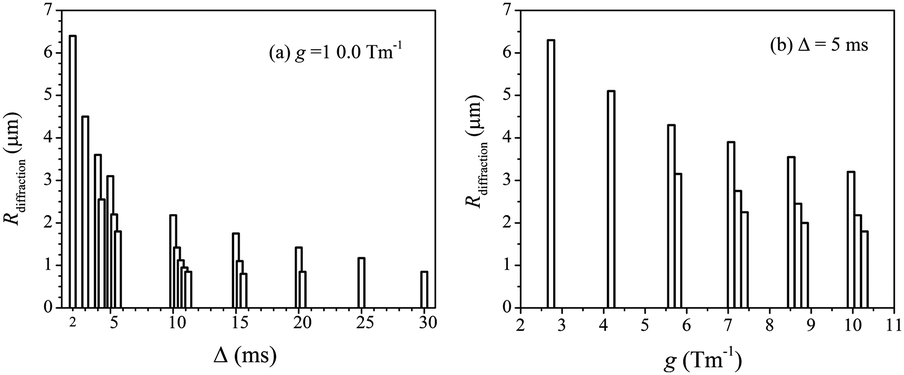 | ||
| Fig. 6 (a) Rdiffractionvs. Δ from 2 to 30 ms with a fixed g = 10.0 T m−1 and (b) the Rdiffractionversus g from 2.7 to 10 T m−1 with a fixed Δ = 5 ms. When multiple diffractions were observed, each value was included. | ||
In a short time interval, some Li ions in powder samples diffuse quickly for a long distance until collision-diffraction. Faster diffusing Li ions might exist, which the PGSE-NMR method cannot observe.
Δ-Dependent diffusion
Li-Diffusion in LLZO-Nb depends on the observation time Δ as for the single-crystal, crushed and powder samples at 65 °C with g = 10.0 T m−1 (Fig. 7). Clearly, the variation was smallest for the 6 mm-high single-crystal sample. The crushed sample showed a larger variation, and the Δ-dependence of the powder sample was the largest. For short Δ values, diffraction patterns were observed, including the 6 mm-high single-crystal sample.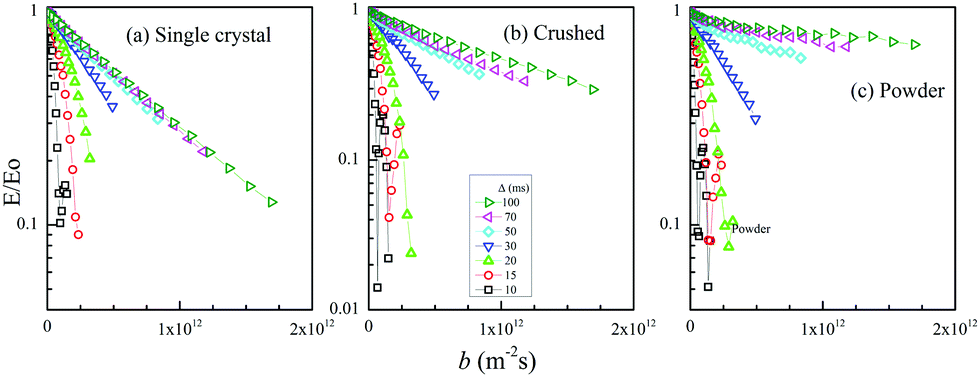 | ||
| Fig. 7 Echo attenuation plots at 65 °C for (a) single-crystal (6 mm), (b) crushed and (c) powder samples. The measurement conditions were g = 10.0 T m−1 (fixed) and δ varying from 0.2 to 4.0 ms (20 points) for different Δ values from 10 to 100 ms (7 points). | ||
The apparent diffusion constant (Dapparent) for various measurement parameters was obtained from an initial linear decay for each echo attenuation plot in Fig. 7. The Dapparent values were plotted versus Δ for the three LLZO-Nb samples at 65 °C (Fig. 8). The Δ-dependece decreased in the order single-crystal < crushed < powder samples, suggesting that the inner molophorogy affects the Δ-dependence, and the single-crystal sample showed the smallest Δ-dependence.
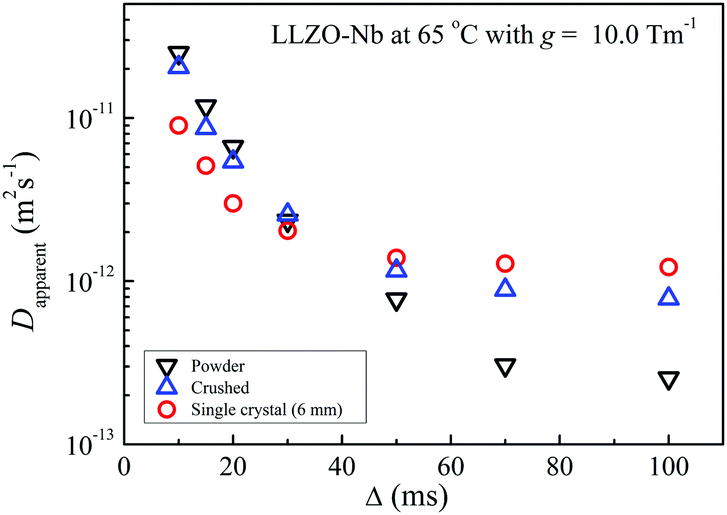 | ||
| Fig. 8 D apparent versus Δ at 65 °C for the single-crystal (circles), crushed (up-triangles), and powder (down-triangles) samples of LLZO-Nb. At Δ = 10 ms, the D values were largest for the powder, followed by crushed sample, and the slowest for the single-crystal sample. In contrast, at Δ = 100 ms, the single crystal sample gave the fastest D value, followed by the crushed sample, and the powder sample gave the slowest value. | ||
As descrived above, the 6 mm-high single-crystal sample was cut into two 3 mm-high samples: I (better morphology) and II. The Δ-dependence for the three single-crystal samples is shown in Fig. S7 (ESI†). At short Δ, the Dapparent value was sensitive to the inner morphologies of the three single-crystal samples and the better quality sample showed a smaller Δ-dependence. The DLi values obtained at long Δ (longer than 100 ms) were mutually consistent in the three samples.
g-Dependent diffusion
The phenomena of g-dependent Li diffusion in solid inorganic electrolytes were recognized experimentally. In the early stage, we felt that the experimental results were not as expected. We did not observe g-dependent diffusion in solution electrolytes. Because of our diffusion measuring mode in which the echo attenuations are plotted with a fixed g and varying δ, we are convinced that the g-dependent phenomena are real facts. Previously, the echo attenuation plots for solid inorganic electrolytes were shown to be different in the two modes of a fixed δ with varying g and a fixed g with varying δ.21,26 In this study, the three samples with different morphologies were compared at 65 °C, and the g was varied from 5.6 to 14.3 T m−1 with Δ = 30 ms (Fig. 9). The single-crystal sample showed a small g-dependence and actually the Dapparent values were almost unchanged between g = 5.6 and 11.4 T m−1.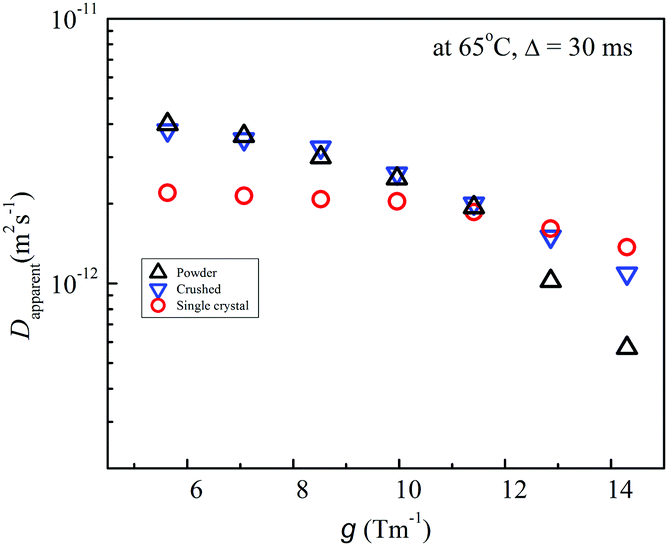 | ||
| Fig. 9 The Dapparent values versus g at 65 °C with Δ = 30 ms for the powder (up-triangles), crushed (down-triangles) and single-crystal (circles) LLZO-Nb samples. The Dapparent values of the single crystal were insensitive to g-values and changed from 2.2 to 1.4 × 10⁻¹² m2 s−1. The Dapparent values of powder and crushed samples changed from 4 × 10⁻¹² to 5.7 × 10⁻¹³ m2 s−1 and from 3.8 to 1.1 × 10⁻¹² m2 s−1 for g = 5.6 to 14.3 T m−1, respectively. | ||
To confirm the g-dependence at various Δ values for the 3 mm-high single-crystal sample, we observed g-dependent diffusion between 4.2 and 14.3 T m−1 with Δ = 20, 30, and 50 ms at 38 °C (Fig. S8 (ESI†)). Clearly, the dependence on g was larger in shorter Δ and also with smaller g. For longer Δ and larger g, the Dapparent values converged to a single value of DLi, which was the smallest value among various values with different g and Δ values. These trends were consistent with the experimental facts observed previously for powder samples of garnets,21,22 LAGP,23,24 and LLTOs.25 The degree of scattering was much smaller in the single-crystal samples. The g-dependence is induced by non-uniform, dispersive Li diffusion. It was clearly shown that in single-crystal samples, dispersive Li diffusion exists, but is significantly smaller than in the powder and crushed samples.
Temperature dependence
The Li diffusion in the LLZO-Nb samples is dependent on the measurement parameters of g and Δ; that is, distributed Dapparent values are observed. By contrast, ionic conductivity can be determined as a single value in the garnet-type electrolytes by impedance spectroscopy. It is established that ion conduction is induced by Li+ diffusion. Determination of a unique value for Li diffusion at a temperature is desirable. Our previous studies indicate that the parameter-independent lithium diffusion constant (DLi) is a value obtained by using long Δ and large g values. In this study, we set Δ = 100 ms and g = 10.0 T m−1 to obtain DLi values and Arrhenius plots are shown for single-crystal, crushed, and powder samples of the LLZO-Nb (Fig. 10).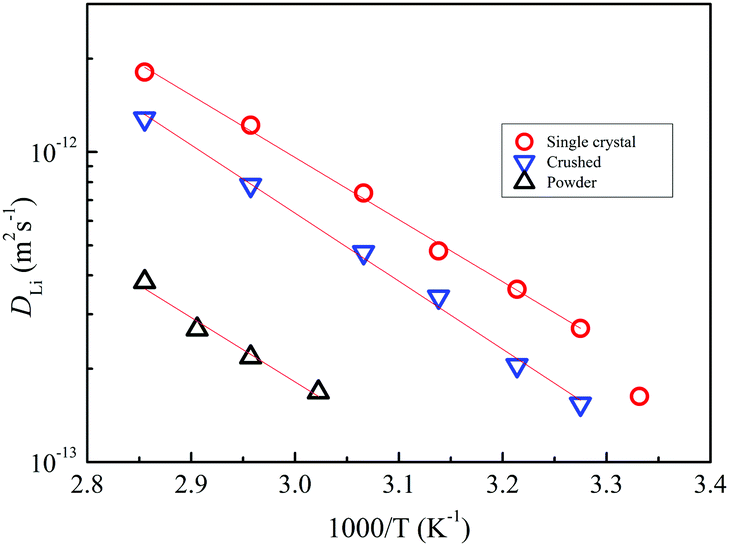 | ||
| Fig. 10 Arrhenius plots of DLi for the single-crystal (circles), crushed (down-triangles) and powder (up-triangles) samples of LLZO-Nb. The activation energies were almost the same (38 kJ mol−1). | ||
Because of the short T2 of the powder sample, the diffusion measurements were possible above 58 °C. At this temperature, the DLi of the single-crystal sample was largest, followed by the crushed sample, and the powder sample gave the slowest DLi values. The activation energies (about 38 kJ mol−1) were close to those of the ionic conductivity (39.8 kJ mol−1 for the single crystal). The apparent activation energy for the Li diffusion obtained at shorter Δ values was always smaller for inorganic solid electrolytes hitherto observed. For reference, Arrhenius-type plots of Dapparent values for the 3 mm-high single crystal sample are shown in Fig. S9 (ESI†) with setting g = 7.1, 10.0, and 12.9 T m−1 at Δ = 30 ms. Different gradients were obtained for different g values.
Discussion
In garnet-type Li electrolytes, the σ has been always a unique value at a certain temperature. The σ is defined as the Li+ velocity multiplied by the Li+ carrier number, in which the charges move continuously from one electrode to another. It is not certain how long and at what speed each Li+ ion moves. By contrast, the 7Li diffusion by the PGSE-NMR method is described as the migration of a species during the time interval Δ. As shown in Fig. 1, the first PFG encodes the target 7Li ions, and after the time Δ the encoded species are detected by the second PFG. If the 7Li ions diffuse uniformly in homogeneous liquids, they are all detected by the second PFG to give a definite diffusion constant without dependence on Δ and g. The Li pathways at the atomic level reported for garnet electrolytes have been indicated to be narrow and tortuous without free Li diffusion space.6,10 Then, dispersive Li diffusion in micrometre space for inorganic solid electrolytes can be assumed. Generally, slower diffusion is measured by larger g in solution. In the solid electrolytes, the Dapparent values became smaller when observed with larger g. The experimental findings indicate the existence of dispersive Li ion migration at various speeds. When Δ becomes shorter, the distribution of the dispersive Li migration becomes larger. Because of averaging processes for longer Δ times, the distribution is reduced and is convergent to a unique value when Δ is long enough.The temperature-dependent Li diffusion observed at shorter Δ with the same g gives smaller activation energy values in powder samples, indicating that the processes are less thermally activated.27 In this study, at Δ = 30 ms the temperature-dependent Li diffusion of the 3 mm-high single crystal LLZO-Nb was observed for three g values as shown in Fig. S9 (ESI†). The gradients of the Arrhenius-type plots were different depending on g values at Δ = 30 ms. In shorter Δ, the dispersive Li diffusion will not give values having physical meanings. The relative Li numbers observed with different g values cannot be determined, and it is difficult to extract exact physical meanings for each gradient. The measurements with longer Δ afford a unique value of DLi and its activation energy estimated was close to that of σ.
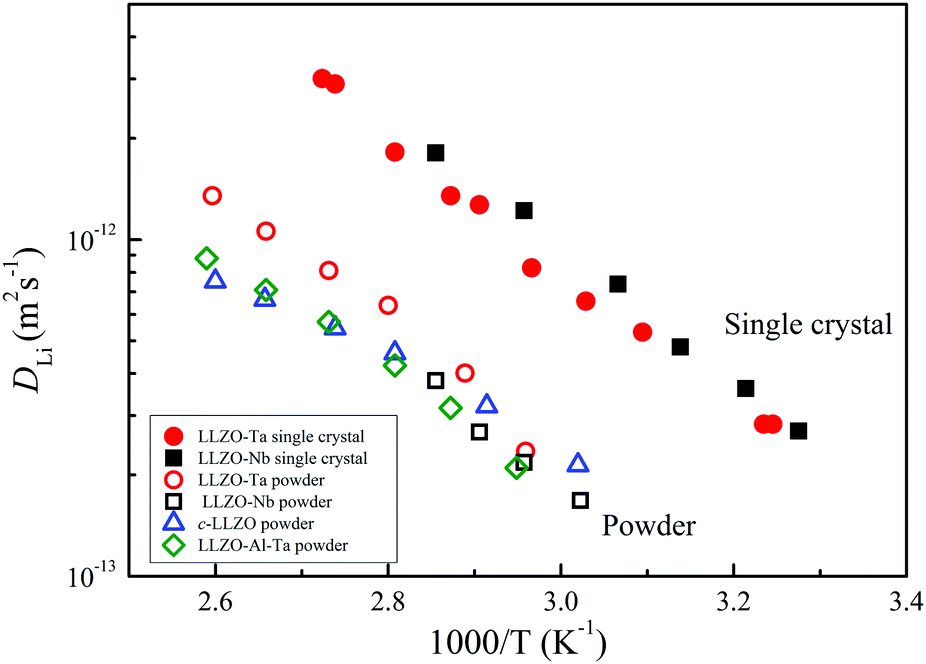
We have reported on the temperature-dependent DLi of powder samples of c-LLZO,22 c-LLZO-Ta,21 and c-LLZO-Al-Ta9 and c-LLZO-Nb (in this study) and Arrhenius-type plots of the DLi values of the garnets are shown in Fig. 11, including the single-crystal LLZO-Ta and LLZO-Nb samples. The DLi values of the powder samples were measured at higher temperatures (above 60 °C) due to the short 7Li T2 at lower temperatures. Clearly, the single-crystals showed higher DLi over the whole temperature range measured. The activation energies of the single-crystal and powder samples of LLZO-Ta and LLZO-Nb were about 38 kJ mol−1. The powder LLZO-Al-Ta and c-LLZO showed slightly smaller activation energies of 33 kJ mol−1.
 | ||
| Fig. 11 Arrhenius plots of the DLi for single-crystal samples of LLZO-Ta (solid circles) and LLZO-Nb (solid squares) and the powder samples of LLZO-Ta (open circles), LLZO-Nb (open squares), LLZO-Al-Ta (open-diamonds) and c-LLZO (open-triangles). | ||
In Fig. 12, the DLi values are plotted versus σ for the garnets of four powder and two single-crystal samples. The relationship of the DLiversus σ is linear, and the gradients are almost similar. The single-crystal samples and the powder LLZO-Ta are shown to be on the same line, and powder samples of LLZO-Nb and LLZO-Al-Ta moved towards higher σ values. Because of the small σ of the powder c-LLZO samples, the plot of c-LLZO was separated from that of the metal-containing LLZOs and the gradient was slightly smaller.
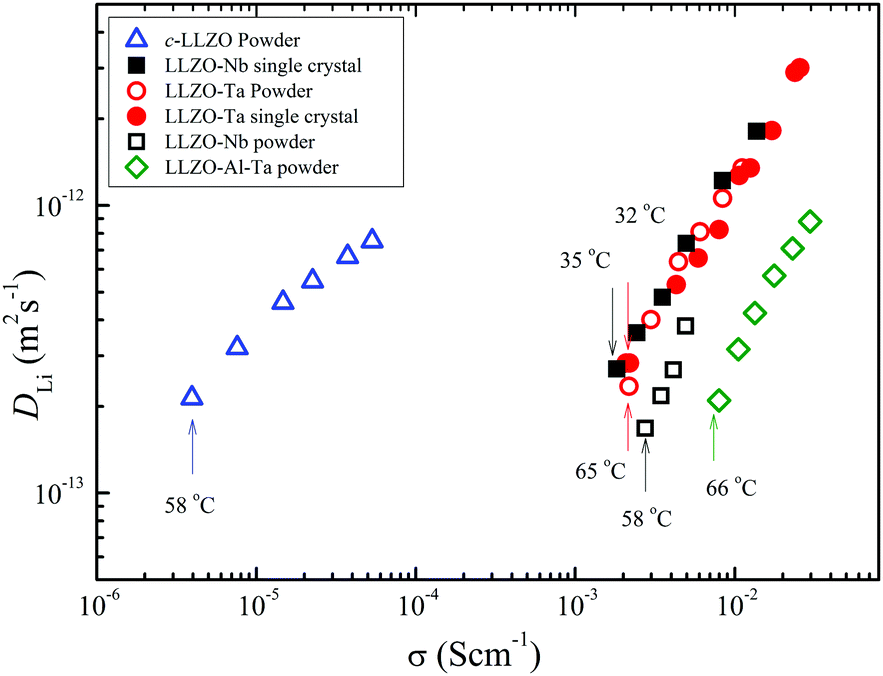 | ||
| Fig. 12 D Li versus σ for the garnet powder (c-LLZO, LLZO-Ta, LLZO-Nb, and LLZO-Al-Ta) and single-crystal (LLZO-Ta and LLZO-Nb) samples. | ||
Classically, the relationship between ion diffusion constants and σ has been described by the Nernst–Einstein (NE) relation based on completely isolated ions in solution. For actual solution electrolytes, the concept of ion association needs to be included. In inorganic solid Li electrolytes of immobile anions, the ionic conduction is driven by the diffusion of Li ions, and the NE equation is given as eqn (2),28
 | (2) |
 | (3) |
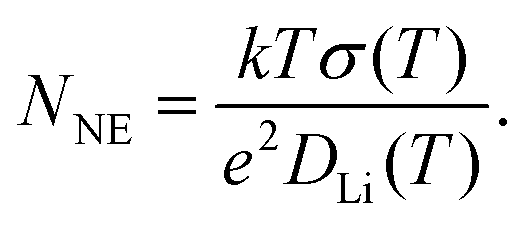
From the experimental DLi and σ values, the Li+ carrier numbers, NNE, were simply calculated using eqn (3) and are plotted in Fig. 13versus temperature.
 | ||
| Fig. 13 N NE versus temperature for the garnets of the single-crystal (solid marks) and powder samples (open marks). | ||
From Fig. 13, the temperature dependence of the NNE values for the metal-containing LLZO is small. The c-LLZO sample showed slight temperature dependence, although the NNE values were more than two orders of magnitude smaller. The NNE values were clearly larger for the garnet sample having large σ values. In eqn (3), the units of σ (S cm−1) and DLi (cm2 s−1) were used, and the calculated NNE is assumed as the mobile Li+ number in cm3. The calculated values of NNE seem very large because of Avogadro number (6.022 × 10²³ mol−1). Then the number of Li atoms in cm3 was calculated by using the experimental density at room temperature and the molecular weight (see Table SI (ESI†)). The estimated Li atomic numbers were 2.3–2.5 × 1022 cm−3 for the garnet samples in the present study. The NNE of c-LLZO at 58 °C was 3.3 × 10²⁰, and about 1.3% Li+ is mobile. In contrast, in the metal-containing LLZO samples, the NNE values in Fig. 13 are larger than 1 × 1023 cm−3 and also larger than the Li atom numbers of ∼2.4 × 1022 cm−3. The 7Li NMR spectra of these garnets included broader components that do not contribute to Li+ diffusion. Based on the NE relation derived for isolated ions in solution systems, the large NNE values are not reasonable.
The ionic conductivity is defined as the velocity of movement from one electrode to another (in unit length) multiplied by the number of charge-carrying ions. Ions start from one electrode and pass the charge successively to other ions, and different ions arrive at another electrode. The distance and speed for each Li ion are not known with certainty. In the PGSE-NMR method, the DLi values in Fig. 11–13 were obtained around Δ = 100 ms. Encoded 7Li ions by the first PFG diffuse during 100 ms and are detected by the second PFG. In terms of root-mean-square distance  , the Li ions diffuse at 65 °C for 1.6 and 0.6 μm in the single-crystal and powder samples of LLZO-Nb, respectively. Because the concept of ionic conduction is quite different from Li diffusion, the simple application of the NE equation in solid inorganic electrolytes is questionable. However, the explanation that larger carrier ion numbers contribute to larger σ might be understandable.
Finally, the diffractive echo-attenuation plots with short Δ are one of the important hints toward understanding Li diffusion. In the good single-crystal samples of LLZO-Ta and LLZO-Nb, diffraction patterns were not observed. This suggests that the anomalous diffraction patterns are not artefacts due to the hardware being incomplete, such as prolonged eddy current effects, non-equivalent PFGs in short Δ, and PFGs in a non-rectangular shape. The cause of the diffraction in powder samples is the collision of Li ions through winding micrometre-sized Li diffusion channels. The Li movement across grains in the powder samples may cause the collision and diffraction. The PGSE-NMR method observes the diffusion trajectory at each Δ like a snapshot. In the crushed sample of the LLZO-Nb, the collision-diffraction echo-attenuation plots were observed in the wide range of Δ and g. As extreme examples, when Δ was very short such as 2 ms, some 7Li ions diffused quickly over long distances for example 6 μm, until the collision-diffraction occurred on the walls of the pathways or grain boundaries. When the Δ became longer such as Δ = 5 ms, some Li+ ions moved quickly to collide at 6 μm detected by the small g, whereas slower-diffusing Li ions collided in shorter distances, as detected by the larger g. The experiment with Δ = 2 ms was the shortest limit in our PGSE-NMR machine.
The g-dependent diffusion suggests the distribution of Li diffusion at a certain Δ. The single-crystal samples also showed g-dependence at a smaller degree than that in the powder samples. Compared with the Li diffusion in powder samples, the Li diffusion in the single-crystal samples is more homogeneous, but not as homogeneous as in liquid electrolytes.
Finally, we plotted the relationship of DLivs. σ and NNEvs. σ for solid electrolytes near room temperature hitherto reported, which are presented in a chapter of Annual Reports on NMR Spectroscopy.20 In this paper, we added the data of the single-crystal LLZO-Ta and the powder and single-crystal LLZO-Nb. The relationship is shown between DLi and σ (Fig. S10 (ESI†)) and NNE and σ (Fig. S11 (ESI†)). In addition, the numerical data of the DLi and σ and NNE are shown in Table SII (ESI†).
Conclusions
The 7Li PGSE NMR method can provide information on Li diffusion in inorganic solid electrolytes and contribute to understand ion conduction mechanisms in micrometre space. Experimental measurements of Li diffusion in powder samples of sulfide-, garnet-, NASICON-, and perovskite-type electrolytes are possible, but the results were very anomalous as Δ- and g-dependent apparent Li diffusion constants were obtained. In addition, in a short observation time (Δ), diffractive echo attenuation plots were observed. Good-quality single-crystal samples of LLZO-Ta and LLZO-Nb proved to reduce anomalous Δ- and g-dependent Li diffusion phenomena observed in the powder samples of garnets and other inorganic solid electrolytes. The inner morphologies deeply affect non-uniform and dispersive Li diffusion in powder samples. Particularly, grain boundaries in powder samples are shown to be origins of collision-diffraction behaviours in short Δ. Using the Nernst–Einstein (NE) relation, the Li+ carrier numbers were estimated from the experimental values of ionic conductivity and DLi obtained at long Δ. The temperature dependence of the NE carrier numbers was small in garnet samples, and they were larger than the atomic Li numbers in cm3 for metal-containing garnet electrolytes except for cubic-LLZO.Conflicts of interest
There are no conflicts to declare.Notes and references
- R. Murugan, V. Thangadurai and W. Weppner, Angew. Chem., Int. Ed., 2007, 46, 7778–7781, DOI:10.1002/anie.200701144.
- V. Thangadurai, S. Narayanan and D. Pinzaru, Chem. Soc. Rev., 2014, 43, 4714–4727, 10.1039/c4cs00020j.
- C. K. Chan, T. Yang and J. M. Weller, Electrochim. Acta, 2017, 253, 268–280, DOI:10.1016/j.electacta.2017.08.130.
- S. Ramakumar, C. Deviannapoorani, L. Dhivya, L. S. Shankar and R. Murugan, Prog. Mater. Sci., 2017, 88, 325–411, DOI:10.1016/j.pmatsci.2017.04.007.
- J. Awaka, N. Kijima, H. Hayakawa and J. Akimoto, J. Solid State Chem., 2009, 182, 2046–2052, DOI:10.1016/j.jssc.2009.05.020.
- J. Awaka, A. Takashima, K. Kataoka, N. Kijima, Y. Idemoto and J. Akimoto, Chem. Lett., 2011, 40, 6062, DOI:19.1246/cl.2011.60.
- M. J. Klenk and W. Lai, Solid State Ionics, 2016, 289, 143–146, DOI:10.1016/j.ssi.2016.03.002.
- K. Kataoka and J. Akimoto, ChemElectroChem, 2018, 5, 1–8, DOI:10.1002/celc.201800679.
- Y. Matsuda, Y. Itami, K. Hayamizu, T. Ishigaki, M. Matsui, Y. Takeda, O. Yamamoto and N. Imanishia, RSC Adv., 2016, 6, 78210–78218, 10.1039/c6ra13317g.
- K. Kataoka, H. Nagata and J. Akimoto, Sci. Rep., 2018, 8, 9965, DOI:10.1038/s41598-018-27851-x.
- S. Ohta, T. Kobayashi and T. Asaoka, J. Power Sources, 2011, 196, 3342–3345, DOI:10.1016/j.jpowsour.2010.11.089.
- K. Ishiguro, Y. Nakata, M. Matsui, I. Uechi, Y. Takeda, O. Yamamoto and N. Imanishi, J. Electrochem. Soc., 2013, 160, A1690–A1693, DOI:10.1149/2.036310jes.
- H. Nozaki, M. Harada, S. Ohta, N. H. Jalarvo, E. Mamontov, L. Watanabe, Y. Miyake, Y. Ikedo and J. Sugiyama, J. Phys. Soc. Jpn., 2013, 82, SA004, DOI:10.7566/JPSJS.82SA.SA004.
- H. Nozaki, S. Ohta, M. Harada, M. Månsson, D. Sheptyakov, V. Pomjakushin, I. Watanabe, Y. Ikedo, Y. Miyake and J. Sugiyama, JPS Conf. Proc., 2014, 010303, DOI:10.7566/JPSCP.2.010303.
- R. Böhmer, K. R. Jeffrey and M. Vogel, Prog. Nucl. Magn. Reson. Spectrosc., 2007, 50, 87–174, DOI:10.1016/j.pnmrs.2006.12.001.
- H. Eckert, Z. Phys. Chem., 2010, 224, 1591–1653, DOI:10.1524/zpch.2010.0030.
- C. V. Chandran and R. Heitjans, Annu. Rep. NMR Spectrosc., 2016, 89, 1–102 CrossRef CAS.
- B. Stanje, D. Rettenwander, S. Breuer, M. Uitz, S. Berendts, M. Lerch, R. Uecker, G. Redhammer, I. Hanzu and M. Wilkening, Ann. Phys., 2017, 529, 1700140, DOI:10.1002/andp.201700140.
- P. Posch, S. Lunghammer, S. Berendts, S. Ganschow, G. J. Redhammer, A. Wilkening, M. Lerch, B. Gadermaier, D. Rettenwander and H. M. R. Wilkening, Energy Storage Mater. DOI:10.1016/j.ensm.2019.08.017.
- K. Hayamizu, Annu. Rep. NMR Spectrosc., 2019, 98, 57–123, DOI:10.1016/bs.anmr.2019.04.002.
- K. Hayamizu, Y. Matsuda, M. Matsui and N. Imanishi, Solid State Nucl. Magn. Reson., 2015, 70, 21–27, DOI:10.1016/j.ssnmr.2015.05.002.
- K. Hayamizu, S. Seki and T. Haishi, J. Chem. Phys., 2017, 146, 024701, DOI:10.1063/1.4973827.
- K. Hayamizu and S. Seki, Phys. Chem. Chem. Phys., 2017, 19, 23483–23491, 10.1039/c7cp0647g.
- K. Hayamizu, S. Seki and T. Haishi, Phys. Chem. Chem. Phys., 2018, 20, 17615–17623, 10.1039/c8cp02915f.
- K. Hayamizu, S. Seki and T. Haishi, Solid State Ionics, 2018, 326, 37–47, DOI:10.1016/j.ssi.2018.09.009.
- K. Hayamizu, Y. Terada, K. Kataoka and J. Akimoto, J. Chem. Phys., 2019, 150, 194502, DOI:10.1063/1.5089576.
- K. Hayamizu, y. Aihara, T. Watanabe, T. Yamada, S. Ito and N. Machida, Solid State Ionics, 2016, 285, 51–58, DOI:10.1016/j.ssi.2015.06.016.
- C. Julien and G.-A. Nazri, Solid State Batteries: Material Design and Optimization, Kluwer Academic Publishers, Boston, 1994 DOI:10.1007/978-1-4615-2704-6.
Footnote |
| † Electronic supplementary information (ESI) available: 7Li spectra of three samples of LLZO-Nb; collision-diffraction plots for 3 mm-high single-crystal samples soon after they were cut from 6 mm-high sample; echo-attenuation spectral plots of the single-crystal and crushed samples of LLZO-Nb with Δ = 10 ms and δ up to 8 ms (60 points) in the real and magnitude modes; collision-diffraction plots of the crushed sample at 30 and 65 °C; comparison of the echo-attenuation plots by the STE and Hahn pulse sequences; Δ-dependent Li-diffusion of the three single-crystal samples in different morphologies; g-dependence of the single-crystal sample for Δ = 20, 30, and 50 ms; Arrhenius-type plots of D values for 3 mm-high single crystal LLZO-Nb with g = 7.1, 10.0 and 12.9 T m−1; plots of DLi and Ncarrier(NE) vs. σ for 17 electrolytes, and table of the atomic NLi in cm3 for the garnets studied and table including DLi, σ, and Ncarrier(NE) for 17 solid electrolytes hitherto measured. See DOI: 10.1039/c9cp04714j |
| This journal is © the Owner Societies 2019 |