
 Open Access Article
 This Open Access Article is licensed under a Creative Commons Attribution-Non Commercial 3.0 Unported Licence
TiO2-supported Pt single atoms by surface organometallic chemistry for photocatalytic hydrogen evolution†
Gabriel
Jeantelot
 a,
Muhammad
Qureshi
a,
Moussab
Harb
*a,
Samy
Ould-Chikh
a,
Dalaver H.
Anjum
b,
Edy
Abou-Hamad
b,
Antonio
Aguilar-Tapia
c,
Jean-Louis
Hazemann
c,
Kazuhiro
Takanabe
a and
Jean-Marie
Basset
*a
a,
Muhammad
Qureshi
a,
Moussab
Harb
*a,
Samy
Ould-Chikh
a,
Dalaver H.
Anjum
b,
Edy
Abou-Hamad
b,
Antonio
Aguilar-Tapia
c,
Jean-Louis
Hazemann
c,
Kazuhiro
Takanabe
a and
Jean-Marie
Basset
*a
aKaust Catalysis Center (KCC), Physical Science and Engineering Division (PSE), King Abdullah University of Science and Technology (KAUST), Thuwal 23955-6900, Saudi Arabia. E-mail: moussab.harb@kaust.edu.sa; jeanmarie.basset@kaust.edu.sa
bCore Labs, King Abdullah University of Science and Technology (KAUST), Thuwal, 23955-6900, Saudi Arabia
cInstitut Néel, UPR2940 CNRS, University of Grenoble Alpes, F-38000 Grenoble, France
First published on 24th October 2019
Abstract
A platinum complex, (CH3)2Pt(COD), is grafted via surface organometallic chemistry (SOMC) on morphology-controlled anatase TiO2 to generate single, isolated Pt atoms on TiO2 nano-platelets. The resulting material is characterized by FT-IR, high resolution scanning transmission electron microscopy (HRSTEM), NMR, and XAS, and then used to perform photocatalytic water splitting. The photocatalyst with SOMC-grafted Pt shows superior performance in photocatalytic hydrogen evolution and strongly suppresses the backwards reaction of H2 and O2 forming H2O under dark conditions, compared to the photocatalyst prepared by impregnation at the same Pt loading. However, single Pt atoms on this surface also rapidly coalesce into nanoparticles under photocatalytic conditions. It is also found that adsorption of CO gas at room temperature also triggers the aggregation of Pt single atoms into nanoparticles. A detailed mechanism is investigated for the mobility of Pt in the formation of its carbonyls using density functional theory (DFT) calculations.
Introduction
Photocatalytic water splitting using a powdered photocatalyst is a promising technology for the generation of hydrogen from water. In this process, light is directly used to convert water into H2 and O2 through a material in an aqueous suspension.1 Photon absorption by a semiconductor material generates excited electrons in the conduction band and excited holes in the valence band, which are in turn used to cause reduction of protons and oxidation of water, respectively.1 Multiple semiconductors are known to meet the thermodynamic requirements to perform overall photocatalytic water splitting. These include SrTiO3,2 GaN:ZnO,3 Ta3N5,4 C3N4,5,6 and TiO2 allotropes.7,8 Among them, TiO2 photocatalysts, despite relatively high bandgaps confining them to the UV range of the spectrum (3.0–3.2 eV), exhibit both good carrier lifetimes9 and good stability under photocatalysis conditions. TiO2 allotropes can also be easily synthesized as nanoparticles with high surface areas, and possess a high coverage of hydroxyl groups on their surfaces, which allow for controlled surface chemistry.10,11While the bare TiO2 surface was shown to already be active for the oxygen evolution reaction (OER) under UV illumination in the presence of suitable electron acceptors,12 it is, however, not active for the hydrogen evolution reaction (HER) on its own:13 of the two possible routes for hydrogen evolution (Volmer–Tafel and Volmer–Heyrovsky), both require the formation of a surface adsorbed hydrogen atom from the reduction of H+ or H2O as a first step.14 The formation of such a strongly reducing species on a reducible oxide is unlikely, unless TiO2 is already reduced through the introduction of a large amount of Ti3+ defect sites at its surface.15,16 Such Ti3+ defects are also active as charge recombination centers.17 Therefore, the use of an HER cocatalyst is needed to overcome this limitation.18
Pt nanoparticles are often used for this purpose. While efficiently performing the HER and providing charge separation,19 they are also active for the reverse water-forming reactions, i.e., the thermal water-forming reaction, the oxygen reduction reaction (ORR)20 and the hydrogen oxidation reaction (HOR).21 Their electrocatalytic activity is, however, highly dependent on particle size, peaking at around 2–3 nm for both the ORR20,22 and HOR21 and then falling sharply with smaller nanoparticles and clusters.23 On the other hand, the HER activity appears to continually increase with decreasing Pt particle size.24–26 On the smallest end of the scale, single Pt atoms have been obtained on several supports: carbon-based ones such as carbon nanotubes,27 graphene,28 nitrogen-doped graphene29,30 or nitrogen-doped activated carbon,31 and metal oxides such as Sb-doped SnO2,32 iron oxides,33,34 CeO2,35 HZSM-5,36 anatase,37 and rutile TiO2 single crystals.38 Such single Pt atoms on graphene-based supports exhibit high activity for the electrocatalytic HER.29,30 To date, Pt atoms supported on metal oxides have mainly been used for reactions such as CO oxidation and water gas shift in thermal catalysis.34–36,38
One technique for preparing single-atom catalysts supported on powdered oxides is known as surface organometallic chemistry (SOMC). By SOMC, one can anchor metal complexes to the surface of metals, zeolites or metal oxides by making use of reactive surface species, leading to isolated molecular species.39 On metal oxides, the usual grafting sites are hydroxyl groups, as they are present in large amounts.40 Through their labile protons, they are capable of performing electrophilic attack on anionic ligands in organometallic complexes, leaving an M′–O–M link between the metal complex and the metal oxide surface.40 The metal oxide surface thus becomes a rigid ligand of the metal complex. Very recently, SrTiO3 with SOMC-grafted Pt demonstrated activity for the photocatalytic HER and overall water splitting.41 Good understanding of the resulting surface organometallic fragments therefore requires good understanding of the nature of the surface hydroxyl groups. Furthermore, a high surface area is required to obtain reasonable loadings at low coverages.
For rigorous control and understanding of SOMC processes, uniform exposure of a specific facet is highly demanded. For this purpose, the synthesis of anatase titanium dioxide with high surface area and highly exposed {001} facets was previously achieved by the hydrolysis of titanium(IV) butoxide with 47% aqueous HF, followed by solvothermal treatment.42 The surface hydroxyl groups present on this material have been thoroughly investigated, thus making it an attractive choice for SOMC on TiO2.11
In this work, aiming at efficient photocatalytic water splitting, platinum single atoms are grafted on the surface of morphology-controlled anatase TiO2 with highly exposed {001} facets. To obtain a “single-atom catalyst” (SAC), SOMC techniques are used, with (1,5-cyclooctadiene)dimethylplatinum(II) ((CH3)2Pt(COD)) as the Pt precursor.43–45 The resulting materials are characterized by FTIR, NMR, high resolution scanning transmission electron microscopy (HRSTEM) and extended X-ray absorption fine structure spectroscopy (EXAFS). The reactivity of the Pt sites in the presence of carbon monoxide was investigated by in situ FTIR, HRSTEM and DFT calculations. The performance in photocatalytic water splitting is then studied with sacrificial reagents, as well as the activity in the dark for the water forming backwards reaction.
Experimental section
(1) Materials syntheses
A partial fluorine removal treatment was then applied as described previously:11 2 g of material was heated at 110 °C on a glass frit in a vertical glass tube, under a combined flow of 100 mL min−1 of 1% oxygen in argon and 200 mg min−1 H2O vapor for 10 h. To remove any physisorbed water from the surface, the gas flow was then switched to dry oxygen/argon (20% O2 in Ar, 20 mL min−1) and the sample was dehydroxylated at 200 °C for 6 hours. Once cold, the tube was evacuated and brought into a glovebox under an inert atmosphere (argon) and the sample transferred to a brown glass vial to protect it from UV light.
The resulting sample consists of well faceted 5 × 43 nm TiO2 platelets, with highly exposed {001} facets, as previously reported.11 The surface area measured by BET is 92 m2 g−1 (30% of the total surface is inaccessible due to platelet aggregation). The {001} facets are estimated to have a hydroxyl coverage of 1.3 OH nm−2, mainly in the shape of μ1 Ti–OH hydrogen bound to a nearby fluorine.11
This sample will be referred to in what follows as {001}-anatase.
In a glovebox under an inert atmosphere (Ar), 1.76 grams of {001}-anatase dehydroxylated at 200 °C was placed in the second half of a double-schlenk, and (CH3)2Pt(COD) was introduced in the first half of the double schlenk, in an amount corresponding to the desired Pt loading (e.g. 15.0 mg of (CH3)2Pt(COD) for a 0.5 wt% Pt loading). A vacuum was pulled on the double-schlenk and its contents. 15 mL of dry and degassed pentane was vacuum-transferred to the first half of the schlenk, and left to stir until full dissolution of the platinum complex. The solution was then filtered across the frit into the second half of the double-schlenk, for the grafting on TiO2 powder to proceed. The suspension was stirred, sonicated in an ultrasonic bath, and left under stirring overnight. The grafted TiO2 was left to settle, and the pentane solution containing excess platinum precursor was filtered back into the first half of the double-schlenk. Washings were then performed by vacuum-transferring pentane on the TiO2, stirring the suspension, and filtering it back through the frit into the first half of the double-schlenk. This cycle was repeated 5 times. The solvent in the double-schlenk was then vacuum-transferred to an empty flask, and a dynamic vacuum (1 × 10⁻⁵ mbar) was pulled on the sample overnight to thoroughly dry it. The double-schlenk was then opened in a glovebox under an inert atmosphere, where the grafted TiO2 was transferred into a storage tube until further use.
TiO2 samples with different Pt loadings were thus obtained: 5%PtGR:TiO2; 2.5%PtGR:TiO2; 0.8%PtGR:TiO2; 0.5%PtGR:TiO2 and 0.2%PtGR:TiO2.
A hydrolysed sample was needed for 13C NMR. Hydrolysis was performed on 0.5%PtGR:TiO2 by slurrying some of it in water, and then drying it under a vacuum at room temperature. The resulting sample will be referred to as 0.5%PtGR:TiO2-hydrolysed.
For comparison purposes, a sample was also prepared by impregnation with H2PtCl6 followed by H2 reduction: 1.2 g of {001}-anatase was slurried with 6 mL pure water and 0.15 mL of an 8% H2PtCl6 solution (corresponding to a 0.5% Pt loading on TiO2) in a crucible. The slurry was stirred to dryness on a hotplate, calcined at 250 °C in air for 1 h, and finally reduced under a 20 mL min−1 flow of 4% H2 in Ar at 250 °C for 3 hours. This sample will be referred to as 0.5%PtNP:TiO2.
(2) Photocatalytic setup and backwards reaction measurement
The photocatalytic reactions were conducted at 100 Torr argon in a circulating batch reactor equipped with an online gas chromatograph (GC: Shimadzu GC-8A, TCD, argon carrier gas, molecular sieve 13X column, 10 μL sample loop). The total dead volume of the batch reactor was measured at 505 mL.A xenon lamp (CERMAX PE300-BF, 300 W) was used as the light source, and the irradiation wavelength was controlled with a combination of a cold mirror and a water filter (300 < λ < 800 nm). The spectral area of the photocatalytic reactor was 38.5 cm2. The setup is described in the ESI† (Fig. S2). For photon yield calculations, the photon flux was measured using an AvaSpec-3648 spectrometer, AvaLight DHS calibration light source, and FC-UV200-2 fibre-optic cable. Photon yields were determined from the photon flux integrated between 225 and 387 nm (5.5–3.2 eV) (photon flux given in Fig. S11, ESI†).
For photocatalytic testing, 50 mg of photocatalyst was dispersed under sonication in 100 mL of a desired solution (10% methanol in water for the HER, 0.1 M sodium persulfate for the OER). The suspension was introduced in the reactor, the assembly sealed, and a vacuum was pulled on the system to remove any oxygen and nitrogen dissolved in the solution. The reactor was then repeatedly brought back to room pressure with pure argon, and evacuated again, for a total of nine vacuum/argon cycles. Final pressurization was done to 100 mbar with argon and a small amount of krypton to act as an internal standard and compensate for minor variations in the GC injection volume. The first 30 minutes were excluded due to the gas mixing kinetics in the reactor.
Water-forming thermal reaction measurements from H2 and O2 were conducted in the same circulating batch reactor. Samples were suspended in pure water (Millipore Milli-Q), and degassed following the same protocol described before. They were finally pressurized under 1 atm of a mixture of 1% O2, 2% H2 and 4% Kr in Ar. Kr was used as an internal standard to compensate for minor variations in the GC injection volume. No light source was used, and the reactor was protected from incident light.
(3) Material characterization
High-resolution transmission electron microscopy (HR-TEM) of the samples was performed with a Titan ThemisZ microscope from Thermo-Fisher Scientific which was equipped with a spherical aberration corrector for the electron beam and an energy-dispersive spectroscopy (EDS) detector. The microscope was operated at an accelerating voltage of 300 kV. Prior to the analysis, it was set to scanning TEM (STEM) mode to acquire atomic number (Z) sensitive images by using a high-angle annular dark-field (HAADF) detector. Furthermore, electron beam aberrations including coma and higher-order stigmatisms were reduced to small enough values so that excellent quality atomic resolution STEM images could be acquired. For each sample, corresponding EDS spectra were acquired to confirm the presence of Pt metal present along with the TiO2 catalyst support. All specimens of the samples were prepared by dispersion in water (Milli-Q) and sonication, followed by blotting onto the TEM grid. The images were acquired in a range of magnifications and the entire image-acquisition was performed using Gatan Microcopy Suite version GMS 2.5 from Gatan, Inc.Infrared (IR) spectra were acquired using a Thermo Scientific Nicolet 6700 FT-IR spectrometer with a mercury-cadmium telluride (MCT) detector and a Harrick Praying Mantis diffuse reflection accessory. The optical velocity was set to 0.63 and the aperture was set to 64. Samples were either placed in a Harrick ambient sample chamber with KBr windows, or, for in situ DRIFTS, in a Harrick high temperature reaction chamber with ZnSe windows.
The Pt L3-edge HERFD-XANES spectra were recorded at the European Synchrotron Radiation Facility on the CRG-FAME-UHD beamline (BM16). The beamline was equipped with a liquid nitrogen-cooled double-crystal Si(220) monochromator surrounded by two Rh-coated mirrors for harmonic rejection. The beam size on the sample was kept constant during an energy scan at around 220 × 110 μm (horizontal × vertical, FWHM). The [660] reflection of three Ge(110) spherically bent crystal analyzers (a bending radius of 1 m) from the multicrystal spectrometer installed at BM16 was used to select the Lα1 (L3–M5) fluorescence line at 9442 eV. The total energy resolution of the HERFD-XANES data was estimated to be approximately 0.7 eV. Energy calibration of the incoming radiation was performed prior to the measurements by recording the L3-edge transmission spectrum of Pt foil and assigning the maximum of the first derivative peak to 11564 eV.
XAS data were analysed using the HORAE package, a graphical interface to the AUTOBK and IFEFFIT code.46 The XANES and EXAFS spectra were obtained after performing respective standard procedures for pre-edge subtraction, normalization, polynomial removal and wave vector conversion. The extracted EXAFS signal was Fourier transformed using a Kaiser–Bessel apodization window (dk = 1) within a k-range of [3.4; 10.2] Å−1. Continuous Cauchy wavelet transform was also applied to decompose the EXAFS signal in reciprocal and real space simultaneously.47 The Pt amplitude reduction factor (S02) value was determined from the EXAFS spectrum of metallic Pt foil at 0.77 (Fig. S8, ESI†).
(4) Density functional theory (DFT) computation
DFT calculations were also performed in order to help understand the reactivity of the grafted (CH3)2Pt(COD) complex on the {001}-anatase TiO2 support in the presence of carbon monoxide. A 4 × 4 × 1 tetragonal supercell model for the support containing 64 (TiO2) functional units Ti64O128 or 192 atoms periodically stacked in the a- and b-crystallographic directions and 4 Ti layers with a 20 Å vacuum width in the c-direction was constructed from the pristine anatase crystal structure. Hydroxyl OH groups with an OH:Ti ratio of 0.28 and a fluorination level on the surface with an F:Ti ratio of 0.125 were also taken into account to mimic the obtained experimental sample. Various possible geometrical configurations for bipodal grafted (CH3)2Pt(COD) and Pt(CO)n complexes revealing Ti–O–Pt–O–Ti or Ti–O–Pt–F–Ti bridging types were explored in order to find the most favorable situations in the absence and in the presence of carbon monoxide.The various generated structures were fully optimized using periodic density functional theory (DFT) with the projector augmented plane wave (PAW) method48 as implemented in the VASP (Vienna ab initio simulation package) quantum simulation program.49–52 The generalized gradient approximation (GGA) within the Perdew–Burke–Ernzerhof (PBE) exchange–correlation functional,53 a cutoff kinetic energy of 400 eV for electron wave basis functions, and a 3 × 3 × 1 Monkhorst–Pack k-point mesh54 for sampling the first Brillouin zone were used. The valence electron configurations treated explicitly in the PAW potentials are 3d34s1 for Ti, 2s22p4 for O, 2s22p5 for F, 2s22p2 for C, ultrasoft 1s1 for H, and 5d96s1 for Pt. The atomic positions were fully optimized and the geometries were considered well converged when the three principal residual Hellmann–Feynman force components on each atom were near 0.01 eV Å−1, the atomic displacements were near 10−4 Å and the convergence criterion for the self-consistent field (SCF) cycles for energy change was near 10−5 eV per supercell.
Results
Five different samples were prepared by SOMC with 5 wt%; 2.5 wt%; 1 wt%; 0.5 wt% and 0.25 wt% Pt. One sample was prepared by H2PtCl6 impregnation and H2 reduction with 0.5 wt% Pt. Using previously measured OH coverages for this material,11 the ratio of Pt introduced per surface OH group is below 1 for all samples prepared by SOMC, except the 5%PtGR:TiO2 sample, where a large (CH3)2Pt(COD) excess was used. Even then, the Pt/OH molar ratio is only 1.2. This slight excess can be explained by imprecisions in the OH coverage measurement and some unreacted (CH3)2Pt(COD) remaining adsorbed on the sample. Thus, it is expected that the Pt was predominantly grafted by reaction of the Pt–Me bond with Ti–OH leading to methane and a Ti–O–Pt bond.First, the synthesized Pt:TiO2 samples obtained by the aforementioned methods were characterized in detail by FT-IR spectroscopy, 13C NMR, HRSTEM and EXAFS. Also, their reactivity with carbon monoxide chemisorption was studied. Secondly, the photocatalytic activity for hydrogen evolution, oxygen evolution and the thermal backwards reaction of water formation was investigated.
(1) Material characterization
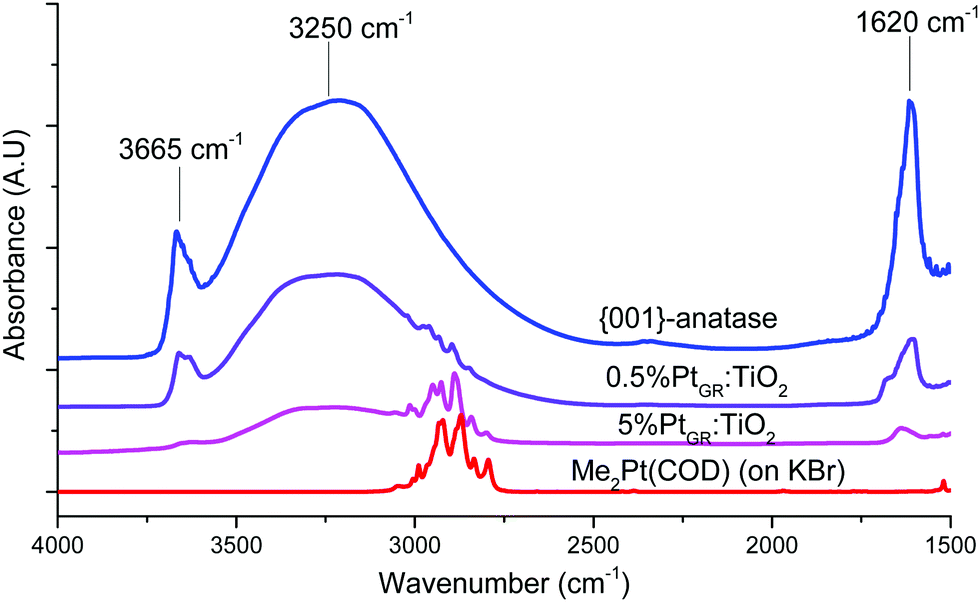 | ||
| Fig. 1 Infrared spectroscopy (DRIFTS) of the support, complex, and grafted material. | ||
When an excess of (CH3)2Pt(COD) is used, the intensity of the O–H stretching bands in the 3750–2500 cm−1 region strongly decreases. This indicates almost complete hydroxyl consumption, except for some remaining hydrogen-bonded hydroxyls in the 3500–2500 cm−1 region. This matches a previous study on this material, as this region is thought to comprise hydroxyls located in between aggregated TiO2 platelets, thus rendered inaccessible to the organometallic complex.11 Strong C–H stretching bands can also be seen in the 3100–2800 cm−1 region, similar to those from the pure (CH3)2Pt(COD) complex. The hydroxyl consumption and appearance of C–H stretching peaks on the material both indicate that grafting of the complex on the surface did occur. Similarly, when lower loadings are employed, partial hydroxyl consumption is seen and smaller CH stretching bands appear in the 3100–2800 cm−1 region.
FT-IR spectroscopy in the 1550–1250 cm−1 region (Fig. S3, ESI†) shows several absorption bands that can be attributed to the COD ligand. While the exact attribution of those vibrational modes remains unclear, candidates including CH2 deformations and combination bands,55 the vibrations thus observed for the grafted samples are highly similar in wavenumber to those from the Me2Pt(COD) complex or Cl2Pt(COD) complex (Table S1, ESI†). Marked differences with the spectrum of free cis,cis-(1,5)-cyclooctadiene can be seen, suggesting that the COD ligand remains bound to Pt atoms.
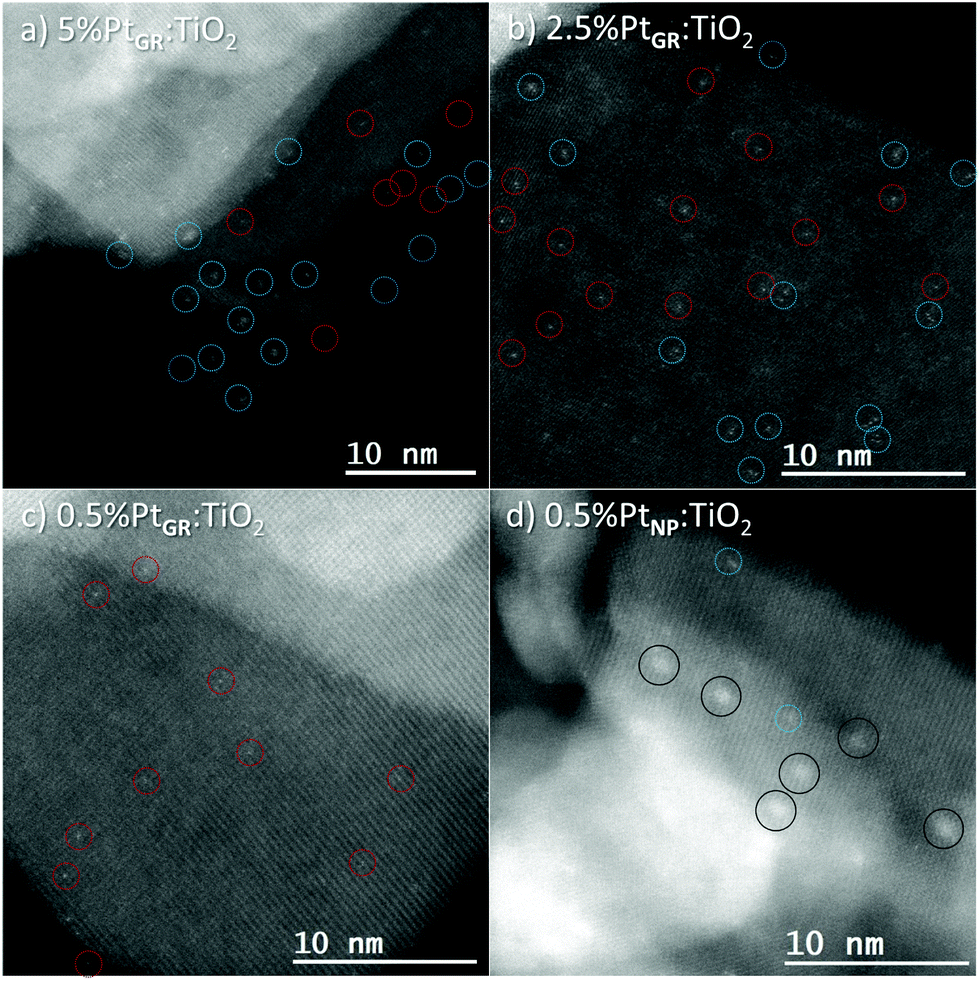 | ||
| Fig. 2 HAADF-HRSTEM of the grafted samples and impregnated sample. Single atoms are denoted by red circles, clusters by blue circles, and nanoparticles by black circles. | ||
All samples were prepared by dispersion in water (Milli-Q) and sonication, followed by blotting onto the TEM grid.
On samples grafted by SOMC, at the highest loading, 5% Pt, mostly clusters are visible. At 2.5% loading, both 2–3 atom clusters and isolated atoms can be seen. At the lowest loading, 0.5% Pt, almost exclusively isolated atoms are obtained.
Conversely, the sample prepared by classical impregnation (0.5% Pt) followed by hydrogen reduction shows small Pt nanoparticles, with a 1.0 nm diameter on average, and very few Pt single atoms or clusters.
 | ||
| Fig. 3 Proposed grafting reactions and resulting surface species structures. (a) Grafting reaction with hydroxyl groups on two neighbouring Ti and the resulting structure; (b) grafting with hydroxyl groups on diagonally opposed Ti and the resulting structure. Ti–F and Pt–F bond lengths are written in red. | ||
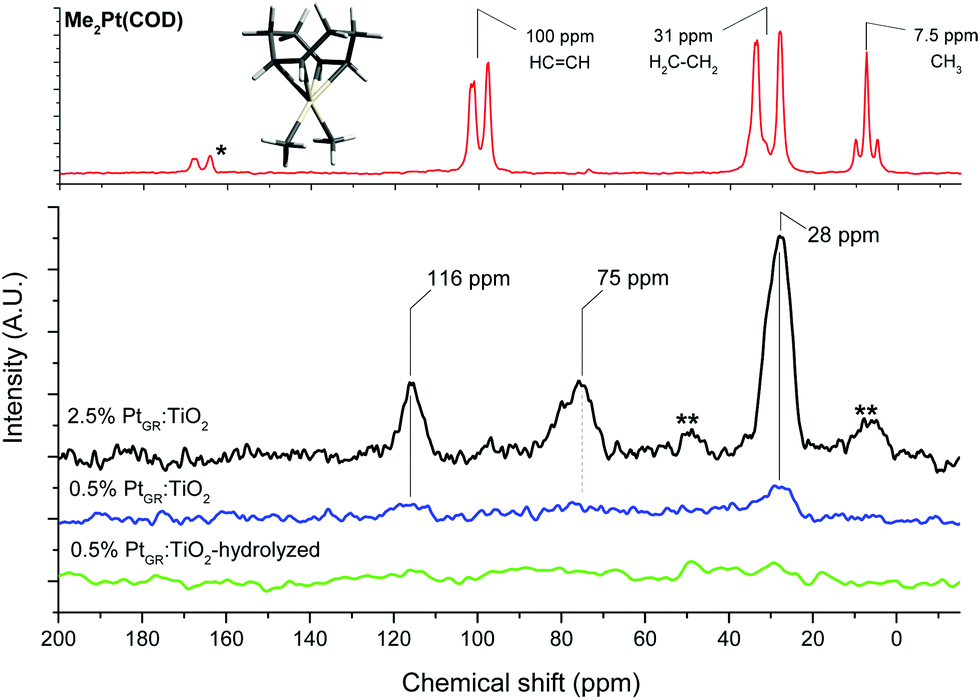
A strong resonance can be seen at 28 ppm, matching with the CH2 groups of the cyclooctadiene ligand of the complex.56 The CH resonance of the alkene groups of the COD ligand, expected at around 100 ppm from the pure complex,56 can be seen at 116 ppm for both grafted materials. The observed splitting of the COD resonances disappears for the grafted samples, possibly due to fast exchange between the two possible twisted configurations of the cyclooctadiene.
For the 2.5% Pt sample, the 116 ppm band appears half as intense as the 28 ppm CH2 resonance, and a third resonance can be seen at 75 ppm. As HRSTEM images show the formation of small Pt clusters on this sample, this suggests the 75 ppm resonance is due to COD ligands bound to such clusters. The 13C NMR spectrum of cyclooctadiene adsorbed on TiO2 does not show such a resonance at 75 ppm (Fig. S4, ESI†).
The 28 and 116 ppm bands are both absent for sample 0.5%PtGR:TiO2-hydrolysis, suggesting that water easily substitutes the COD ligand.
The Pt–CH3 resonance, seen at around 5 ppm in the pure complex, is not clearly visible in either sample, though a slight asymmetry in a spinning sideband of the 28 ppm band for the 2.5% Pt sample hints at its possible presence in very small amounts. This indicates grafting proceeded overwhelmingly in a bipodal fashion, leaving little to no Pt–CH3 groups. Bipodal grafting would involve reaction with two nearby hydroxyl groups. Based on this and the dominance of μ1-OH hydrogen-bonded to fluorides on the surface of this material,11 we propose the two following grafting reactions:
– Reaction with two hydroxyl groups on neighbouring Ti (3.8 Å apart), leading to a Ti–O–Pt(COD)–O–Ti species, which is retained after a full structural optimization using DFT calculations (Fig. 4a).
 | ||
| Fig. 4 13C Magic angle spinning solid state NMR of the complex and grafted material. *: impurity; **: spinning sidebands. | ||
– Reaction with two hydroxyl groups on diagonally opposed Ti. This would initially lead to a more stretched Ti–O–Pt(COD)–O–Ti species. The distance between Ti atoms (5.3 Å) makes this structure highly unstable. DFT calculations confirmed this and showed an optimized structure revealing a direct rearrangement to a Ti–O–Pt(COD)–F–Ti species, the fluoride maintaining a weak bond with the Ti atom underneath (Fig. 4b).
According to DFT calculations, both structures are very close in energy, the second one being slightly favoured by 15.1 kJ mol−1.
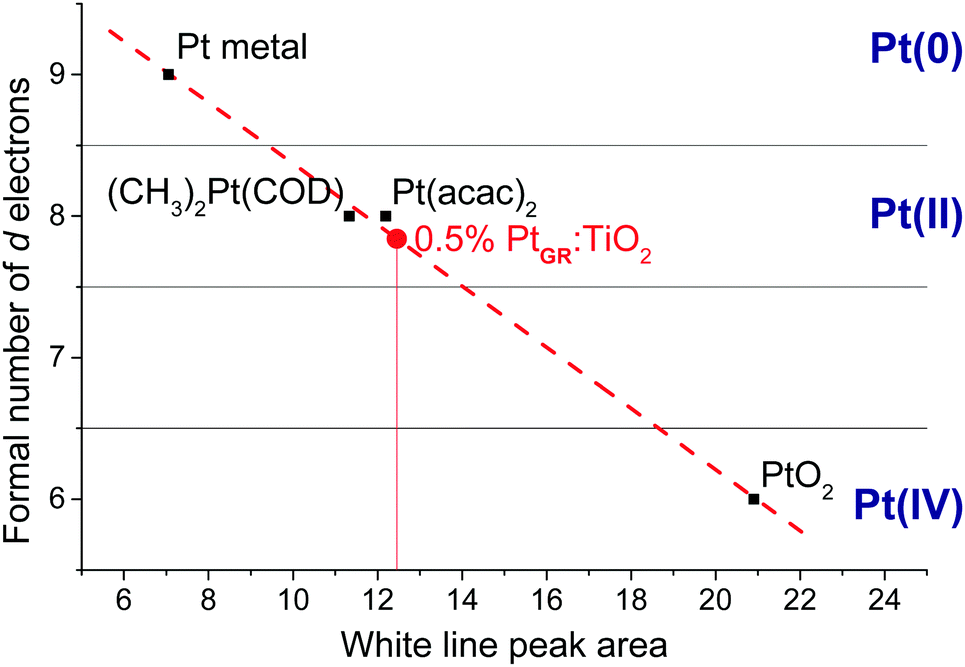 | ||
| Fig. 5 XANES calibration curve obtained by correlating the white line area of reference samples to their oxidation state, and the position of 0.5%PtGR:TiO2 on the curve. Spectra and individual fittings are shown in Fig. S5 (ESI†), numerical values are given in Table S2 (ESI†). | ||
The k2-weighted EXAFS spectrum and its related Fourier transforms (uncorrected for phase-shifts) are shown in Fig. 7. One major contribution is observed at bonding distance of 1.6 Å and some minor shells in the 2.3–3.8 Å range. To perform a relevant next nearest-neighbor identification of the new observed features, a wavelet transformation analysis was applied to the EXAFS data (WT-EXAFS).47 The backscattering amplitude from neighboring atoms shows a significant k dependence, which determines the envelope of EXAFS oscillations χ(k): lighter elements have their maximum backscattering amplitude at low wavenumbers, while increasing atomic number shifts the maximum towards higher k values. The resulting wavelet transform is shown for 0.5%PtGR:TiO2, PtO2, (CH3)2Pt(COD) and Pt metallic powder in Fig. S6 (ESI†). 0.5%PtGR:TiO2 has two prominent maxima in the WT-EXAFS plot, at approximate coordinates (R = 1.65 Å, k = 5 Å−1) and (R = 2.6 Å, k = 3.6 Å−1). By direct comparison with the WT-EXAFS of the Pt metallic reference, it is obvious that those two WT maxima in the grafted sample cannot be assigned to any Pt–Pt scattering path and this thus rules out the formation of Pt clusters. On the other hand, the WT-EXAFS of the Pt(COD)(Me)2 precursor is roughly similar to the grafted sample, which suggests some structural similarities.
For the quantitative analysis of the Pt L3-edge k2-weighted EXAFS signals, two L2X2 models of the platinum center derived from the most stable DFT optimized geometry structures are considered (Fig. 6). Both models involve the L-type coordination of a cyclooctadiene molecule (η4-cyclooctadiene) through four sp2 carbon atoms at an average Pt–C distance of 2.15 Å ± 0.02 Å. The second shell of four sp3 carbon atoms is located at an average distance of 3.05 Å ± 0.05 Å. The X-type coordination of the platinum atom to the surface of the{001} facet of anatase is modelled either by two μ2-O at distance 2.01 Å ± 0.01 Å or one μ2-O and one μ2-F, sitting at a distance of 1.99 Å and 2.06 Å respectively. Unfortunately, from the EXAFS point of view, there are minimal differences between the scattering paths calculated with oxygen or fluorine atoms.62,63 Considering the restricted k-range of the data, [3.4, 10.2] Å−1, the half path lengths of the first shell are also too close to be resolved.
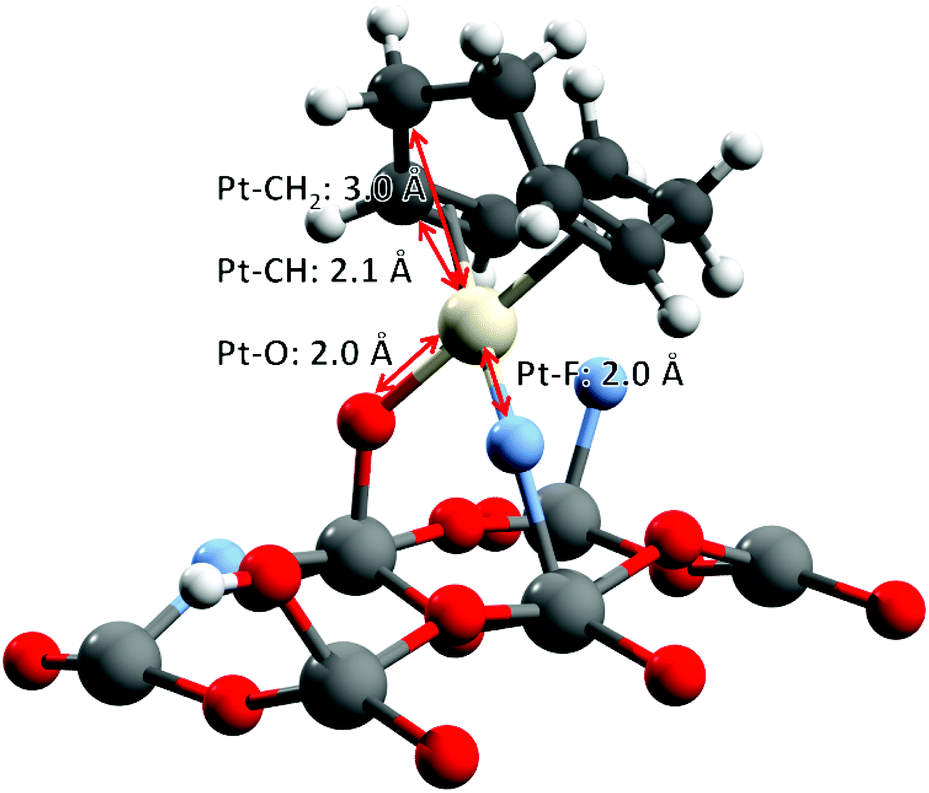 | ||
| Fig. 6 O–Pt–F DFT-optimized structure, used as the initial model for EXAFS fitting. O–Pt–O structure in the ESI† (Fig. S8). | ||
As a consequence, the best model used for the fitting of the experimental data consists of: (i) a doubly degenerate Pt–O scattering path modelling the coordination to the TiO2 surface through oxygen and/or fluorine atoms (in accordance with the Pt(II) oxidation state, and DFT calculations), (ii) a Pt–C scattering path for the coordinating sp2 carbon atoms, and (iii) another Pt–C scattering path modelling the non-bonding carbon atoms from cylooctadiene (CH2). Note that the coordination numbers of the two Pt–C scattering paths were constrained to be equal in order to break the correlations between the parameters of Pt–O and the shortest Pt–C scattering path. The final result (Fig. 7 and Table 1) provides a closely matching fit with the EXAFS data, together with reasonable fitting parameters and uncertainties (χ2/ν = 10.2, R-factor = 0.6%). All interatomic distances are in close agreement with the original DFT calculations: 2.06 Å for Pt–O and Pt–F (Pt–O: 2.00 Å and Pt–F: 2.04 Å by DFT), 2.20 Å for Pt–![[C with combining low line]](https://www.rsc.org/images/entities/char_0043_0332.gif) H (2.15 Å by DFT), and 3.08 Å for Pt–H2 (3.02 by DFT). The coordination number of carbon atoms indicates that on average one cyclooctadiene molecule remains bonded to the platinum center after grafting.
H (2.15 Å by DFT), and 3.08 Å for Pt–H2 (3.02 by DFT). The coordination number of carbon atoms indicates that on average one cyclooctadiene molecule remains bonded to the platinum center after grafting.
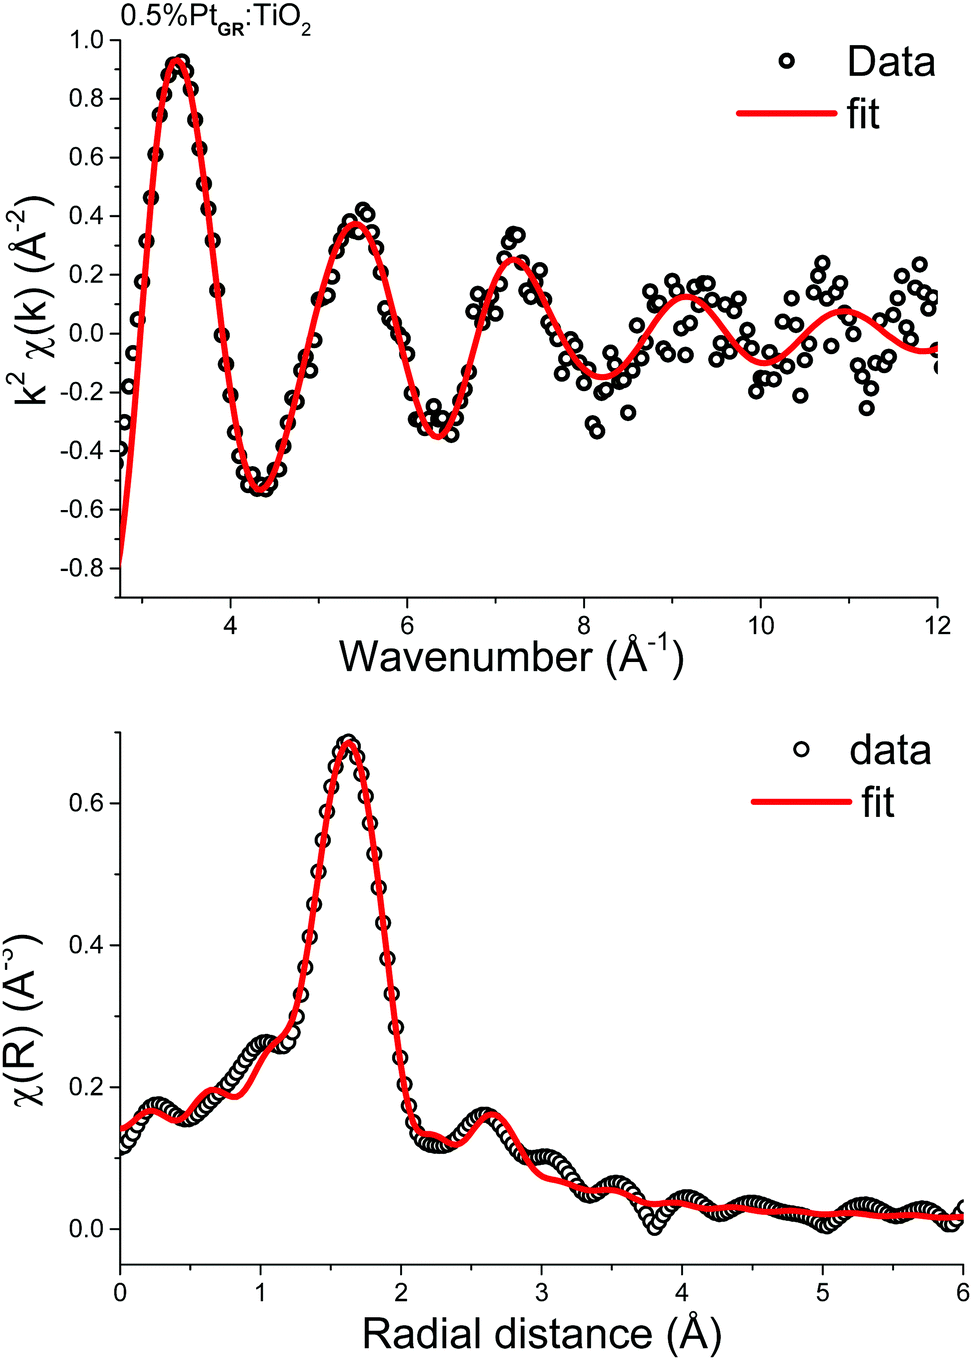 | ||
| Fig. 7 EXAFS data of 0.5%PtGR:TiO2 and fitting. Top: k2-Weighted EXAFS oscillations (k-space); bottom: magnitude of the Fourier transform (R-space). k-Range: 3.4 to 10.2, window: Kaiser-Bessel. | ||
| Scatter | Coordination number | R (Å) (EXAFS) | R (Å) (DFT) | σ 2 (Å2) | ΔE0 (eV) |
|---|---|---|---|---|---|
| Pt–O | 2 (defined) | 2.06 ± 0.01 | 1.99–2.01 | 0.004 ± 0.001 | 9.6 ± 1.6 |
| Pt–H |
4.0 ± 1.2 | 2.20 ± 0.06 | 2.13–2.16 | 0.019 ± 0.010 | |
| Pt–H2 |
3.08 ± 0.04 | 3.00–3.09 | 0.016 ± 0.007 |
Therefore, based on FTIR, 13C NMR, electron microscopy, DFT and X-ray absorption spectroscopy, we conclude that (CH3)2Pt(COD) grafting at low loading on {001}-anatase proceeds in a bipodal fashion, with no change in the Pt oxidation state, leading to isolated Pt(COD) species, bound to either two surface oxygen or one surface oxygen and one fluorine atom, as shown in Fig. 6.
![[triple bond, length as m-dash]](https://www.rsc.org/images/entities/char_e002.gif) O stretching band is affected by back-bonding from the platinum to the CO molecule, its position can provide insight into the oxidation state and coordination of the platinum atoms.
O stretching band is affected by back-bonding from the platinum to the CO molecule, its position can provide insight into the oxidation state and coordination of the platinum atoms.
CO adsorption and FT-IR spectroscopy was performed by exposing the samples to gaseous 5% CO in argon in an in situ DRIFTS chamber for 10 minutes, then flushing the chamber with argon again, leaving only irreversibly adsorbed CO on the sample. The spectra are shown in Fig. 8.
 | ||
| Fig. 8 Support and grafted material IR spectra after CO adsorption. | ||
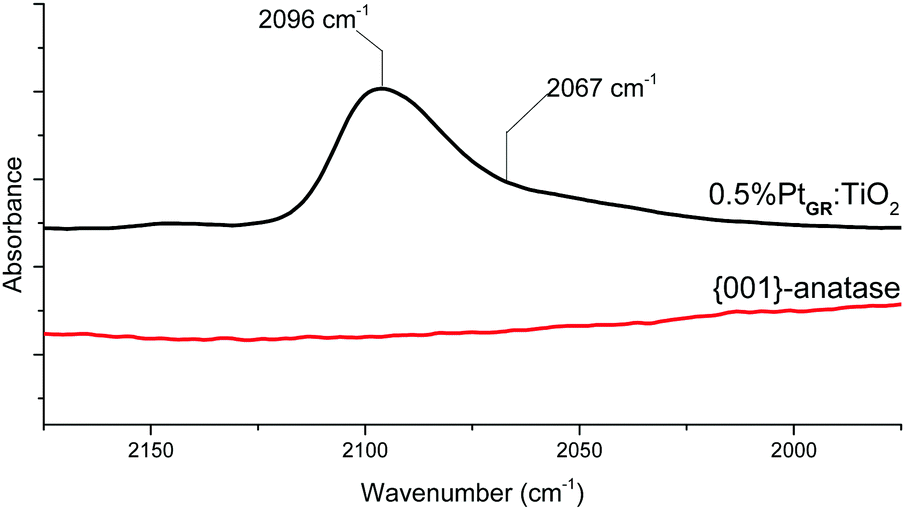
As expected, no CO stretching band can be seen from the support itself at room temperature.68 For 0.5%PtGR:TiO2, a prominent stretching band can be seen at 2096 cm−1, with a small shoulder around 2067 cm−1. These values are too low in frequency for CO bound to Pt2+ sites, which is generally expected around 2120–2140 cm−1,65,69–71 but match very well those expected respectively on the {111} faces and edges of Pt nanoparticles.72 The formation of geminal CO species can also be excluded, as two distinct bands of similar intensities would then be expected from the symmetric and antisymmetric stretching modes of this geometry.73 HRSTEM images taken before and after CO adsorption (Fig. 9) show the disappearance of Pt single atoms and the formation of small Pt nanoparticles upon exposure to CO gas.
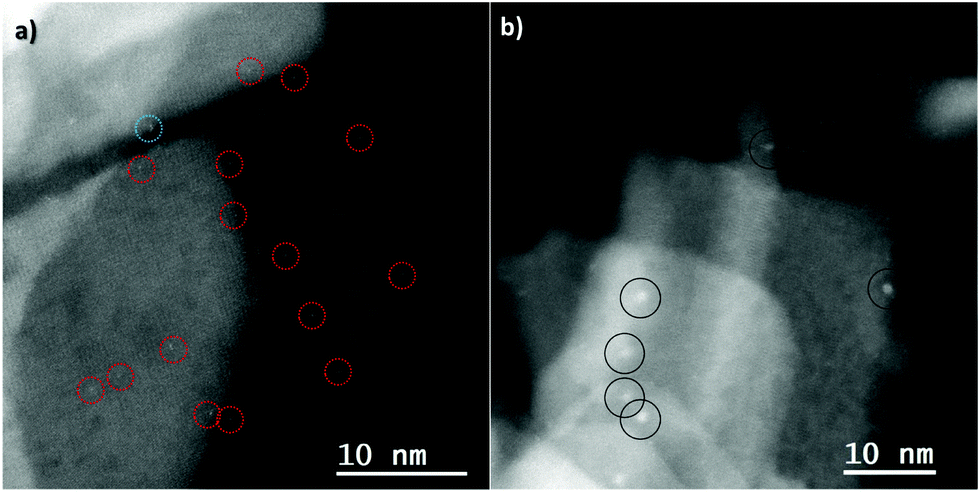 | ||
| Fig. 9 HAADF-STEM images of 0.5%PtGR:TiO2 (a) before and (b) after CO adsorption. Red circles: single atoms, black circles: nanoparticles. | ||
It is therefore apparent that the addition of carbon monoxide to single, isolated Pt(II) species on this TiO2 support reduced them to Pt0 nanoparticles. This could potentially happen through the oxidation of CO to CO2 and formation of a mobile, zero-valent Pt(CO)n species, that would then decompose into the observed nanoparticles. A proposed pathway for such a reaction was studied by DFT calculations and the obtained results are shown in Fig. 10.
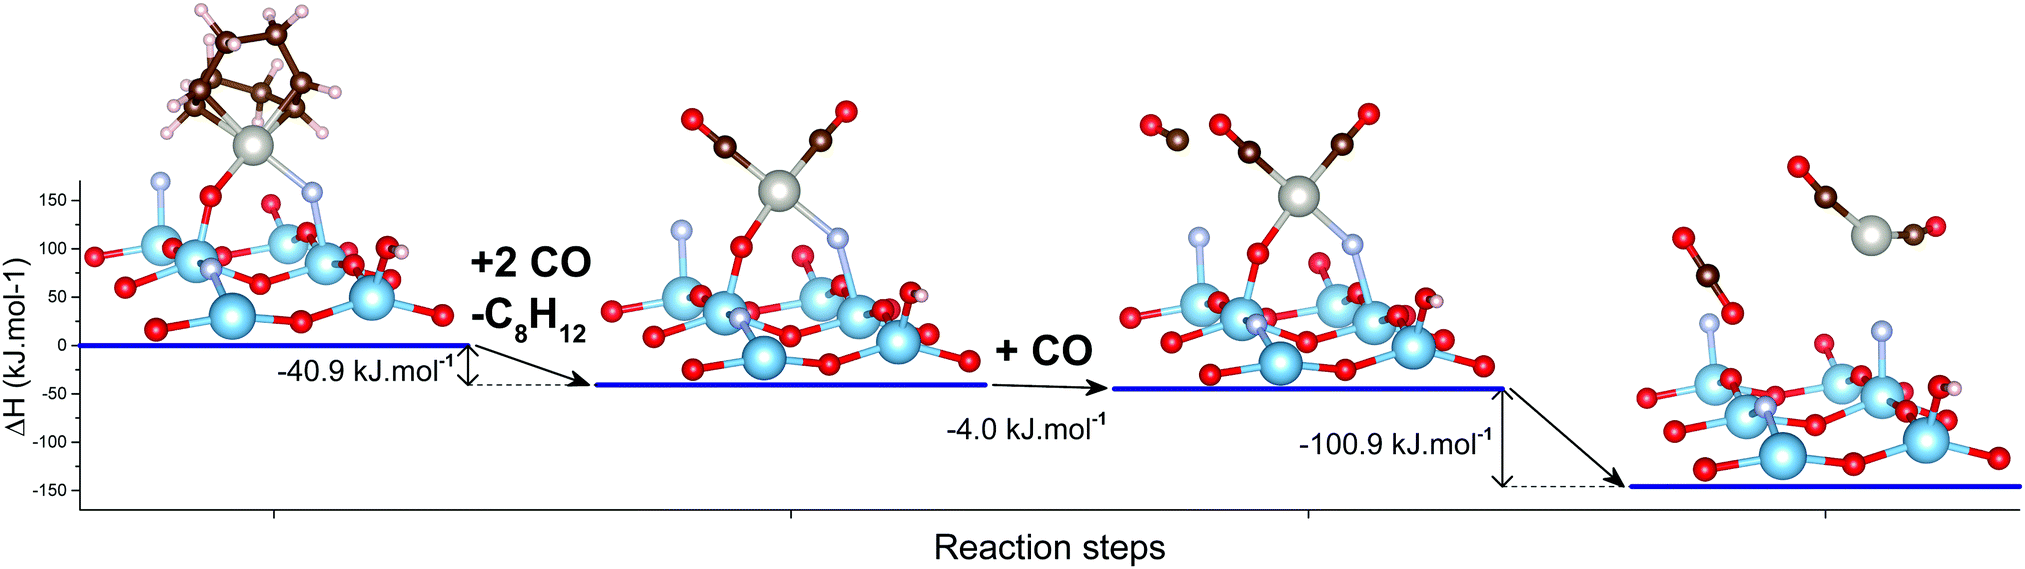 | ||
| Fig. 10 Proposed mechanism for Pt reduction by CO for the Ti–O–Pt(COD)–F–Ti structure as obtained by DFT calculations. Three Ti layers and Ti and O atoms on the edges are omitted for illustration clarity. Full structures are available in the ESI† (Fig. S9). The mechanism for the Ti–O–Pt(COD)–O–Ti structure is available in the ESI† (Fig. S10). | ||
The first step of such a reaction is a simple substitution of the cyclooctadiene ligand on platinum by two CO molecules, leading to a bipodal Pt(CO)2 species. A third CO molecule can then physisorb nearby on the TiO2 surface. A concerted reductive elimination between the O and CO ligand and addition of the nearby physisorbed CO then leads to the following species: CO2 and Pt(CO)2. Neither being covalently bound to the TiO2 surface, they should be highly mobile.
While such zero-valent Pt complexes have been reported before, their isolation required a solid argon or solid neon matrix at cryogenic temperatures.74,75 The in situ DRIFTS experiments reported here having been conducted at room temperature, Pt(CO)2 is therefore expected to rapidly decompose into Pt nanoparticles, in agreement with the observed experimental results.
Hence, it appears that the use of CO adsorption followed by IR spectroscopy to characterize Pt species is not necessarily applicable to materials with Pt single atoms on the surface, as they may thus be directly altered by the CO adsorption. Since atomically dispersed Pt catalysts have successfully been used under CO oxidation and water gas shift conditions elsewhere,34–36,38 this appears to be strongly dependent on the support to which the platinum atoms are anchored.
(2) Catalytic results
In this system, conduction band holes are rapidly consumed by the progressive oxidation of methanol to CO2 on the TiO2 surface, either directly or mediated by hydroxyl radicals.76 Formaldehyde and formic acid are formed as intermediates, and rapidly consumed.25 Valence band electrons can then in turn migrate to the surface catalytic sites where hydrogen evolution occurs.77
As shown in Fig. 11, a relatively high photocatalytic activity is initially achieved. The corresponding photon yield reaches ∼12% for photons with wavelengths between 225 and 387 nm (5.5–3.2 eV, spectrum in Fig. S11, ESI†). The activity however strongly decreases over time, levelling after 30 h. TEM imaging after photocatalysis (Fig. S13, ESI†) shows the presence of Pt nanoparticles and the absence of Pt single atoms. The sample prepared by H2PtCl6 impregnation followed by hydrogen reduction (0.5%PtNP:TiO2) shows much lower activity from the start and identical activity to the grafted sample after some minor deactivation. We therefore consider that the deactivation likely proceeds through the aggregation of the grafted Pt into Pt nanoparticles under reducing conditions, resulting in a decrease of Pt dispersion over the sample.
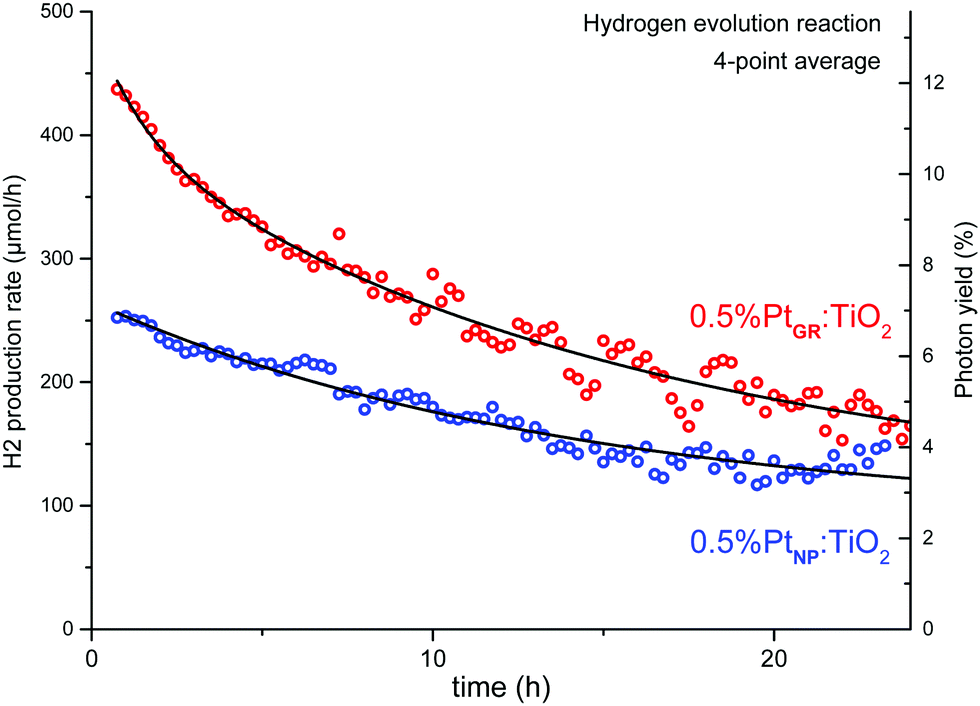 | ||
| Fig. 11 Photocatalytic hydrogen evolution reaction of SOMC-grafted and impregnated samples, with 10% methanol in water. | ||
Thus, the number of interfacial Pt–TiO2 sites at which conduction band electrons are transferred to surface Pt would be lowered, favouring electron–hole recombination, hence the decrease in H2 production rate and photon yield.
The HER experiment described above has been repeated for all Pt loadings, including the blank support. The obtained results are summarized in Fig. 12. For all samples, the same deactivation phenomenon is observed. For Pt loadings ranging from 0.5% to 5%, little variation is seen in the maximum yield. However, it falls sharply at 0.2% Pt. We therefore choose 0.5% Pt as the optimum loading for all the following experiments, as it makes the greatest use of the smallest amount of platinum.
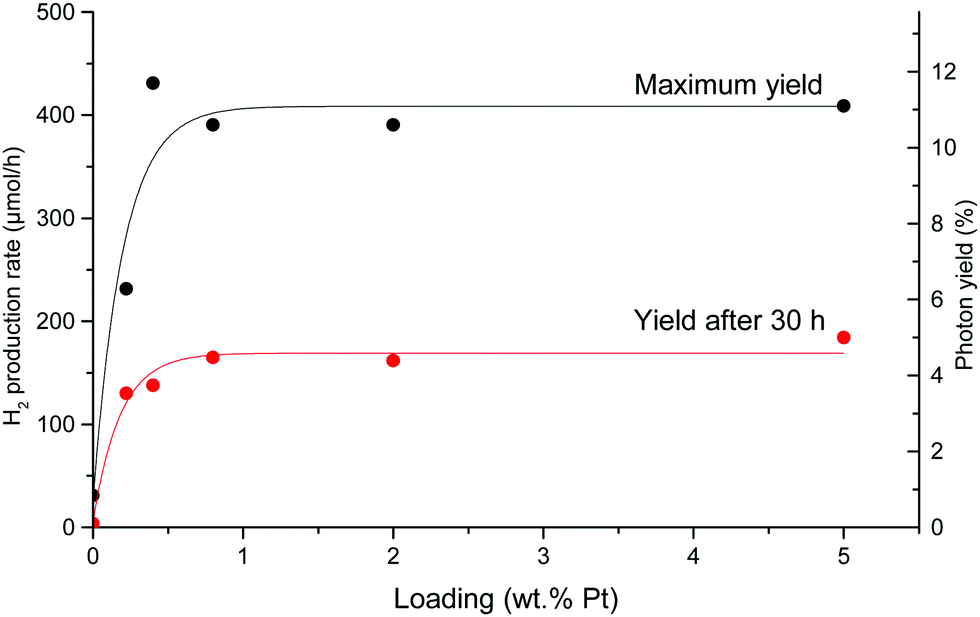 | ||
| Fig. 12 Photocatalytic HER rate and photonic yield (225–387 nm) as a function of Pt loading with 10% methanol in water before (black) and after (red) deactivation. | ||
Backwards reaction rates were measured on 0.5%PtGR:TiO2. Little to no backwards reaction appears to take place initially (Fig. 13a). The rate can then be seen to increase during the first four hours, indicating a form of activation taking place. The rate peaks at 46.5 μmol h−1, and then decreases as reagents are depleted in the system (p(H2) < 10 mbar, indicating 50% of the hydrogen has been consumed).
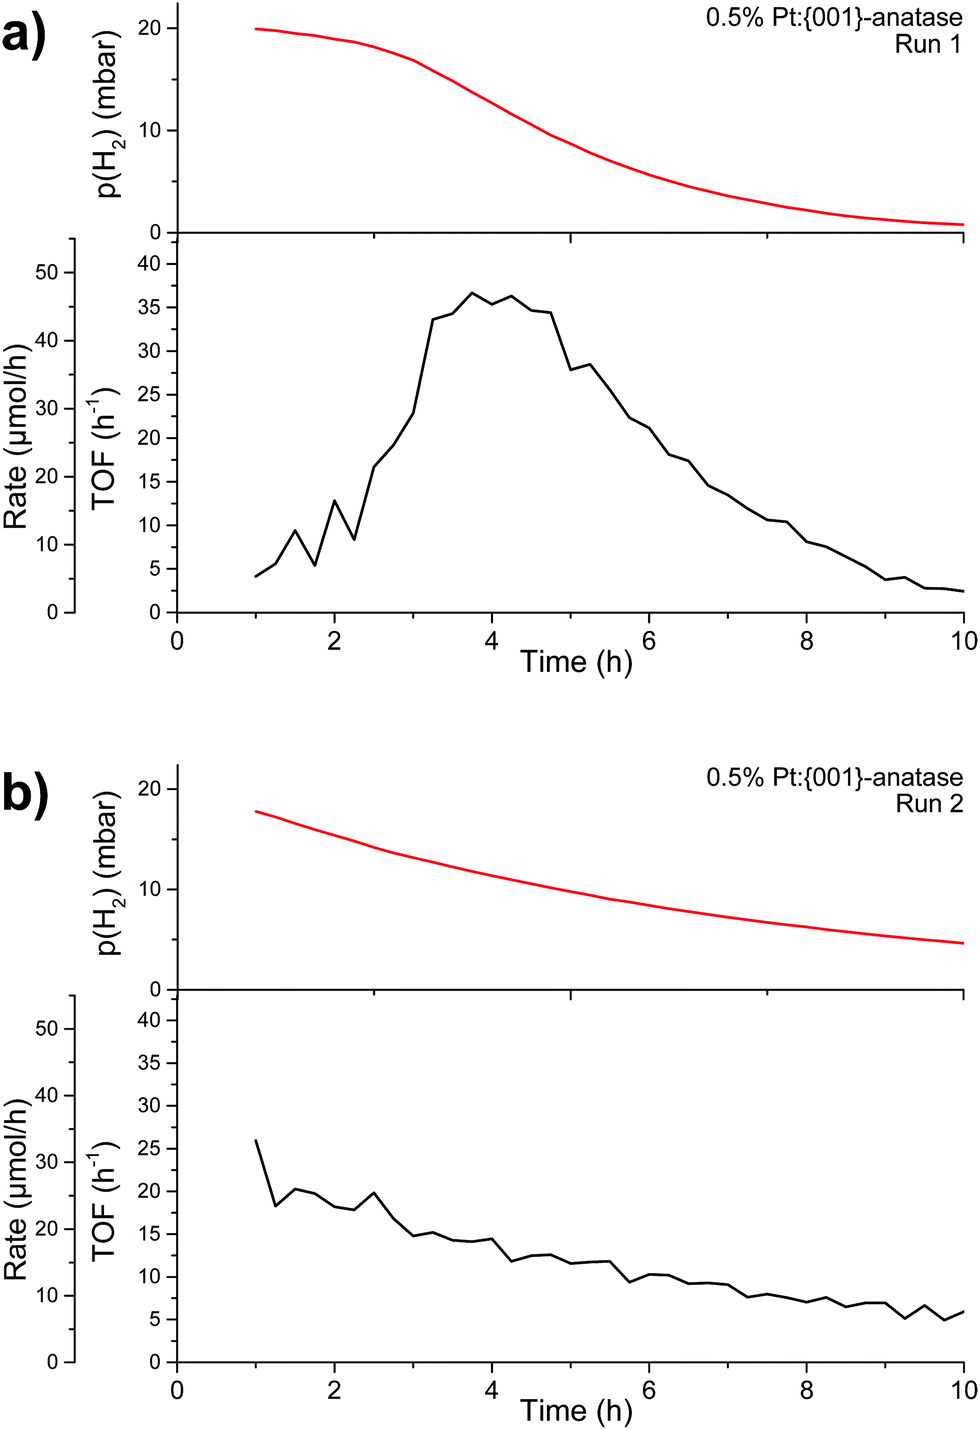 | ||
| Fig. 13 Backwards reaction measurement runs in a closed-loop reactor. (a) Backwards reaction with Pt single atoms on {001}-anatase; (b) backwards reaction re-using the material obtained at the end of run (a). First hour excluded due to gas mixing. | ||
When hydrogen and oxygen are re-introduced in the system at their original concentrations (Fig. 13b), the observed reaction rate appears to simply follow the concentrations of the reagents. The initial reaction rate, around 25 μmol h−1, is lower than the maximum reaction rate previously attained, indicating that some form of catalyst deactivation also took place. Backwards reaction rates have also been measured on the nanoparticle-covered, impregnated 0.5%PtNP:TiO2 (Fig. S14a, ESI†). The results show a strikingly similar behaviour to that shown in Fig. 13b. No measurable activity could be seen from the support alone (Fig. S14b, ESI†).
To understand the changes that occur on the catalyst during the backwards reaction, samples were collected at different times during the reaction, and HRSTEM micrographs were acquired. The obtained results are reported in Fig. 14. The Pt single atoms are thus seen to form Pt clusters within the first two hours of the reaction. At the 4 h mark, when the reaction rate is the highest, Pt clusters and nanoparticles can be seen. After 10 h of reaction, only large Pt nanoparticle agglomerates can be seen. This suggests the backwards reaction rate increases from single atoms, to clusters, and then to nanoparticles. This follows the trends reported in the literature for both the hydrogen oxidation reaction21 and oxygen reduction reaction.20,22 The subsequent decrease in activity after 10 h can be explained by the reduced availability of surface Pt atoms due to the agglomeration of nanoparticles.
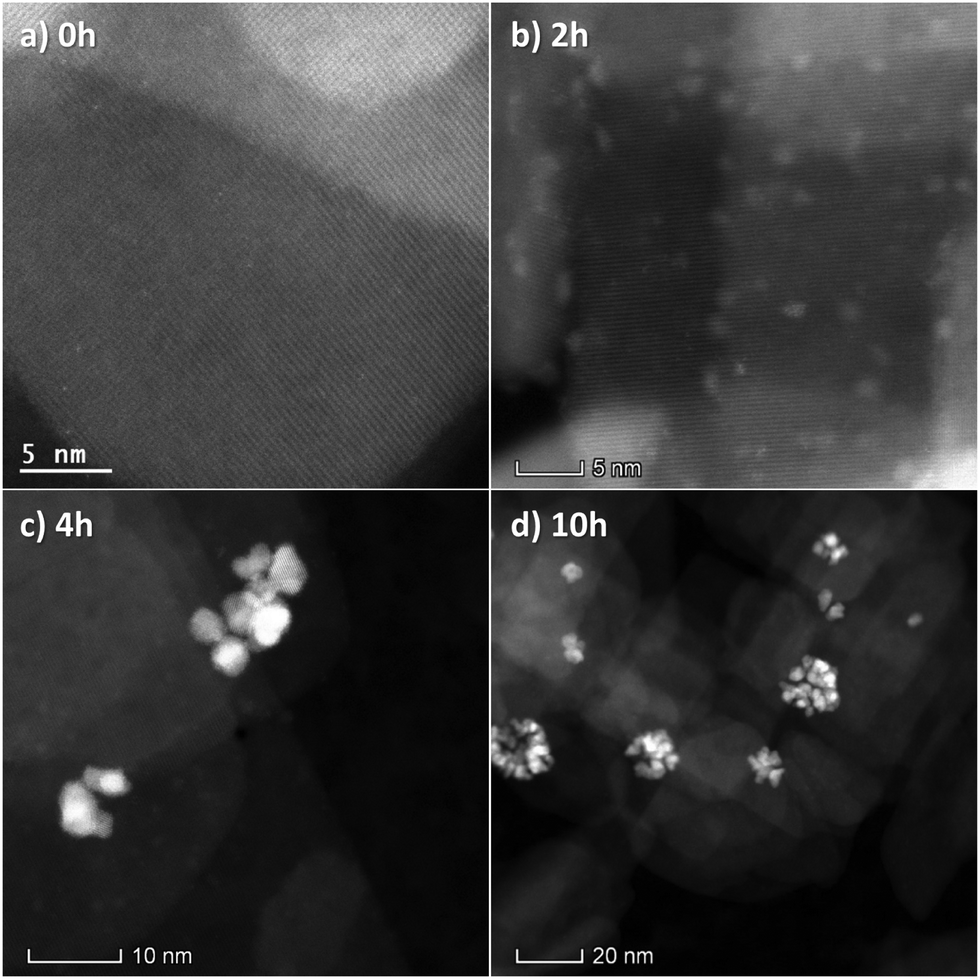 | ||
| Fig. 14 TEM micrographs of 0.5% Pt:{001}-anatase sampled at different times throughout the backwards reaction run. | ||
Conclusions
A Pt complex, (CH3)2Pt(COD), was successfully grafted by SOMC techniques on morphology-controlled anatase TiO2 with a fluorinated surface. 13C NMR showed the bipodal nature of the grafted species. DFT calculations suggest two stable configurations, depending on the relative arrangement of the surface hydroxyls on which grafting took place: a Ti–O–Pt(COD)–F–Ti-species, and a Ti–O–Pt(COD)–O–Ti species. Carbon monoxide adsorption on this material led to the conversion of the Pt single atoms into nanoparticles. A mechanism for this aggregation process was proposed. This suggests a potential limitation to the commonly used method of CO adsorption combined with FT-IR to characterize materials bearing Pt on their surface.With regards to photocatalytic hydrogen evolution, TiO2 decorated with highly dispersed Pt grafted by SOMC showed superior HER ability compared to Pt:TiO2 prepared by impregnation and reduction at identical loading. A much lower backwards reaction rate was also seen with Pt single atoms, demonstrating their clear superiority over Pt nanoparticles for photocatalytic overall water splitting if achieved. Unfortunately, such single atoms also proved to be quite unstable under illumination, coalescing into nanoparticles. Further work is therefore required to obtain stable platinum single atoms on materials active towards photocatalysis.
Abbreviations
| CB | Conduction band |
| COD | cis,cis-1,5-Cyclooctadiene |
| DFT | Density functional theory |
| DRIFTS | Diffuse reflectance infrared Fourier-transform spectroscopy |
| EXAFS | Extended X-ray absorption fine structure spectroscopy |
| FT-IR | Fourier-transform infra-red |
| GC | Gas chromatography |
| HAADF | High angle annular dark field |
| HERFD-XANES | High energy resolution fluorescence detected X-ray absorption near edge spectroscopy |
| HER | Hydrogen evolution reaction |
| HOR | Hydrogen oxidation reaction |
| HRSTEM | High resolution scanning transmission electron microscopy |
| NMR | Nuclear magnetic resonance |
| OER | Oxygen evolution reaction |
| ORR | Oxygen reduction reaction |
| SOMC | Surface organometallic chemistry |
| STEM | Scanning tunneling electron microscopy |
| TCD | Thermal conductivity detector |
| TEM | Transmission electron microscopy |
| VB | Valence band. |
Conflicts of interest
There are no conflicts to declare.Acknowledgements
This work was supported by the King Abdullah University of Science and Technology (KAUST). We warmly acknowledge the help of KAUST Core labs, and the Supercomputing Laboratory at KAUST for the CPU time attributed to this research work. The FAME-UHD project is financially supported by the French “large loan” EquipEx (EcoX, ANR-10-EQPX-27-01), the CEA-CNRS CRG consortium and the INSU CNRS institute.References
- A. Kudo and Y. Miseki, Chem. Soc. Rev., 2009, 38, 253–278 RSC.
- Y. Goto, T. Hisatomi, Q. Wang, T. Higashi, K. Ishikiriyama, T. Maeda, Y. Sakata, S. Okunaka, H. Tokudome, M. Katayama, S. Akiyama, H. Nishiyama, Y. Inoue, T. Takewaki, T. Setoyama, T. Minegishi, T. Takata, T. Yamada and K. Domen, Joule, 2018, 2, 509–520 CrossRef CAS.
- K. Maeda, T. Takata, M. Hara, N. Saito, Y. Inoue, H. Kobayashi and K. Domen, J. Am. Chem. Soc., 2005, 127, 8286–8287 CrossRef CAS PubMed.
- Z. Wang, Y. Inoue, T. Hisatomi, R. Ishikawa, Q. Wang, T. Takata, S. Chen, N. Shibata, Y. Ikuhara and K. Domen, Nat. Catal., 2018, 1, 756–763 CrossRef CAS.
- G. Zhang, Z.-A. Lan and X. Wang, Chem. Sci., 2017, 8, 5261–5274 RSC.
- G. Zhang, Z.-A. Lan, L. Lin, S. Lin and X. Wang, Chem. Sci., 2016, 7, 3062–3066 RSC.
- A. J. Nozik, Annu. Rev. Phys. Chem., 1978, 29, 189–222 CrossRef CAS.
- Y. Xu and M. A. Schoonen, Am. Mineral., 2000, 85, 543–556 CrossRef CAS.
- Y. Yamada and Y. Kanemitsu, Appl. Phys. Lett., 2012, 101, 133907 CrossRef.
- S. Dzwigaj, C. Arrouvel, M. Breysse, C. Geantet, S. Inoue, H. Toulhoat and P. Raybaud, J. Catal., 2005, 236, 245–250 CrossRef CAS.
- G. Jeantelot, S. Ould-Chikh, J. Sofack-Kreutzer, E. Abou-Hamad, D. H. Anjum, S. Lopatin, M. Harb, L. Cavallo and J.-M. Basset, Phys. Chem. Chem. Phys., 2018, 20, 14362–14373 RSC.
- Y.-F. Li, Z.-P. Liu, L. Liu and W. Gao, J. Am. Chem. Soc., 2010, 132, 13008–13015 CrossRef CAS PubMed.
- Y. H. Li, C. Peng, S. Yang, H. F. Wang and H. G. Yang, J. Catal., 2015, 330, 120–128 CrossRef CAS.
- S. A. Vilekar, I. Fishtik and R. Datta, J. Electrochem. Soc., 2010, 157, B1040–B1050 CrossRef CAS.
- S. Ma, S. Huang, Y. Fang and Z. Liu, ACS Catal., 2018, 8, 9711–9721 CrossRef CAS.
- Y. Lu, W. Yin, K. Peng, K. Wang, Q. Hu, A. Selloni, F. Chen, L. Liu and M. Sui, Nat. Commun., 2018, 9, 2752 CrossRef PubMed.
- S.-Y. Murakami, H. Kominami, Y. Kera, S. Ikeda, H. Noguchi, K. Uosaki and B. Ohtani, Res. Chem. Intermed., 2007, 33, 285–296 CrossRef CAS.
- A. Meng, L. Zhang, B. Cheng and J. Yu, Adv. Mater., 2019, 31, 1807660 CrossRef PubMed.
- A. Furube, T. Asahi, H. Masuhara, H. Yamashita and M. Anpo, Chem. Phys. Lett., 2001, 336, 424–430 CrossRef CAS.
- M. Peuckert, T. Yoneda, R. A. D. Betta and M. Boudart, J. Electrochem. Soc., 1986, 133, 944–947 CrossRef CAS.
- Y. Sun, Y. Dai, Y. Liu and S. Chen, Phys. Chem. Chem. Phys., 2012, 14, 2278–2285 RSC.
- K. Kinoshita, J. Electrochem. Soc., 1990, 137, 845 CrossRef CAS.
- Y. Hang, Li, J. Xing, Z. Jia Chen, Z. Li, F. Tian, L. Rong Zheng, H. Feng Wang, P. Hu, H. Jun Zhao and H. Gui Yang, Nat. Commun., 2013, 4, 2500 CrossRef PubMed.
- C. Dessal, L. Martínez, C. Maheu, T. Len, F. Morfin, J. L. Rousset, E. Puzenat, P. Afanasiev, M. Aouine, L. Soler, J. Llorca and L. Piccolo, J. Catal., 2019, 375, 155–163 CrossRef CAS.
- G. L. Chiarello, D. Ferri and E. Selli, Appl. Surf. Sci., 2018, 450, 146–154 CrossRef CAS.
- C. Wang, H. Fan, X. Ren, Y. Wen and W. Wang, Appl. Surf. Sci., 2018, 462, 423–431 CrossRef CAS.
- Y. T. Kim, T. Uruga and T. Mitani, Adv. Mater., 2006, 18, 2634–2638 CrossRef CAS.
- S. Sun, G. Zhang, N. Gauquelin, N. Chen, J. Zhou, S. Yang, W. Chen, X. Meng, D. Geng, M. N. Banis, R. Li, S. Ye, S. Knights, G. A. Botton, T.-K. Sham and X. Sun, Sci. Rep., 2013, 3, 1775 CrossRef.
- X. Zeng, J. Shui, X. Liu, Q. Liu, Y. Li, J. Shang, L. Zheng and R. Yu, Adv. Energy Mater., 2018, 8, 1701345 CrossRef.
- N. Cheng, S. Stambula, D. Wang, M. N. Banis, J. Liu, A. Riese, B. Xiao, R. Li, T. Sham, L. Liu, G. A. Botton and X. Sun, Nat. Commun., 2016, 7, 13638 CrossRef CAS PubMed.
- J. Liu, M. Jiao, L. Lu, H. M. Barkholtz, Y. Li, Y. Wang, L. Jiang, Z. Wu, D. Liu, L. Zhuang, C. Ma, J. Zeng, B. Zhang, D. Su, P. Song, W. Xing, W. Xu, Y. Wang, Z. Jiang and G. Sun, Nat. Commun., 2017, 8, 15938 CrossRef CAS PubMed.
- J. Kim, C.-W. Roh, S. K. Sahoo, S. Yang, J. Bae, J. W. Han and H. Lee, Adv. Energy Mater., 2018, 8, 1701476 CrossRef.
- Y. Chen, J. Lin, L. Li, B. Qiao, J. Liu, Y. Su and X. Wang, ACS Catal., 2018, 8, 859–868 CrossRef CAS.
- B. Qiao, A. Wang, X. Yang, L. F. Allard, Z. Jiang, Y. Cui, J. Liu, J. Li and T. Zhang, Nat. Chem., 2011, 3, 634–641 CrossRef CAS PubMed.
- J. Jones, H. Xiong, A. T. DeLaRiva, E. J. Peterson, H. Pham, S. R. Challa, G. Qi, S. Oh, M. H. Wiebenga, X. I. Pereira Hernandez, Y. Wang and A. K. Datye, Science, 2016, 353, 150–154 CrossRef CAS PubMed.
- K. Ding, A. Gulec, A. M. Johnson, N. M. Schweitzer, G. D. Stucky, L. D. Marks and P. C. Stair, Science, 2015, 350, 189–192 CrossRef CAS PubMed.
- L. DeRita, J. Resasco, S. Dai, A. Boubnov, H. V. Thang, A. S. Hoffman, I. Ro, G. W. Graham, S. R. Bare, G. Pacchioni, X. Pan and P. Christopher, Nat. Mater., 2019, 18, 746–751 CrossRef CAS PubMed.
- T.-Y. Chang, Y. Tanaka, R. Ishikawa, K. Toyoura, K. Matsunaga, Y. Ikuhara and N. Shibata, Nano Lett., 2014, 14, 134–138 CrossRef CAS PubMed.
- J. D. A. Pelletier and J.-M. Basset, Acc. Chem. Res., 2016, 49, 664–677 CrossRef CAS.
- J. Basset, F. Lefebvre and C. Santini, Coord. Chem. Rev., 1998, 178–180, 1703–1723 CrossRef CAS.
- M. Qureshi, A. T. Garcia-Esparza, G. Jeantelot, S. Ould-Chikh, A. Aguilar-Tapia, J.-L. Hazemann, J.-M. Basset, D. Loffreda, T. Le Bahers and K. Takanabe, J. Catal., 2019, 376, 180–190 CrossRef CAS.
- X. Han, Q. Kuang, M. Jin, Z. Xie and L. Zheng, J. Am. Chem. Soc., 2009, 131, 3152–3153 CrossRef CAS PubMed.
- P. Laurent, L. Veyre, C. Thieuleux, S. Donet and C. Copéret, Dalton Trans., 2013, 42, 238–248 RSC.
- N. Legagneux, E. Jeanneau, A. Thomas, M. Taoufik, A. Baudouin, A. de Mallmann, J.-M. Basset and F. Lefebvre, Organometallics, 2011, 30, 1783–1793 CrossRef CAS.
- M. L. M. Bonati, T. M. Douglas, S. Gaemers and N. Guo, Organometallics, 2012, 31, 5243–5251 CrossRef CAS.
- B. Ravel and M. Newville, J. Synchrotron Radiat., 2005, 12, 537–541 CrossRef CAS PubMed.
- M. Muñoz, P. Argoul and F. Farges, Am. Mineral., 2003, 88, 694–700 CrossRef.
- P. E. Blochl, Phys. Rev. B: Condens. Matter Mater. Phys., 1993, 50, 17953–17979 CrossRef PubMed.
- G. Kresse and J. Hafner, Phys. Rev. B: Condens. Matter Mater. Phys., 1994, 49, 14251–14269 CrossRef CAS PubMed.
- G. Kresse and J. Furthmüller, Comput. Mater. Sci., 1996, 6, 15–50 CrossRef CAS.
- G. Kresse and J. Furthmüller, Phys. Rev. B: Condens. Matter Mater. Phys., 1996, 54, 11169–11186 CrossRef CAS PubMed.
- G. Kresse, Phys. Rev. B: Condens. Matter Mater. Phys., 1999, 59, 1758–1775 CrossRef CAS.
- J. P. Perdew, K. Burke and M. Ernzerhof, Phys. Rev. Lett., 1996, 77, 3865–3868 CrossRef CAS PubMed.
- H. J. Monkhorst and J. D. Pack, Phys. Rev. B: Condens. Matter Mater. Phys., 1976, 13, 5188–5192 CrossRef.
- J. A. Baldwin, I. S. Butler and D. F. R. Gilson, Inorg. Chim. Acta, 2006, 359, 3079–3083 CrossRef CAS.
- F. Wen and H. Bönnemann, Appl. Organomet. Chem., 2005, 19, 94–97 CrossRef CAS.
- M. Enders, B. Görling, A. B. Braun, J. E. Seltenreich, L. F. Reichenbach, K. Rissanen, M. Nieger, B. Luy, U. Schepers and S. Bräse, Organometallics, 2014, 33, 4027–4034 CrossRef CAS.
- M. Brown, R. E. Peierls and E. A. Stern, Phys. Rev. B: Condens. Matter Mater. Phys., 1977, 15, 738–744 CrossRef CAS.
- A. N. Mansour, J. W. Cook and D. E. Sayers, J. Phys. Chem., 1984, 88, 2330–2334 CrossRef CAS.
- F. Lytle, J. Catal., 1976, 43, 376–379 CrossRef CAS.
- F. W. Lytle, P. S. P. Wei, R. B. Greegor, G. H. Via and J. H. Sinfelt, J. Chem. Phys., 1979, 70, 4849–4855 CrossRef CAS.
- B. K. Teo and P. A. Lee, J. Am. Chem. Soc., 1979, 101, 2815–2832 CrossRef CAS.
- P. A. O’Day, J. J. Rehr, S. I. Zabinsky and G. E. J. Brown, J. Am. Chem. Soc., 1994, 116, 2938–2949 CrossRef.
- S. Shen, X. Wang, Q. Ding, S. Jin, Z. Feng and C. Li, Chin. J. Catal., 2014, 35, 1900–1906 CrossRef CAS.
- K. I. Hadjiivanov, J. Chem. Soc., Faraday Trans., 1998, 94, 1901–1904 RSC.
- M. J. Kale and P. Christopher, ACS Catal., 2016, 6, 5599–5609 CrossRef CAS.
- M. J. Lundwall, S. M. Mcclure and D. W. Goodman, J. Phys. Chem. C, 2010, 114, 7904–7912 CrossRef CAS.
- M. Setvin, M. Buchholz, W. Hou, C. Zhang, B. Stöger, J. Hulva, T. Simschitz, X. Shi, J. Pavelec, G. S. Parkinson, M. Xu, Y. Wang, M. Schmid, C. Wöll, A. Selloni and U. Diebold, J. Phys. Chem. C, 2015, 119, 21044–21052 CrossRef CAS.
- K. Balakrishnan, A. Sachdev and J. Schwank, J. Catal., 1990, 121, 441–455 CrossRef CAS.
- J. A. Anderson and C. H. Rochester, Catal. Today, 1991, 10, 275–282 CrossRef CAS.
- H. Heyne and F. C. Tompkins, Trans. Faraday Soc., 1967, 63, 1274–1285 RSC.
- S. K. Cheah, V. P. Bernardet, A. A. Franco, O. Lemaire and P. Gelin, J. Phys. Chem. C, 2013, 117, 22756–22767 CrossRef CAS.
- A. S. Hoffman, D. Sokaras, S. Zhang, L. M. Debefve, C. Fang, A. Gallo, T. Kroll, D. A. Dixon, S. R. Bare and B. C. Gates, Chem. – Eur. J., 2017, 23, 14760–14768 CrossRef CAS PubMed.
- L. Manceron, B. Tremblay and M. E. Alikhani, J. Phys. Chem. A, 2000, 104, 3750–3758 CrossRef CAS.
- B. Liang, M. Zhou and L. Andrews, J. Phys. Chem. A, 2000, 104, 3905–3914 CrossRef CAS.
- G. L. Chiarello, D. Ferri and E. Selli, J. Catal., 2011, 280, 168–177 CrossRef CAS.
- J. Nie, A. O. T. Patrocinio, S. Hamid, F. Sieland, J. Sann, S. Xia, D. W. Bahnemann and J. Schneider, Phys. Chem. Chem. Phys., 2018, 20, 5264–5273 RSC.
- K. Maeda and K. Domen, J. Phys. Chem. Lett., 2010, 1, 2655–2661 CrossRef CAS.
- T. Hisatomi, K. Takanabe and K. Domen, Catal. Lett., 2015, 145, 95–108 CrossRef CAS.
- N. E. Fernandes, Y. K. Park and D. G. Vlachos, Combust. Flame, 1999, 118, 164–178 CrossRef CAS.
Footnote |
| † Electronic supplementary information (ESI) available: Experimental setups, NMR, TEM micrographs and DFT-optimized structures. See DOI: 10.1039/c9cp04470a |
| This journal is © the Owner Societies 2019 |