 Open Access Article
Creative Commons Attribution 3.0 Unported Licence
Photoexcited triplet states of twisted acenes investigated by Electron Paramagnetic Resonance†
Claudia E.
Tait
 *a,
Anjan
Bedi
 b,
Ori
Gidron
 b and
Jan
Behrends
 *a
*a
aDepartment of Physics, Freie Universität Berlin, Arnimallee 14, 14195 Berlin, Germany. E-mail: claudia.tait@fu-berlin.de; j.behrends@fu-berlin.de
bInstitute of Chemistry, The Hebrew University of Jerusalem, Edmond J. Safra Campus, Jerusalem 91904, Israel
First published on 20th September 2019
Abstract
Twisting of the acene backbone out of planarity in twisted acenes leads to a variation in their optical and electronic properties. The effect of increasing twist angles on the properties of the photoexcited triplet states of a series of anthracene-based helically tethered twisted acenes is investigated here by Electron Paramagnetic Resonance (EPR) spectroscopy. Increasing signal intensities with increasing twist angles indicate increased intersystem crossing efficiencies for the twisted molecules compared to the untethered reference compound. Variations in the electron spin polarisation observed in the transient EPR spectra, in particular for the compound with the shortest tether, imply changes in the sublevel population kinetics depending on molecular geometry. Changes in the zero-field splitting parameters and in the proton hyperfine couplings for compounds with short tethers and therefore higher twist angles point towards a slight redistribution of the spin density compared to the parent compound. The experimental results can be explained by considering both an increase in twist angle and a related decrease in the dihedral angle between the phenyl side groups and the acene core. The observation of a clear excitation-wavelength dependence suggests preferential excitation of different molecular conformations, with conformers characterised by higher twist angles selected at higher wavelengths.
1 Introduction
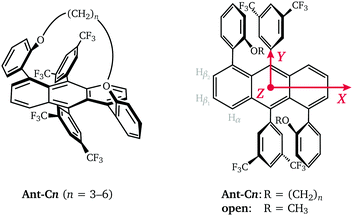
Acenes are the fundamental building blocks of a wide variety of compounds investigated for use in organic electronic devices. Anthracene, tetracene and pentacene-based molecules are studied as singlet fission material in solar cells, active material in organic light emitting diodes or as organic semiconductors in organic field effect transistors.1,2 The optical, electronic and magnetic properties of these molecules, as well as their solubility and molecular packing motifs, can be easily tuned by chemical modification and therefore adapted to specific applications. In addition to increased annulation and introduction of different types of side groups, a significant research effort has also been focused on the synthesis of twisted acenes or twistacenes,3,4 where steric crowding due to the introduction of specific types of side or end groups forces the acene core to assume a helically twisted conformation. The increased stability and solubility of twisted acenes compared to their planar parent compounds provides access to the larger linear acenes, which due to their decreased HOMO–LUMO gap are promising as functional materials in semiconducting devices, but are synthetically extremely challenging in their planar form.2 The twisting of the aromatic π-system leads to changes in the optical and electronic properties compared to those of the planar parent compound and also introduces new chiroptical properties relevant for applications in non-linear optics.5,6 The introduction of different twist angles therefore provides an additional opportunity for tuning of the electronic properties of acene-based functional materials.Recently, a series of helically-locked tethered twistacenes based on an anthracene core was introduced,7 in which the twist angle is determined by the length of the diagonal n-alkyl bridge (Fig. 1). The introduction of the tether allowed modification of the twist angle with a constant substitution pattern at the acene core and was designed to minimise the substituent effect and isolate the effect of the twist angle on the electronic properties. The crystal structures of compounds with propyl- to hexyl-tethers linked at the 1,5-positions showed twist angles of 23°, 30°, 32° and 38°, respectively.7 Optical studies revealed a bathochromic shift of the β- and p-bands characteristic for curved aromatic systems,8,9 as well as a relative increase in oscillator strength for the vibronically allowed p-band attributed to the decrease in planarity at higher twist angles.7,10 An observed decrease in fluorescence quantum efficiency for increasing torsion angles was postulated to be related to the increased importance of non-radiative decay processes and an increase in the Intersystem Crossing (ISC) rate.11,12
In this study, we investigate the influence of the twist angle on the properties of the photoexcited triplet state by Electron Paramagnetic Resonance (EPR) spectroscopy. Transient EPR measurements on the twisted acenes with propyl- to hexyl-linkers (Ant-Cn, n = 3–6) are compared to measurements on an open reference compound (open), where the linker is replaced by two methyl groups (see Fig. 1), to estimate relative changes in triplet yield. Transient EPR triplet state spectra additionally contain information on the zero-field splitting interaction and the ISC mechanism.13 In order to gain a more precise understanding of the influence of twisting of the acene core on the spin density distribution, proton hyperfine couplings are measured by Electron-Nuclear DOuble Resonance (ENDOR). In addition to the dependence of triplet state properties on the type of compound, the excitation wavelength dependence is also investigated.
2 Experimental
2.1 Sample preparation
The helically-locked twistacenes Ant-Cn with varying lengths of the alkyl linker (n = 3–6) were synthesized as described previously.7 Solutions at a concentration of 500 μM in toluene were prepared and transferred into 3.9 mm OD, 3.0 mm ID quartz tubes. The solutions were deoxygenated in multiple freeze–pump–thaw cycles and the EPR tubes were flame-sealed. For UV-vis measurements, the solutions were diluted to 50 μM (see Section S1 in the ESI† for details). The samples were flash-frozen in liquid nitrogen prior to the EPR measurements.2.2 EPR measurements
Time-resolved EPR measurements were performed at X-band on a Bruker ElexSys 580 spectrometer using a critically coupled ER 4118X-MD5 resonator and direct detection with the transient recorder. Pulse EPR and ENDOR measurements were performed with an EN 4118X-MD4 resonator. The temperature was controlled using a helium gas-flow cryostat and an ITC temperature controller from Oxford Instruments.Light excitation at different wavelengths was achieved with an Opta OPO (Model 355 I, 410–700 nm) pumped by a Spectra-Physics QuantaRay LabSeries 150 Nd:YAG laser with a 10 Hz repetition rate. The laser light was depolarised with an achromatic depolariser.
Time-resolved EPR measurements were performed at 80 K with a microwave power of 0.20 mW. The transient signal was recorded over a time period of 15 μs with a time step of 4 ns. The background signal was removed by a 2D baseline-correction based on the off-resonance transients and the signal acquired before the laser pulse. The spectra were integrated from 0.2 μs to 0.7 μs after the laser pulse unless otherwise specified.
The pulse EPR measurements were performed at 20 K. Echo-detected field-swept spectra were recorded with the Hahn echo sequence with tπ/2 = 20 ns, tπ = 40 ns and τ = 200 ns and a two-step phase cycle.
Davies ENDOR measurements were performed with the pulse sequence π–T–π/2–τ–π–τ–echo. A radiofrequency pulse with a length of 9 μs was applied during the time delay T; the length was adjusted based on the results of Rabi nutation experiments. The microwave pulse lengths were tπ/2 = 64 ns, tπ = 128 ns and the detection pulse delay was set to τ = 450 ns. Additional Mims ENDOR measurements were performed in the small-coupling region (ν1H ± 3 MHz) with the pulse sequence π/2–τ–π/2–T–π/2–τ–echo with tπ/2 = 16 ns, τ = 160 ns and a 9 μs radiofrequency pulse applied during the delay T. The displayed spectra show the combined results of the Davies and Mims ENDOR measurements.
2.3 Quantum chemical calculations and spectral simulations
The spin density distributions and magnetic parameters for the triplet states of the twisted acenes and the open reference compound were calculated using the ORCA 4.0 program suite.14,15 The calculations were performed on ground-state optimised geometries based on the crystal structures.7 Single-point calculations were performed using the PBE0 functional with the atom-pairwise dispersion correction using the Becke–Johnson damping scheme16,17 and the EPRII basis set.18Simulations of the transient EPR spectra were performed using the EasySpin toolbox19 in Matlab. The modelling of the ENDOR spectra is described in Section S5 in the ESI.†
3 Results and discussion
3.1 Time-resolved EPR
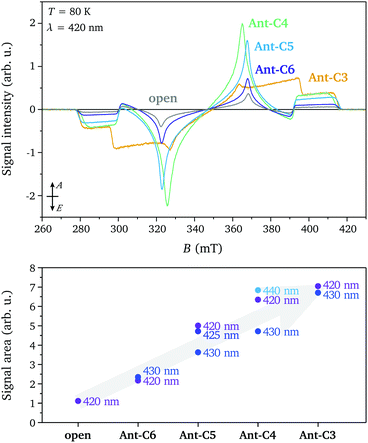
The transient EPR spectra measured at short times after laser excitation in the p-band region (420 nm) for the twisted compounds Ant-Cn (n = 3–6) and for the open reference compound are compared in Fig. 2. Spin polarised triplet state spectra with lifetimes of several microseconds are detected in all cases and the spin polarisation and spectral shape is conserved during signal decay. The experimental spectra were normalised by concentration (determined from UV-vis measurements) and average laser power to allow a comparison of the signal intensities. The similarity of the spectral shapes for the open compound and the twisted compounds Ant-C6 to Ant-C4 allow a direct comparison of the signal amplitudes and clearly show a progressive increase in intensity for compounds with shorter tethers. The increased triplet signal intensity with twist angle is confirmed by comparison of the absolute signal areas for spectra recorded for the different compounds and different excitation wavelengths. A quantitative interpretation of transient EPR data is complicated by the difficulty of controlled optical excitation of the frozen solution sample inside the resonator, challenging determination of the extinction coefficient under EPR measurement conditions and time-dependence of the electron spin polarisation. Nevertheless, the data demonstrates a clear trend towards increased triplet yield for the tethered compounds with shorter linkers, confirming the predicted increase in ISC rates.The lowest triplet state in anthracene and its derivatives is typically not populated by direct intersystem crossing from the first excited singlet state due to the large energy difference between the two states.10,20 Instead, ISC between the first excited singlet state S1 and the second or a higher excited triplet state is followed by internal conversion (IC) to the lowest triplet state T1.21–23 If internal conversion occurs on a fast time-scale compared to the decay to Boltzmann equilibrium, the original spin polarisation is maintained due to conservation of spin angular momentum. The ISC rate strongly depends on the energy difference between the singlet excited state and the initially populated triplet state, which is very sensitive to the substitution pattern around the anthracene core.10 In general, increased deviations from planarity tend to favour ISC due to increased σπ-contributions to the involved states,10,24 explaining the observed increase in triplet yield as the anthracene core becomes progressively more twisted. Further insight into the ISC mechanism can be gained from the selective population of the different triplet state sublevels leading to the observed spin polarisation of the EPR spectra.
The spectral shapes of the triplet state spectra for the different compounds excited at different wavelengths are compared on the left in Fig. 3. The EPR spectral shapes are conserved up to about 1 μs after the laser pulse, while at longer times a broadening of the main features is observed. However, the spin polarisations as well as the differences in ZFS parameters observed for different excitation wavelengths are maintained throughout the timescale of the measurement (ca. 15 μs) (see Fig. S4 in the ESI†). The ZFS parameters and relative sublevel populations extracted by simulation of the EPR spectra at short times after the laser flash are compared on the right in Fig. 3. The simulations were performed assuming a positive ZFS D parameter, as known from literature and confirmed by the proton ENDOR experiments (vide infra), and, following convention,25 a negative E value. The ZFS tensor axis Z thus corresponds to the out-of-plane axis and the X and Y axes to the long and short in-plane axes of the anthracene core, respectively. The orientation of the ZFS tensor in the molecular frame is depicted in Fig. 1.
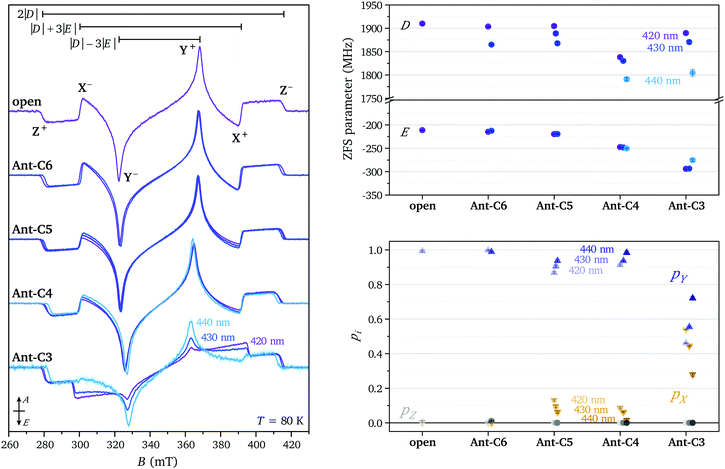 | ||
| Fig. 3 (left) Transient EPR spectra of Ant-Cn (n = 3–6) and the open reference compound recorded at 80 K after excitation at different wavelengths (420 nm = purple, 425–430 nm = blue, 440 nm = cyan). The spectra are normalised by signal area. (right, top) ZFS parameters D and E and (right, bottom) relative triplet sublevel populations extracted from simulations of the experimental data (see Table S1 in the ESI†). | ||
Based on literature data, ISC in the photoexcited triplet state of the anthracene parent compound leads to almost equal population of the two in-plane triplet sublevels, X and Y, corresponding to an EEEAAA spin polarisation.26 In organic molecules, ISC is typically induced by vibronic spin–orbit interactions rather than direct spin–orbit coupling.24,27 Non-zero spin–orbit coupling matrix elements arise from mixing of the ππ* S1 and T1 states with close-lying states with σπ character induced by molecular vibrations.27–29 Simple symmetry arguments explain the prevalence of ISC to the in-plane triplet sublevels in planar organic molecules. Which one of the two in-plane sublevels dominates has been suggested to depend on the energies and symmetries of the σπ levels available for mixing and therefore to be extremely dependent on the substitution pattern around the acene core.29
The strong dominance of the Y sublevel in the ISC process for the molecules investigated here could potentially be related to mixing of states involved in ISC with states characterised by a certain charge-transfer character between the anthracene core and the phenyl side groups. A perpendicular arrangement between donor and acceptor π-systems was found to maximise spin–orbit charge-transfer (SOCT) intersystem crossing and the spin polarisation of the resulting triplet states was shown to be strongly dependent on the dihedral angle.30,31 In Ant-C3, the short linker, in addition to inducing a strong twist of the anthracene core, also leads to a decrease in the dihedral angle between the phenyl side groups and the anthracene core (see Fig. S2 in the ESI†).6,7 This change in geometry could be the cause for the change in spin polarisation observed for this compound.
In the framework of the point-dipole approximation, the spin–spin contribution to the ZFS D and E parameters can be expressed as
 | (1) |
The ZFS parameters reported for the excited triplet state of anthracene are D = 2145 MHz and E = 253 MHz.26 The smaller D values observed for the compounds investigated here suggest an increased average inter-spin distance of the unpaired electrons, likely due to partial delocalisation of the triplet state wavefunction onto the side groups. As the twist angle of the anthracene core increases, the dihedral angle between the phenyl rings and the core decreases, facilitating delocalisation of the triplet spin density onto the side groups and explaining the decrease in D. The relatively large variation in D as a function of wavelength suggests selective excitation of different molecular conformations, characterised by different twist angles and different dihedral angles between the anthracene core and the phenyl rings.
The E parameter is typically associated with the rhombicity of the ZFS tensor. The trends in E observed for the investigated series of molecules is most easily understood in the context of the corresponding trend along the series of linear acenes. For the triplet states of the planar acene series from naphthalene to pentacene, the D values decrease as expected for the increase in the extent of the conjugated π-system (D = 2980 MHz,32 2145 MHz, 1718 MHz,29 1379 MHz33 for naphthalene, anthracene, tetracene and pentacene, respectively). The corresponding E values also decrease in magnitude (E = −462 MHz, −253 MHz, −129 MHz, −51 MHz). This decrease in E has been rationalised by Bräuchle et al. by considering the limiting value for the magnitude of the E parameter for an x-coordinate, corresponding to the long in-plane axis of the molecule, significantly exceeding both the second in-plane coordinate (y) and the out-of-plane coordinate (z):  .34 It has been argued that as the size of the molecules increases in the x-direction, E tends to this limiting expression and progressively decreases in magnitude. For the series of twisted anthracenes, a similar reasoning would suggest an increasing importance of the y coordinate compared to the x coordinate as the anthracene core progressively twists out of planarity and bends the phenyl side groups.
3.2 ENDOR measurements
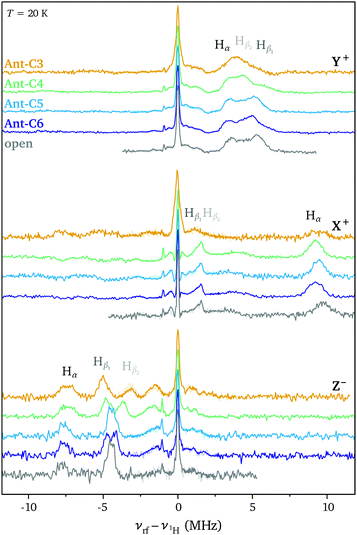
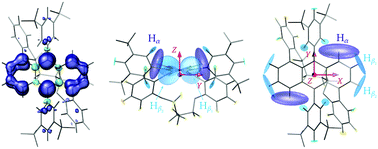
ENDOR measurements were performed in order to obtain a more detailed picture on the changes in spin density distribution as a function of twist angle and to determine whether twisting of the anthracene core limits delocalisation of the triplet state wavefunction. The ENDOR spectra recorded at the three high-field canonical positions for the open reference compound and Ant-Cn (n = 3–6) are compared in Fig. 4. The ENDOR spectra are characterised by a peak at the proton Larmor frequency arising from the nuclear transitions in the mS = 0 manifold and by additional peaks corresponding to the nuclear transitions in the mS = +1 manifold for the Y+ and X+ canonical positions and in the mS = −1 manifold for the Z− canonical position. The largest hyperfine couplings are expected for the protons on the anthracene core, the Hα and Hβ protons (see Fig. 5). Based on the position of the hyperfine peaks corresponding to the largest couplings with respect to the Larmor frequency and assuming a positive sign for the ZFS D parameter, the sign of all of the larger hyperfine couplings can be identified as negative, as expected for protons directly bound to an aromatic carbon atom. In addition to the proton ENDOR peaks, the fluorine Larmor peak can be clearly identified about 1 MHz below the proton Larmor frequency. However, comparison of ENDOR measurements performed at the low and high field canonical positions did not allow assignment of any peaks in the small hyperfine coupling region to hyperfine couplings of the fluorine nuclei in the CF3 groups on the phenyl ring attached at the 9,10-positions (see Fig. S6 in the ESI†).For an assignment of the different ENDOR peaks observed for the twisted compounds to the α and two types of β protons, the experimental results were compared to literature values for the proton hyperfine couplings in anthracene. The hyperfine couplings of the photoexcited triplet state were investigated independently by two groups: Clarke and Hutchison performed ENDOR measurements on anthracene in a phenazine single crystal26 and Yu et al. used ESEEM (Electron Spin Echo Envelope Modulation) spectroscopy to determine the proton hyperfine couplings for anthracene in p-terphenyl crystals.35 The largest hyperfine couplings in Ant-Cn are expected to be due to the α protons with the largest contribution along the long in-plane axis, X, a similarly large contribution along the out-of-plane orientation, Z, and a much smaller contribution along the short in-plane axis Y (see Fig. 5). The experimental hyperfine coupling values of about −9.6 MHz along the ZFS X axis and of −7.7 MHz along the out-of-plane Z axis observed for the twisted compounds are relatively close to the literature values of −10.512 MHz/−10.22 MHz and −8.643 MHz/−8.69 MHz determined for the anthracene triplet based on the ENDOR26 and ESEEM35 studies, respectively (see Fig. S8 in the ESI† for a direct comparison). The literature values of −3.25 MHz/−4.29 MHz for the ZFS Y orientation suggest assignment of the lowest frequency component of the broad ENDOR peak observed at the Y+ field position to Hα. The slight reduction in Hα hyperfine couplings for Ant-Cn compared to the planar parent compound would be in agreement with a partial redistribution of the spin density from the anthracene core to the phenyl side groups, which also explains the decrease in D.
In the anthracene triplet state, the two types of β protons are almost equivalent, with out-of-plane hyperfine couplings of −4.689 MHz26/−4.65 MHz35 and in-plane couplings of 1.34 MHz along X and −5.14 MHz along Y that could only be determined in the ESEEM study.35 The peak at −4.4 MHz in the ENDOR spectrum of the open reference compound recorded at the Z− field position can therefore be assigned to the β protons, which also appear to be essentially equivalent here. However, as the twist angle increases in the Ant-Cn series, the single peak splits into two, one with a slightly larger hyperfine coupling and one with a smaller coupling.
Even though additional peaks in the small hyperfine coupling region are present, the achievable resolution is insufficient for an unequivocal assignment to the different types of protons on the side groups and linker.
The strong similarity between the ENDOR spectra recorded for the different twisted acenes and with the literature values for anthracene suggests that the increased twisting of the anthracene core does not significantly affect the triplet state spin density distribution, which remains close to that observed for the planar parent compound (Fig. 5). Some small changes in the ENDOR spectra are however observed: in the out-of-plane orientation, the Hα coupling decreases slightly along the Ant-Cn series from n = 6 to n = 3 and the peak assigned to the Hβ protons splits into two different contribution. For the ZFS orientation corresponding to the short in-plane axis (Y), changes in the region of the spectrum assigned to the β protons are observed with a trend towards smaller couplings with increasing twist angle. No clear trend of changes in the hyperfine couplings along the long in-plane axis X could be identified, the differences in the position of the hyperfine peak at about 9.6 MHz between the different samples are likely due to different offsets from the canonical X field position in the selection of the field value for the ENDOR measurements.
The orientation selectivity of the ENDOR experiment for the broad triplet state EPR signal is advantageous for characterisation of the different hyperfine coupling tensors and their relative orientation with respect to the zero-field splitting tensor.13 As in ENDOR experiments performed at the canonical field positions the strength of the hyperfine coupling is probed along the ZFS tensor axes, two separate effects can account for changes in the ENDOR spectra observed for this series of molecules with varying geometries. The first is a purely geometrical effect: as the anthracene core twists out of planarity, the relative orientation of the principal axes of the ZFS tensor and the hyperfine tensor changes. For example, the hyperfine coupling probed along the Z orientation changes from the principal component Azz of the hyperfine interaction tensor in the planar molecule to a hyperfine coupling intermediate between Azz and Ayy as the twist angle of the anthracene core increases (illustrated in Fig. S9 of the ESI†). This effect would lead to a decrease in the Hα hyperfine coupling measured along Z that matches the one observed experimentally (see ESI,† Section S5 for details). The underlying assumption of a constant orientation of the ZFS tensor axes within the molecular frame is supported by the absence of clear changes of the hyperfine couplings probed along the long in-plane axis X. Even though this effect also progressively removes the equivalence of the two Hβ hyperfine couplings probed along the ZFS tensor axes, the change in geometry alone cannot explain the observed splitting of the hyperfine peak into two distinct contributions.
The experimental ENDOR data can be modelled by considering changes in the principal values of the hyperfine tensors in addition to the changes in their relative orientation with respect to the ZFS tensor. While the changes for the hyperfine coupling to Hα proton are quite limited, more significant changes of up to 2 MHz of the eigenvalues of the Hβ1 and Hβ2 hyperfine tensors are required to match the experimental ENDOR data (see ESI,† Section S5 for details). The changes in Hβ2 correspond to a decrease in the isotropic hyperfine coupling of about 0.5 MHz from the open compound to Ant-C3, which points to a redistribution of the spin density towards the phenyl side groups. For all three types of nuclei the changes in hyperfine couplings are relatively small up to Ant-C5 and only become significant for Ant-C4 and Ant-C3, where the short tethers induce twist angles of 32° and 38°, respectively.
The excitation-wavelength dependence observed for the ZFS parameters in the transient EPR spectra prompted an investigation of the dependence of the ENDOR spectra on the excitation wavelength. The Davies ENDOR spectra recorded at the three high field canonical field positions for Ant-C4 excited at wavelengths of 425 nm, 435 nm and 445 nm are compared in Fig. 6. ENDOR spectra recorded for increasing excitation wavelengths show a decrease in the Hα hyperfine couplings along the X and Z axes of the ZFS tensor, an increased splitting between the Hβ hyperfine couplings probed along the out-of-plane axis and a shift to smaller hyperfine couplings along the short in-plane axis (Y). These changes closely mirror the changes observed along the Ant-Cn series for decreasing tether lengths and therefore increasing twist angles. This further supports the hypothesis that excitation at higher wavelengths leads to selective excitation of molecular conformations characterised by an increased twist angle and a decreased dihedral angle between the anthracene core and the phenyl substituents.
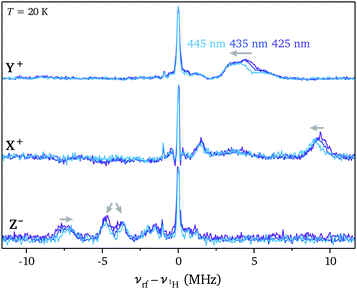 | ||
| Fig. 6 Davies ENDOR spectra recorded for Ant-C4 excited at 425 nm, 435 nm and 445 nm at the high field canonical field positions (T = 20 K). | ||
4 Conclusions
In conclusion, this EPR study has demonstrated a relatively close resemblance between the properties of the photoexcited triplet states of a series of twisted acenes and those of the planar parent compound anthracene. The twisted acenes do however demonstrate an increase in ISC rate with increasing twist angle, as evidenced by the increased triplet yield detected by time-resolved EPR. The changes in the spin polarisation of the triplet state spectra of Ant-Cn compared to anthracene, i.e. a predominant population of the in-plane Y zero-field triplet sublevel compared to almost equal populations of the two in-plane sublevels, suggest an influence of the presence of the phenyl side groups on the ISC mechanism. Ant-C3, the twisted acene with the shortest tether and a twist angle of 38°, is singled out by significant changes in spin polarisation compared to the other molecules in the present series. In this molecule, the short tether, in addition to enforcing a large twist angle, has been shown to also significantly influence the relative orientation between the phenyl side groups and the anthracene core, supporting the hypothesis of their role in the ISC mechanism.The ZFS parameters determined from the time-resolved EPR spectra and the proton hyperfine couplings detected by ENDOR measurements indicate a spin density distribution that is largely localised on the anthracene core, resembling that of planar anthracene, but with additional small contributions on the phenyl side groups. The changes in the ZFS D parameter and in the hyperfine couplings of the Hα and Hβ protons detected along the principal ZFS tensor axes in the Ant-Cn series suggest a slightly increased delocalisation of the spin density onto the side groups for molecules with shorter tethers. The crystal structures show a decrease in the dihedral angle between the anthracene core and the phenyl side groups with increasing twist angle, which would facilitate delocalisation onto the side groups, supporting this interpretation of the experimental results. The effects of increased twist angle and change in the relative position and orientation of the phenyl side groups with respect to the core thus appear to be closely intertwined and the observed changes in triplet state properties can only be explained by considering a combination of both.
The observed excitation-wavelength dependence of all of the observed triplet state properties indicates selective excitation of different molecular conformations depending on the wavelength and implies the presence of a distribution of molecular conformations characterised by different twist angles and different dihedral angles between the core and the phenyl groups of the substituents. Excitation at higher wavelengths selects molecular conformations with a higher twist angle and a higher degree of distortion from the equilibrium geometry in the absence of the tether.
Through its high sensitivity with regard to small changes in geometry and spin density distribution along the investigated series of twisted acenes, EPR on the triplet state has proven a useful tool in the characterisation of changes in electronic properties induced by changes in molecular geometry. It thus promises to be a valuable characterisation technique of new functional materials designed to provide tuneable properties and therefore a wide range of possible applications in molecular electronics and spintronics.
Conflicts of interest
There are no conflicts to declare.Acknowledgements
We would like to thank Prof. Robert Bittl and Dr Felix Kraffert for fruitful discussions. The EPR measurements were performed in the laboratory of Prof. Robert Bittl at the Freie Unversität Berlin. The HPC service of ZEDAT, Freie Universität Berlin, is gratefully acknowledged for computing time. C. E. T. would like to acknowledge financial support through a Marie Curie Individual Fellowship (H2020-MSCA-IF-743419). The research in Israel was supported by the Israel Science Foundation (grant no. 1789/16). A. B. is supported by a PBC fellowship.Notes and references
- J. E. Anthony, Chem. Rev., 2006, 106, 5028–5048 CrossRef CAS PubMed.
- J. E. Anthony, Angew. Chem., Int. Ed., 2008, 47, 452–483 CrossRef CAS PubMed.
- R. A. Pascal, Chem. Rev., 2006, 106, 4809–4819 CrossRef CAS PubMed.
- M. Rickhaus, M. Mayor and M. Juríćek, Chem. Soc. Rev., 2016, 45, 1542–1556 RSC.
- W. Fan, T. Winands, N. L. Doltsinis, Y. Li and Z. Wang, Angew. Chem., Int. Ed., 2017, 56, 15373–15377 CrossRef CAS PubMed.
- A. Bedi and O. Gidron, Chem. – Eur. J., 2019, 25, 3279–3285 CrossRef CAS PubMed.
- A. Bedi, L. J. W. Shimon and O. Gidron, J. Am. Chem. Soc., 2018, 140, 8086–8090 CrossRef CAS PubMed.
- M. Saito, H. Shinokubo and H. Sakurai, Mater. Chem. Front., 2018, 2, 635–661 RSC.
- J. E. Norton and K. N. Houk, J. Am. Chem. Soc., 2005, 127, 4162–4163 CrossRef CAS PubMed.
- N. I. Nijegorodov and W. S. Downey, J. Phys. Chem., 1994, 98, 5639–5643 CrossRef CAS.
- K. Schmidt, S. Brovelli, V. Coropceanu, D. Beljonne, J. Cornil, C. Bazzini, T. Caronna, R. Tubino, F. Meinardi, Z. Shuai and J.-L. Brédas, J. Phys. Chem. A, 2007, 111, 10490–10499 CrossRef CAS PubMed.
- K. Nagarajan, A. R. Mallia, K. Muraleedharan and M. Hariharan, Chem. Sci., 2017, 8, 1776–1782 RSC.
- S. Richert, C. E. Tait and C. R. Timmel, J. Magn. Reson., 2017, 280, 103–116 CrossRef CAS PubMed.
- F. Neese, Wiley Interdiscip. Rev.: Comput. Mol. Sci., 2012, 2, 73–78 CAS.
- F. Neese, Wiley Interdiscip. Rev.: Comput. Mol. Sci., 2018, 8, e1327 Search PubMed.
- S. Grimme, J. Antony, S. Ehrlich and H. Krieg, J. Chem. Phys., 2010, 132, 154104 CrossRef PubMed.
- S. Grimme, S. Ehrlich and L. Goerigk, J. Comput. Chem., 2011, 32, 1456–1465 CrossRef CAS PubMed.
- V. Barone, in Recent Advances in Density Functional Methods, ed. D. P. Chong, World Scientific Publ. Co., Singapore, 1995, ch. 8, vol. 1, pp. 287–334 Search PubMed.
- S. Stoll and A. Schweiger, J. Magn. Reson., 2006, 178, 42–55 CrossRef CAS PubMed.
- N. I. Nijegorodov and W. S. Downey, Spectrochim. Acta, Part A, 1995, 51, 2335–2346 CrossRef.
- R. E. Kellogg, J. Chem. Phys., 1966, 44, 411–412 CrossRef CAS.
- R. G. Bennett and P. J. McCartin, J. Chem. Phys., 1969, 44, 1969–1972 CrossRef.
- F. Tanaka, M. Okamoto and S. Hirayama, J. Phys. Chem., 1995, 99, 525–530 CrossRef CAS.
- C. M. Marian, Wiley Interdiscip. Rev.: Comput. Mol. Sci., 2012, 2, 187–203 CAS.
- C. P. J. Poole, H. A. Farach and W. K. Jackson, J. Chem. Phys., 1974, 61, 2220–2221 CrossRef CAS.
- R. H. Clarke and C. A. Hutchison, J. Chem. Phys., 1971, 54, 2962–2968 CrossRef CAS.
- F. Metz, S. Friedrich and G. Hohlneicher, Chem. Phys. Lett., 1972, 16, 353–358 CrossRef CAS.
- D. A. Antheunis, J. Schmidt and J. H. van der Waals, Mol. Phys., 1974, 27, 1521–1541 CrossRef CAS.
- R. H. Clarke, R. E. Connors, T. J. Schaafsma, J. F. Kleibeuker and R. J. Platenkamp, J. Am. Chem. Soc., 1976, 98, 3674–3677 CrossRef CAS.
- H. van Willigen, G. I. Jones and M. S. Farahat, J. Phys. Chem., 1996, 100, 3312–3316 CrossRef CAS.
- Z. E. X. Dance, S. M. Mickley, T. M. Wilson, A. B. Ricks, A. M. Scott, M. A. Ratner and M. R. Wasielewski, J. Phys. Chem. A, 2008, 112, 4194–4201 CrossRef CAS PubMed.
- M. Schwoerer and H. Sixl, Z. Naturforsch., A: Phys. Sci., 1969, 24, 952–967 CAS.
- D. J. Sloop, H. L. Yu, T.-S. Lin and S. I. Weissman, J. Chem. Phys., 1981, 75, 3746–3757 CrossRef CAS.
- C. Bräuchle, H. Kabza and J. Voitländer, Chem. Phys., 1980, 48, 369–385 CrossRef.
- H. L. Yu, D. J. Sloop, S. I. Weissman, T.-S. Lin, J. R. Norris and M. K. Bowman, J. Phys. Chem., 1982, 86, 4287–4290 CrossRef CAS.
Footnote |
| † Electronic supplementary information (ESI) available: Room temperature and low temperature UV-vis data, details on the time-resolved EPR experiments, simulations of the EPR spectra and fit parameters, additional ENDOR data, details on the DFT calculations and modelling of the experimental ENDOR data. See DOI: 10.1039/c9cp04135d |
| This journal is © the Owner Societies 2019 |

