
 Open Access Article
 This Open Access Article is licensed under a Creative Commons Attribution-Non Commercial 3.0 Unported Licence
Size effects on rotational particle diffusion in complex fluids as probed by Magnetic Particle Nanorheology†
Melissa
Hess
 ab,
Eric
Roeben
a,
Patricia
Rochels
a,
Markus
Zylla
a,
Samira
Webers
c,
Heiko
Wende
c and
Annette M.
Schmidt
*a
ab,
Eric
Roeben
a,
Patricia
Rochels
a,
Markus
Zylla
a,
Samira
Webers
c,
Heiko
Wende
c and
Annette M.
Schmidt
*a
aInstitute of Physical Chemistry, Chemistry Department, Faculty of Mathematics and Natural Sciences, University of Cologne, Luxemburger Str. 116, D-50939 Köln, Germany. E-mail: annette.schmidt@uni-koeln.de
bInstitute for Complex Systems, IHRS BioSoft, Forschungszentrum Jülich GmbH, D-52428 Jülich, Germany
cFaculty of Physics and Center for Nanointegration Duisburg-Essen (CENIDE), University of Duisburg-Essen, Lotharstraße 1, D-47057 Duisburg, Germany
First published on 28th November 2019
Abstract
Rheological approaches based on micro- or nanoscopic probe objects are of interest due to the low volume requirement, the option of spatially resolved probing, and the minimal-invasive nature often connected to such probes. For the study of microstructured systems or biological environments, such methods show potential for investigating the local, size-dependent diffusivity and particle–matrix interactions. For the latter, the relative length scale of the used probes compared to the size of the structural units of the matrix becomes relevant. In this study, a rotational-dynamic approach based on Magnetic Particle Nanorheology (MPN) is used to extract size- and frequency-dependent nanorheological properties by using an otherwise well-established polymer model system. We use magnetically blocked CoFe2O4 nanoparticles as tracers and systematically vary their hydrodynamic size by coating them with a silica shell. On the polymer side, we employ aqueous solutions of poly(ethylene glycol) (PEG) by varying molar mass M and volume fraction ϕ. The complex Brownian relaxation behavior of the tracer particles in solutions of systematically varied composition is investigated by means of AC susceptometry (ACS), and the results provide access to frequency dependent rheological properties. The size-dependent particle diffusivity is evaluated based on theoretical descriptions and macroscopic measurements. The results allow the classification of the investigated compositions into three regimes, taking into account the probe particle size and the length scales of the polymer solution. While a fuzzy cross-over is indicated between the well-known macroscopic behavior and structurally dominated spectra, where the hydrodynamic radius is equal to the radius of gyration of the polymer (rh ∼ Rg), the frequency-related scaling behavior is dominated by the correlation length ξ respectively by the tube diameter a in entangled solutions for rh < Rg.
Introduction
In many soft materials, ranging from living tissue to commercially filled polymers, the interaction of nanosized structural units with their direct environment plays a crucial role for the system performance or functionality. Examples of relevance include car tires,1,2 materials for soft robotics3,4 and also the distribution of medication in living biological systems.5–7While steadily more complex and smart materials are under investigation, skillful analytical approaches are required to fully characterize such samples with respect to their structure and dynamics. Yet, the idea to exploit microscopic objects as tools for the rheological characterization of the matrix goes back already to the pioneers Heilbronn8 (1922), and Freundlich and Seifriz9 (1923). During the last decades, microrheology has developed into an extensively used methodology for the characterization of soft and complex materials.10–17
Microrheology opens up the access to how viscoelastic materials flow as a function of length scale.13 The motion of micrometer sized spheres, either of passive thermal origin or actively driven by an external force (e.g. electric or magnetic field), is tracked and analyzed. Here, the generalized Stokes–Einstein equation relates the diffusivity of the particles’ motion to the viscoelastic properties of the sample.12,13,18 Besides the low amount of sample volume, microrheology benefits from a low degree of invasion to the sample and access to a wide frequency range, as well as the detection of local inhomogeneities.12,13,15,19,20
Since microscopic probing relates the material mechanical characteristics to its microstructure, there is increased interest in decreasing the probe size to the size of the characteristic length scales within the material. Stringent deviations from the rheological performance, as obtained by conventional methods, are expected and experimentally observed.21,22
In particular, in polymer-based fluids and soft solids (e.g. gels, melts or solutions), specific characteristic length scales (e.g. mesh size m, radius of gyration Rg, tube diameter a or correlation length ξ) are present. By relating the probe particle size to the size of the characteristic length scales of the material, certain regimes connected to characteristic length- and time scales can be identified, yet their interpretation is still the subject of investigation.
For a nanoscopic tracer particle in a polymer solution, the effective viscosity η responsible for the diffusion of the tracer depends on the ratio of particle size d to the correlation length ξ, as already postulated by De Gennes.23 When the polymer chains begin to overlap, the polymer solution can be described as a transient network with the correlation length ξ defined as the average distance between the two adjacent contact points between the chains. On this basis, Rubinstein and his coworkers classified the tracer behavior into regimes according to their size with respect to the characteristic length scales.24,25 ‘Small’ tracers have a radius or diameter that is smaller than the correlation length, and their translational diffusion is mainly determined by the solvent viscosity ηS. In contrast, the diffusion of ‘large’ particles (meaning larger than the tube diameter a) reaches the (quasi-)continuous case for long observation times. Here the tube diameter a is related to the topological confinement of a polymer chain by surrounding chains to a tube-like region.24 For ‘intermediate’ particle sizes, we expect at long lime scales that diffusion related to an effective viscosity ηeff occurs. This effective viscosity is lower than the one experienced for a macroscopic object.25 Based on scaling approaches for polymer solutions, further prediction of the frequency-dependent behavior is also available.
In other studies, the impact of the radius of gyration Rg is addressed by molecular dynamics simulation, and it is found that the classical Stokes–Einstein relation fails if the particle size is below the radius of gyration Rg of the polymer.26,27 The radius of gyration Rg is defined via the mean square distance of the building blocks to the center of gravity of the molecule.24 A schematic drawing of the important length scales in polymer solutions is provided in Scheme 1.
 | ||
| Scheme 1 Schematic drawing of (a) correlation length ξ, imaginary tube diameter a and particle size d and (b) radius of gyration Rg. | ||
The influence of the relation of probe size to characteristic length scales in polymer solutions and a correlated breakdown of the Stokes–Einstein equation are focused in several scientific studies.13,21,22,28,29 The role of Rg as a cross-over quantity for the tracer size is obvious from the majority of studies. The nature of the underlying scaling quantity, however, to date is not fully clear.
In this study, we systematically investigate the rotational dynamics of magnetic nanoparticles using the method of Magnetic Particle Nanorheology (MPN)30–32 in a series of model polymer solutions of different molar masses and concentrations, with the aim to better understand specific size-dependent particle–matrix interactions, and to explore the impact of the probe size in relation to the characteristic length scales of the matrix.
As polymer model systems, we employ aqueous solutions of linear poly(ethylene glycol) (PEG) by varying molar mass Mn and volume fraction ϕ. In order to obtain a systematic variation of the tracer size, we use magnetically blocked CoFe2O4 (CF) nanoparticles that are coated with a silica (SiO2) shell. We use AC susceptometry (ACS) in order to obtain information on the rotational (Brownian) relaxation process of the tracer particles in the complex fluid environment of the solutions. By comparing with a theoretical scaling model23 we obtain semiquantitative access to frequency-dependent rheological properties, among these the frequency dependent viscosity η*, loss modulus G′′ and diffusion properties, with an emphasis on the size-dependent particle diffusion.
Materials and methods
Fe(acac)3, dibenzyl ether and oleyl alcohol were obtained from ABCR. Oleyl amine, tetraethyl orthosilicate (TEOS) and water (pure, demineralized) were received from Acros Organics. Sodium hydroxide (0.1 M) and oleic acid were purchased from Fisher Scientific. Technical ethanol was received from Hofmann. Poly(ethylene glycol)s (PEGs), Co(acac)2 and poly(acrylic acid) (PAA, MW = 1800 g mol−1) were obtained from Sigma Aldrich.Synthesis and coating of nanoparticles
All probe particles employed in this study are based on the same batch of CoFe2O4 nanoparticles as a core. The CoFe2O4 particles are synthesized by thermal decomposition of Fe(acac)3 and Co(acac)2 and four subsequent growth steps according to protocols from the literature.30–33 Dibenzyl ether is used as a solvent and oleic acid, oleyl amine and oleyl alcohol are added as stabilizers. The spherical magnetic cores are electrostatically stabilized using poly(acrylic acid) (PAA) in water.For a variation in the diameter of the probe particles, the identical magnetic cores are coated with a silica shell. Therefore, magnetic cobalt ferrite particles in water are diluted to obtain a solution with 1 × 10⁻⁵ m% CF particles and 95 v% ethanol. The solution is treated in an ultrasonic bath for a few minutes. Ammonium hydroxide solution (with a total ammonium hydroxide concentration for the different particle batches of 0.08 mmol mL−1, 0.12 mmol mL−1, 0.25 mmol mL−1 and 0.26 mmol mL−1) is added, and the reaction vial is placed on a shaking plate.
Tetraethyl orthosilicate (TEOS, 0.09 mmol mg−1 CF) diluted in ethanol (0.09 mmol mL−1 EtOH) is added dropwise within 2 hours to the shaking reaction mixture at a rate of 5.0 mL h−1. Subsequently, the CF particles are shaken for an additional 19 hours at room temperature. The reaction mixture is centrifuged at 6500 rpm for 40 min, washed three times with ethanol and twice with water, and finally dispersed in water. In the following, the magnetic cores are labeled as CF_x, while silica coated particles are labelled as CF@SiO2_x, with x representing the hydrodynamic diameter of the respective particles in water, as obtained by ACS.
Sample preparation
For the nanorheological measurements by means of AC susceptometry, the polymer component as summarized in Table 1 is mixed with water and dissolved overnight on a shaking plate. The aqueous-dispersed probe particles are freshly treated in an ultrasonic bath before addition to the respective PEG aqueous solution to reach a final volume fraction of the magnetic core of 7.2 × 10⁻⁵. This corresponds to a total volume fraction of probe particles of 1.1 × 10⁻³ for CF@SiO2_25 particles, and of 3.5 × 10⁻³ for CF@SiO2_29 particles. The polymer systems are labelled as Pyk_ϕ with y indicating the molar mass of the polymer in units of 1000 g mol−1, and ϕ the volume fraction.| PEG | M n [g mol−1] | M w [g mol−1] | PDI |
|---|---|---|---|
| P4k | 4245 | 4308 | 1.01 |
| P20k | 19![[thin space (1/6-em)]](https://www.rsc.org/images/entities/char_2009.gif) 560 560 |
20810 |
1.06 |
| P35k | 31870 |
33100 |
1.04 |
Methods
AC susceptometry (ACS) and Magnetic Particle Nanorheology (MPN)
ACS experiments are performed at room temperature using a DynoMag Imego device with a magnetic field amplitude H0 up to 0.4 kA m−1 in the frequency range between 1 Hz–250 kHz. For low frequency measurements between 0.01 Hz–1500 Hz, a Quantum Design MPMS-5S SQUID magnetometer with an implemented AC option using an applied magnetic AC amplitude H0 of 0.3 kA m−1 at 300 K is used.A direct connection between the rotational diffusion12,22,32 of the magnetically blocked probe particles, as extracted from the phase lag between excitation and response, and the rheological properties of the matrix is provided by the generalized Stokes–Einstein relation for rotation (eqn (1)).
 | (1) |
 | (2) |
 | (3) |
 | (4) |
Dynamic light scattering (DLS)
Information on the translational diffusion coefficient and the hydrodynamic parameter of the particles is obtained using a High Performance Particle Sizer (HPPS, Malvern Instruments, laser 633 nm, angle 173°). All measurements are performed at 25 °C in water in polystyrene cuvettes. The particle diameter distribution is averaged from five measurements. The measurements are evaluated using a Non-Negative Least-Squares (NNLS) algorithm.Infrared (IR) spectroscopy
A Shimadzu IRAffinity-1 FTIR Spectrometer with an ATR (Attenuated Total Reflectance) setup is used. The measurement range is 4500–600 cm−1.Rheology
The macrorheological measurements are carried out using an AR-G2 rheometer (TA Instruments) at 25 °C. The measuring geometry is based on either a plate–plate system with a diameter of 40 mm or a concentric cylinder. Amplitude sweeps are carried out in the strain range of 0.1–10% at 1 Hz, and frequency sweeps in the linear-viscoelastic range of 1.592 × 10⁻² Hz–100 Hz at 1.5% strain.Transmission electron microscopy (TEM)
The electron microscopy images are taken using a Zeiss LEO 912. For this, the respective sample is drop-cast to a copper-coated carbon grid and left for slow evaporation. The instrument is equipped with a 120 kV LaB6 cathode and a Moorweis Slow Scan with a CCD camera Sharp:Eye 2048 × 2048 TRS.Vibrating sample magnetometry (VSM)
The magnetization measurements of liquid or dried samples are performed using an ADE Magnetics EV7 Vibrating Sample Magnetometer at room temperature. The sample is placed in a Teflon vessel and immobilized on a glass sample holder. A GMW electromagnet 3472-70 with a maximum field strength of 1.6 × 10⁶ A m−1 and a vibrator with a frequency of 75 Hz are used.ζ potential measurements
A Zetasizer Nano ZS (Malvern Instruments, λ = 633 nm) is used to measure the ζ potential. The measurements are performed in polystyrene capillary cuvettes. The pH value is adjusted with 0.1 M HCl and 0.1 M NaOH solutions.Results
In this work, we investigate the size-dependent rotational diffusivity of well-defined nanoscopic magnetic tracer particles in aqueous polymer solutions using Magnetic Particle Nanorheology (MPN). Focusing on size effects concerning the particle size related to the characteristic length scales in the respective polymer, we employ magnetically blocked, CoFe2O4-based tracer particles with a diamagnetic SiO2 shell of variable thickness. The tracer particles are spherical in shape, possess a narrow size distribution, exhibit excellent dispersion stability in water at a broad range of pH and ionic strength, and are predominantly magnetically blocked, so that the preferred relaxation process is Brown relaxation. The size-dependent nanorheological properties of aqueous poly(ethylene glycol) solutions in a broad range of molar mass and volume fraction are investigated, and the results are compared to the outcomes of recent theoretical and experimental methods.1. Description and characterization of the tracer particles and the investigated system
The core particles are subsequently individually coated with a SiO2 shell using a modified Stöber process.35,36 A variation of the shell thickness is achieved by increasing the particle size through an increase of the base concentration during the synthesis. The TEM images of the resulting particles (Fig. 1) show mainly single coated particles with only one magnetic core. The corresponding particle sizes as obtained by different methods are listed in Table 2. The results confirm that the shell thickness of the tracer particles increases with the base concentration, and that the size distribution of the tracers remains low.
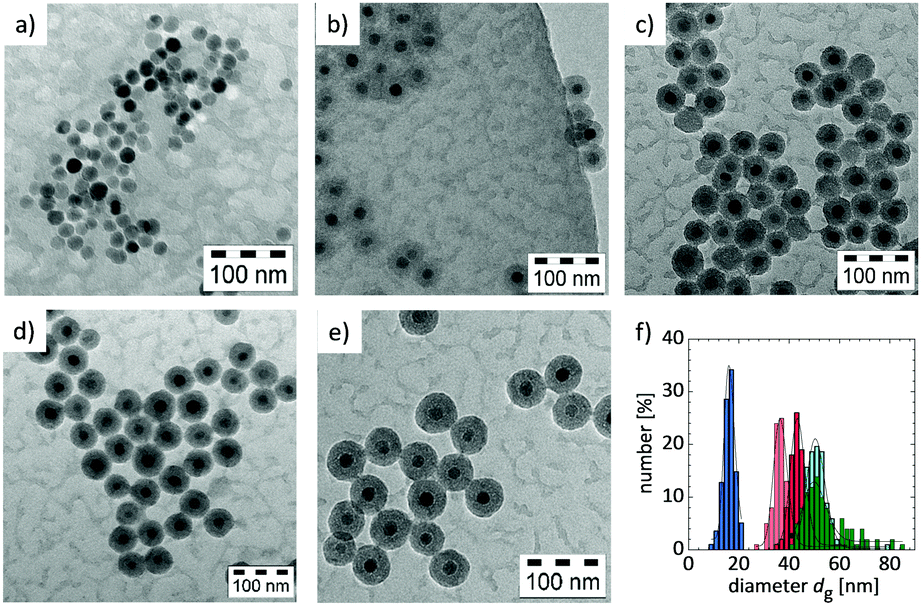 | ||
| Fig. 1 TEM images of tracer particles of the same magnetic core size and varying SiO2 shell thickness (a) CF_12, (b) CF@SiO2_25, (c) CF@SiO2_29, (d) CF@SiO2_37 and (e) CF@SiO2_42. (f) Histograms of the geometrical diameter dg with the corresponding lognormal function for the different probe particles (CF_12 (blue); CF@SiO2_25 (orange); CF@SiO2_29 (red); CF@SiO2_37 (light cyan); CF@SiO2_42 (green)). | ||
| Sample | TEM | DLS | ACS | ||||
|---|---|---|---|---|---|---|---|
| r g [nm] | σ | r n,DLS [nm] | r v,DLS [nm] | r h,ACS [nm] | σ | τ Brown [s] | |
| CF_12 | 8.2 | 0.13 | 10.7 | 13.3 | 11.6 | 0.31 | 4.3 × 10⁻⁶ |
| CF@SiO2_25 | 18.3 | 0.07 | 25.6 | 28.2 | 24.8 | 0.24 | 4.2 × 10⁻⁵ |
| CF@SiO2_29 | 21.7 | 0.07 | 28.4 | 33.6 | 29.2 | 0.35 | 6.8 × 10⁻⁵ |
| CF@SiO2_37 | 25.3 | 0.07 | 32.2 | 37.5 | 37.0 | 0.46 | 1.4 × 10⁻⁴ |
| CF@SiO2_42 | 25.1 | 0.09 | 38.8 | 46.4 | 42.3 | 0.36 | 2.1 × 10⁻⁴ |
In addition to the basic architecture of the tracers, it is important to collect relevant information on their surface properties, their hydrodynamic behavior and their magnetic properties.
The surface properties of the tracers are analyzed by attenuated total reflection infrared (ATR-FT IR) spectroscopy (see Fig. S1, ESI†). For SiO2-coated particles, dominant Si–O–Si stretching modes are found. All particles are negatively charged on the surface at pH 6 (the pH of the investigated polymer solutions is 6–7) with deprotonated acid groups on the magnetic cores, which are stabilized with polyacrylic acid, and deprotonated hydroxy groups on the surface of the silica particles. The ζ potential is shown for a wide pH range for the magnetic cores and exemplarily at pH 6 for the silica particles used for the measurements in Fig. S2 (ESI†). All batches show at pH 6 a ζ potential of approximately 50 mV in water which ensures good stability of the particles in aqueous solutions at that pH.
The hydrodynamic properties of the tracers are investigated independently based on the translational and rotational diffusion of the particles. Dynamic light scattering (DLS) is used to determine the number- and volume-averaged hydrodynamic radius rh,DLS of the particles (see Table 2) based on translational diffusion. Accordingly, the hydrodynamic radii are slightly larger than rg as expected, representing the impact of the solvation shell and confirming that mainly single-dispersed particles are present.
The quasi-static magnetic properties of the samples are analyzed by vibrating sample magnetometry (VSM) measurements in the dried state as well as in aqueous solution and are shown in Fig. 2 and Table 3.
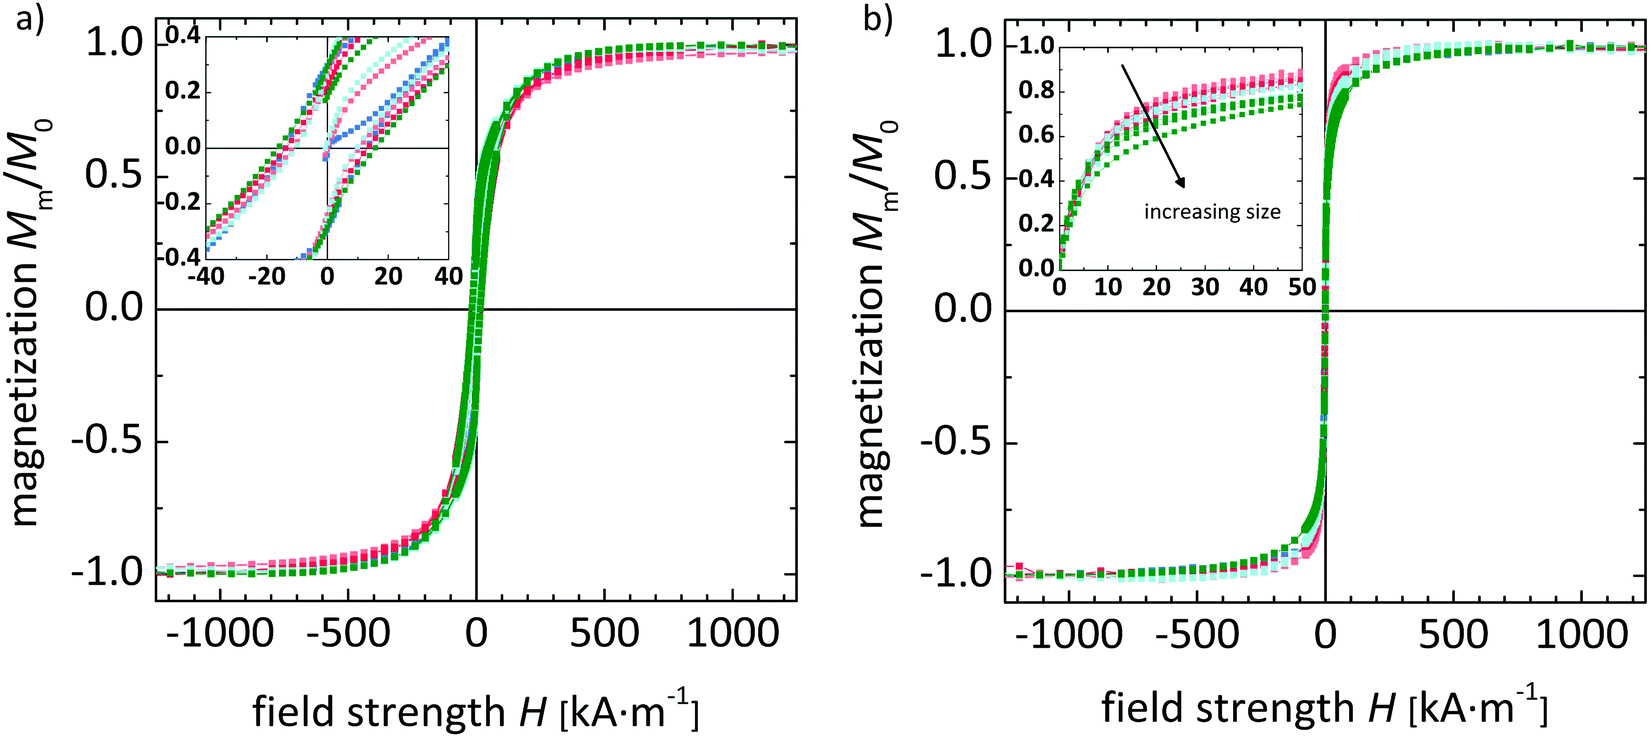 | ||
| Fig. 2 Normalized magnetization curves of different probe particles (CF_12 (blue); CF@SiO2_25 (orange); CF@SiO2_29 (red); CF@SiO2_37 (light cyan); CF@SiO2_42 (green)) in (a) the dried state and (b) in aqueous solution. | ||
| Probes | CF_12 | CF@SiO2_25 | CF@SiO2_29 | CF@SiO2_37 | CF@SiO2_42 |
|---|---|---|---|---|---|
| M S [A m2 kg−1] | 74.1 | 11.1 | 10.6 | 10.5 | 10.2 |
| μ mag [m%] | 98.1 | 14.6 | 14.1 | 13.9 | 13.5 |
| H c [kA m−1] | 13.8 | 10.8 | 13.5 | 10.2 | 16.0 |
| M R/MS | 0.30 | 0.25 | 0.28 | 0.27 | 0.29 |
| χ ini/MS [m A−1] | 3.2 × 10⁻⁵ | 3.0 × 10⁻⁵ | 2.9 × 10⁻⁵ | 2.7 × 10⁻⁵ | 2.3 × 10⁻⁵ |
| m [A m2] | 3.6 × 10⁻¹⁹ | 3.0 × 10⁻¹⁹ | 2.8 × 10⁻¹⁹ | 2.6 × 10⁻¹⁹ | 2.2 × 10⁻¹⁹ |
In the dried state, all particle batches show at ambient temperature a hysteretic magnetization curve, and the saturation magnetization MS is according to the expected range by taking into account the volume and diamagnetism of the SiO2 shell. The normalized curves are of similar shape, and the coercive field Hc and normalized remanence MR/MS do not significantly depend on the shell thickness.
In aqueous dispersion, all particle batches show pseudo-superparamagnetic behavior, characterized by Langevin-type behavior and the absence of hysteresis. With increasing particle size, the normalized initial susceptibility of the virgin curve, χini/MS, shows a decrease which is attributed to the diamagnetic contribution of the SiO2 shell.
With respect to rotational diffusion-based hydrodynamic properties, dynamic magnetometry based AC susceptometry is employed. These experiments also serve as an important reference for the MPN experiments discussed in the following chapters. The AC susceptograms of the tracers are shown in Fig. 3. All tracer particles show a typical Debye-type relaxation behavior in water, with a sigmoidal shape of the real part of the susceptibility χ′, and a maximum for the imaginary part χ′′. The fit of the single Debye relaxation process including a particle size distribution is exemplarily shown in Fig. S3 (ESI†). With increasing diameter of the tracer particles, the transition is shifted to lower frequencies as expected. All susceptograms can be fitted according to a single Debye relaxation process in a Newtonian fluid with a minor distribution of relaxation times (due to the minor size distribution of the tracer particles), the average characteristic relaxation time τB is estimated, and by employing the viscosity of water at 25 °C, η0 = 0.89 mPas,30 the volume-weighted hydrodynamic radius rh of the respective tracer particles and its distribution are determined. A summary of the obtained hydrodynamic sizes of the probe particles in water is given in Table 2.
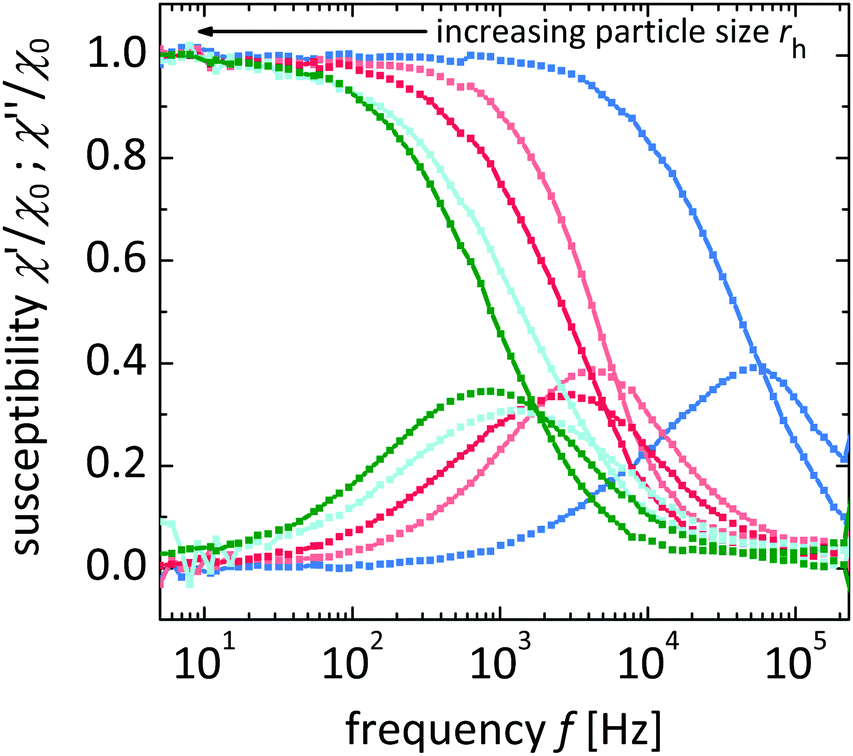 | ||
| Fig. 3 Real (χ′) and imaginary (χ′′) part of the susceptibility normalized by the initial susceptibility (χ0) in dependence on frequency f measured in water for probe particles CF_12 (blue), CF@SiO2_25 (orange), CF@SiO2_29 (red), CF@SiO2_37 (light cyan) and CF@SiO2_42 (green). | ||
According to the results discussed above, all particle batches show spherical shape, narrow size distribution, and well-defined hydrodynamic and magnetic properties and are predominantly magnetically blocked, suggesting that the particles are well suited as magnetic tracer particles for Magnetic Particle Nanorheology based on dynamic magnetometry.
The structure and dynamics of polymer solutions are characterized by various parameters. First of all, the concentration regime of the polymer solution is important, and thus information on the overlap volume fraction ϕ*, the entanglement volume fraction ϕe and the critical molar mass Me is required. With Me = 5870 g mol−1 is accessible from the literature,41 we can expect that P4k solutions are not entangled independent of the polymer volume fraction, since the critical molar mass of PEG with Me is not reached.
ϕ* and ϕe of the aqueous PEG solutions are molar-mass-dependent and obtained from static macroscopic rheological measurements. The zero shear viscosity η0 is extracted from rheometric steady-state flow curves by extrapolating the viscosity η to σ → 0. In Fig. 4, the dependence of η0 on the volume fraction ϕ and molar mass Mw of the polymer component is shown. For each polymer solution series, there are two concentration regimes with different scaling exponents m1 and m2, corresponding to the semi-diluted regime and to the concentrated regime, respectively. From the cross-section of the linear fits in the double-log plot, the critical polymer volume fraction ϕc is obtained and found to be close to the literature values for the overlap volume fraction ϕ*, or the entanglement volume fraction ϕe (Table 4).24,31
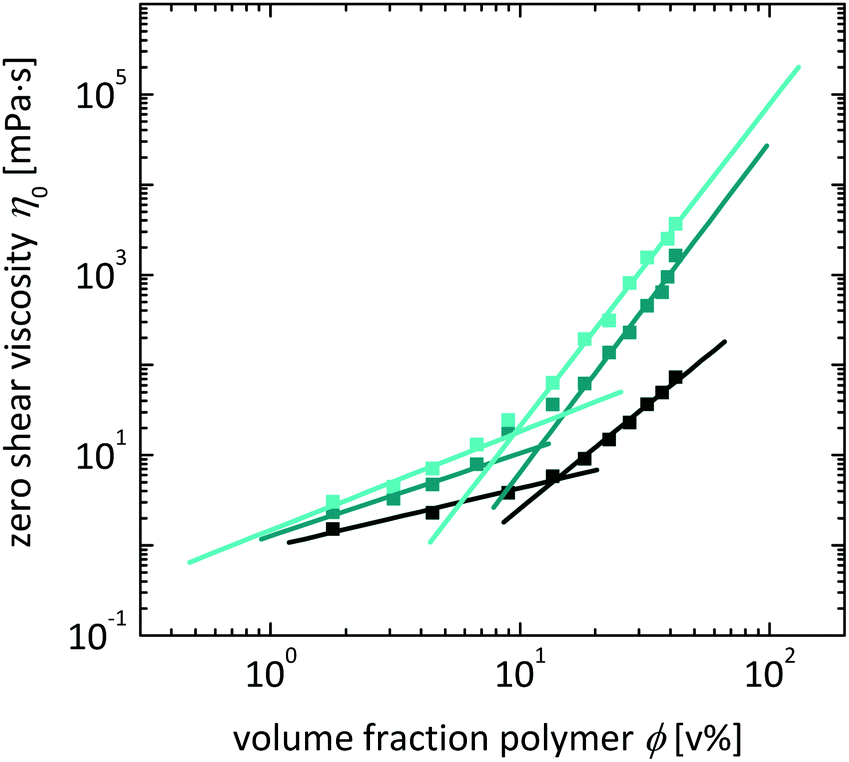 | ||
| Fig. 4 Zero shear viscosities η0 obtained from macrorheology in dependence on the volume fraction of polymer ϕ for aqueous solutions of P4k (dark cyan), P20k (cyan) and P35k (light cyan). The entanglement volume fraction ϕe,exp is obtained from intersections of linear fits, whereas the scaling exponents m1 and m2 result from the slopes of the fits. In parts reproduced with permission from reference 31. | ||
| Sample | ϕ theo.* [v%] | ϕ e,theo [v%] | ϕ c,exp [v%] | m 1 (ϕ < ϕc,exp) | m 2 (ϕ < ϕc,exp) |
|---|---|---|---|---|---|
| a Apparent, since theoretically not defined for this molar mass. | |||||
| Theo. | — | — | — | m 1,theo = 1.000 | m 2,theo = 3.927 |
| P4k | 7.59 | n. a. | 13.88a | 0.65 ± 0.08 | 2.26 ± 0.11 |
| P20k | 2.22 | 14.35 | 11.94 | 0.92 ± 0.11 | 3.66 ± 0.23 |
| P35k | 1.45 | 9.36 | 9.46 | 1.09 ± 0.15 | 3.57 ± 0.13 |
With increasing molar mass Mw, ϕc decreases as expected, and the scaling of η0 with ϕ is in good agreement with the theoretical predictions. The deviations present can be ascribed to the finite molar mass distribution of the polymer component.
When considering the relevance of the tracer size, it becomes further important to estimate the characteristic length scales within the solutions based on theoretical predictions. Of relevance are the radius of gyration Rg, the correlation length ξ, and, for entangled solutions, the tube diameter a.
The radius of gyration Rg, defined via the mean square distance of the building blocks to the center of gravity of the molecule, is weakly dependent on the polymer volume fraction ϕ (eqn (5)).24
 | (5) |
 | (6) |
The correlation length ξ is defined as the average distance between one monomer unit of a polymer chain to the nearest monomer unit of another polymer chain, while a is related to the topological confinement of a polymer chain by the surrounding chains to a tube-like region.24 Both parameters are independent of Mn, but depend on the polymer volume fraction ϕ. (eqn (7) and (8)).24,25
| ξ(ϕ) = bϕ−ν/(3υ− 1) | (7) |
| a(ϕ) = a(1)ϕ−ν/(3υ−1) | (8) |
The dependence of RF on M is shown in Fig. 5(left) and indicates its relation to the characteristic tracer particle size rh. RF increases with M, indicating that by varying the molar mass Mn of the polymer and the size rh of the tracer particles, it is possible to selectively study different regimes of rh with respect to RF. The correlation length ξ and the imaginary tube diameter a are shown in dependence on the polymer volume fraction ϕ in Fig. 5(right). Both parameters decrease with increasing ϕ, with a being always larger than ξ. By relating a and ξ to the probe particle size rh, one obtains critical concentrations where ξ(ϕξ) = rh or a(ϕa) = rh, as listed in Table S1 (ESI†). Based on these parameters, the particles can be classified into small, intermediate and large particles as suggested by Rubinstein, as shown in Fig. 12.25 Upon systematic variation of the polymer molar mass Mn, the polymer volume fraction ϕ and the probe particle size rh, a whole bandwidth of polymer concentration regimes and relations of particle size to polymer size is accessible and its specific influence on the nanorheological results can be studied. In the investigated polymer fraction and molar mass regime, the particles CF_12 undergo all of the three different regimes (large particles: dh < a; intermediate particles: a < dh < ξ; small particles: ξ < dh), whereas the two larger particles are expected to mainly behave as intermediate and large particles.
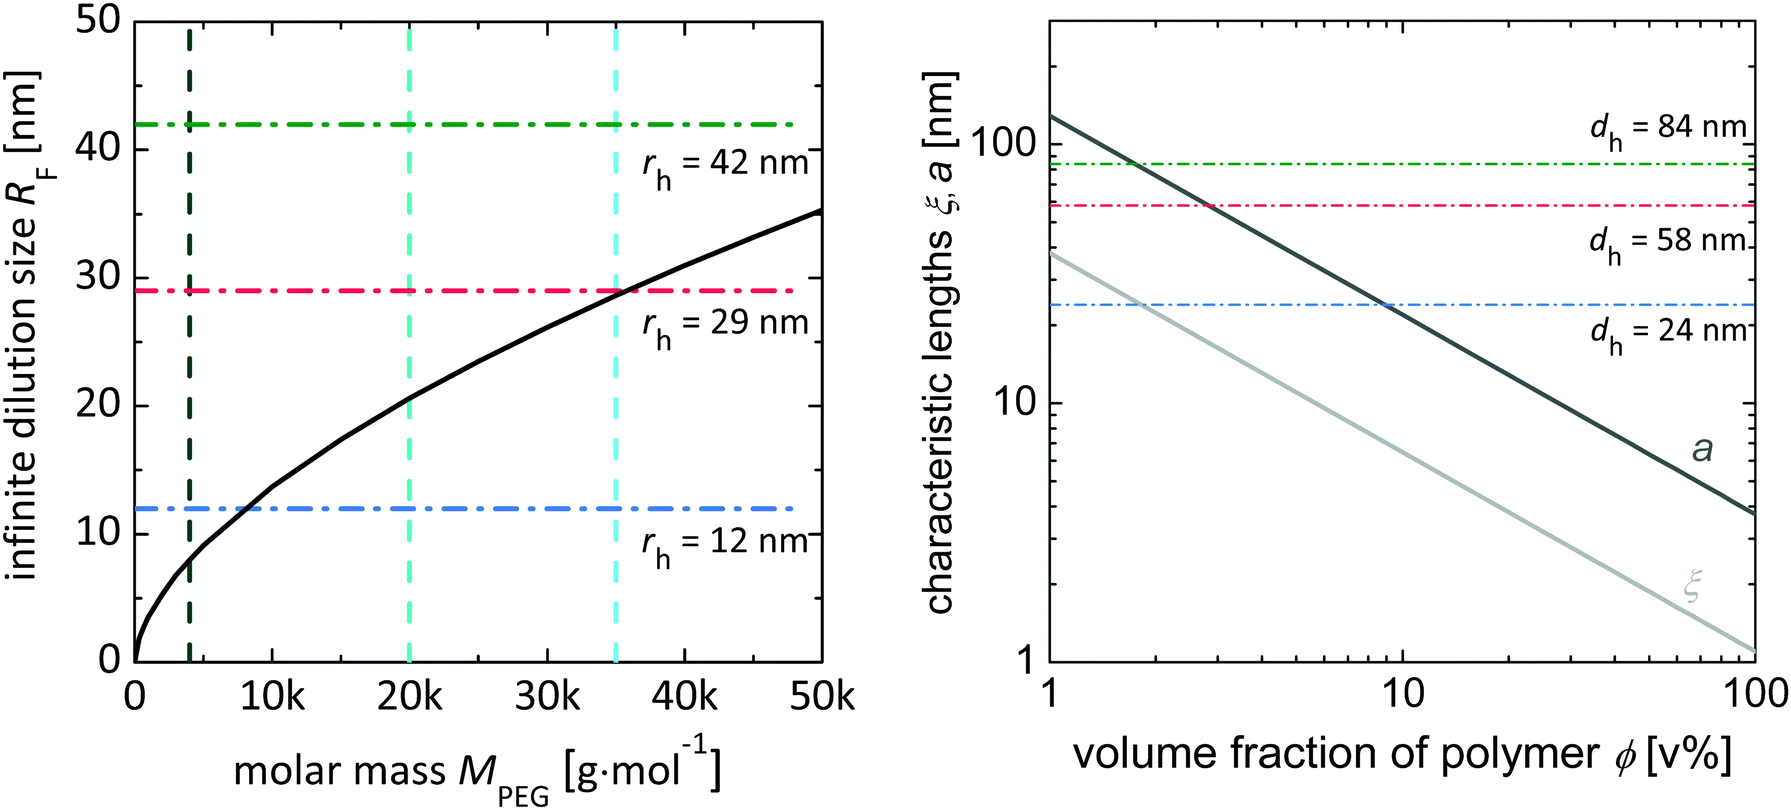 | ||
| Fig. 5 Characteristic sizes of aqueous PEG solutions: (left) radius of gyration for infinite dilution Rf in dependence of the investigated molar mass M (dark curve) with indication of the solutions employed in this study (P4k (dark cyan), P20k (cyan), P35k (light cyan)); (right) correlation length ξ (light grey) and tube diameter a (dark grey) in dependence on the polymer volume fraction ϕ. In both plots, the tracer hydrodynamic radius rh is indicated for CF_12 (blue), CF@SiO2_29 (red) and CF@SiO2_42 (green). | ||
Accordingly, the polymer solutions under investigation are well-suited as model systems, and thus in line with recent experimental studies, the system is particularly suited to allow the prediction of characteristic time- and length scales based on the theoretical findings and experimental results of others.
2. Investigation of complex fluids with variable probe sizes
In the following, we discuss the MPN-based nanorheological results based on tracer particles with three different hydrodynamic diameters (CF_12, CF@SiO2_29 and CF@SiO2_42). After a general discussion on the spectra, we will gain more insight from the discussion of the impact of the tracer size, polymer molar mass, and volume fraction.000 g mol−1) and spanning a wide range of polymer volume concentrations between 0 v% and 42 v%, the experiments comprise a large range of characteristic size ranges. With an extensive number of different combinations of tracers and polymer solutions, the full range of relations between the tracer particle size and length scales in the polymer system is covered, and a detailed and complete picture on the influence of size effects on tracer dynamics is targeted.
In Fig. 6, the AC susceptograms based on three different tracer particles and solutions of three different polymers are shown. Generally, the spectra are shifted to lower frequencies with increasing polymer concentration ϕ, in accordance with an increase in viscosity η (see 1.2). Similarly, the spectra shift to lower frequencies with increasing particle size rh, in accordance with an increased rotational relaxation time τB.
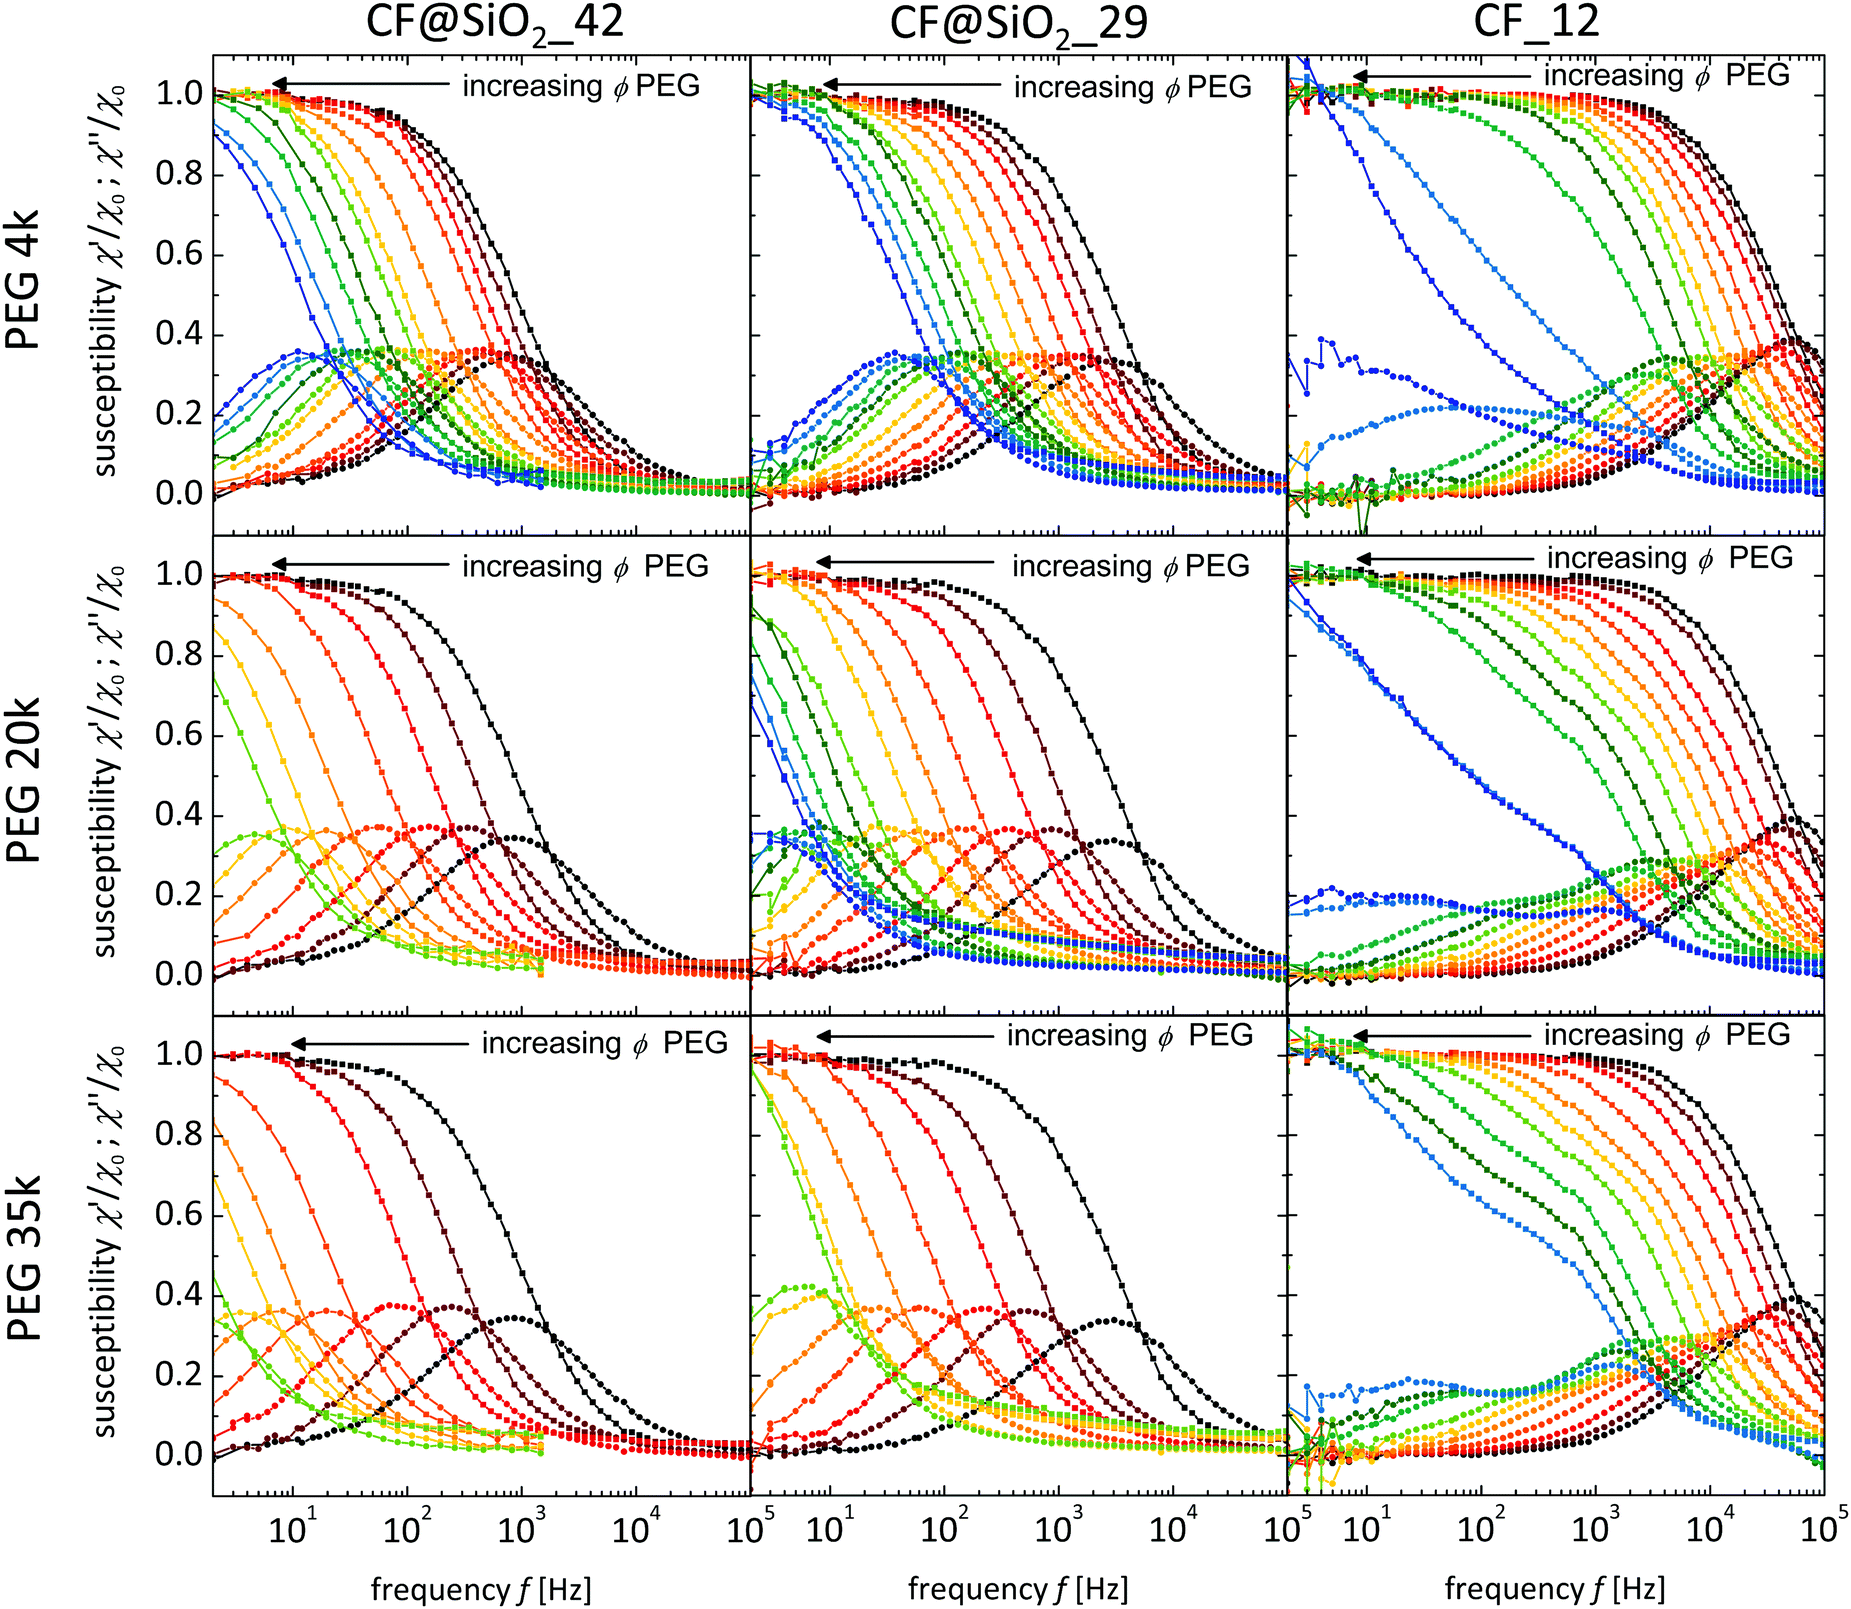 | ||
| Fig. 6 AC susceptograms for P4k (upper row), P20k (middle row) and P35k (lower row) aqueous solutions for probe particles CF@SiO2_42 (left column), CF@SiO2_29 (middle column) and CF_12 (right column). The volume concentration is varied between 0–42.0 v% (black: ϕ = 0 v%; dark red: ϕ = 1.8 v%; red: ϕ = 4.5 v%; orange: ϕ = 9.0 v%; light orange: ϕ = 13.5 v%, yellow: ϕ = 18.1 v%, light green: ϕ = 22.8 v%; olive green: ϕ = 27.5 v%; turquoise: ϕ = 32.3 v%; light blue: ϕ = 35.2 v% (ϕ = 37.2 v% for P4k); blue: ϕ = 37.2 v% (ϕ = 42.0 v% for P4k). The graphs show the real (squares) and imaginary part (circles) of the susceptibility χ* in dependence on the frequency f. | ||
The spectra based on the two larger tracer types mainly show a symmetric shift with a conserved curve shape, indicating that even at high volume fractions the particles experience a single Debye relaxation process in these solutions, similar to the one observed in water. In contrast, the spectra of CF_12 are more complex. They show a broadening of the peak and partly even bimodal behavior with increasing volume fraction ϕ.
Analyzing the susceptograms by means of the Gemant-Bishop-diMarzio model allows the detailed investigation of the influence of the intrinsic parameters of the polymer solutions on the rotational particle diffusivity. For this purpose, we calculate the mechanical loss modulus G′′(f) according to eqn (2), and compare it to the results of the macrorheological frequency sweeps (see Fig. 7a and Fig. S4–S6, ESI†) with emphasis on the influence of different parameters such as the polymer volume fraction ϕ, the molar mass of the polymer M, and the particle size rh.
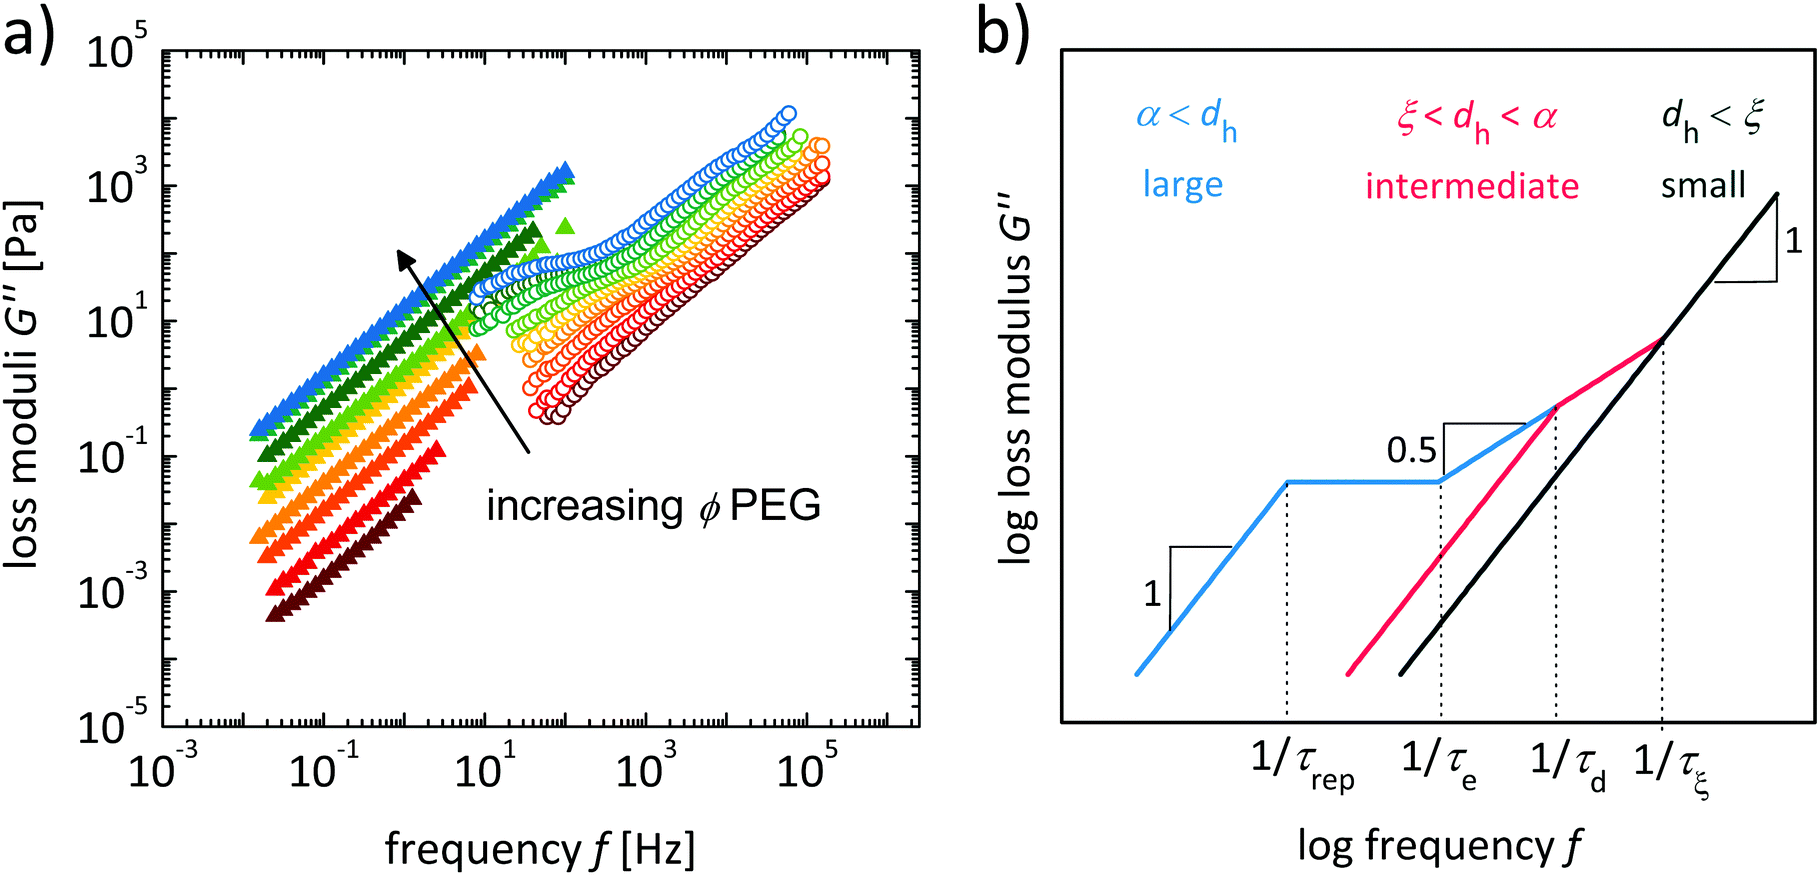 | ||
| Fig. 7 (a) Loss moduli determined by macrorheology (full symbols) and nanorheology (empty symbols) in dependence on frequency f for P35k aqueous solutions for probe particles CF_12. The volume concentration is varied between 1.8–35.2 v% (dark red: ϕ = 1.8 v%; red: ϕ = 4.5 v%; orange: ϕ = 9.0 v%; light orange: ϕ = 13.5 v%, yellow: ϕ = 18.1 v%, light green: ϕ = 22.8 v%; olive green: ϕ = 27.5 v%; turquoise: ϕ = 32.3 v%; light blue: ϕ = 35.2 v%) and (b) schematic representation of loss moduli curve course in dependence on frequency for different relations of probe particle size to structural units of the polymer based on the theory set up by Rubinstein for translational motion of particles in complex and structured solutions.25 (blue: large particles (a < dh), red: intermediate particles (ξ < dh < a), and green: small particles (dh < ξ)). Here, τξ is the relaxation time of the polymer connected to the correlation length, τd is the relaxation time of a polymer segment with the same size as the particle size, τe represents the relaxation time of an entanglement strand and τrep is the relaxation time of a whole polymer chain. | ||
While the macroscopic results for all samples show a Newtonian behavior for all samples in the investigated frequency range, generally the correspondence between macroscopically and nanoscopically derived data is the best for large particles, low polymer fractions and low molar mass of the polymer component. For increasing Mn and polymer fraction, the smaller particles show deviations between the methods, and a frequency-dependent behavior is observed for the smaller tracer particles. In the following, these observations are analyzed in more detail.
2.2 Influence of polymer volume fraction ϕ
In the macroscopic rheology frequency-sweep experiments the Newtonian behavior of the solutions within the macroscopically accessible frequency range (up to f = 102 Hz) is confirmed by a scaling exponent of ∼1 for G′′(f) and f for all investigated polymer solutions. In comparison, the nanoscopic results enlarge the accessible frequency range (1 Hz–250 kHz) and thus allow also the detection of frequency-dependent moduli, along with the influence of the probe size. Here, the slope of G′′(f) passes through different regimes, ascribed to different dominating relaxation modes and tracer dynamics. The concentration dependence of this behavior is discussed exemplarily in the case of CF_12 tracer particles in P35k solutions (Fig. 7a).First of all, it is important to point out that the absolute values in the overlapping frequency region of macroscopic and nanoscopic measurements show a good agreement for the two larger (SiO2-coated) particle batches, in particular at low molecular mass M and polymer volume fraction ϕ. In contrast to this, with decreasing particle size, the increasing volume fraction of the polymer ϕ and molar mass M the discrepancies between the two measurement methods increase. For the P35k solutions investigated with CF_12 particles, for the two lowest polymer volume fractions a good correspondence between the nanoscopic and macroscopic results is found. Here, the particles are expected to behave as ‘small probe particles’ (compare to Fig. 5 and 7b) with a slope of 1, resulting in a constant viscosity and this is experimentally found. For higher polymer fractions a deviation in the frequency-dependent behavior as well as in the extrapolated apparent viscosity at low frequencies is found. This can be explained since the particles go through the transition from ‘intermediate’ to ‘large particles’ with a frequency dependent scaling behavior.
A theoretical description of the scaling of G′′ with f for different relations of probe particle size to structural units is based on the theory set up by Rubinstein25 for translational motion of particles in polymer solutions. According to this approach, a different scaling behavior is expected for the so-called ‘large particles’ (larger than the tube diameter of the solution a), for ‘intermediate-sized particles’ with a radius or diameter between the correlation length and the tube diameter, and for ‘small particles’ that are smaller than the correlation length ξ, as schematically shown in Fig. 7b.
Accordingly, in the series discussed here, we expect a scaling (G′′ vs. f) of 1 over the full frequency range for volume fractions below ϕξ = 4.5%, since the particles dynamics are mostly affected by an effective viscosity of the polymer solution. Since rh < RF, a reduction in effective viscosity as compared to the macroscopic behavior is present, as the particles mainly diffuse the solvent-rich domains of the solution. Hence, the apparent viscosity as obtained from these experiments is lower than the macroscopic zero-shear viscosity η0 and closer to the viscosity of the solvent ηs. For entangled solutions between ϕξ < ϕ < ϕa, we expect a behavior as ‘intermediate-sized’ tracer, and this is in accordance with the observed subdiffusive behavior at intermediate frequencies for solutions between ϕ = 4.5% and 22.8%.
According to the theory, the subdiffusive regime is found at time scales between τξ (relaxation time of the polymer connected to the correlation length) and τd (relaxation time of a polymer segment with the same size as the probe particle size). In the polymer volume fraction regime where ϕ > ϕa, the tracers are expected to behave as ‘large particles. In entangled solutions and at long observation times (t < τrep, reptation time of a polymer chain), the diffusion of ‘large’ particles is determined by bulk viscosity of the polymer system, and a slope of 1 is predicted for G′′(f). At shorter times (τrep > t > τe, the relaxation time of an entanglement strand), the tracer particles have to wait for the polymer mesh to relax, and strongly subdiffusive behavior or even a plateau is predicted. Below τe, the particle diffuses within its mesh with a behavior similar to intermediate particles. For CF_12 tracer particles in P35k solutions, this is clearly confirmed for ϕ > 22.8%.
It is thus experimentally shown that the nanorheological behavior as extracted from MPN is in accordance with the predicted behavior and that for the investigated polymer solutions, the smallest tracer particles CF_12 allow the observation of the transition from small via intermediate-sized to large tracers. The volume fractions of the transitions observed are close to the expected volume fractions ϕξ = 4.5% and ϕa = 21.9% as calculated for the CF_12 particles.
Accordingly, this classification seems feasible for the detailed discussion of the size-related results, and is later used to establish a phase diagram of the entire system (see Section 2.6).
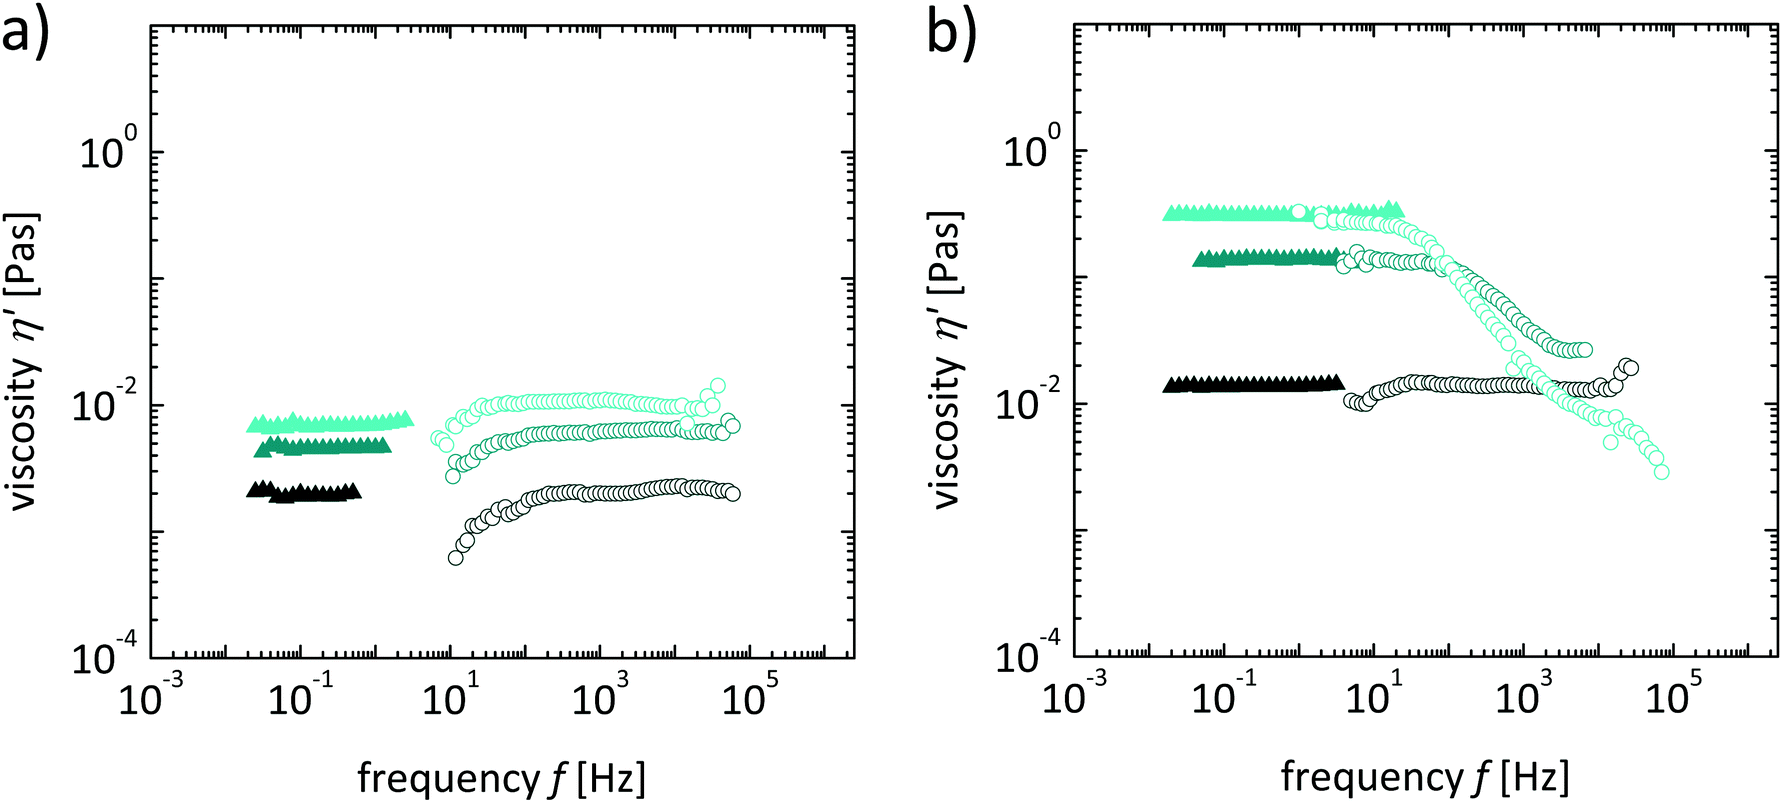 | ||
| Fig. 8 Viscosity determined by macrorheology (full symbols) and nanorheology (empty symbols) in dependence on frequency f for P4k (dark cyan), P20k (cyan), P35k (light cyan) aqueous solutions for probe particles CF@SiO2_29 at (a) ϕ = 4.5 v% and (b) ϕ = 22.8 v%. | ||
In the series with ϕ = 4.5 v%, the tracer particles are expected to be in the ‘intermediate’ size regime, as for CF@SiO2_29, ϕξ = 1.4 v% and ϕa = 7 v%. Experimentally, the results confirm a nearly Newtonian-like behavior for f > 100 Hz at a viscosity close to the macroscopic one, however, also a reduced effective viscosity at lower frequencies. The deviations at low frequencies can result from the fact that in the correction procedure for the evaluation of the data using the GDB model a distribution of hydrodynamic size and viscosity resulting from the measurements in Newtonian fluids is assumed and the direct transfer of these parameters to complex fluids might account for the errors. This latter effect is not very exposed due to the fact that the tracer radius is larger than or close to Rf, and it should be pointed out that none of these solutions is entangled. The deviations at high frequencies may be caused by the application of a frequency-independent value of χN′ at χ∞ for the correction of the data.
It will be helpful to compare this behavior to higher concentrated, entangled and non-entangled solutions.
Accordingly, the results of the series employed with the same tracer particles (CF@SiO2_29) at a polymer volume fraction of ϕ = 22.8 v% show a more complex behavior. Again, for the P4k solution there is a good agreement between the macroscopic and the nanoscopic measurements. This is expected, since the molar mass of P4k is below the critical value for the occurrence of entanglements Me, and thus the solution in all regimes behaves principally similar to a simple Newtonian fluid for all length scales considerably larger than RF (or Rg) and ξ.
The nanoscopic measurements of the higher molar mass polymers at ϕ = 22.8 v% show a strong decrease of the apparent viscosity η′ at higher frequencies. This behavior is attributed to the diffusion of a tracer particle within its mesh of the entangled networks of the P20k and P35k solutions. According to the theoretical predictions,25 the respective transition is expected at time scales between τe (or τd) and τrep, which is addressed further in Section 2.6.
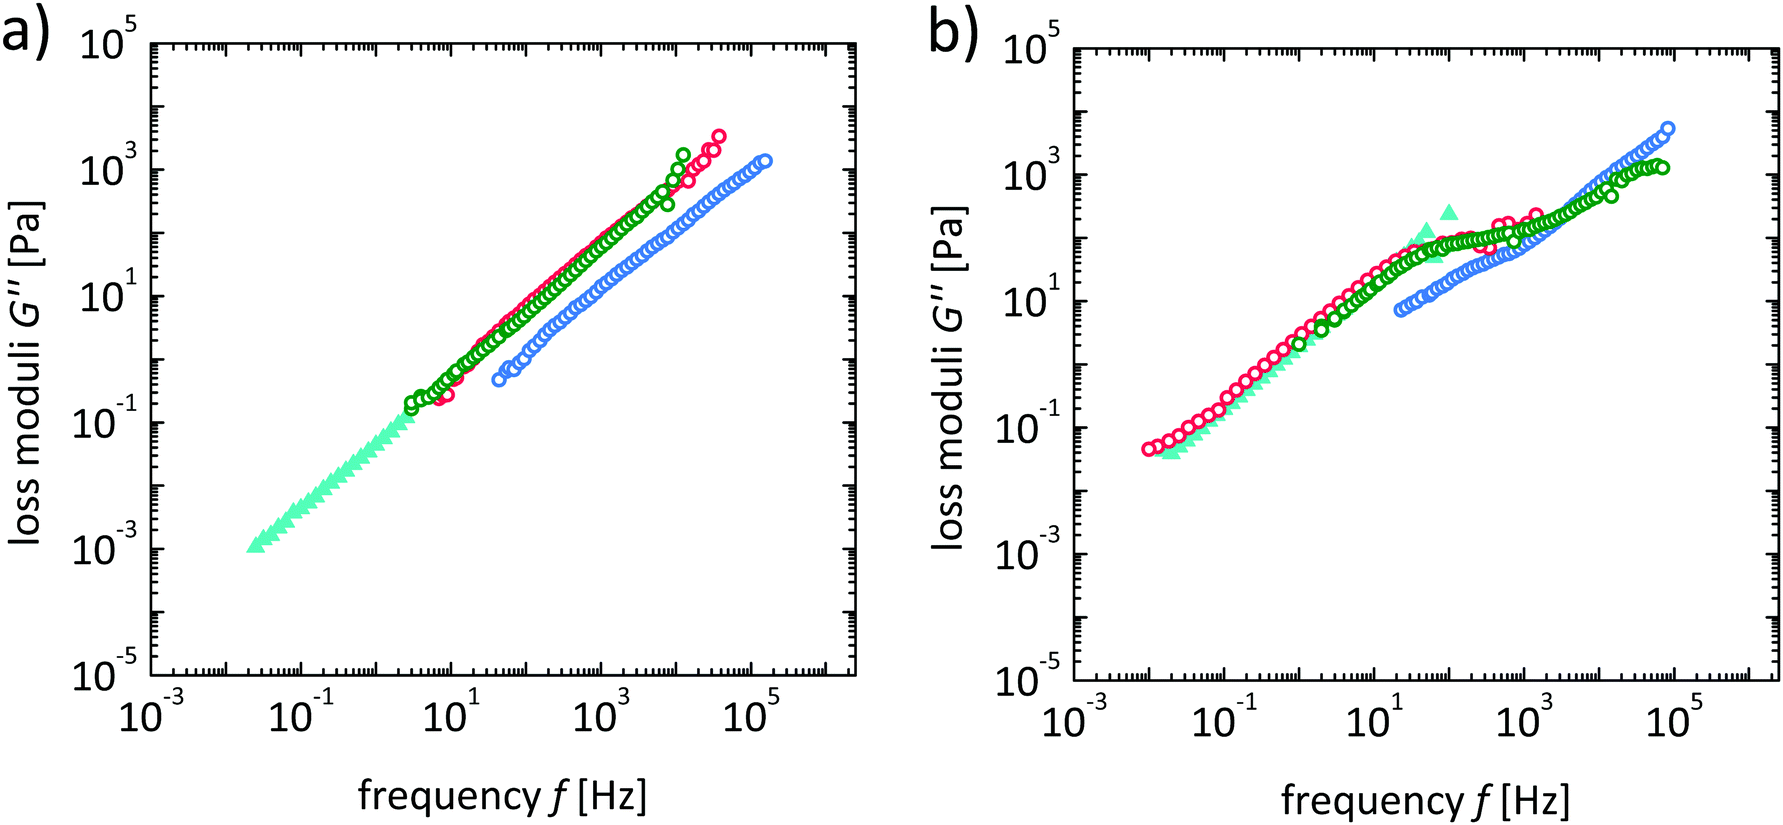 | ||
| Fig. 9 Loss moduli determined by macrorheology (full symbols) and nanorheology (empty symbols) in dependence on frequency f for P35k (light cyan) aqueous solutions for probe particles CF_12 (blue), CF@SiO2_29 (red) and CF@SiO2_42 (green) at (a) ϕ = 4.5 v% and (b) ϕ = 22.8 v%. | ||
For the entangled solutions at ϕ = 22.8 v%, a good agreement between macroscopic and nanoscopic measurements is found for the two silica coated particle batches in the frequency overlap region, while a plateau is observed in the intermediate frequency range. CF_12 tracers show additionally a deviation in the effective viscosity to lower values in the lowest accessible frequency range. Such a plateau is in accordance with the predictions and is expected between τe (or τd) and τrep (see Section 2.6).
2.5 Zero shear viscosity and rotational diffusion coefficient
In addition to the frequency-dependent scaling behavior of G′′, the long-time rotational diffusion coefficient Dr,0 is extracted from the low-frequency-related viscosity η0,GDB for all investigated tracers and investigated polymer solutions, in order to gain more insight into the long-time size-dependent diffusion behavior. For this purpose, we determine η0,GDB by extrapolation of G′′ to f = 1 Hz, and the rotational diffusion coefficient Dr is calculated using eqn (1) by implementation of η0,GDB from the measurements. The data are further normalized by the rotational diffusion coefficient of the particles in water DS. The results are displayed in Fig. 10versus the reduced polymer volume fraction ϕ/ϕa, with respect to the effective polymer mesh size in entangled polymer solutions. We would like to point out that while in some of the literature ϕa is defined by relating the tracer particle diameter to a, we found an excellent agreement with expectations by using rh instead of dh.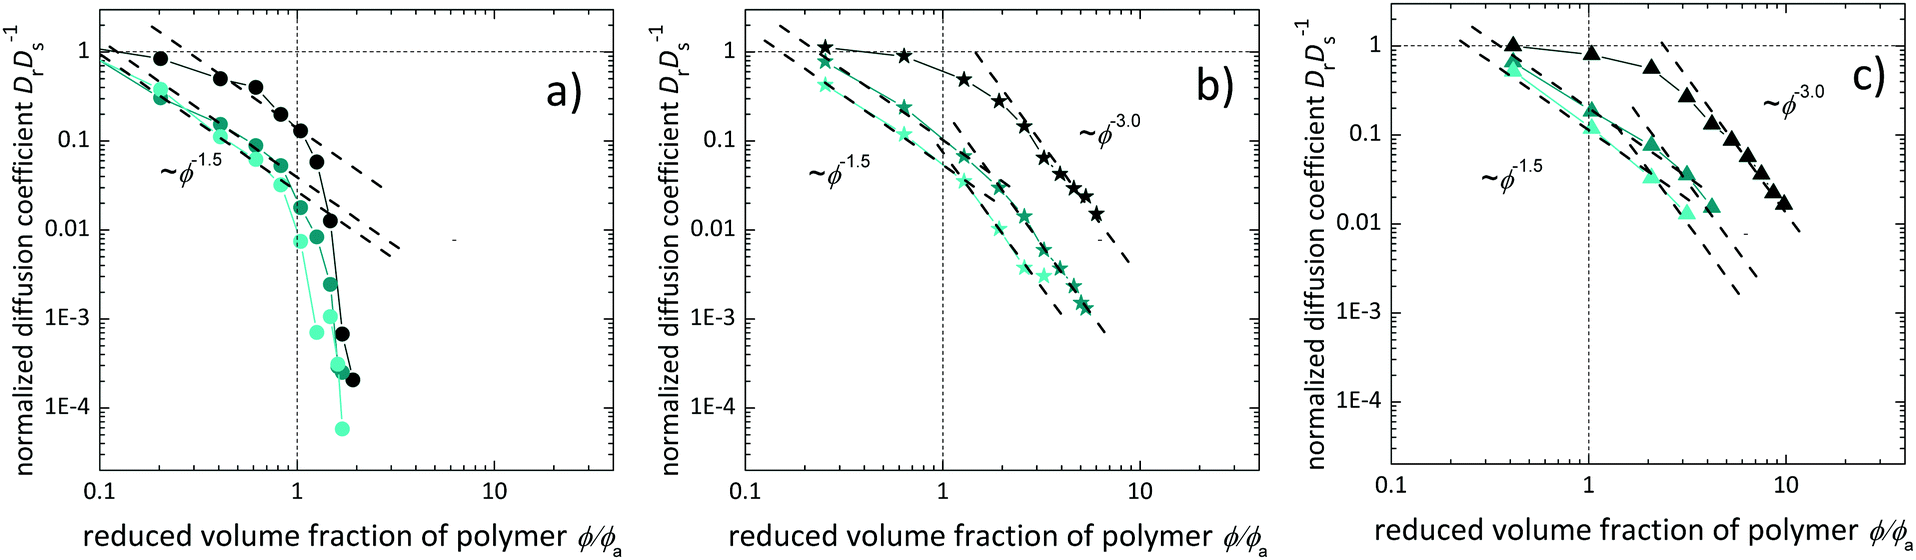 | ||
| Fig. 10 Rotational diffusion coefficient normalized by the diffusion coefficient in pure solvent Dr/Ds in dependence on the reduced volume fraction of polymer ϕ/ϕa determined with probe particles (a) CF_12 (circles), (b) CF@SiO2_29 (stars) and (c) CF@SiO2_42 (triangles) for polymer systems P4k (dark cyan), P20k (cyan) and P35k (light cyan). | ||
For all investigated systems, a decrease in the normalized rotational diffusion is found with increasing reduced volume fraction ϕ/ϕa. Depending on the tracer particle size and the molar mass of the polymer, up to three distinct regimes of scaling with the reduced polymer fraction are observed.
For all particle batches, we observe a decrease of Dr with ϕ−1.5 for volume fractions between ϕξ and ϕa, and the results are thus principally in agreement with theoretical predictions.25 Deviations are observed for P4k, where at this low molar mass, ϕa is not defined.
At volume fractions larger than ϕa, for the two larger particle batches, a good agreement between the macroscopic and nanoscopic experiments is shown, as indicated by the scaling behavior and cross-over frequency of the two regimes identified. For the smallest tracer particles CF_12 though, a particularly sharp transition as compared to the larger tracers is observed at ϕa, and a sharp decrease of Dr at increasing volume fraction is found, in accordance with an arrest of the particle within the entanglement mesh. This behavior is in good accordance with the predictions from Rubinstein's theory, predicting a scaling behavior of 0 for ϕ < ϕξ, of −1.52 for ϕξ < ϕ < ϕa, with a sharp step of Dr at ϕ = ϕa for the case of small particles. For intermediate-scaled particles, we obtain a scaling exponent of about −3.0 from these results, in accordance with Fig. S10 (ESI†).
2.6 Refinement of theoretical expectations
When overlooking the entire set of rheograms (Fig. S2–S4, ESI†), with an emphasis on the frequency overlap region, it is generally noticed that for CF@SiO2_29 and CF@SiO2_42 a good quantitative agreement between macroscopic and nanoscopic data points is found, confirming the versatility of the method to extract general rheometric data as long as the tracer particles are considerably larger that the structural units of the system to be analyzed. In addition to the extension of the frequency range (as compared to the usual microrheological experiments, where mostly f < 103 Hz), the method shows potential for extracting relaxation times with respect to the polymer as well as also the tracer particles, thus allowing information on the size-depending dynamics in the nanostructured fluids. This can clearly be seen by focusing on the CF_12 tracer particles that show a predicted subdiffusive behavior at intermediate time scales, and the relation of particle size to structural length scales present in the solution plays a major role.By analyzing the frequency dependence of the loss moduli G′′ in detail, all experiments can be classified into ‘small’, ‘intermediate-sized’ or ‘large’ tracer behavior. Therefore, the scaling behavior of the different curve segments is analyzed and compared to the theoretical expectations (e.g., Fig. 7b). From this, also the inherent characteristic time for reptation, τrep, is extracted for experiments on entangled solutions with ‘large’ tracer particles (compare Fig. 11) which is discussed later in this section.
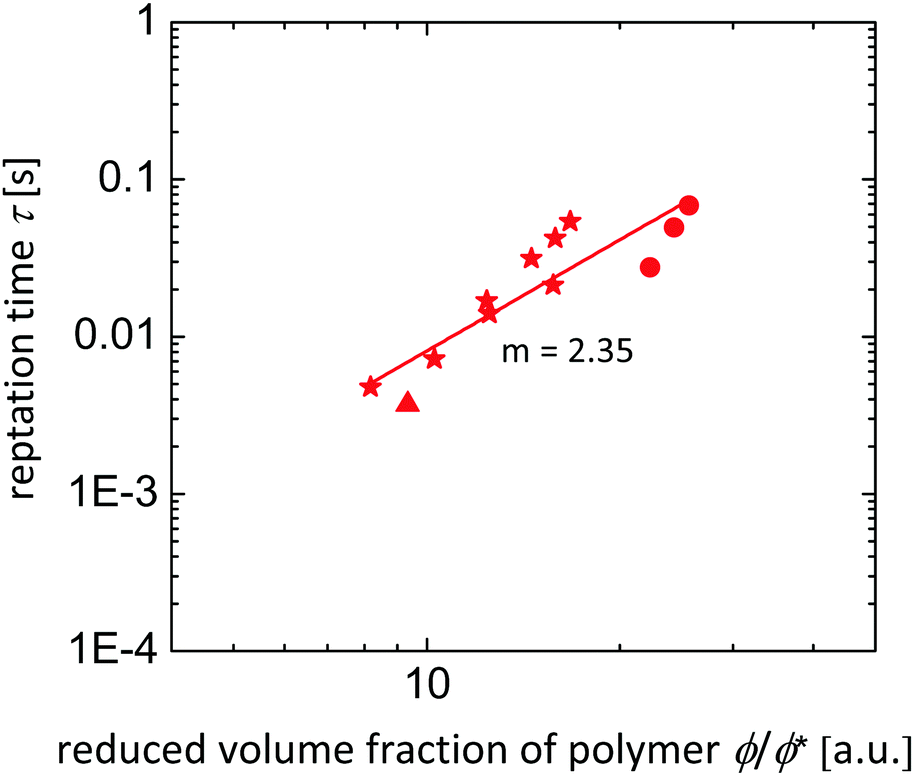 | ||
| Fig. 11 Reptation time τrep in dependence on the reduced volume fraction of polymer ϕ/ϕ* determined with probe particles CF_12 (circles), CF@SiO2_29 (stars) and CF@SiO2_42 (triangles). The experimental scaling is approximately ϕ2.35. | ||
For a comprehensive overview on the results obtained for the entire investigated system, a phase diagram is constructed (Fig. 12), in which the hydrodynamic particle radius rh normalized over the radius of gyration at infinite dilution RF is plotted against the reduced polymer volume fraction ϕ/ϕ*. From theoretical calculations ξ, a, RF are calculated in dependence on ϕ/ϕ* and included in the phase diagram.
 | ||
| Fig. 12 Reduced size rh/RF in dependence on the reduced volume fraction of polymer ϕ/ϕ* determined with probe particles CF_12 (circles), CF@SiO2_29 (stars) and CF@SiO2_42 (triangles) for P4k (open symbols), P20k (open dotted symbols) and P35k (filled symbols). Region I (green) belongs to small particles, II (red) to intermediate particles and III (blue) to large particles, after the classification of Rubinstein et al. | ||
The results can be summarized as follows: for three series of experiments, the tracers are considerably larger than the radius of gyration at infinite dilution, RF: CF@SiO2_42 tracer particles in P4k and P20k, as well as CF@SiO2_29 tracers in P4k. In these experiments it is observed that the behavior is nearly Newtonian for most concentrations (indicated by the green color of the data point in the phase diagram), and that subdiffusive behavior is observed at intermediate time scales, in case the concentration becomes large enough (ϕ ∼ ϕa or ϕξ). This is indicated by red symbols in the phase diagram.
The increasing polymer molar mass and/or decreasing particle size results in rh ∼ RF. This is the case for CF@SiO2_42 in P35k, CF@SiO2_29 in P20k, and for CF_12 in P4k. Principally, we observe a similar behavior, however, in the entangled or overlapped solutions with ϕ > ϕ*, the predicted plateau-behavior expected for ‘large’ tracers can be observed (indicated by blue symbols in the diagram).
Finally, the tracer size is clearly lower than RF for the series of CF@SiO2_29 in P35k, as well as for CF_12 in P20k and in P35k. In these series, the predictions on all three regions (‘small’, green symbols; ‘intermediate’, red symbols; and ‘large’ tracers, blue) are excellently met with the predictions from theory. On the other hand, when the particles are slightly larger than the polymer size, still, the different regimes are found, but here the border between the different regimes seems to be dominated by the entanglement volume fraction ϕe/ϕ*. The picture that arises here is, that below ϕe/ϕ* the particles diffuse nearly Newtonian, whereas above ϕe/ϕ* the response of the particles is mainly dominated by the entanglements of the system.42
Accordingly, the other important result is that RF (or Rg) is the relevant cross-over quantity in order to classify macro- to nanoscopic rheological behavior. However, it should be stated that for rh > RF, still time-related processes are detected, and for the scaling with tracer size in this regime a good theoretical description is not available to date.
As a final step in our evaluation, we confirm the suitability of this size-dependent method to obtain realistic information on the solution dynamics. For this purpose, we exemplarily extract the reptation time τrep as a well-defined property from the curves of sufficiently concentrated and entangled solutions. The data are plotted in Fig. 11 and compared to the theoretical prediction. Taking into account the available data points we determine an experimental scaling with ϕ2.35, whereas the theoretical expected scaling is ϕ1.65. This requires more theoretical and experimental consideration in upcoming studies.
Taking further into account that Rubinstein's theory is set up for the passive translation of tracer particles in similar systems, the agreement with our data, that is exclusively on the rotational relaxation of magnetically deflected tracer particles, is not fully unexpected, but still surprising.
Based on the experimental and theoretical considerations of others,27,38,43–45e.g. the scaling behavior of ηappvs. ϕ is expected to be weaker for rotation than for translation, and might further be affected by a depletion layer.38,43,45,46
Even if the latter was not the focus of the present study, we hope that our results foster the development of a more developed theoretical framework for rotational diffusion in complex fluids and might give rise to upcoming detailed theoretical description focusing on rotation. In view of the versatility and broad applicability of the method, along with the actual development of similar or related approaches, this would be very attractive.
Conclusions
Using a nanorheological approach based on Magnetic Particle Nanorheology (MPN), and by employing magnetic probe particles of variable particle sizes, we investigate the size-dependent rotational diffusivity of the tracers in a model system of aqueous poly(ethylene glycol) (PEG) solutions of varying molar masses and volume fractions. We emphasize the significance of the relation of probe particle size to the characteristic length scales within the polymer solution and its relevance for the frequency-dependent nanorheological results.For this purpose, we use spherical, magnetically blocked tracer particles of different hydrodynamic size, and determine the frequency dependent rheological properties, such as viscosities η, loss moduli G′′ and diffusion properties of the probes, e.g. the rotational diffusion coefficient, from the real and imaginary part of the AC susceptometry spectra. The results are compared and complemented by macroscopic measurements as well as theoretical approaches to obtain a complete picture on the dynamic behavior of this system.
Our results show that it is possible to classify the solutions and their combination with the tracers into three important regimes, by considering the tracer size and the polymer-derived length scales in the solution, as long as the tracers are in the size range of the gyration radius Rg. Our experimental findings are consistent and show good semi-quantitative agreement with theoretical expectations for the passive, translational diffusion of particles in such solutions, as predicted by Rubinstein and coworkers. In particular, for tracer particles smaller than the radius of gyration of the polymer solutions, the predictions for ‘large’, intermediate-sized’ or ‘small’ tracer behavior are excellently met, while partly pronounced deviations from macrorheological measurements are found. If the tracer particles are larger than RF, the nanorheological results are closer to the expectations from macrorheology, and are strongly affected if entanglements are present.
This detailed study on the size-dependent rheological properties of polymer solutions can serve as a basis for the advancement of the present rheological descriptions, and is suitable to serve as a basis for further investigations of more complex polymer systems such as dynamic networks,32 covalently crosslinked gels or biological systems. In particular, MNP can be used to specifically address particle–matrix interactions and to determine for example mesh sizes in less known systems.
Conflicts of interest
There are no conflicts to declare.Acknowledgements
We gratefully acknowledge the financial support from the DFG (SPP 1681 (grant SCHM 1747/10 and WE2623/7)). Melissa Hess acknowledges support from the International Helmholtz Research School of Biophysics and Soft Matter (IHRS BioSoft). We would like to thank J. Allgaier, M. Kruteva and L. Fruhner from FZ Jülich (JCNS-1/ICS-1) for GPC measurements of the polymers.Notes and references
- G. Agostini, U. E. Frank, T. F. E. Materne, F. Visel and R. J. Zimmer, US Pat., 5580919, 1996 Search PubMed.
- F. Zhang, L. Liao, Y. Wang, Y. Wang, H. Huang, P. Li, Z. Peng and R. Zeng, J. Rare Earths, 2016, 34, 221–226 CrossRef CAS.
- T. Santaniello, L. Migliorini, Y. Yan, C. Lenardi and P. Milani, J. Nanopart. Res., 2018, 20, 250 CrossRef.
- S. I. Rich, R. J. Wood and C. Majidi, Nat. Electron., 2018, 1, 102–112 CrossRef.
- S. K. Sahoo and V. Labhasetwar, Drug Discovery Today, 2003, 8, 1112–1120 CrossRef CAS.
- L. A. L. Fliervoet and E. Mastrobattista, Adv. Drug Delivery Rev., 2016, 106, 63–72 CrossRef CAS PubMed.
- K. E. Uhrich, S. M. Cannizzaro, R. S. Langer and K. M. Shakesheff, Chem. Rev., 1999, 99, 3181–3198 CrossRef CAS PubMed.
- A. Heilbronn, Jahrb. Wiss. Bot., 1922, 61, 284–338 Search PubMed.
- H. Freundlich and W. Seifriz, Zeitschrift für Phys. Chemie, 1923, 233–261 CAS.
- B. R. Dasgupta, S.-Y. Tee, J. C. Crocker, B. J. Frisken and D. A. Weitz, Phys. Rev. E: Stat., Nonlinear, Soft Matter Phys., 2002, 65, 51505 CrossRef PubMed.
- R. E. Mahaffy, C. K. Shih, F. C. MacKintosh and J. Kas, Phys. Rev. Lett., 2000, 85, 880–883 CrossRef CAS PubMed.
- T. A. Waigh, Rep. Prog. Phys., 2005, 68, 685 CrossRef.
- T. A. Waigh, Rep. Prog. Phys., 2016, 79, 74601 CrossRef PubMed.
- A. Papagiannopoulos, K. Sotiropoulos and S. Pispas, Food Hydrocolloids, 2016, 61, 201–210 CrossRef CAS.
- W. Liu and C. Wu, Macromol. Chem. Phys., 2018, 219, 1700307 CrossRef CAS.
- J. Liu, V. Boyko, Z. Yi and Y. Men, Langmuir, 2013, 29, 14044–14049 CrossRef CAS PubMed.
- E. M. Furst, Curr. Opin. Colloid Interface Sci., 2005, 10, 79–86 CrossRef CAS.
- T. M. Squires and T. G. Mason, Annu. Rev. Fluid Mech., 2010, 42, 413–438 CrossRef.
- A. Mukhopadhyay and S. Granick, Curr. Opin. Colloid Interface Sci., 2001, 6, 423–429 CrossRef CAS.
- F. C. MacKintosh and C. F. Schmidt, Curr. Opin. Colloid Interface Sci., 1999, 4, 300–307 CrossRef CAS.
- A. Tuteja, M. E. Mackay, S. Narayanan, S. Asokan and M. S. Wong, Nano Lett., 2007, 7, 1276–1281 CrossRef CAS PubMed.
- L. Maldonado-Camargo and C. Rinaldi, Nano Lett., 2016, 16, 6767–6773 CrossRef CAS PubMed.
- P.-G. De Gennes, Scaling concepts in polymer physics, Cornell University Press, 1979 Search PubMed.
- M. Rubinstein and R. H. Colby, Polymer physics, OUP, Oxford, New York, 2003 Search PubMed.
- L.-H. Cai, S. Panyukov and M. Rubinstein, Macromolecules, 2011, 44, 7853–7863 CrossRef CAS PubMed.
- J. Liu, D. Cao and L. Zhang, J. Phys. Chem. C, 2008, 112, 6653–6661 CrossRef CAS.
- R. Holyst, A. Bielejewska, J. Szymański, A. Wilk, A. Patkowski, J. Gapiński, A. Żywociński, T. Kalwarczyk, E. Kalwarczyk and M. Tabaka, Phys. Chem. Chem. Phys., 2009, 11, 9025–9032 RSC.
- R. A. Omari, A. M. Aneese, C. A. Grabowski and A. Mukhopadhyay, J. Phys. Chem. B, 2009, 113, 8449–8452 CrossRef CAS PubMed.
- A. Wisniewska, K. Sozanski, T. Kalwarczyk, K. Kedra-Krolik and R. Holyst, Macromolecules, 2017, 50, 4555–4561 CrossRef CAS.
- E. Roeben, L. Roeder, S. Teusch, M. Effertz, U. Deiters and A. M. Schmidt, Colloid Polym. Sci., 2014, 292, 2013–2023 CrossRef CAS.
- M. Hermes, E. Roeben, L. Kibkalo and A. M. Schmidt, Annu. Trans. - Nord. Rheol. Soc., 2017, 25, 97–105 CAS.
- M. Hess, E. Roeben, A. Habicht, S. Seiffert and A. M. Schmidt, Soft Matter, 2019, 15, 842–850 RSC.
- S. Sun, H. Zeng, D. B. Robinson, S. Raoux, P. M. Rice, S. X. Wang and G. Li, J. Am. Chem. Soc., 2004, 126, 273–279 CrossRef CAS PubMed.
- E. A. DiMarzio and M. Bishop, J. Chem. Phys., 1974, 60, 3802–3811 CrossRef CAS.
- W. Stöber, A. Fink and E. Bohn, J. Colloid Interface Sci., 1968, 26, 62–69 CrossRef.
- Q. Dai, M. Lam, S. Swanson, R.-H. R. Yu, D. J. Milliron, T. Topuria, P.-O. Jubert and A. Nelson, Langmuir, 2010, 26, 17546–17551 CrossRef CAS PubMed.
- B. R. Dasgupta, S. Tee, J. C. Crocker, B. J. Frisken and D. A. Weitz, Phys. Rev. E: Stat., Nonlinear, Soft Matter Phys., 2002, 65, 1–10 Search PubMed.
- N. Ziębacz, S. A. Wieczorek, T. Kalwarczyk, M. Fiałkowski and R. Hołyst, Soft Matter, 2011, 7, 7181–7186 RSC.
- R. Holyst, A. Bielejewska, J. Szymański, A. Wilk, A. Patkowski, J. Gapiński, A. Zywociński, T. Kalwarczyk, E. Kalwarczyk, M. Tabaka, N. Zibacz and S. A. Wieczorek, Phys. Chem. Chem. Phys., 2009, 11, 9025–9032 RSC.
- T. Yanagishima, D. Frenkel, J. Kotar and E. Eiser, J. Phys.: Condens. Matter, 2011, 23, 194118 CrossRef PubMed.
- L. J. Fetters, D. J. Lohse and R. H. Colby, Physical properties of polymers handbook, Springer, Berlin, 2006 Search PubMed.
- L. H. Cai, S. Panyukov and M. Rubinstein, Macromolecules, 2015, 48, 847–862 CrossRef CAS PubMed.
- G. H. Koenderink, S. Sacanna, D. G. A. L. Aarts and A. P. Philipse, Phys. Rev. E: Stat., Nonlinear, Soft Matter Phys., 2004, 69, 1–12 CrossRef PubMed.
- A. Wiśniewska, K. Sozański, T. Kalwarczyk, K. Kędra-Królik, C. Pieper, S. A. Wieczorek, S. Jakieła, J. Enderlein and R. Hołyst, Polymer, 2014, 55, 4651–4657 CrossRef.
- S. Alam and A. Mukhopadhyay, Langmuir, 2015, 31, 8780–8785 CrossRef CAS PubMed.
- L. Maldonado-Camargo, C. Yang and C. Rinaldi, Nanoscale, 2017, 9, 12039–12050 RSC.
Footnote |
| † Electronic supplementary information (ESI) available. See DOI: 10.1039/c9cp04083h |
| This journal is © the Owner Societies 2019 |