 Open Access Article
Creative Commons Attribution 3.0 Unported Licence
Activated graphene as a material for supercapacitor electrodes: effects of surface area, pore size distribution and hydrophilicity†
Artem
Iakunkov
 a,
Vasyl
Skrypnychuk
a,
Andreas
Nordenström
a,
Elizaveta A.
Shilayeva
b,
Mikhail
Korobov
a,
Vasyl
Skrypnychuk
a,
Andreas
Nordenström
a,
Elizaveta A.
Shilayeva
b,
Mikhail
Korobov
 b,
Mariana
Prodana
c,
Marius
Enachescu
c,
Sylvia H.
Larsson
d and
Alexandr
V.Talyzin
 *a
*a
aDepartment of Physics, Umeå University, Umeå, SE-901 87, Sweden. E-mail: alexandr.talyzin@umu.se
bDepartment of Chemistry, Moscow State University, Leninskie Gory 1-3, Moscow 119991, Russia
cCenter for Surface Science and NanoTechnology, University Politechnica of Bucharest, 060042 Bucharest, Romania
dDepartment of Forest Biomaterials and Technology, Swedish University of Agricultural Sciences, SE-901 83 Umeå, Sweden
First published on 24th July 2019
Abstract
Activated reduced graphene oxide (a-rGO) is a material with a rigid 3D porous structure and high specific surface area (SSA). Using variation of activation parameters and post-synthesis mechanical treatment we prepared two sets of materials with a broad range of BET (N2) SSA ∼1000–3000 m2 g−1, and significant differences in pore size distribution and oxygen content. The performance of activated graphene as an electrode in a supercapacitor with KOH electrolyte was correlated with the structural parameters of the materials and water sorption properties. a-rGO is a hydrophobic material as evidenced by the negligibly small BET (H2O) SSA determined using analysis of water vapor sorption isotherms. However, the total pore volume determined using water vapor sorption and sorption of liquid water is almost the same as the one found by analysis of nitrogen sorption isotherms. Ball milling is found to provide an improved bulk density of activated graphene and collapse of all pores except the smallest ones (<2 nm). A decrease in the activation temperature from 850 °C to 550 °C is found to result in materials with a narrow micropore size distribution and increased oxygen content. Elimination of mesopores using ball milling or a lower activation temperature provided materials with better specific capacitance despite a significant decrease (by ∼30%) of the BET (N2) SSA. The best gravimetric and volumetric capacitances in KOH electrolyte were achieved not for samples with the highest value of the BET (N2) SSA but for materials with 80–90% of the total pore volume in micropores and an increased BET (H2O) SSA. Comparing the performance of electrodes prepared using rGO and a-rGO shows that a more hydrophilic surface is favorable for charge storage in supercapacitors with KOH electrolyte.
Introduction
Supercapacitors are devices which store charge at the interface between electrodes and an electrolyte. Porous carbons are the most common materials for preparation of supercapacitor electrodes, most often in combination with aqueous electrolytes (e.g. KOH), organic electrolytes (e.g. ammonium salts dissolved in acetonitrile or propylene carbonate), and solvent-free ionic liquids.1,2 Disordered porous carbons produced e.g. from coconuts or wood (“Activated Carbon” (AC)) are widely used in commercial devices.3 Many other nanostructured carbon materials have also been demonstrated as promising for the preparation of supercapacitor electrodes, for example carbide derived porous carbons,4 carbon nanotubes (CNT),5 and, more recently, graphene-related materials (GRMs).6Graphene is widely considered as a very promising material for preparation of porous electrodes thanks to its excellent electrical conductivity and high theoretical surface area (2650 m2 g−1). However, single-layered graphene must be assembled into some three-dimensional structure for preparation of an electrode. The ideal supercapacitor structure of a graphene-related material (GRM) must provide an interconnected network of pores accessible to electrolyte ions, high surface area and good conductivity. When single layered graphene is used as the precursor for preparation of electrode materials, it is necessary to prevent the restacking of layers into a graphitic structure, provide some connection between individual sheets, and to ensure an optimal size of pores formed as a result of GRM assembly.7,8 Graphene oxide (rGO) is the most commonly used precursor for preparation of supercapacitor electrodes due to the possibility to produce it in bulk amounts.9 However, rGO can be considered only as a rather defective and partly oxidized form of graphene with lower conductivity and a SSA (N2) typically not exceeding 500–700 m2 g−1, which indicates a few-layered graphitic structure.10
The precursor rGO is assembled into electrodes using a variety of methods in combination with different types of binders which connect individual sheets into a 3D structure, spacers to prevent restacking into a graphitic structure and various added components to make composite structures.11,12 The performance of GRM based materials in supercapacitor electrodes is then mostly affected by the methods which allow one to assemble individual rGO sheets into a 3D structure.13
In this respect it might be beneficial to prepare supercapacitor electrodes starting from a material which has a rigid 3D structure and well-defined pore size. “Activated graphene” is a very promising example of a porous 3D material prepared using KOH activation of rGO (a-rGO).14–17 A BET surface area of a-rGO as high as ∼3000 m2 g−1 can be achieved, providing a significant increase compared to the precursor rGO.17,18 It is generally assumed that a high SSA is favourable for better performance of materials in supercapacitor electrodes. However, rather different results have been reported for a-rGO, even for materials with similar SSA values. For example, a gravimetric capacitance of up to 326 F g−1 was reported by C. Yin et al.,19 while most other studies provide values in the range of 90–170 F g−1.14,16,17,20 Further attempts to improve the performance of a-rGO electrodes have been reported through variation of the precursors, and modification of the structure and pore size distribution of these materials.20–22
Several studies show that achieving a maximal SSA requires exact control of the C/K loading ratio, temperature and time of activation.16,18,21 Moreover, we demonstrated recently that only using precursor rGO produced by rapid explosive thermal exfoliation of graphite oxide provides high SSA values.23 Surprisingly, commercial rGO produced using chemical reduction of GO dispersions was found to be not suitable for KOH activation.23 The explosive exfoliation of graphite oxide using microwaves or rapid thermal shock seems to be crucial for producing highly defective rGO which yields high SSA activated graphene.23 The activation procedure also yields significantly smaller SSA values if Brodie graphite oxide is used as a precursor for preparation of rGO and KOH activation,21,24 most likely due to the less defective state of this material compared to the more commonly used Hummers oxidation procedure.25,26
It should be noted that the SSA values reported for GRM supercapacitor electrodes are found typically using BET or DFT models for analysis of gas sorption isotherms, most often nitrogen or argon.17 It is highly debated how the SSA determined using these methods is related to the “true” surface area of a material, but it anyway provides an internally consistent set of values on a relative scale. A largely neglected issue is that the values obtained using nitrogen gas sorption are applied to the evaluation of supercapacitor electrodes which are operated in liquid and often aqueous electrolytes. It is clear that the surface area determined by sorption of nitrogen can be very different compared to the surface area available for sorption of water.27 The interaction of water with a hydrophilic/hydrophobic surface might be one of the decisive factors which affect penetration into small pores. Moreover, water insertion might affect the pore size e.g. due to the effects of swelling.28 One of the best examples demonstrating the difference in SSA determined by gas sorption and sorption of water is graphite oxide, which shows a negligible SSA if measured by nitrogen sorption and a relatively high surface area of several hundreds of m2 g−1 measured by water sorption or sorption of methylene blue.27,29
Dynamic vapor sorption (DVS) is a routine method for recording water sorption isotherms. Analysis of these isotherms allows one to evaluate the SSA of carbon materials by the standard BET method.30 However, the DVS method has rarely been used for characterization of carbon electrode materials. To our knowledge the correlation of the SSA determined by water vapour sorption has not yet been evaluated for the performance of activated graphene electrodes in supercapacitor devices.
Here we present a detailed study of the parameters which affect the performance of a-rGO materials in supercapacitor electrodes. A set of materials with a broad variation of SSA and pore size distribution was synthesized by KOH activation of rGO at various temperatures and using post-synthesis modification by ball milling. The SSA was estimated not only by the analysis of nitrogen sorption isotherms but also by dynamic water sorption. The total volume of pores which accommodate non-freezable water with a size below ∼2 nm was also determined using the DSC method. Our experiments demonstrate that the performance of activated graphene materials in supercapacitor electrodes is defined by several parameters in a delicate balance of SSA, hydrophilicity, micropore volume and conductivity.
Experimental
Two sets of a-rGO were synthesized aiming to provide materials with large variations of SSA values and pore size distribution. The first set of samples was prepared using the ball milling of an a-rGO sample with a BET surface area of ∼3000 m2 g−1 and the second set was prepared using the same rGO precursor but activated at different temperatures in the range of 550–850 °C.Two grams of a-rGO precursor material (named in the following as the REF sample) was prepared for milling experiments using KOH activation at 850 °C using a procedure optimized for the highest BET (N2) SSA. Commercial Abalonyx graphite oxide, prepared by the modified Hummers method with C/O = 1.99 and 0.94 at% of sulphur impurities (determined by XPS) was used as the precursor. Excluding oxygen added to the material as a sulphate the C/O ratio is corrected to 2.3. The graphite oxide was subjected to rapid explosive thermal exfoliation by inserting it into a hot furnace (235 °C) for 2 min. The powder rGO was then used to prepare high surface area a-rGO.10,18 The KOH-activation procedure was slightly modified by using an optimized KOH/rGO weight ratio of 8, and a water/ethanol (30%/70%) mixture for KOH soaking instead of toxic methanol.31 The standard heat treatment included 40 min annealing at 850 °C. The target temperature was achieved in ∼140 min starting from ambient temperature. The final product was washed to remove the reaction products and subjected to high energy ball milling for varied times of up to 120 min. A Retsch Mixer Mill MM400 vibromachine was used with an agate cell of 5 ml volume, a typical material loading of 150 mg, one agate ball and a 30 oscillations per minute frequency. A separate set of a-rGO samples was produced using KOH activation at temperatures below 850 °C down to 550 °C.
All samples were characterized using the analysis of nitrogen sorption isotherms to obtain the BET SSA and pore size distribution. The nitrogen sorption isotherms were measured using a Quantachrome Nova 1200e surface area & pore size analyzer at liquid nitrogen temperature. The relative pressure interval P/P0 for the BET plot was selected using a procedure optimized for microporous materials.32 A slit pore Quenched Solid Density Functional Theory (QSDFT) equilibrium model was used to evaluate the cumulative SSA, pore volume and pore size distributions. The errors in estimation of the SSA (N2) are below ±5 m2 g−1 for all the tested samples.
To prepare electrodes for tests in supercapacitor devices the a-rGO powder was mixed with poly(tetrafluoroethylene) in a weight ratio of 8![[thin space (1/6-em)]](https://www.rsc.org/images/entities/char_2009.gif) :
:![[thin space (1/6-em)]](https://www.rsc.org/images/entities/char_2009.gif) 1 and some ethanol was added. The ethanol-wetted paste was compressed in a piston cylinder cell at 50 MPa to make 12 mm diameter pellets with typical weight 3–8 mg depending on the density of the material. To ensure a homogenous thickness of the pellets the pressure loading–release cycle was applied nine times. Then the electrodes were dried in a vacuum oven overnight at 100 °C.
1 and some ethanol was added. The ethanol-wetted paste was compressed in a piston cylinder cell at 50 MPa to make 12 mm diameter pellets with typical weight 3–8 mg depending on the density of the material. To ensure a homogenous thickness of the pellets the pressure loading–release cycle was applied nine times. Then the electrodes were dried in a vacuum oven overnight at 100 °C.
Electrochemical measurements were performed using two-electrode cells. Two round-shaped electrodes with a thickness of 100 (±10) μm and a similar mass (maximum difference ∼15%) prepared using the compression procedure described above were placed between stainless steel plates (current collectors) and separated from each other by a porous film (Celgard 3501). Aqueous 6 M KOH solution was used as the electrolyte. All electrodes were soaked in 6 M of KOH for a minimum of 24 h prior to assembling the supercapacitor devices. Larger electrode samples (40–50 mg) were prepared using the same treatment in order to verify the BET SSA using the analysis of nitrogen sorption isotherms. Electrochemical measurements were performed using an Autolab PGSTAT204/FRA32M module. CV curves were collected over a voltage range of 0 to 1 V at scan rates of 50, 100, 200 and 500 mV s−1. Galvanostatic charge/discharge curves were collected at current densities of 1, 2, 3 and 5 A g−1. The specific capacitance per electrode (Cs) was calculated from the galvanostatic discharge curves using the equation
SEM imaging was performed using a Zeiss Merlin FEG-SEM microscope. STEM images were obtained using a HITACHI HD-2700 microscope operating at an accelerating voltage of 200 kV. A Panalytical X'pert X-ray diffractometer with Cu-Kα radiation (λ = 1.5418 Å) was used to record the diffraction patterns. XPS spectra were recorded with a Kratos Axis Ultra electron spectrometer equipped with a delay line detector. A monochromatic Al Kα source operating at 150 W, a hybrid lens system with a magnetic lens, providing an analysis area of 0.3 × 0.7 mm, and a charge neutralizer were used for the measurements. The binding energy scale was adjusted with respect to the C1s line of aliphatic carbon, set at 285.0 eV. All spectra were processed with the Kratos software.
The DSC method was used to evaluate the volume of pores with diameters below 2 nm accessible to water. It is known that the melting point of water decreases as a function of pore size by as much as ∼60 degrees for 3 nm diameter pores. The freezing and melting of water in the smallest pores (D < 2 nm) is not observed.34 This effect is routinely used for evaluation of the solvent amount sorbed by porous materials at the temperature of solvent (water) melting Tm.35 The sample immersed in excess water is cooled below the freezing temperature of water and then heated back to record the DSC trace across the melting transition. The non-freezable water does not contribute to the measured melting enthalpy. Therefore, the main melting peak of bulk water will be smaller compared to that expected for a known amount of water loaded into the cell. The decrease in melting enthalpy measured using DSC allows calculation of the amount of solvent sorbed by the material in pores with size below ∼2 nm. The quantitative measurements rely on heating traces with a scanning rate of 5 K min−1.
Dynamic vapor sorption (DVS) data were recorded by a using DVS Advantage® system equipped with a SMS UB-1 balance with 0.1 μg sensitivity and dry air as a carrier gas. All samples were dried at 0% humidity for 2 h at ambient temperature and for 30 min at 105 °C. For testing graphite oxide the heating step was omitted to avoid thermal degradation of the material. Each point of the DVS isotherm corresponds to the value of sorption achieved after the weight equilibration within 0.005% per min. If this level of weight equilibration was not achieved, the measurement was stopped after 900 min of exposure to vapor at a given pressure. All data were recorded at a 25 °C temperature. The weight signal was collected in range of 0–10% relative humidity with step 1%, 10–20% with 2.5%, 20–50% with 5% and 50–95% with 10% for adsorption and 0–95% with step 20% for desorption. The average time per one isotherm was 3 days. The errors in the values of BET (H2O) determined by DVS are estimated to be below 1%.
Results and discussion
Graphene scaffold material with maximal surface area (reference sample)
The first part of the results provides detailed characterization of the a-rGO material prepared using KOH activation optimized for maximal SSA (∼3000 m2 g−1). This sample (named in the following as the reference sample, REF) was used as the precursor to prepare the set of samples with modified SSA and pore size by ball milling.As expected from our earlier studies, the REF sample of a-rGO material showed disordered structure from XRD and low oxygen content (C/O = 31.6) according to XPS (Fig. S1 and S2 in the ESI†).
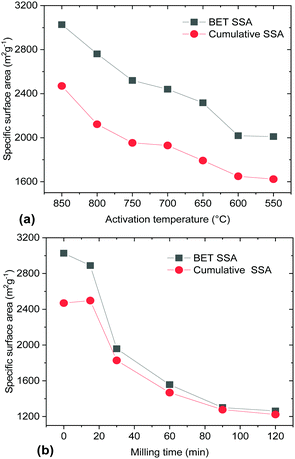
The surface area and pore size distribution of the REF a-rGO sample were characterized using analysis of nitrogen sorption isotherms (Fig. 1). The isotherm shape corresponds to type II, which is typically assigned to slit pores (Fig. S3 in the ESI†). A SSA value of 3030 m2 g−1 was obtained for this sample using the BET method and a cumulative SSA of 2470 m2 g−1 using the QSDFT model. Nitrogen sorption isotherms were recorded also directly from electrode samples prepared using the REF sample, revealing a 10–20% smaller SSA compared to the precursor material due to the addition of the binder and compression. The analysis of the nitrogen sorption isotherm using the QSDFT slit pore model shows that almost 100% of the pore volume is in pores with diameter below 4 nm. The pore size distribution shows two parts with ∼30% of the volume in micropores (two peaks centered at ∼0.9 nm and 1.7 nm) and 70% in mesopores (main peak at 3.3 nm) (Fig. 1).
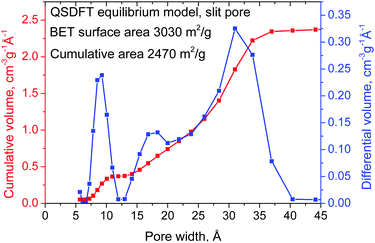 | ||
| Fig. 1 Pore size distribution and cumulative pore volume calculated using the QSDFT equilibrium model for the N2 sorption isotherm. | ||
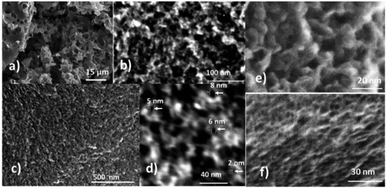
High resolution microscopy shows a complex hierarchical pore network with the smallest pores of a few nanometers but also rather large voids with a few micrometer size (Fig. 2). The high volume of micropores is an advantage for application of the material in supercapacitor electrodes. In contrast, large voids provide negligible contribution to the surface area but significantly reduce the bulk density of the material (∼0.1 g cm−3). As shown below, simple mechanical crushing allows us to eliminate these larger voids and to improve the bulk density.
The performance of the REF sample as an electrode material was tested in a supercapacitor cell with 6 M KOH electrolyte (Fig. 3). The results are in good agreement with earlier reports in terms of gravimetric (102 F g−1) and volumetric capacitance.17,20 The REF sample of a-rGO shows high gravimetric capacitance in KOH electrolyte but a substantial drop in performance in the process of cycling (Fig. 3c). Note that the cycling stability of “activated graphene” was reported in previous publications only once and only up to ∼1000 cycles.36
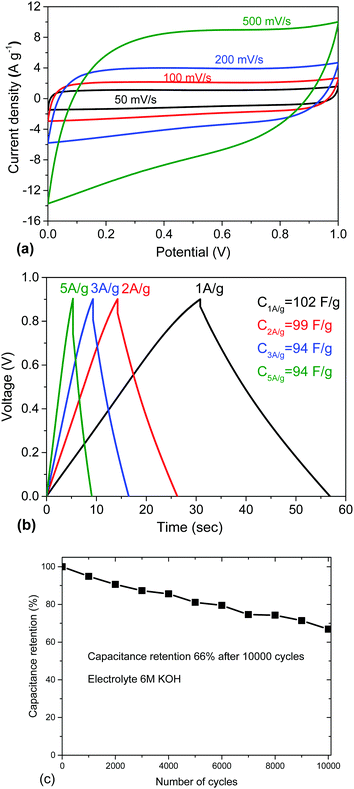 | ||
| Fig. 3 Electrochemical testing of a-rGO (REF sample) in 6 M KOH electrolyte: (a) CV curves recorded using scan rates 50 mV s−1, 100 mV s−1, 200 mV s−1, and 500 mV s−1. (b) Galvanostatic charge–discharge curves recorded with current density 1 A g−1, 2 A g−1, 3 A g−1, and 5 A g−1, and (c) cycling stability. (See also the ESI† for additional information about the electrochemical characterization of the electrodes prepared using this material with some variations of the electrode preparation procedures, Fig. S6–S8.) | ||
Modification of a-rGO using variation of the activation temperature and post-activation ball milling
As expected, significant improvement of the a-rGO bulk density (up to 0.5–0.6 g cm−3) was observed already with rather mild ball milling (30 min) due to elimination of larger voids (Fig. 4).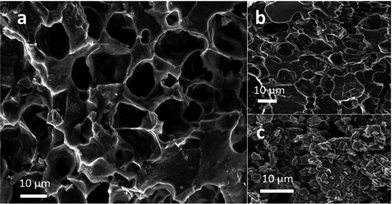 | ||
| Fig. 4 SEM images of (a) the pristine REF sample of a-rGO (3030 m2 g−1) showing large micrometer sized voids; (b) a-rGO activated at 550 °C and (c) the REF sample after 30 minutes of ball milling. | ||
A maximal bulk density of the assembled electrodes of up to 0.75 g cm−3 was achieved using milled a-rGO. However, milling also affected the distribution of the pore size on the nm scale.
Both milling and a decrease of the activation temperature resulted in materials with progressively smaller SSA (Fig. 5). Surprisingly, the samples produced using lower activation temperatures (<700 °C) maintained a high BET SSA (>2000 m2 g−1). That is in contrast to the earlier study by Y. W. Shu et al. which reported a BET SSA of ∼700 m2 g−1 for a material prepared by activation at 600 °C.16 A lower KOH/material ratio and only 1 h activation were used in this study. A longer duration of annealing at maximal temperature (3–4 h) was used by Yin et al.19 providing results which are in good agreement with our study (2450 m2 g−1 for activation at 600 °C). Mechanical treatment also resulted in a decrease of the BET SSA, which dropped to ∼2000 m2 g−1 already after 30 min of milling.
Surprisingly, both ball milling and the decrease of the activation temperature resulted in a very similar change in the pore size distribution, providing essentially microporous materials (Fig. 6). It is found that the milling treatment results in the collapse of not only the large micrometer sized voids, but also almost complete elimination of all mesopores. Remarkably, the volume of micropores remained almost the same even after relatively long ball milling, while the volume of pores with size >2 nm decreased dramatically. The sharp peak which corresponds to a pore width of ∼3 nm is strongest in the REF sample but it is not found already for the samples subjected to rather mild 30 min milling (Fig. 6).
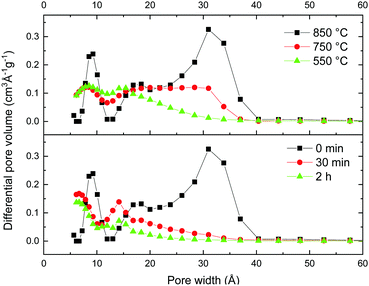 | ||
| Fig. 6 Evolution of the pore size distribution for materials activated using different temperatures (top panel) and materials prepared using ball milling of the REF sample (bottom panel). Analysis performed using the QSDFT equilibrium model for N2 sorption isotherms. (Full data sets available in the ESI,† Fig. S4.) | ||
The total pore volume of the milled samples decreases from ∼2.4 cm3 g−1 to 1 cm3 g−1 but the micropore volume remains almost unchanged. As a result, ball milling provides essentially microporous materials with 80–85% of the total volume in pores with width below 2 nm (Fig. 7a). The lower mechanical stability of macropores could be anticipated prior to our experiments but precise elimination of mesopores is an unexpected result.
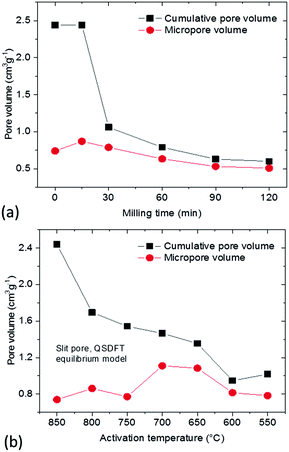 | ||
| Fig. 7 Cumulative pore volume (QSDFT model) and micropore volume of: (a) materials prepared using ball milling of the REF sample; (b) a-rGO materials activated using different temperatures. | ||
A similar pore size distribution was found also for samples synthesized using lower activation temperatures without any post-synthesis mechanical treatment. A cumulative pore volume of 1 cm3 g−1 was found for the sample prepared at 550 °C and ∼85% of this pore volume is due to micropores (Fig. 7b). Moreover the pore size distribution shows similar maxima for both materials prepared using low activation temperature and ball milling (∼0.8 nm and ∼1.4 nm) and similar SSA values (∼2000 m2 g−1 BET SSA for the sample milled for 30 min and the sample prepared at 550 °C).
The materials produced by ball milling and variation of the activation temperature were used to prepare electrodes and characterized for their performance in supercapacitor cells in order to evaluate the structure vs. capacitance trends. The results of these tests are summarized in Fig. 8 and 9 and Fig. S9–S21 in the ESI.†
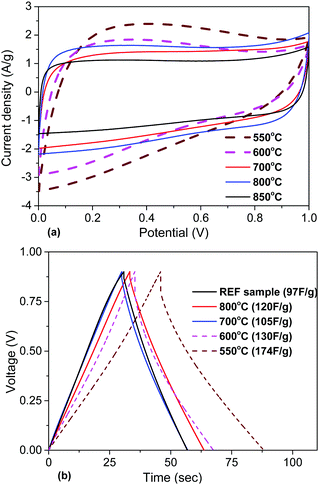 | ||
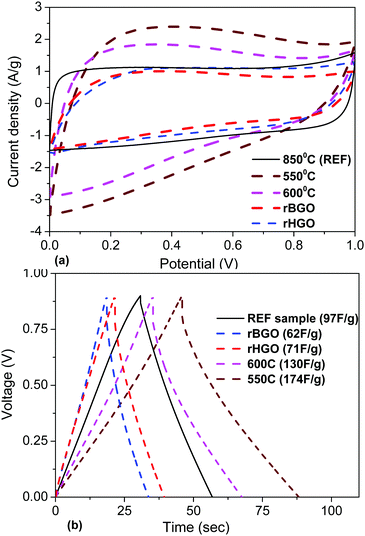
| Fig. 8 Electrochemical analysis of materials obtained using KOH activation at different temperatures (550–850 °C): (a) CV curves at 50 mV s−1. (b) Charge/discharge curves recorded at a 1 A g−1 current density (see the ESI† for more details, Fig. S14–S21). | ||
The electrochemical analysis of a-rGO materials activated at lower temperatures reveals a strong difference in the CV curve shapes. The CV curves of the samples activated at 550–600 °C show a deviation from the typical rectangular shape and become more triangular, which can be interpreted as the presence of surface redox processes. According to the analysis of the charge/discharge data, the gravimetric capacitance of these two samples is higher compared to the materials obtained at temperatures above 600 °C. Also there was an increase in the potential drop in the charge/discharge curves and charging time. This is connected to the lower conductivity of materials synthesized below 600 °C due to the presence of additional oxygen groups on their surface.
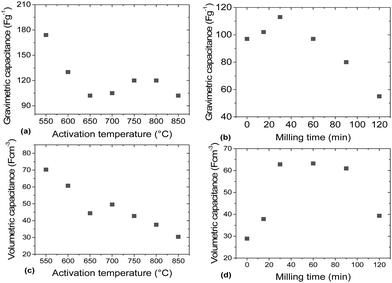
The gravimetric and volumetric capacitances of the a-rGO electrodes as a function of activation temperature and as a function of milling time are summarized in Fig. 9. Fig. 9a shows a non-monotonic trend with a significant increase of the gravimetric capacitance for the samples synthesized below 650 °C. At the same time the volumetric capacitance shows an almost linear increase upon lowering the activation temperature. The highest gravimetric and volumetric capacitance values (174 F g−1 and 70 F cm−3 (1 A g−1)) were obtained for the a-rGO material activated at 550 °C. Note, however, that the shape of the CV curves obtained for the samples activated at low temperatures deviates significantly from the square-like loops observed for the REF sample activated at 850 °C. The deviation from the square shape of the CV curves and the non-linear charge–discharge curve in constant current experiments suggests the presence of a charge storage mechanism additional to double-layer charging, e.g. due to pseudo-capacitance. The data shown in Fig. 9 were obtained using the “best practice method”,37 which suggests using the upper part of the discharge curve to calculate specific capacitance. A somewhat higher value of 190 F g−1 is found for the 550 °C sample if total integration is used as recommended for strongly non-linear discharge curves in ref. 38. The sample also shows lower cycling stability, showing 64% (“best practice”) or 49% (integration method) capacitance retention after 10![[thin space (1/6-em)]](https://www.rsc.org/images/entities/char_2009.gif) 000 charge–discharge cycles (see the ESI†).
000 charge–discharge cycles (see the ESI†).
The main purpose of the milling treatment was to improve the volumetric parameters of the supercapacitor electrodes. Indeed, an almost 3-fold improvement of volumetric capacitance was observed for the REF material milled for 30 minutes, achieving ∼65 F cm−3. Notably, mild milling also results in improved gravimetric capacitance, from 95 F g−1 to 115 F g−1, after 30 minutes of milling. Longer milling time was found to result in degradation of performance.
Analysis of the correlations between the structural parameters of a-rGO and the performance in supercapacitors
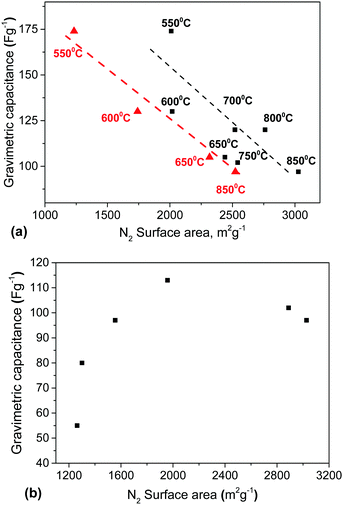
It is generally assumed that a large material surface area is an advantage for supercapacitor electrodes. However, our results demonstrate a negative correlation between SSA values above 2000 m2 g−1 and gravimetric capacitance (Fig. 10). Remarkably, elimination of mesopores in both the milled samples and samples prepared using lower activation temperature resulted in better electrode performance despite a decrease of the BET N2 SSA by ∼30% down from the maximal value of ∼3000 m2 g−1.To provide insight into the mechanism of charge storage we analyzed several other parameters which could possibly affect the performance of the a-rGO in supercapacitor electrodes:
– a change of SSA in the process of electrode fabrication,
– a difference between the surface area measured using nitrogen sorption and water sorption, and
– the oxygen content and closely related hydrophobic/hydrophilic nature of the pores.
First, we verified the SSA (N2) of the electrodes prepared using the samples activated at different temperatures. Typically the surface area of the electrodes decreased by 15–20% compared to the precursor materials due to the addition of the binder and as a result of material processing. However, the difference between the SSA of the material and electrode was much stronger for the sample activated at 550 °C (2010 m2 g−1 and 1230 m2 g−1, respectively). The lower temperature of activation does not provide a rigid 3D structure of the resulting material. The precursor rGO sheets are likely to be more loosely connected to each other in that sample, which makes the material more sensitive to mechanical modification in the process of compaction and electrode forming. Nevertheless, the negative correlation between the SSA (N2) and gravimetric capacitance is even clearer for the SSA of the electrodes than for the precursor materials (Fig. 10a).
The next possible reason for the negative correlation between the surface area and capacitance could be connected to the SSA analysis method, which is based on sorption of nitrogen, whereas the performance of the electrodes is measured in an aqueous electrolyte. The filling of a-rGO pores by water could be rather different compared to nitrogen not only due to different molecule sizes but mainly due to the effects of the interaction with the carbon surface. Nitrogen penetrates hydrophilic and hydrophobic pores equally well.
However, the mechanism of water penetration into nanometer-sized hydrophobic carbon pores is not trivial and strongly controversial both from the experimental and theoretical points of view. Therefore, we analyzed the water sorption properties of a-rGO materials using methods which characterize water vapor sorption and liquid water sorption.
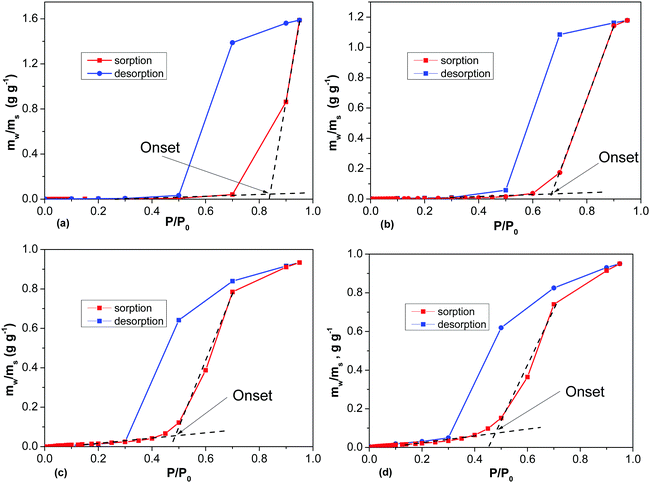
Water vapor sorption isotherms were recorded at ambient temperature for several samples (Fig. 11 and Table 1). The analysis of the water sorption isotherms allows us to estimate the BET surface area, and to evaluate the pore volume using the total sorption of water at maximal humidity and the mechanism of sorption using analysis of the isotherm shape. The same equations are used to evaluate the BET surface area for water and nitrogen sorption isotherms. However, the values of SSA determined by water sorption appeared to be surprisingly small. For example, the analysis of the REF sample (BET SSA 3030 m2 g−1 by N2 sorption) using water DVS provides a nearly negligible SSA (H2O) value of 8 m2 g−1, reflecting the strongly hydrophobic nature of the material (Fig. S22 in the ESI†). However, the total mass increase of a-rGO due to sorption of water vapor is over 90%.
| Name | Onset position P/P0 | Amount of adsorbed water at the onset, g g−1 | H2O BET SSA, m2 g−1 | Maximum H2O sorption/pore volume, g g−1/cm3 g−1 | N2 BET SSA, m2 g−1 |
|---|---|---|---|---|---|
| REF sample | 0.88 | 0.02 | 8 | 0.87 | 3030 |
| 30 min milling | 0.47 | 0.03 | 40 | 0.65 | 1958 |
| 60 min milling | 0.46 | 0.03 | 34 | 0.55 | 1537 |
| 120 min milling | 0.43 | 0.04 | 50 | 0.44 | 1263 |
| “750 °C” | 0.84 | 0.04 | 12 | 1.58 | 2542 |
| “700 °C” | 0.67 | 0.04 | 27 | 1.17 | 2440 |
| “600 °C” | 0.49 | 0.05 | 72 | 0.93 | 2018 |
| “550 °C” | 0.47 | 0.07 | 89 | 0.95 | 2010 |
| rGO | No onset | No onset | 113 | 0.21 | 329 |
| GO | No onset | No onset | 345 | 0.47 | — |
| Porous carbon | 0.48 | 0.02 | 25 | 0.81 | 2017 |
The analysis of the isotherm shape shows the presence of sharp upturns. This type of upturns is typically explained by condensation of water in the material pores and characterized by the value of the onset pressure P/P0. Fig. 11 shows the highest condensation onset value for the REF sample activated at 850 °C and smaller onset pressures for materials prepared at lower temperatures. Lower activation temperatures also resulted in materials which demonstrate smaller hysteresis between the sorption and desorption parts of the H2O isotherm (Fig. 11). The milling treatment of a-rGO resulted in an increase of the BET SSA (H2O) from 8 m2 g−1 up to 30–50 m2 g−1, while the shape of the water sorption isotherms remained similar in general (Table 1 and Fig. S23 in the ESI†).
The data shown in Fig. 11 and Table 1 are consistent with the strongly hydrophobic nature of a-rGO. Both ball milling and a decrease of the activation temperature were found to result in higher oxygen content and somewhat higher but still very small BET (H2O) values <100 m2 g−1 (Table 1). The highest value of the BET SSA (H2O) was found for the precursor rGO, which showed a relatively small value of 329 m2 g−1 by N2 sorption and 113 m2 g−1 by water sorption (Fig. S24 in the ESI†). The DVS water isotherm was recorded also for the graphite oxide sample as a reference example of a hydrophilic material. The graphite oxide showed a significantly higher BET (H2O) value of 345 m2 g−1 in agreement with the high oxygen content of the material (C/O = 2.6), Fig. S24 in the ESI.†
In general, DVS water sorption is considered as a method to characterize the hydrophobicity/hydrophilicity of materials. The very low BET (H2O) values observed for a-rGO with the highest N2 SSA and porous carbon are directly related to the low oxygen content of these materials and their hydrophobic nature. The increased hydrophilicity of these materials is in agreement with the higher oxygen content found by analysis of XPS data (Fig. S25 in the ESI†).
The relatively high BET (H2O) SSA of rGO is explained not only by the higher oxygen content but also by the absence of micropores in powder rGO. Reduced graphene oxide powder is composed of loosely packed flakes with the absence of a well-defined 3D structure. As a result, water can access most of the rGO surface without penetration into small pores. The cumulative pore volume of rGO is typically distributed over a broad range of pores with sizes up to tens of nm. In contrast, the pore volume of a-rGO is entirely due to micropores and mesopores (<4 nm). A relatively high BET (H2O) SSA was also found for graphite oxide thanks to the hydrophilic nature of this material. The main mechanism of GO water sorption is inter-lamellar swelling. The surface of GO is accessible due to swelling and intercalation of water into the interlayers of the structure. Note that rGO and GO showed isotherms without condensation steps (Fig. S24 in the ESI†) and the onset value is omitted for these materials in Table 1.
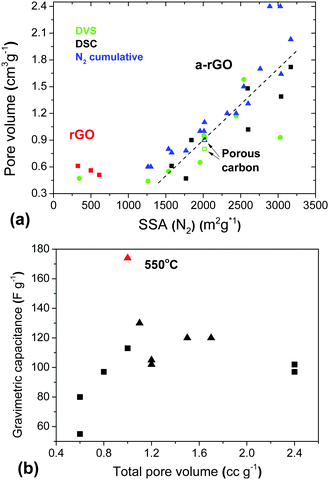
A remarkable result of the DVS experiments with a-rGO is the high total pore volume determined using water vapor sorption in combination with a very low BET (H2O) surface area. The micropores of a-rGO are hydrophobic and not filled with water at low P/P0. However, at higher humidity the pores are filled with water through condensation providing a high total pore volume. Moreover the total pore volume determined using water DVS is in good agreement with the pore volume found by analysis of the N2 sorption isotherms (Fig. 12).
Finally, the pore volume found by analysis of gas sorption (H2O and N2) is in good agreement with the sorption of liquid water determined using the DSC method. This method evaluates the amount of water sorbed in pores with a diameter below ∼2 nm.34 These micropores accommodate only the water which does not show melting and freezing upon heating/cooling cycles. However, a good correlation between the BET SSA and total pore volumes determined using water vapor, liquid water and N2 sorption is observed only for materials which are essentially microporous (SSA range ∼1250–3000 m2 g−1). The rGO samples showed a larger total pore volume in agreement with the pore size distribution, which includes significant contributions from meso- and macropores.
Considering only the a-rGO samples, the total pore volumes found by all three methods (Fig. 12) provide similar results with respect to the correlation with the gravimetric capacitance of the supercapacitor electrodes. Similar to the correlation with the SSA, the best gravimetric capacitance is found not for the samples with the largest total pore volume (Fig. 12b) and not for the samples with the largest micropore volume (Fig. S26 in the ESI†).
The maximal values of gravimetric capacitance for the materials treated by milling (113 F g−1) and by variation of the activation temperature (174 F g−1, 1 A g−1) correspond to similar values of the total pore volume of ∼1 cm3 g−1 and 80–85% of the pore volume in pores with size <2 nm, which corresponds to a micropore volume of about 0.8 cm3 g−1.
One of the most important parameters which define the performance of electrodes is their conductivity. The highest conductivity in the set of milled samples is indeed found for the sample with the highest gravimetric capacitance (30 min) (Fig. 13a). Collapse of micrometer sized voids due to mechanical treatment results in a larger number of connection points between sample grains. However, for the temperature activated samples the trend is exactly opposite: the best gravimetric capacitance is found for the materials activated at low temperatures and exhibiting the lowest conductivity (Fig. 13b).
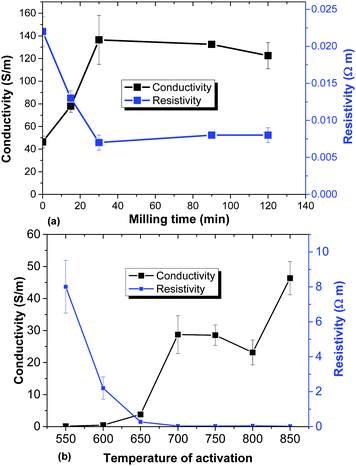 | ||
| Fig. 13 Conductivity and resistivity of a-rGO electrodes prepared using: (a) samples synthesized using ball milling of the high SSA REF sample and (b) variation of the activation temperature. | ||
The conductivity of the a-rGO materials is directly related to their oxidation degree. As verified using XPS data, the lowest oxygen content is found in samples activated at 750 °C and 850 °C (the REF sample) with C/O = 31.6 and C/O = 48.6 respectively. Milling treatment of the REF sample for 30 min results in an increase of the oxygen content, providing C/O = 15.5, and it remains almost unmodified even after prolonged treatment (C/O = 15.7 for 120 min). The sample activated at the lowest temperature of 550 °C with the highest gravimetric capacitance and largest resistivity also showed the highest concentration of oxygen (C/O = 11.6). The higher amount of oxygen is also in good correlation with the increased hydrophilicity of the samples activated at lower temperatures demonstrated by the DVS data (Fig. 11).
Summarizing this section, it can be concluded that none of the studied parameters including the SSA (N2) and SSA (H2O), pore volume (N2, H2O-DSC, and H2O-DVS) and conductivity can be alone directly correlated with the performance of a-rGO materials in supercapacitor electrodes. The best performance of activated graphene is found not for materials with the highest SSA or pore volume or conductivity. It can be concluded that a delicate balance between all these parameters is required to achieve the highest gravimetric capacitance.
Independent of the method of preparation, the highest gravimetric capacitance was found for the a-rGO materials with an SSA (N2) value of ∼2000 m2 g−1 and a total pore volume of ∼1 cm3 g−1. It seems essential that the best samples demonstrate about 80–90% of the total pore volume in the form of micropores (<2 nm). At the same time, these samples show a somewhat higher oxidation degree and improved hydrophilicity compared to the reference sample with the highest SSA value of 3030 m2 g−1.
Reduced graphene oxide as an electrode material in supercapacitors
It is interesting to compare the performance of rGO and a-rGO materials as electrodes in supercapacitors. As cited in the Introduction section, rGO powder needs to be formed into a 3D structure during electrode preparation while a-rGO already has a 3D structure which is largely preserved after forming electrodes. This general observation is confirmed in experiments with rGO and a-rGO electrodes prepared using the same procedures (see the Experimental section). For example, the SSA (N2) measured on precursor rGO powder is found to decrease significantly after addition of binders and pressing into pellets. Two types of rGO powders were tested in our experiments: one produced by explosive exfoliation of Brodie GO (rBGO) and a second one produced by chemical reduction of Hummers GO (rHGO) (Graphenea). The rBGO powder has a very low bulk density and had to be milled for 5 min to provide better compaction prior to preparation of electrodes. The SSA (N2) of rBGO decreased dramatically after the milling treatment (552 m2 g−1 to 189 m2 g−1). The analysis of nitrogen sorption isotherms also showed a dramatic decrease in the SSA values relative to the precursor powders after electrode forming (440 m2 g−1 to 340 m2 g−1 for rHGO; 190 m2 g−1 to 70 m2 g−1 for rBGO). The rGO samples are also rather different compared to the a-rGO material in terms of pore size distribution with the largest fraction of pore volume in mesopores with a size of ∼3–4 nm (Fig. S27 and S28 in the ESI†). The micropore volume constitutes only a minor part of the total pore volume in the rGO electrodes.The electrochemical analysis of supercapacitor devices prepared using rBGO and rHGO (Fig. 14 and Fig. S29–S32 in the ESI†) showed surprisingly high values of gravimetric capacitance considering the relatively small SSA (N2). A gravimetric capacitance of 90–100 F g−1 (3 A g−1) was found for the rBGO and 70–80 F g−1 for the rHGO electrodes.
The BET (N2) SSA of the rGO electrodes is about 10 times smaller compared to a-rGO (3030 m2 g−1 and 90 F g−1 at 3 A g−1 for the REF sample), but anyway provides a gravimetric capacitance on the same level. The amount of charge stored per unit of surface area (N2) will then be 10 times higher for rGO compared to activated graphene. However, this observation is valid only for surface areas determined by nitrogen sorption. Water vapor sorption measured by the DVS method provides a 113 m2 g−1 BET (H2O) SSA value for the rGO sample and only 8 m2 g−1 for the REF sample (Table 1). The 14-fold higher water sorption surface area correlates with the higher oxidation degree of the rGO samples. A C/O ratio of about 5–6 is typically found for rGO while for a-rGO optimized for the highest BET SSA (N2) it is on the level of C/O = 30–40.
It can be concluded that the higher amount of oxygen in rGO provides more hydrophilic materials and is favorable for larger gravimetric capacitance in supercapacitor electrodes tested in KOH electrolyte. Note that the same trend was observed after analysis of all a-rGO materials: higher oxygen content provided better hydrophilicity and better performance in supercapacitor electrodes. However, the oxygen content in a-rGO could not be increased to the same level as in rGO. Remarkably, the gravimetric capacitance of the electrodes is relatively weakly affected by the decrease of conductivity due to addition of oxygen for the range C/O = 5–40. However, a further increase of the oxygen content is unlikely to improve the performance of the electrodes, e.g. it is known that GO with C/O = 2–3 shows negligibly small gravimetric capacitance due to its electrically insulating nature.28,39
Conclusions
Two types of materials (rGO and a-rGO) were tested as electrodes in a standard type of supercapacitor cells using a standard electrode preparation procedure. Moreover, a-rGO materials were prepared using two methods: (i) ball milling of a high SSA material and (ii) variation of the activation temperatures. Analysis of the data shows several trends which help to understand how the structure and composition of porous graphene-related materials could be optimized for the best performance in supercapacitor electrodes.– Highly hydrophobic materials are unfavorable for the best gravimetric capacitance in aqueous KOH electrolyte, most likely due to limitations in the penetration of water into the carbon pores.
– Increased oxidation of the graphene surface (from C/O = 30–40 up to C/O ∼ 5–6) results in a tenfold increase of gravimetric capacitance calculated per unit of SSA (N2).
– The best results with respect to the surface area-normalized gravimetric capacitance are obtained for materials with a higher BET SSA determined using analysis of water sorption isotherms.
– Comparing materials with a similar oxidation degree, the highest gravimetric and volumetric capacitance are achieved for materials with most of the pore volume in micropores (<2 nm).
– Ball milling of pristine a-rGO allows us to improve the volumetric capacitance and to prepare essentially microporous materials by the mechanical collapse of macro- and micropores. Similarly microporous materials can be produced using a lower KOH activation temperature of 550–600 °C.
– Elimination of mesopores improves the gravimetric and volumetric capacitance of a-rGO despite a significant decrease of the SSA by ∼30%. The mesopores are not essential for the performance of electrodes when micropores are arranged in interconnected 3D networks as in a-rGO.
– The two types of materials which were analyzed in this study do not provide an optimal combination of oxidation degree with high surface area. Electrodes prepared using rGO provide better hydrophilicity and high area-normalized capacitance, while a-rGO provides extremely a high surface area but only a small fraction of this surface area is available for water sorption.
– Our results indicate that an optimal material for preparation of supercapacitor electrodes must combine the very high surface area of a-rGO (∼3000 m2 g−1) with oxidation at the level of C/O = 5–6 to provide a similarly high SSA available for water sorption (DVS).
In the next step of our research we plan to test several methods for preparation of materials which combine very high SSA levels by both N2 sorption and by water vapor sorption.
Conflicts of interest
There are no conflicts to declare.Acknowledgements
The authors acknowledge funding from the European Union's Horizon 2020 Research and Innovation Program under grant agreement No 785219 and the Swedish Research Council grant (no. 2017-04173). M. K. acknowledges support through RFBR grant no. 18-33-00439. A. I., A. T., and S. L. acknowledge support from Kempestiftelserna. M. E. acknowledges funding from the Romanian Executive Agency for Higher Education, Research, Development and Innovation Funding, under project ROFCC (Contract no. 25PCCDI/2018). A. T. and M. E. thank COST Action CA 15107 “Multi-Functional Nano-Carbon Composite Materials Network” (MultiComp). S. L. thanks Bio4Energy, a strategic research environment appointed by the Swedish government. We also acknowledge support from the Vibrational Spectroscopy Platform of Umeå University and A. Shchukarev for technical support with XPS. The authors thank D. Carriazo and R. Mysyk for useful discussions and proofreading.References
- G. P. Wang, L. Zhang and J. J. Zhang, Chem. Soc. Rev., 2012, 41, 797–828 RSC.
- E. Frackowiak and F. Beguin, Carbon, 2001, 39, 937–950 CrossRef CAS.
- V. V. N. Obreja, A. Dinescu and A. C. Obreja, Int. Rev. Electr. Eng.-I, 2010, 5, 272–281 Search PubMed.
- J. Chmiola, C. Largeot, P. L. Taberna, P. Simon and Y. Gogotsi, Science, 2010, 328, 480–483 CrossRef CAS PubMed.
- E. Frackowiak, K. Metenier, V. Bertagna and F. Beguin, Appl. Phys. Lett., 2000, 77, 2421–2423 CrossRef CAS.
- C. G. Liu, Z. N. Yu, D. Neff, A. Zhamu and B. Z. Jang, Nano Lett., 2010, 10, 4863–4868 CrossRef CAS PubMed.
- Q. Q. Ke and J. Wang, J. Materiomics, 2016, 2, 37–54 CrossRef.
- E. Quesnel, F. Roux, F. Emieux, P. Faucherand, E. Kymakis, G. Volonakis, F. Giustino, B. Martin-Garcia, I. Moreels, S. A. Gursel, A. B. Yurtcan, V. Di Noto, A. Talyzin, I. Baburin, D. Tranca, G. Seifert, L. Crema, G. Speranza, V. Tozzini, P. Bondavalli, G. Pognon, C. Botas, D. Carriazo, G. Singh, T. Rojo, G. Kim, W. J. Yu, C. P. Grey and V. Pellegrini, 2D Mater., 2015, 2, 030204 CrossRef.
- Y. Wang, Z. Q. Shi, Y. Huang, Y. F. Ma, C. Y. Wang, M. M. Chen and Y. S. Chen, J. Phys. Chem. C, 2009, 113, 13103–13107 CrossRef CAS.
- A. G. Klechikov, G. Mercier, P. Merino, S. Blanco, C. Merino and A. V. Talyzin, Microporous Mesoporous Mater., 2015, 210, 46–51 CrossRef CAS.
- X. H. Cao, Y. M. Shi, W. H. Shi, G. Lu, X. Huang, Q. Y. Yan, Q. C. Zhang and H. Zhang, Small, 2011, 7, 3163–3168 CrossRef CAS PubMed.
- K. Zhang, L. L. Zhang, X. S. Zhao and J. S. Wu, Chem. Mater., 2010, 22, 1392–1401 CrossRef CAS.
- M. F. El-Kady, V. Strong, S. Dubin and R. B. Kaner, Science, 2012, 335, 1326–1330 CrossRef CAS PubMed.
- T. Kim, G. Jung, S. Yoo, K. S. Suh and R. S. Ruoff, ACS Nano, 2013, 7, 6899–6905 CrossRef CAS PubMed.
- W. Y. Tsai, R. Y. Lin, S. Murali, L. L. Zhang, J. K. McDonough, R. S. Ruoff, P. L. Taberna, Y. Gogotsi and P. Simon, Nano Energy, 2013, 2, 403–411 CrossRef CAS.
- S. Murali, J. R. Potts, S. Stoller, J. Park, M. D. Stoner, L. L. Zhang, Y. W. Zhu and R. S. Ruoff, Carbon, 2012, 50, 3482–3485 CrossRef CAS.
- Y. W. Zhu, S. Murali, M. D. Stoller, K. J. Ganesh, W. W. Cai, P. J. Ferreira, A. Pirkle, R. M. Wallace, K. A. Cychosz, M. Thommes, D. Su, E. A. Stach and R. S. Ruoff, Science, 2011, 332, 1537–1541 CrossRef CAS PubMed.
- A. Klechikov, G. Mercier, T. Sharifi, I. A. Baburin, G. Seifert and A. V. Talyzin, Chem. Commun., 2015, 51, 15280–15283 RSC.
- C. M. Yin, C. A. Tao, F. L. Cai, C. C. Song, H. Gong and J. F. Wang, Carbon, 2016, 109, 558–565 CrossRef CAS.
- S. Murali, N. Quarles, L. L. Zhang, J. R. Potts, Z. Q. Tan, Y. L. Lu, Y. W. Zhu and R. S. Ruoff, Nano Energy, 2013, 2, 764–768 CrossRef CAS.
- C. Zheng, X. F. Zhou, H. L. Cao, G. H. Wang and Z. P. Liu, J. Mater. Chem. A, 2015, 3, 9543–9549 RSC.
- Z. S. Wu, S. Yang, L. L. Zhang, J. B. Wagner, X. L. Feng and K. Mullen, Energy Storage Mater., 2015, 1, 119–126 CrossRef.
- A. Klechikov, J. H. Sun, G. Z. Hu, M. B. Zheng, T. Wagberg and A. V. Talyzin, Microporous Mesoporous Mater., 2017, 250, 27–34 CrossRef CAS.
- J. Ajuria, M. Arnaiz, C. Botas, D. Carriazo, R. Mysyk, T. Rojo, A. V. Talyzin and E. Goikolea, J. Power Sources, 2017, 363, 422–427 CrossRef CAS.
- P. Feicht, R. Siegel, H. Thurn, J. W. Neubauer, M. Seuss, T. Szabo, A. V. Talyzin, C. E. Halbig, S. Eigler, D. A. Kunz, A. Fery, G. Papastavrou, J. Senker and J. Breu, Carbon, 2017, 114, 700–705 CrossRef CAS.
- A. V. Talyzin, G. Mercier, A. Klechikov, M. Hedenstrom, D. Johnels, D. Wei, D. Cotton, A. Opitz and E. Moons, Carbon, 2017, 115, 430–440 CrossRef CAS.
- H. P. Boehm, A. Clauss, G. Fischer and C. Hofmann, Proc. 5th Conf. on Carbon, Oxford, Pergamon, 1962, pp. 73–80.
- J. H. Sun, A. Iakunkov, A. T. Rebrikova and A. V. Talyzin, Nanoscale, 2018, 10, 21386–21395 RSC.
- W. H. Slabaugh and C. V. Hatch, J. Chem. Eng. Data, 1960, 5, 453–455 CrossRef CAS.
- Y. H. Cho, H. W. Kim, H. D. Lee, J. E. Shin, B. M. Yoo and H. B. Park, J. Membr. Sci., 2017, 544, 425–435 CrossRef CAS.
- A. Iakunkov, A. Klechikov, J. H. Sun, T. Steenhaut, S. Hermans, Y. Filinchuk and A. Talyzin, Phys. Chem. Chem. Phys., 2018, 20, 27983–27991 RSC.
- J. Rouquerol, P. Llewellyn and F. Rouquerol, Characterization of Porous Solids VII – Proceedings of the 7th International Symposium on the Characterization of Porous Solids (Cops-VII), Aix-En-Provence, France, 26-28 May 2005, 2006, vol. 160, pp. 49–56.
- M. D. Stoller and R. S. Ruoff, Energy Environ. Sci., 2010, 3, 1294–1301 RSC.
- G. H. Findenegg, S. Jahnert, D. Akcakayiran and A. Schreiber, ChemPhysChem, 2008, 9, 2651–2659 CrossRef CAS PubMed.
- M. V. Korobov, A. V. Talyzin, A. T. Rebrikova, E. A. Shilayeva, N. V. Avramenko, A. N. Gagarin and N. B. Ferapontov, Carbon, 2016, 102, 297–303 CrossRef CAS.
- L. L. Zhang, X. Zhao, M. D. Stoller, Y. W. Zhu, H. X. Ji, S. Murali, Y. P. Wu, S. Perales, B. Clevenger and R. S. Ruoff, Nano Lett., 2012, 12, 1806–1812 CrossRef CAS PubMed.
- M. D. Stoller, S. Murali, N. Quarles, Y. W. Zhu, J. R. Potts, X. J. Zhu, H. W. Ha and R. S. Ruoff, Phys. Chem. Chem. Phys., 2012, 14, 3388–3391 RSC.
- A. Laheaar, P. Przygocki, Q. Abbas and F. Beguin, Electrochem. Commun., 2015, 60, 21–25 CrossRef CAS.
- D. T. L. Galhena, B. C. Bayer, S. Hofmann and G. A. J. Amaratunga, ACS Nano, 2016, 10, 747–754 CrossRef CAS PubMed.
Footnote |
| † Electronic supplementary information (ESI) available. See DOI: 10.1039/c9cp03327k |
| This journal is © the Owner Societies 2019 |


