
 Open Access Article
 This Open Access Article is licensed under a
 Creative Commons Attribution 3.0 Unported Licence
Ultrafast ring-opening and solvent-dependent product relaxation of photochromic spironaphthopyran†
Simon F.
Bittmann‡
 a,
Raison
Dsouza‡
ab,
Khalid M.
Siddiqui‡
a,
Stuart A.
Hayes
a,
Andreas
Rossos
a,
Gastón
Corthey
ac,
Michał
Kochman
ad,
Valentyn I.
Prokhorenko
a,
R. Scott
Murphy
e,
Heinrich
Schwoerer
a and
R. J. Dwayne
Miller
*af
a,
Raison
Dsouza‡
ab,
Khalid M.
Siddiqui‡
a,
Stuart A.
Hayes
a,
Andreas
Rossos
a,
Gastón
Corthey
ac,
Michał
Kochman
ad,
Valentyn I.
Prokhorenko
a,
R. Scott
Murphy
e,
Heinrich
Schwoerer
a and
R. J. Dwayne
Miller
*af
aMax Planck Institute for the Structure and Dynamics of Matter, Center for Free Electron Laser Science, Luruper Chaussee 149, 22761, Hamburg, Germany. E-mail: dwayne.miller@mpsd.mpg.de
bDepartment of Physics, University of Hamburg, Jungiusstrasse 9, 20355 Hamburg, Germany
cInstituto de Nanosistemas, Universidad Nacional de San Martin, San Martin, Buenos Aires, Argentina
dDepartment of Physics, Chemistry and Biology (IFM), Linköping University, Linköping, Sweden
eDepartment of Chemistry and Biochemistry, Research and Innovation Centre, University of Regina, 3737 Wascana Parkway, Regina, SK S4S 0A2, Canada
fDepartments of Chemistry and Physics, University of Toronto, 80 St. George Street, Toronto, ON M5S3H6, Canada
First published on 8th August 2019
Abstract
The ultrafast dynamics of unsubstituted spironaphthopyran (SNP) were investigated using femtosecond transient UV and visible absorption spectroscopy in three different solvents and by semi-classical nuclear dynamics simulations. The primary ring-opening of the pyran unit was found to occur in 300 fs yielding a non-planar intermediate in the first singlet excited state (S1). Subsequent planarisation and relaxation to the product ground state proceed through barrier crossing on the S1 potential energy surface (PES) and take place within 1.1 ps after excitation. Simulations show that more than 90% of the trajectories involving C–O bond elongation lead to the planar, open-ring product, while relaxation back to the S0 of the closed-ring form is accompanied by C–N elongation. All ensuing spectral dynamics are ascribed to vibrational relaxation and thermalisation of the product with a time constant of 13 ps. The latter shows dependency on characteristics of the solvent with solvent relaxation kinetics playing a role.
1 Introduction
Photochromic compounds exhibit dramatic changes in their structural, chemical and physical properties upon absorption of light which are generally reversible.1 This makes them suitable for promising applications, for instance as photoswitches,2–4 memory devices5,6 and as tools in biological imaging,7 motivating research on their synthesis and characterisation.8,9 An important class of photochromics is that of spiropyrans,10 which are composed of nearly orthogonal indoline and pyran subunits related by a common sp3-hybridised spiro-carbon atom, but can differ in their substituents (see Fig. 1). A common view of the photophysical properties of spiropyrans is that the two subunits are electronically uncoupled in the closed (spiro-) form and thus, its absorption spectrum lies in the ultraviolet (UV) region of the electromagnetic spectrum (λ < 400 nm). When a UV photon is absorbed by the molecule, the bond between the spiro-carbon and the oxygen in the pyran ring undergoes cleavage leading to a cascade of processes, including opening of the pyran ring, hybridisation of the spiro-carbon and conformational isomerisation. These structural changes yield a planar isomer called merocyanine (MC), in which the two moieties are linked by a methine bridge and become electronically coupled. The improved wave function overlap and delocalisation causes a reduction of the energy difference between the highest occupied and the lowest unoccupied molecular orbital giving rise to an intense absorption of the MC in the visible range. Consequently, the MC form appears coloured in solution. Eight different conformers are in principle possible due to an additional degree of freedom brought upon by the formation of the methine bridge. In Fig. 1, one such conformer is shown as an example. Which conformers are most stable depends on the respective spiropyran derivative11 and the solvent environment.12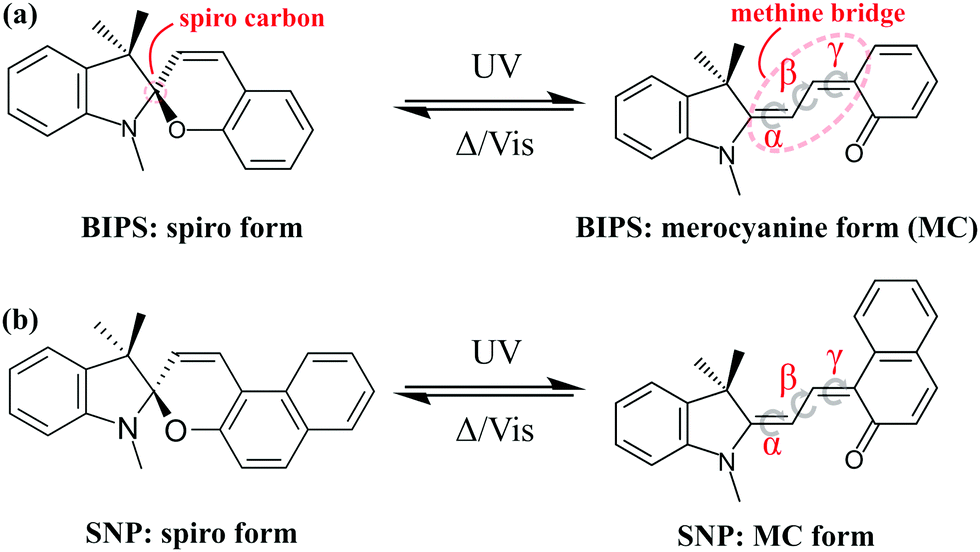 | ||
| Fig. 1 Photochemical reaction scheme of spiropyran conversion to merocyanine shown for indolinobenzospiropyran (BIPS, a) and indolinonaphthospiropyran (SNP, b). Due to rotation about the three bonds in the methine bridge (dihedral angles α, β and γ), up to 8 isomers are possible out of which the trans–trans–cis (TTC) configuration is shown. The reverse reaction can be achieved thermally or triggered with visible light. | ||
Understanding the fundamental photophysical processes of spiropyrans has been a matter of great interest for the photochemistry community. In 1952, Fischer and Hirshberg were the first to synthesise spiropyrans and also to characterise the role of temperature and the wavelength of light on the behaviour of this class of compounds.13 Since then, several studies have been carried out investigating different aspects, such as structural changes during the reaction, their time scales and the quantum yields of possible MC isomers.14,15
The most studied spiropyrans have been indolinobenzospiropyran (BIPS, see Fig. 1a) and its 6-nitro (–NO2) substituted analogues. However, the time scale for the ring-opening reaction remains a debated point. In the early 90's, Ernsting and co-workers reported the results of optical pump–probe experiments in the visible range carried out on BIPS solutions in n-pentane16,17 as well as ethanol18 and observed the formation of merocyanine species upon excitation at 308 nm with a rise time of ∼0.9 ps. They found that the spectrum in the 450–600 nm range at 30 ps resembled that of one recorded in the microsecond timescales suggesting that the product is well-established within this time frame. From a sterics argument they predicted the observed species to be either in a trans–trans–cis (TTC) or cis–trans–cis (CTC) conformation or both. A transient mid-infrared study in 2003 from Rini et al. cast doubt on the time scale of this photochemical reaction.19 Based on their measurements, they concluded that a rapid S1 → S0 internal conversion was the dominant relaxation channel with a quantum yield of ∼90%, while the remaining 10% goes into forming the product via an unknown intermediate with a time constant of 28 ps. On the other hand, a water soluble, pyridinium substituted BIPS, which can be expected to exhibit dynamics similar to BIPS, was investigated by Kohl-Landgraf et al. and the MC formation following 350 nm excitation was found to occur within a picosecond.20
Spironaphthopyran (SNP), which is closely related to BIPS (see Fig. 1b), has been reported to display transient photochromism even in the crystalline state.21 This renders it a promising target for time-resolved crystallographic studies, which have the capability to unambiguously resolve the question of the MC formation time scale and to provide insight into the structural isomerisation dynamics with atomic resolution,22 motivating our interest in this system.
For SNP, a rise time of 1.4 ps for the MC absorption band in solution has been reported.16,17 However, detailed transient absorption data with sub-ps resolution has only been measured up to 8 ps after UV excitation and only for the non-polar solvent n-pentane. As mentioned, the solvent environment is known to influence the equilibrium between different MC conformers depending on the solvent polarity and capability of forming hydrogen bonds.12 What role this plays towards the MC formation dynamics however warrants further investigation. Moreover, studies of unsubstituted spiropyrans have mainly been carried out with excitation directly to the S1 state (E ∼ 4 eV). Excitation into higher lying electronic states than S1 can lead to larger excess energies being deposited into the system which can potentially influence the outcome of a photochemical reaction.23–26 In this context, the solvent can play a determining role on the time scales of vibrational relaxation, as has been reported for instance in the case of 9-methyladenine.27
A number of theoretical studies concerning the ring-opening mechanism of spiropyran have been carried out more recently, treating smaller model systems at a high level of theory (CASPT2/CASSCF).28 These studies have provided useful insight into the relevant modes and reaction channels leading to either the closed or the open form, but give no direct information about the respective time scales. The latter can be obtained by carrying out excited state dynamics simulations, which has so far only been reported for BIPS.29
In this work, we investigated the photochemical dynamics of spironaphthopyran up to extended time scales (one nanosecond) using 266 nm femtosecond excitation (4.6 eV) and comparing between a non-polar (n-hexane), a polar aprotic (acetonitrile) and a polar protic (ethanol) solvent environment. We performed femtosecond transient absorption spectroscopy covering the visible (380–700 nm) as well as the ultraviolet spectral range (250–350 nm), where electronic changes associated with the ground state of the spiro-species can be observed. Furthermore, we carried out semi-classical excited state dynamics simulations treating the complete molecule with time-dependent density functional theory and simulating a sufficient number of trajectories to be able to compare the time scales between simulations and experiments. In addition to gaining insight into the ring-opening mechanism and the involved electronic states from theory, this makes it possible to differentiate between chemical reaction dynamics and product relaxation in the analysis of the spectroscopic data.
2 Methods
2.1 Computational methods
The modified-surface hopping dynamics are calculated using the adiabatic electronic energies and gradients calculated on the fly at time-dependent density functional theory (TDDFT) level of theory using the ab initio electronic structure package Gaussian 09.30 We treated the electronic structure of the SNP molecule with the use of density functional theory (DFT) for the ground electronic state in combination with (linear response) time-dependent DFT (TDDFT) for the relevant excited states. The reactant geometry of the ground state was optimized using DFT using CAM-B3LYP31 functional with a def2SVP32 basis set. CAM-B3LYP is a long range-corrected functional, owing to which its accuracy for excited-state potential energy surfaces is superior to conventional hybrid functionals. Subsequently, the first singlet excited state (S1) was optimised using the same functional and basis set using TDDFT within Tamn–Damncoff Approximation. These calculations were also performed using Gaussian 09.The simulations assumed that the vertical excitation was instantaneous, with an initial phase space distribution generated by using a vibrational Wigner distribution for the ground state minimum. The phase space coordinates were generated from the total distribution using Monte Carlo sampling. As a by-product of this sampling, the absorption spectra were also calculated from 500 configurations. A spectral window based on experimental excitation energy was used to pick the initial conditions. A total of 30 trajectories were chosen from a larger randomly selected set on the basis of the computed S0–S2 and S0–S3 transition probabilities (see ESI†). These trajectories were propagated for 1.1 ps with time steps of 0.5 fs in singlet excited states S2 and S3.
2.2 Experimental details
1,3,3-Trimethylindolino-β-naphthopyrylospiran (SNP) powder was purchased from TCI Chemicals, Japan and used without further purification. Spectroscopic grade n-hexane, ethanol and acetonitrile were used to prepare SNP solutions with a concentration of 1.5 mM. To obtain the respective spectra of merocyanine, the solutions were irradiated continuously with 266 nm laser light until reaching a photostationary state.Transient absorption experiments were performed using a titanium:sapphire (Ti:Sa) femtosecond laser system (800 nm central wavelength, 1 kHz). In all measurements, the samples were excited at 266 nm with a fluence of 4 mJ cm−2 (490 nJ pulse energy with a beam diameter of 120 μm FWHM) and a repetition rate of 500 Hz. The visible probe light (380–700 nm) was generated by focusing 800 nm pulses in water (200 μm cuvette), with the magic angle (54.7°)33 between the pump and probe polarisations. For the UV supercontinuum (250–350 nm), 400 nm pulses passing through a quarter-wave plate to create circular polarised light were focused in a rotating [001] calcium fluoride crystal.34 The polarisation of the resulting UV continuum was not modified and assumed to be circular. Sample solutions were flowed through an in-line UV-quartz cuvette with a 200 μm thin window. The transient absorption signal was calculated as:
 | (1) |
3 Results and discussions
3.1 Steady-state spectra
The UV/vis absorption spectra of 1.5 mM solutions of SNP in hexane, ethanol and acetonitrile are shown in Fig. 2. At thermal equilibrium, the molecules exist mainly in the closed form (SNP) which only absorbs below 380 nm. From this spectrum, three main bands can be seen, which show no significant solvent dependence.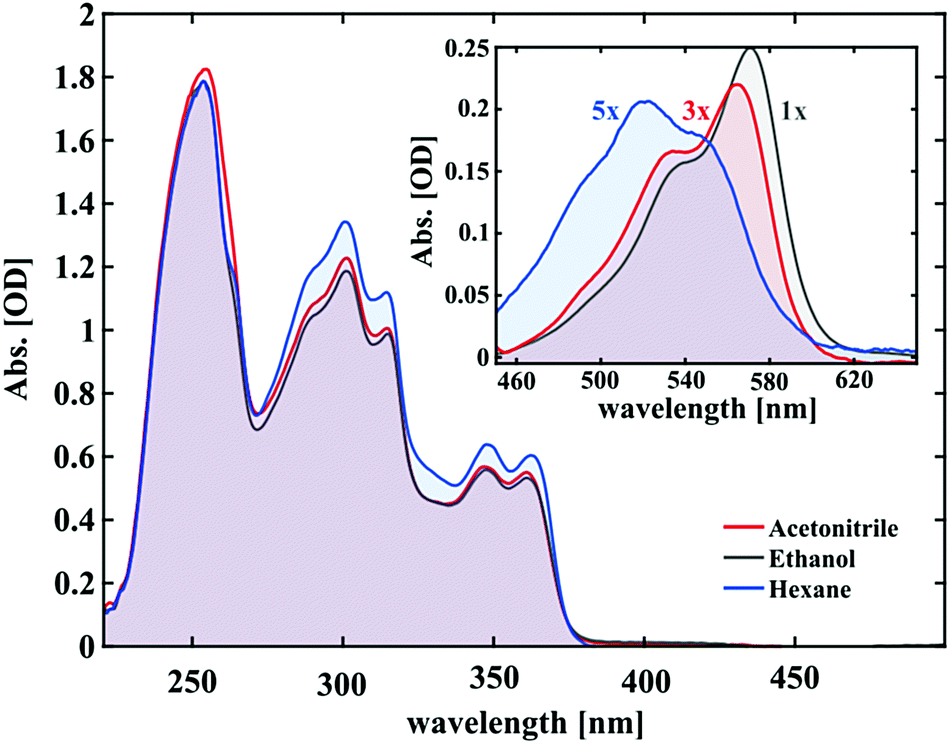 | ||
| Fig. 2 Steady-state absorption spectra of 1.5 mM SNP solutions in the UV and visible range. The inset shows the merocyanine spectra in the steady state under UV irradiation (photostationary state), scaled for comparison. | ||
The inset of Fig. 2 shows the respective absorption spectra of the merocyanine form in the photostationary state. Immediately obvious are their different shapes and/or positions. The MC spectrum in hexane displays a maximum at ∼520 nm and an additional spectral feature on either side of it. For acetonitrile and ethanol, once more at least three peaks can be deciphered. Two are intense peaks with the longest wavelength peak being the most intense and one smaller shoulder at the lower wavelength tail. The MC spectra in ethanol and acetonitrile have similar shapes and are red-shifted with respect to the corresponding spectrum in hexane. The bathochromic shift is most pronounced for ethanol showing a 17 nm shift of the lower absorption edge with respect to hexane and 5 nm with respect to acetonitrile. Notably, the overall absorption under the same excitation conditions follows the same trend with hexane showing the least and ethanol the highest absorption (see the scaling factors in Fig. 2). This hints at the solvent acting to stabilise the merocyanine form, which is discussed further in the ESI.†
3.2 Transient absorption experiments
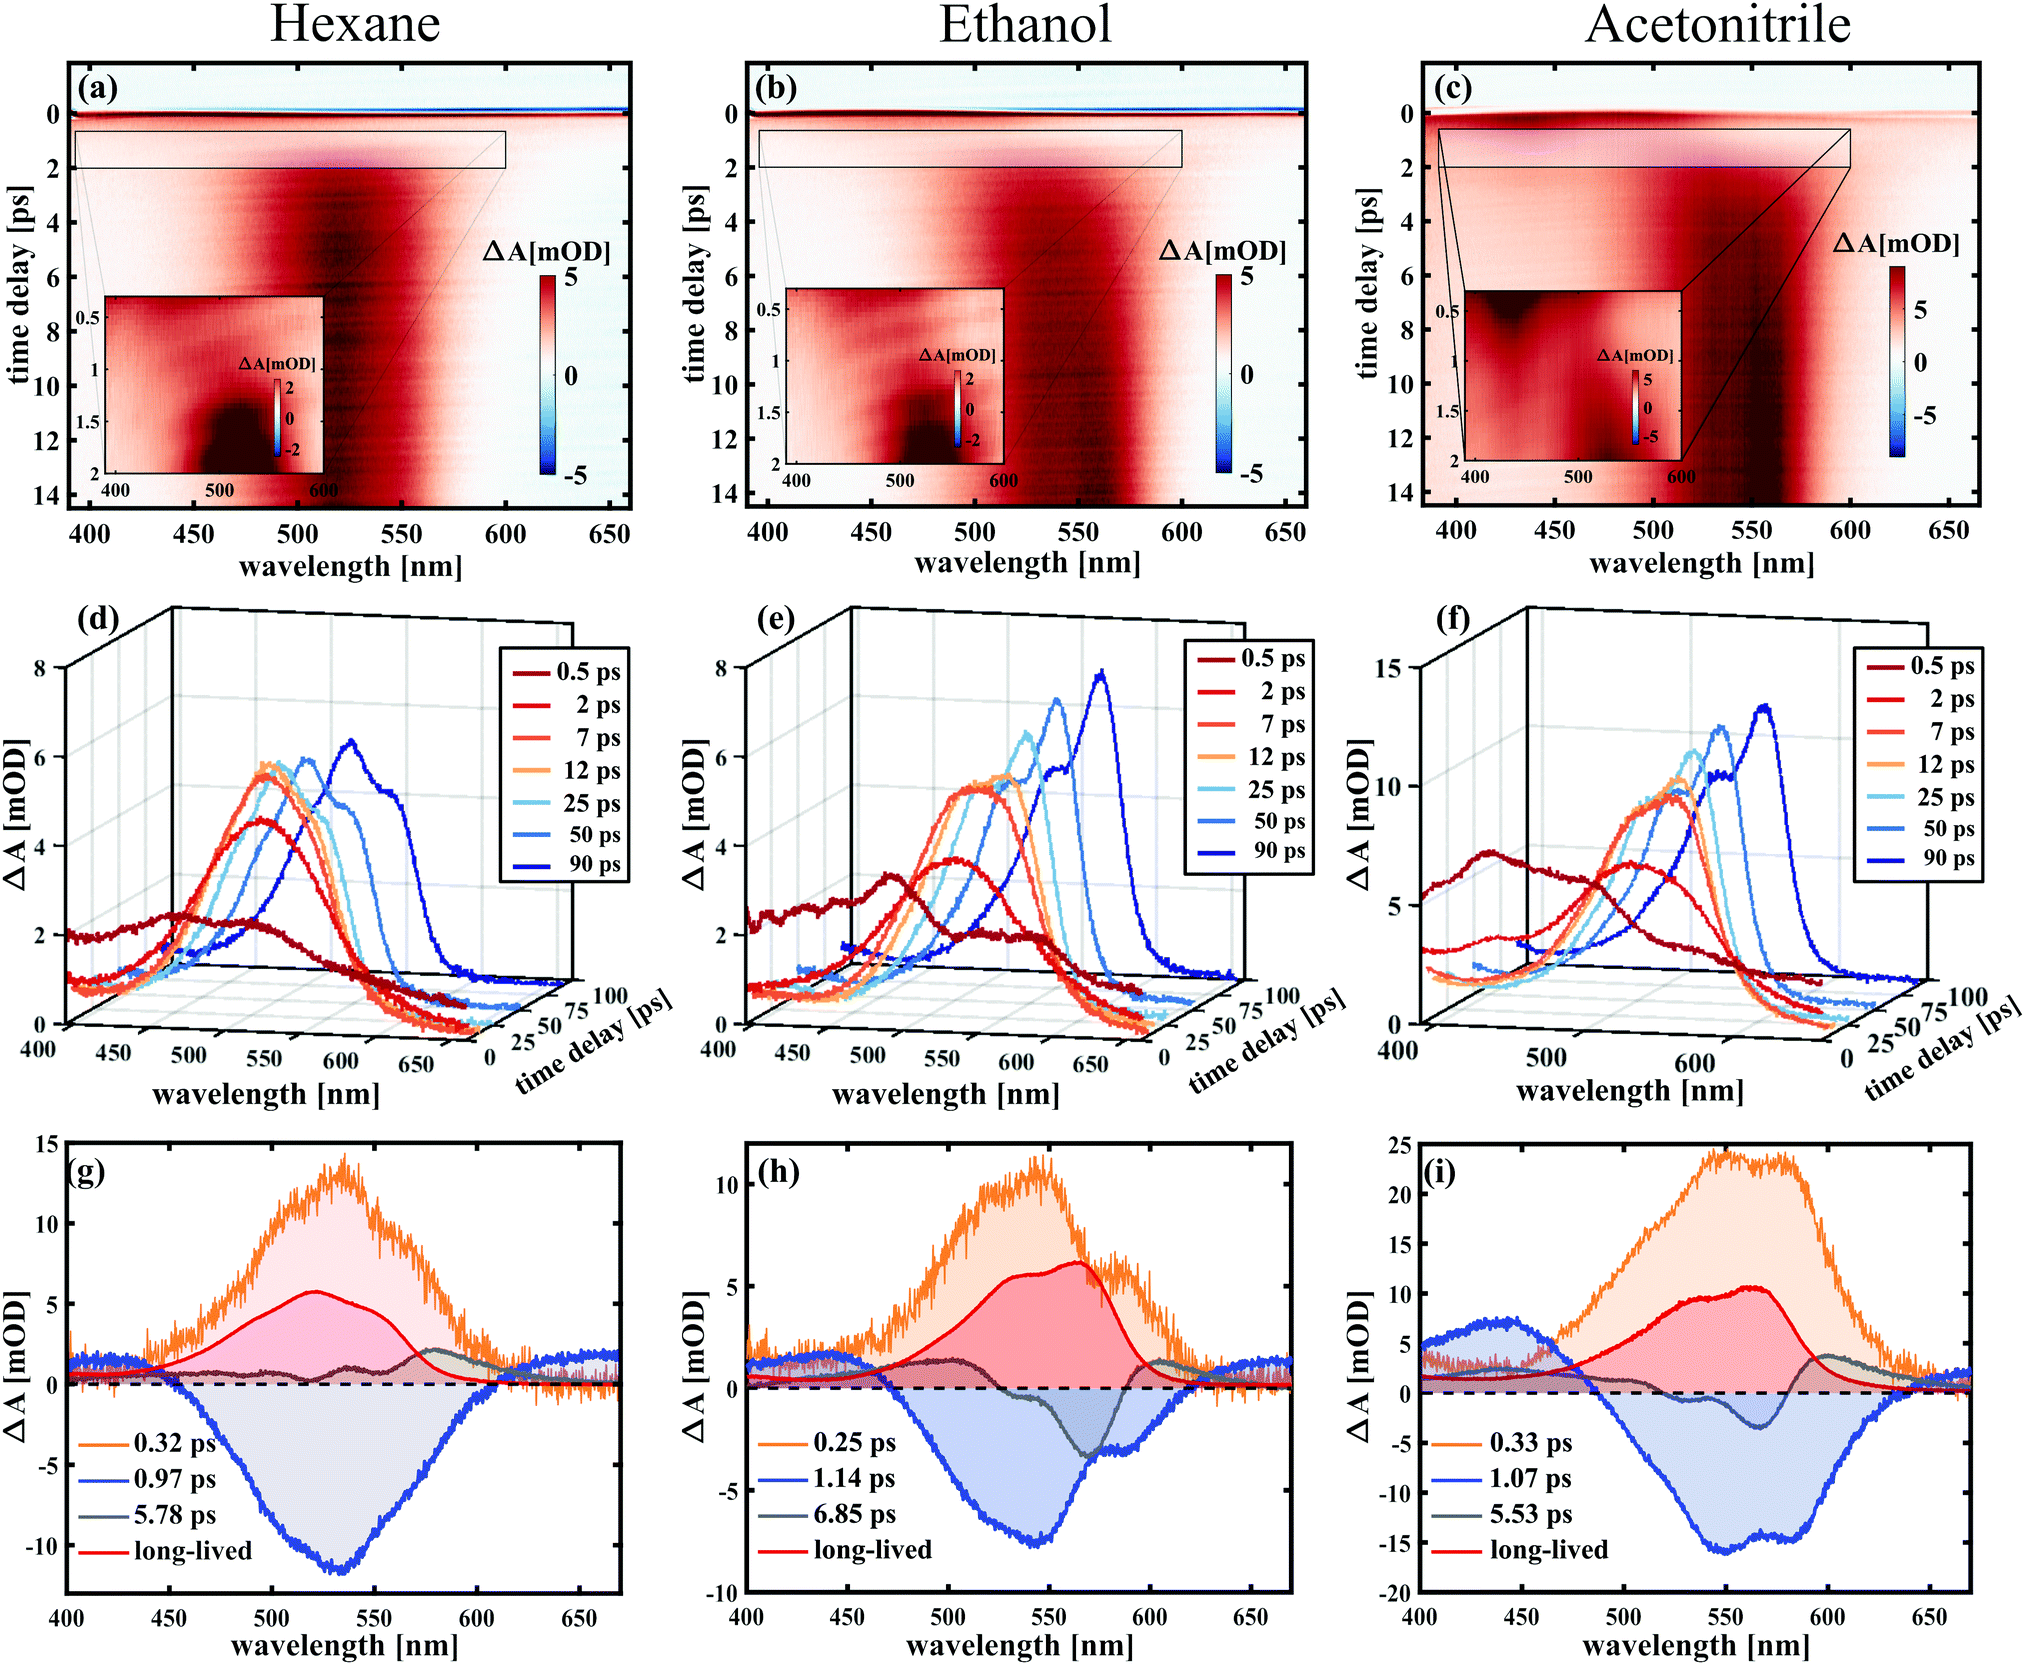 | ||
| Fig. 3 Transient absorption spectra of SNP in hexane (a, d and g), ethanol (b, e and h) and acetonitrile (c, f and i), probing in the visible. Depicted are TA maps for the first 14 ps (upper panel), spectral traces for selected delay times within 100 ps after excitation (middle panel), and decay associated spectra from global fitting (lower panel) for all three solvents. | ||
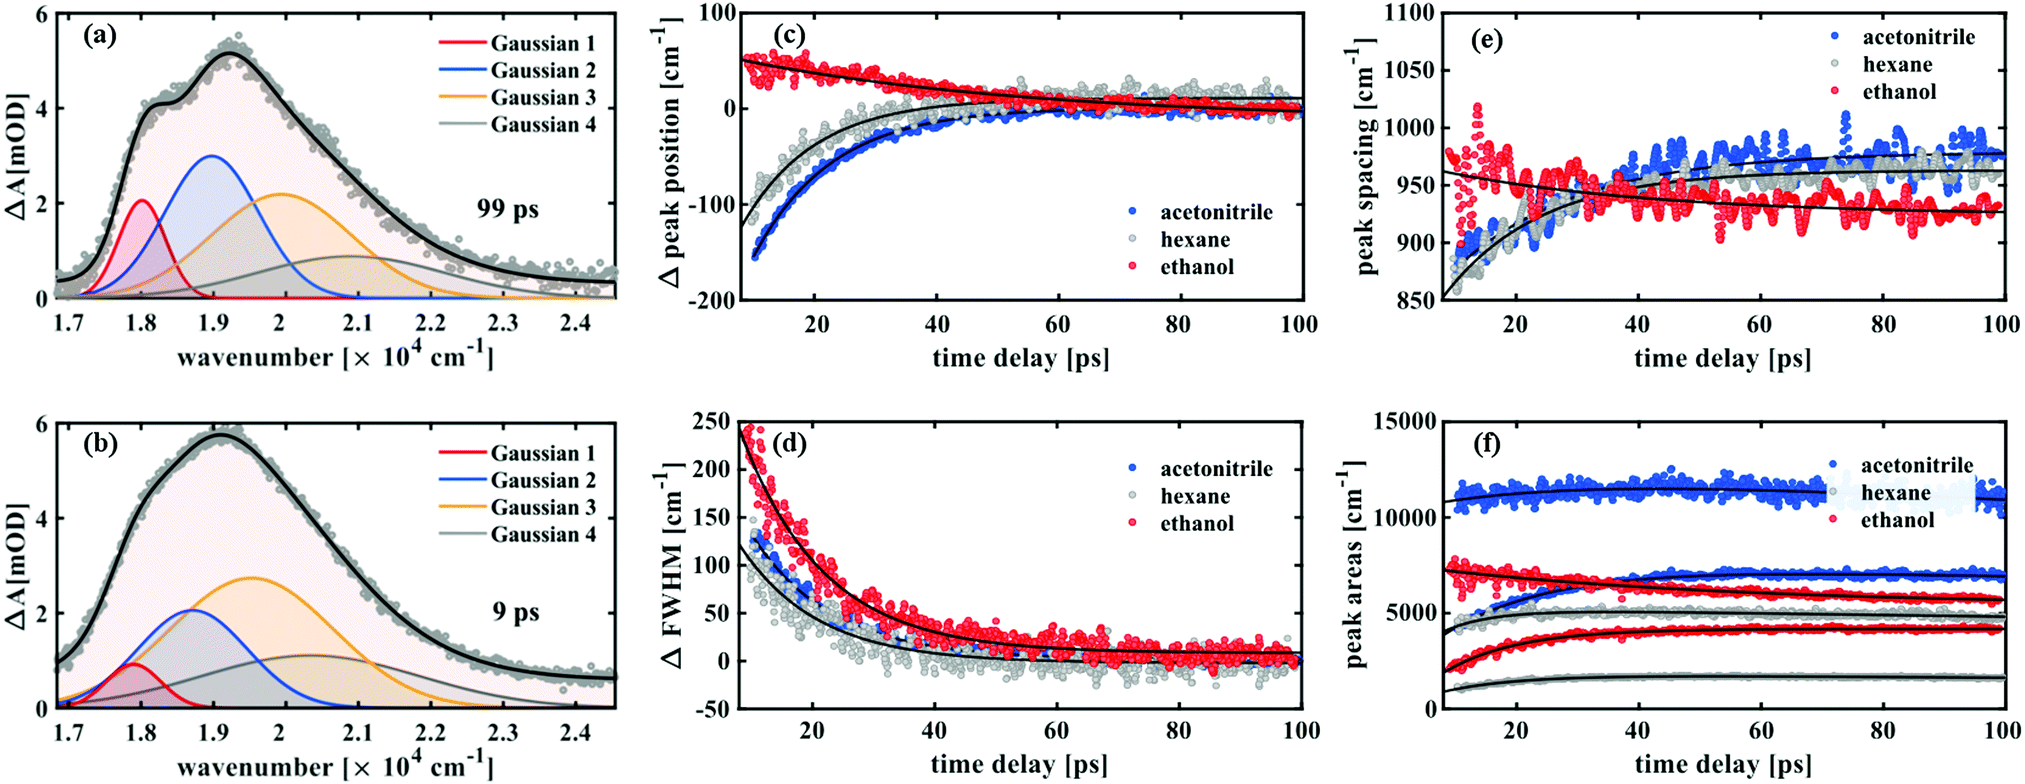 | ||
| Fig. 4 Line shape analysis of the transient UV/vis absorption data. The Gaussian components are labeled from 1 to 4, where Gaussian 1 refers to the peak at the lowest energy and Gaussian 4 is the highest energy peak. The fit is shown for the spectra in hexane at 99 ps (a) and 9 ps (b) after excitation representing the analysed time window. The changes in peak position and FWHM values of Gaussian 1 for all three solvents are shown in (c) and (d), respectively. (e) Shows the peak spacings and (f) the areas of the first two Gaussians for each solvent (in all three cases, the larger area belongs to the second peak). | ||
To analyse the data in more detail, we have applied two methods, a global fit routine36 on the one hand and a dynamic Gaussian line shape analysis on the other hand. The decay-associated spectra (DAS) from global fitting using four exponential components for the time window between 0.3 and 14 ps are shown in the lowest panel of Fig. 3. A single component with a lifetime of ∼1.0 ps (DAS2, blue line) describes both the decay of the initially broad spectrum (positive sign of DAS2) and the rise of the band between 450 and 600 nm (negative sign of DAS2) in all solvents. The decay-associated spectrum with the shortest lifetime of around 0.3 ps (DAS1, orange line) has a positive amplitude between 450 and 600 nm, mirroring the negative region of DAS2, thus describing a delayed onset of the latter. The intermediate component (DAS3, grey line) describes the spectral development from the initial band towards the long-lived component (DAS4, red line), which represents the spectrum at 14 ps. Although the global fitting represents the data well, interpreting the time-dependent spectral shift is not straightforward. Therefore, we treat the intermediate time constant in a separate analysis involving decomposition of the spectra into Gaussian functions, which is described in the following.
Such a dynamic Gaussian line shape analysis is able to describe spectral shifts and provides information about the temporal evolution of the peaks constituting the spectra. For this purpose, the spectra (converted to wavenumbers) for each time point were fit with a sum of four Gaussian functions (three in case of ethanol) tracking their respective spectral positions, widths and areas from 100 ps down to 9 ps after excitation. A detailed description of the fitting procedure and a model comparison can be found in the ESI.† After careful evaluation of different constraints to the parameters it was found that the data in this time window could be described properly by a simplified model, which ascribes the spectral fine structure to a vibrational progression with equal spacings between the peaks and a linear increase in peak width from lowest transition energy to highest. It was thus possible to fit all peak widths wi with a single parameter w1 by using the relation wi = i·w1 with i being the peak number. The peak positions were characterised by one parameter for the absolute position b1 and one for the peak spacing δ related by bi = b1 + (i − 1)·δ. All three parameters exhibited a monoexponential behaviour over time and the respective time constants are shown in Table 1.
| τ pos [ps] | τ spac [ps] | τ FWHM [ps] | |
|---|---|---|---|
| Acetonitrile | 13 ± 0.2 (r) | 21 ± 3 (r) | 13 ± 0.3 (d) |
| Hexane | 13 ± 0.5 (r) | 16 ± 1 (r) | 13 ± 0.8 (d) |
| Ethanol | 50 ± 5 (d) | 33 ± 8 (d) | 14 ± 0.4 (d) |
Notably, both in acetonitrile and hexane, a time constant of 13 ps was found for the relative changes in peak positions, which blue-shift, and for the peak widths, which decay over time. While in ethanol a similar decay constant (14 ps) was obtained for the FWHM values, the aforementioned red-shift is reflected in the peak position changes with a time constant of 50 ps. Furthermore, in the former two solvents the peak spacing increases over time, while decreasing with a time constant of 35 ps in case of ethanol.
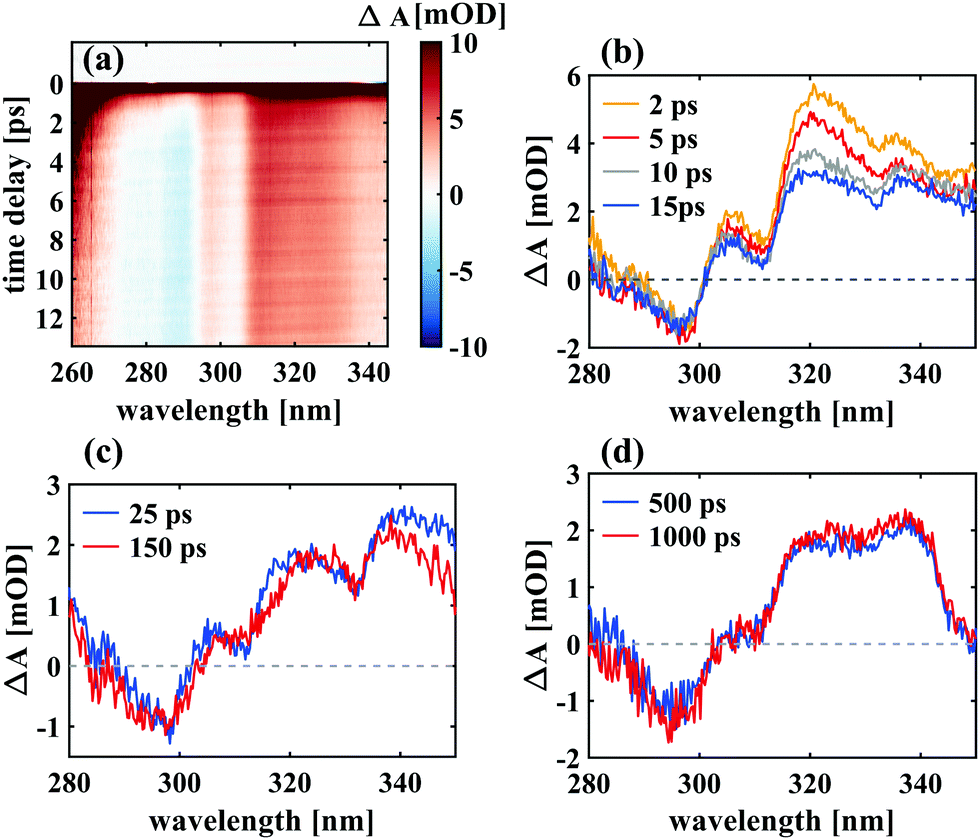 | ||
| Fig. 5 UV transient absorption of SNP in hexane, excited at 266 nm. An intense broad absorption around time zero decays within 1 ps revealing a long-lived difference spectrum with decreased absorption between 270 and 305 nm and increased absorption between 305 and 340 nm with respect to the closed-ring form. | ||
3.3 Excited-state dynamics simulations
The populations of the first four electronic states over time obtained from semi-classical excited state dynamics simulations and averaged over all 30 trajectories are depicted in Fig. 6. Starting with an initial population of 0.5 in both the S2 and the S3 state, the dynamics proceed via internal conversion processes into S1. Subsequently, the molecules relax to the ground state of either the merocyanine or the closed-ring form. The populations were fitted with a unidirectional, sequential kinetic model to obtain the transfer rates between states. To enable an accurate fitting of the S1 population dynamics, the decay of the initially occupied superposition state between S3 and S2 was described with a single rate constant. The resulting time constant for the transfer to S1 was 90 fs, while transfer from S1 to S0 occurred with a time constant of 1.3 ps. This rate constant represents a combination of all relaxation pathways to the ground states of either the SNP or the MC form.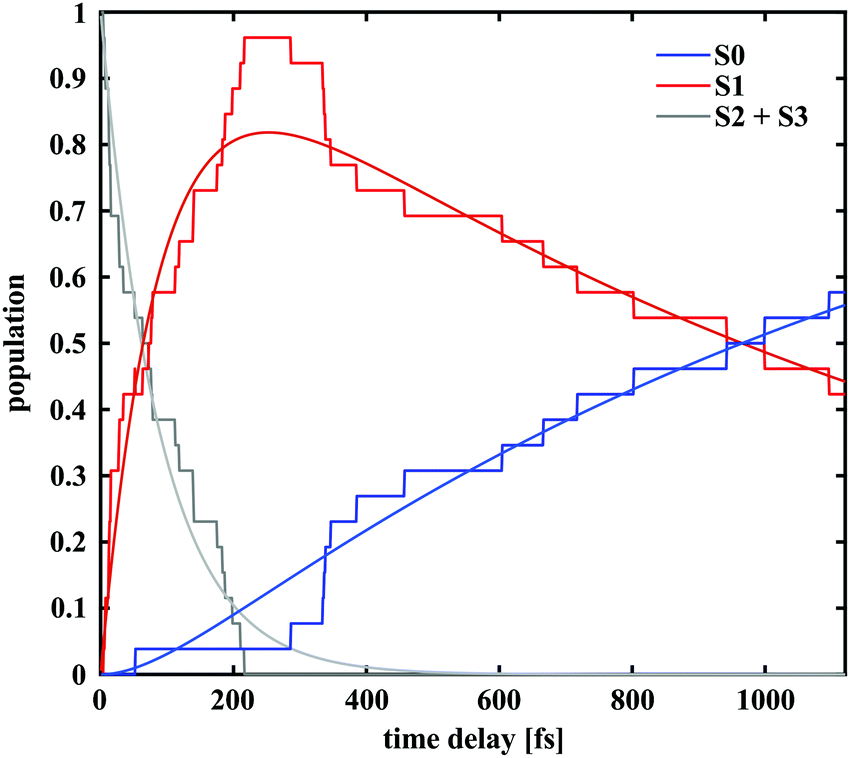 | ||
| Fig. 6 Populations of the first four electronic states of SNP after UV excitation according to the excited state dynamics simulation. The data were averaged over 30 trajectories and fit with a kinetic model. | ||
In 14 of the 30 simulated trajectories, C–O bond breaking occurred along the S1 vibrational relaxation coordinate and the carbon hybridisation changed from sp3 to sp2. As a result of this, the two orthogonal moieties rotated with respect to each other along the methine bridge. This bridge can be described by using the three dihedral angles α, β and γ along it (see Fig. 1). The various orientations of these angles determine the final conformer to be formed. Notably, only one of these trajectories led back to the spiro form, once the bond had been broken.
Plots of the C–O bond distances during the first 700 fs for both trajectories yielding the open-ring form and trajectories leading back to the closed form are shown in Fig. 7. The bond breaking trajectories involve rapid elongation of the C–O bond from the equilibrium distance of 1.5 Å to about 3.5 Å. Subsequently, the C–O distances fluctuate around that value and any further changes upon conversion towards the planar form occur on a longer time scale. To characterise the ring-opening time, the formation of open-ring isomers was obtained using a C–O bond elongation threshold of 1 Å and fitted with an exponential function starting at 90 fs. This yielded a ring-opening time constant of 350 fs (see ESI†). Based on the geometry optimisation on the first excited state, a minimum on the S1 potential energy surface was found corresponding to an open-ring non-planar structure with a C–O distance of 2.7 Å and dihedral angles of α = −132°, β = 5.9° and γ = 43.8°.
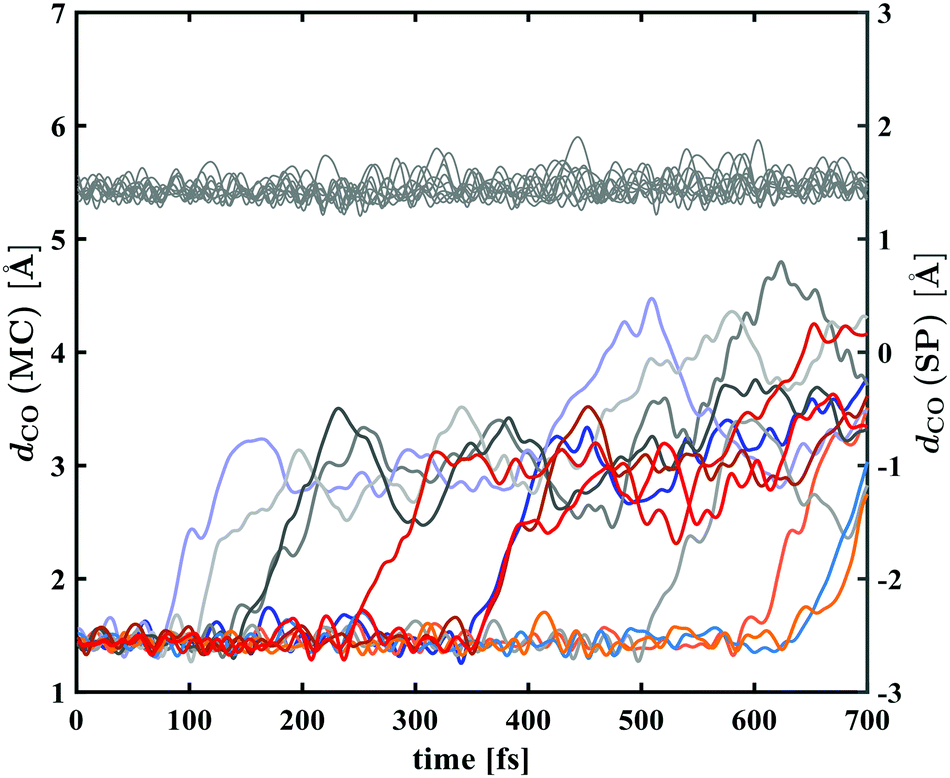 | ||
| Fig. 7 Bond distance dCO between the spiro-carbon and the pyran oxygen for the excited state dynamics trajectories leading to MC (coloured lines, left ordinate) and trajectories leading back to the SNP ground state (grey lines, right ordinate). In the MC trajectories, Cspiro–O bond breaking occurs via rapid elongation of the bond of about 1.5 Å taking less than 100 fs and no return to a closed-ring isomer was found. In contrast, no significant changes in Cspiro–O bond length were present in the trajectories leading back to the ground state of SNP. | ||
In case of the trajectories where the molecules did not undergo C–O bond breaking but relaxed to the ground state of SNP, a temporary elongation of the bond between the indoline nitrogen and the spiro-carbon of 1.1 ± 0.1 Å for a duration of 100 ± 30 fs occurred during the transfer from S1 to S0. The temporal correlation between the elongation and relaxation to S0 is demonstrated in Fig. 8 and is in agreement with previously reported CASPT2/CASSCF studies on BIPS.28
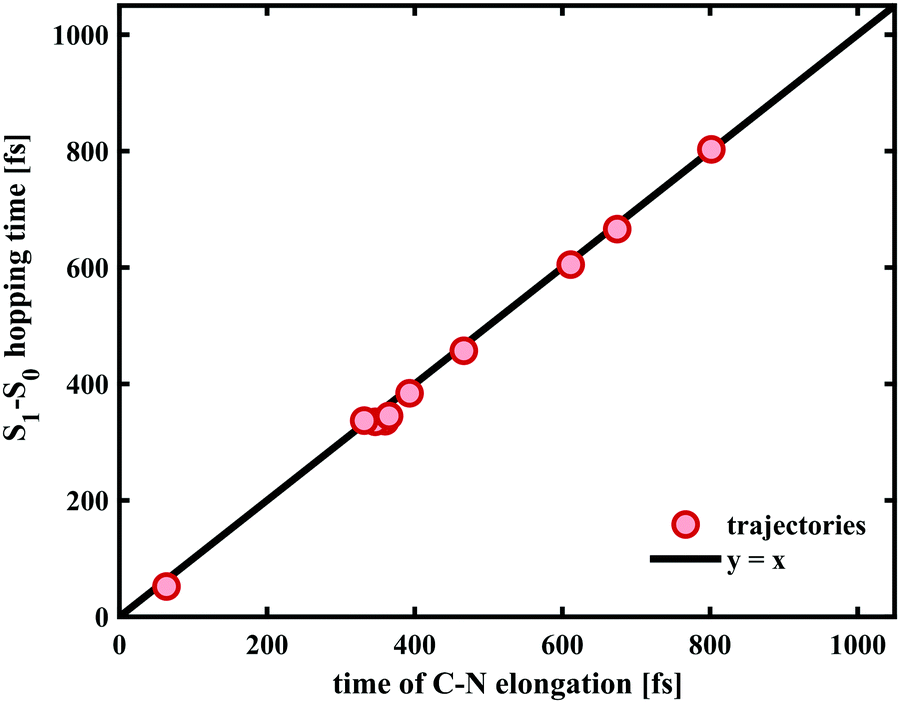 | ||
| Fig. 8 Temporal correlation between the transfer from S1 to S0 and the Cspiro–N elongation of 1.1 ± 0.1 Å in the trajectories that did not undergo Cspiro–O bond breaking. The values on the abscissa for each trajectory were obtained by taking the mean of the time points during which the Cspiro–N bond was elongated above the half-maximum value. The black line (y = x) is shown as reference for a perfect correlation. | ||
3.4 Discussions
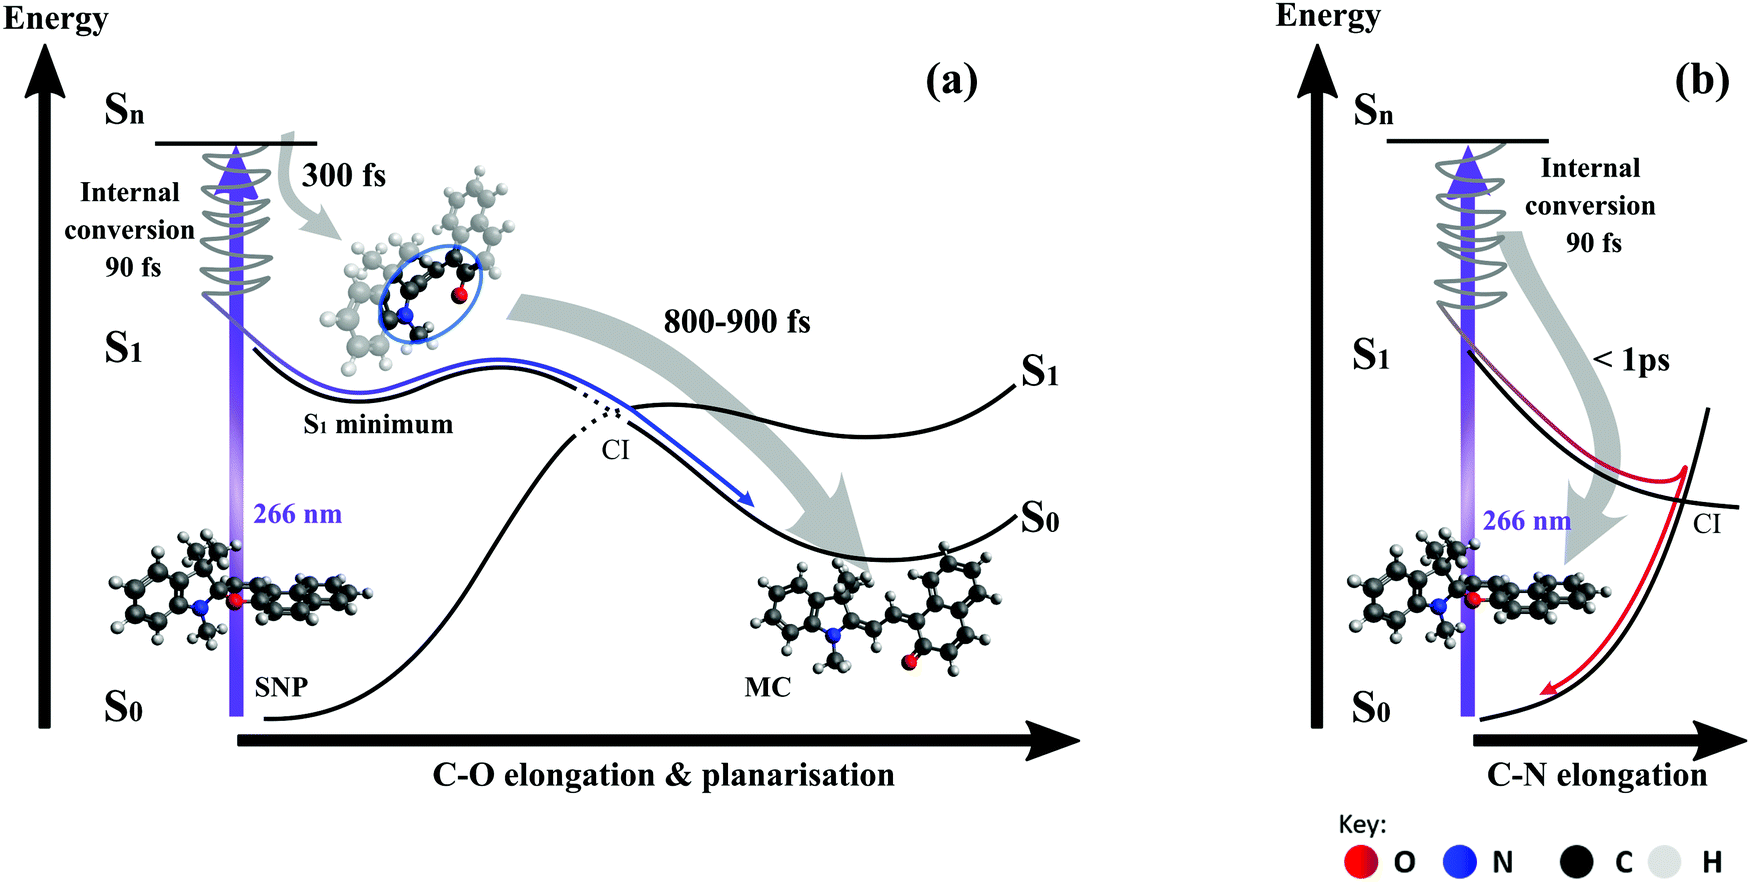 | ||
| Fig. 9 Schematic illustration of the reaction pathways along the relevant reaction coordinates. Upon excitation at 266 nm, internal conversion to the S1 potential energy surface (PES) occurs within 90 fs according to simulations. (a) On the trajectory leading to MC, the Cspiro–O bond is broken leading to an open-ring intermediate with a formation time of 300 fs according to experiments (350 fs in simulations). The S1 minimum structure shown here was found by geometry optimisation. The subsequent planarisation and relaxation to the ground state of MC occurs with a time constant between 800 and 900 fs based on our experimental data. (b) Relaxation back to the ground state of the closed-ring form involves elongation of the Cspiro–N bond rather than the Cspiro–O bond, according to our simulations and previously reported PES calculations. Transient absorption measurements in the UV range indicate that this relaxation takes less than 1 ps. | ||
On the pathway leading to the MC product (see Fig. 9a), the wave packet propagates on the S1 potential energy surface towards an excited state minimum. During this propagation, the bond between the spiro-carbon and the pyran oxygen is elongated and eventually broken. This results in an open-ring intermediate with nearly orthogonal arrangement of the two subunits according to the S1 geometry optimisation. The formation of this intermediate manifests as a delayed onset of the product band, which is found to be around 300 fs (see Section 3.2.1) and is in good agreement with the bond breaking time of 350 fs obtained from simulations. Importantly, our simulations show that the ring-opening dynamics occur exclusively on the S1 surface regardless of the excitation wavelength. Subsequent propagation in the next 0.8–0.9 ps involves crossing of an energy barrier on the S1 surface and the passage through a conical intersection (CI) towards the planar MC configuration in the electronic ground state. This interpretation is consistent with the observed red-shift of ∼100 nm (4000 cm−1) in the absorption spectrum occurring between 0.3 and 1.1 ps. The fact that all subsequently observed spectral shifts are either towards shorter wavelengths or at least an order of magnitude smaller supports the suggestion that no further planarisation takes place.
As our simulations show that only one out of 14 trajectories involving breaking of the C–O bond led back to the spiro form, we conclude that the bifurcation into two main relaxation channels occurs earlier than 300 fs post-excitation. The key driving mode for internal conversion to the spiro form (see Fig. 9b) has been proposed to involve C–N elongation in a theoretical study mapping the potential energy surfaces,28 which is also corroborated from our excited-state dynamics simulations.
Important insight regarding the time scales of both reaction pathways can be gained from the transient UV absorption data (see Fig. 5). The long-lived differential absorption can be attributed to depletion of the spiro-form and formation of MC and both positive and negative signals in this range do not change significantly after 1–2 ps, except for residual decay of the strong excited state absorption. Besides further supporting our previous assignment of the MC formation time, this observation suggests that relaxation back to SNP also occurs within 1 ps or less.
In all cases, a narrowing of the bands was found with a time constant of 13 ps for acetonitrile and hexane and 14 ps for ethanol. The reason for narrowing can be that the product configuration space is converging towards the most stable structural conformer37 or dissipation of vibrational energy to the environment.38,39 The observed overall blue-shift of the product band in hexane and acetonitrile can be explained analogously in the context of change in occupation number of vibrational states from higher to lower due to intramolecular vibrational relaxation in the electronic ground state and vibrational cooling via collisions with surrounding solvent molecules. The excellent match of the time scales between the blue-shift and the narrowing in these two solvents supports this assignment.
The latter effect is masked in case of ethanol by a dynamic decrease in transition energies resulting in a red-shift of 50 cm−1 within 10 and 100 ps. Furthermore, the energy difference between the vibrational levels decreases over time in ethanol in contrast to the other two solvents. We note that out of the three solvents used in this study, ethanol is the only one capable of forming hydrogen bonds with merocyanine. In addition, its viscosity is higher by a factor of 3 compared to the other two solvents (1.1 × 10⁻³ Pa s for ethanol and ∼0.3 × 10⁻³ Pa s for both acetonitrile and n-hexane). These characteristics could account for the observed differences, but an unambiguous assignment exceeds the scope of this work. However, the particularity of solvation in ethanol has been reported previously and it has been shown by Horng et al., using time-resolved emission of coumarin 153 as solute, that ethanol exhibits significantly more complex relaxation dynamics than the other two solvents, with a long-lived component of ∼30 ps.40 In contrast, solvation times in acetonitrile (∼0.6 ps) and non-polar solvents (∼0.3 ps) were found to be in the sub-ps regime.40,41 This suggests that in case of ethanol, the solvent relaxation causing a red-shift of the bands dominates the ps-dynamics whereas the effect would be invisible in cases of acetonitrile and hexane since the relaxation time scales coincide with those of the reaction itself. Thus, our observations and analyses reflect the distinctive solvent relaxation dynamics in ethanol.
An unambiguous interpretation of the peak area dynamics is not possible without additional information about the excited state PES and the corresponding vibrational wavefunctions and Franck–Condon factors. The possibility of interconversion between different MC conformers further complicates the interpretation. The fact that the spectra could be adequately described by a simple vibrational progression model implies that the peaks in the final spectrum correspond to a vibrational fine structure originating from a single conformer. The energy difference between the peaks is found to be on the order of 1000 cm−1, which falls well within the stretching frequency of C–C bonds in organic molecules. It should be stressed however that the identity of the conformer that is formed cannot be revealed with certainty by means of electronic spectroscopy, since the merocyanine isomers are geometrically close and likely to have similar electronic structures. This has recently been demonstrated by Xiong et al. for the closely related spironaphthoxazine.7
The key insight from this analysis of the spectral dynamics between 9 and 100 ps is thus, that they can be ascribed purely to thermalisation (13 ps) of the product and in case of ethanol solvent equilibration (∼50 ps). This confirms that the chemical reaction itself takes place on a faster time scale.
4 Conclusion
Combining semi-classical nuclear dynamics simulations and transient absorption spectroscopy in both the visible and the UV, the present study provides deeper insight into the mechanism and following product equilibration of the photochemical reaction of unsubstituted spiropyrans. Thorough analysis of the spectral data up to 100 ps after excitation allowed differentiating between the dynamics of the isomerisation reaction itself and product relaxation and equilibration. Evidence was found for an open-ring reaction intermediate being formed within 300 fs which subsequently planarises yielding the merocyanine form in a vibrationally hot ground state within 1.1 ps. Theoretical calculations confirm the existence of such an intermediate with an open-ring, non-planar geometry. According to the dynamics simulations, all trajectories that showed C–O bond breaking led to the planar MC, whereas trajectories returning to the SNP ground state did not exhibit any significant C–O bond elongation, but were driven by a C–N stretch mode in accordance with previously reported calculations. The internal conversion back to the initial state was found to occur within less than 1 ps.The product relaxation dynamics could be described with a simplified vibrational progression model suggesting that vibrational relaxation takes places with a time constant of ∼13 ps. While the chemical dynamics did not exhibit any considerable solvent dependence, product equilibration in ethanol was influenced by solvent relaxation dynamics. With the present study, we have demonstrated that a dynamic line shape analysis is a useful method to describe time-dependent spectral shifts and spectral fine structure, complementing conventional global fit routines.
Author contributions
S. F. B., R. D. and K. M. S. contributed equally to this work. K. M. S., G. C. and S. F. B. constructed the experimental setup. S. F. B. and K. M. S. led the experimental front. Data analysis was carried out by S. F. B., K. M. S., R. D., S. A. H. and V. I. P. R. D. led the theoretical efforts with contributions from M. K. A. R., S. F. B. and K. M. S. prepared samples for the experiments. All authors contributed towards data interpretations and discussions. The project was conceived by R. J. D. M. and directed by R. J. D. M. and K. M. S.Conflicts of interest
The authors declare no conflicts of interest.Acknowledgements
This work was funded by the Max Planck Society. We thank Dr Hong Guang-Duan and Dr Ajay Jha for scientific advice and Dr Arunangshu Debnath and Dr Zheng Li for helpful discussions. This work made use of the GWDG High Performance Computing Facility at Göttingen (https://www.gwdg.de/application-services/high-performance-computing). Open Access funding provided by the Max Planck Society.References
- Photochromism: Molecules and Systems, ed. H. Dürr and H. Bouas-Laurent, Elsevier BV, 2003 Search PubMed.
- M. El Gemayel, K. Börjesson, M. Herder, D. T. Duong, J. Hutchison, C. Ruzié, G. Schweicher, A. Salleo, Y. Geerts, S. Hecht, E. Orgiu and P. Samorì, Nat. Commun., 2015, 6, 5054–5075 CrossRef PubMed.
- E. Orgiu, N. Crivillers, M. Herder, L. Grubert, M. Pätzel, J. Frisch, E. Pavlica, D. T. Duong, G. Bratina, A. Salleo, N. Koch, S. Hecht and P. Samorì, Nat. Chem., 2012, 4, 675–679 CrossRef CAS PubMed.
- D. Bléger and S. Hecht, Angew. Chem., Int. Ed., 2015, 54, 11338–11349 CrossRef PubMed.
- G. Berkovic, V. Krongauz and V. Weiss, Chem. Rev., 2000, 100, 1741–1754 CrossRef CAS PubMed.
- M. Irie, T. Fukaminato, K. Matsuda and S. Kobatake, Chem. Rev., 2014, 114, 12174–12277 CrossRef CAS PubMed.
- Y. Xiong, A. V. Jentzsch, J. W. M. Osterrieth, E. Sezgin, I. V. Sazanovich, K. Reglinski, S. Galiani, A. W. Parker, C. Eggeling and H. L. Anderson, Chem. Sci., 2018, 9, 3029–3040 RSC.
- C. Beyer and H.-A. Wagenknecht, J. Org. Chem., 2010, 75, 2752–2755 CrossRef CAS PubMed.
- M. Livendahl, J. Jamroskovic, M. Hedenström, T. Görlich, N. Sabouri and E. Chorell, Org. Biomol. Chem., 2017, 15, 3265–3275 RSC.
- R. Klajn, Chem. Soc. Rev., 2014, 43, 148–184 RSC.
- J. Buback, P. Nuernberger, M. Kullmann, F. Langhojer, R. Schmidt, F. Würthner and T. Brixner, J. Phys. Chem. A, 2011, 115, 3924–3935 CrossRef CAS PubMed.
- H. Takahashi, K. Yoda, H. Isaka, T. Ohzeki and Y. Sakaino, Chem. Phys. Lett., 1987, 140, 90–94 CrossRef CAS.
- E. Fischer and Y. Hirshberg, J. Chem. Soc., 1952, 4522–4524 CAS.
- R. Heiligman-Rim, Y. Hirshberg and E. Fischer, J. Chem. Soc., 1961, 156–163 RSC.
- A. Kellmann, F. Tfibel, R. Dubest, P. Levoir, J. Aubard, E. Pottier and R. Guglielmetti, J. Photochem. Photobiol., A, 1989, 49, 63–73 CrossRef CAS.
- N. P. Ernsting, B. Dick and T. Arthen-Engeland, Pure Appl. Chem., 1990, 62, 1483–1488 CAS.
- N. P. Ernsting and T. Arthen-Engeland, J. Phys. Chem., 1991, 95, 5502–5509 CrossRef CAS.
- N. P. Ernsting, Chem. Phys. Lett., 1989, 159, 526–531 CrossRef CAS.
- M. Rini, A.-K. Holm, E. T. J. Nibbering and H. Fidder, J. Am. Chem. Soc., 2003, 125, 3028–3034 CrossRef CAS PubMed.
- J. Kohl-Landgraf, M. Braun, C. Özçoban, D. P. N. Gonçalves, A. Heckel and J. Wachtveitl, J. Am. Chem. Soc., 2012, 134, 14070–14077 CrossRef CAS PubMed.
- M. Suzuki, T. Asahi and H. Masuhara, Phys. Chem. Chem. Phys., 2002, 4, 185–192 RSC.
- R. J. D. Miller, Science, 2014, 343, 1108–1116 CrossRef CAS PubMed.
- T. Elsaesser and W. Kaiser, Annu. Rev. Phys. Chem., 1991, 42, 83–107 CrossRef CAS.
- J. C. Owrutsky, D. Raftery and R. M. Hochstrasser, Annu. Rev. Phys. Chem., 1994, 45, 519–555 CrossRef CAS PubMed.
- G. A. Voth and R. M. Hochstrasser, J. Phys. Chem., 1996, 100, 13034–13049 CrossRef CAS.
- T. Brust, S. Malkmus, S. Draxler, S. A. Ahmed, K. Rück-Braun, W. Zinth and M. Braun, J. Photochem. Photobiol., A, 2009, 207, 209–216 CrossRef CAS.
- C. T. Middleton, B. Cohen and B. Kohler, J. Phys. Chem. A, 2007, 111, 10460–10467 CrossRef CAS PubMed.
- F. Liu and K. Morokuma, J. Am. Chem. Soc., 2013, 135, 10693–10702 CrossRef CAS PubMed.
- G. Zhai, S. Shao, S. Wu, Y. Lei and Y. Dou, Int. J. Photoenergy, 2014, 541791 Search PubMed.
- M. Frisch, G. Trucks, H. Schlegel, G. Scuseria, M. Robb, J. Cheeseman, G. Scalmani, V. Barone, B. Mennucci and G. Peterssonet al., Gaussian 09, revision D. 01, 2009 Search PubMed.
- T. Yanai, D. P. Tew and N. C. Handy, Chem. Phys. Lett., 2004, 393, 51–57 CrossRef CAS.
- F. Weigend and R. Ahlrichs, Phys. Chem. Chem. Phys., 2005, 7, 3297–3305 RSC.
- Principles of Fluorescence Spectroscopy, ed. J. R. Lakowicz, Springer US, 2006 Search PubMed.
- P. J. M. Johnson, V. I. Prokhorenko and R. J. D. Miller, Opt. Express, 2009, 17, 21488–21496 CrossRef CAS PubMed.
- V. I. Prokhorenko, A. Halpin, P. J. M. Johnson, R. J. D. Miller and L. S. Brown, J. Chem. Phys., 2011, 134, 085105 CrossRef PubMed.
- I. H. van Stokkum, D. S. Larsen and R. van Grondelle, Biochim. Biophys. Acta, Bioenerg., 2004, 1657, 82–104 CrossRef CAS PubMed.
- G. Buntinx, O. Poizat, S. Foley, M. Sliwa, S. Aloïse, V. Lokshin and A. Samat, Dyes Pigm., 2011, 89, 305–312 CrossRef CAS.
- G. Buntinx, R. Naskrecki, C. Didierjean and O. Poizat, J. Phys. Chem. A, 1997, 101, 8768–8777 CrossRef CAS.
- G. Buntinx, R. Naskrecki and O. Poizat, J. Phys. Chem., 1996, 100, 19380–19388 CrossRef CAS.
- M. L. Horng, J. A. Gardecki, A. Papazyan and M. Maroncelli, J. Phys. Chem., 1995, 99, 17311–17337 CrossRef CAS.
- S. A. Kovalenko, J. L. Pérez Lustres, N. P. Ernsting and W. Rettig, J. Phys. Chem. A, 2003, 107, 10228–10232 CrossRef CAS.
Footnotes |
| † Electronic supplementary information (ESI) available. See DOI: 10.1039/c9cp02950h |
| ‡ S. F. Bittmann, R. Dsouza and K. M. Siddiqui contributed equally to this work. |
| This journal is © the Owner Societies 2019 |