 Open Access Article
Creative Commons Attribution 3.0 Unported Licence
Evaluating lithium diffusion mechanisms in the complex spinel Li2NiGe3O8†
Daniel Z. C.
Martin
 a,
Abby R.
Haworth
 b,
Whitney L.
Schmidt
c,
Peter J.
Baker
 d,
Rebecca
Boston
 a,
Karen E.
Johnston
 *b and
Nik
Reeves-McLaren
 *a
*a
aDepartment of Materials Science and Engineering, University of Sheffield, Sheffield, S13JD, UK. E-mail: n.reeves@sheffield.ac.uk
bDepartment of Chemistry, Durham University, Durham, DH1 3LE, UK. E-mail: karen.johnston@durham.ac.uk
cDivision of Natural Sciences and Mathematics, Kentucky Wesleyan College, 3000 Frederica St., Owensboro, KY 42301, USA
dISIS Facility, Science and Technology Facilities Council, Rutherford Appleton Laboratory, Harwell Science and Innovation Campus, Didcot, Oxfordshire OX11 0QX, UK
First published on 11th October 2019
Abstract
Lithium-ion diffusion mechanisms in the complex spinel Li2NiGe3O8 have been investigated using solid-state NMR, impedance, and muon spectroscopies. Partial occupancy of migratory interstitial 12d sites is shown to occur at lower temperatures than previously reported. Bulk activation energies for Li+ ion hopping range from 0.43 ± 0.03 eV for powdered samples to 0.53 ± 0.01 eV for samples sintered at 950 °C for 24 h, due to the loss of Li during sintering at elevated temperatures. A lithium diffusion coefficient of 3.89 × 10⁻¹² cm2 s−1 was calculated from muon spectroscopy data for Li2NiGe3O8 at 300 K.
1 Introduction
Since Sony's successful commercialisation of lithium-ion batteries (LIBs) in 1990, their numerous desirable properties have been widely reported.1–3 However, despite becoming ubiquitous in modern society, several safety concerns still remain, predominantly related to the use of flammable and corrosive organic liquid electrolytes in close proximity to highly energetic electrode materials.4–6 Whilst accidents are relatively rare, these liquid electrolytes can pose significant dangers to consumers and other end-users, as well as reputational damage for device manufacturers.7An all-solid-state battery utilising a solid electrolyte could alleviate many of these concerns, whilst offering improved shock resistance and durability.8 To date, research has primarily focused on the development and optimisation of materials with room-temperature Li+ ion conductivities (σi) of ≥10−3 S cm−1, in order to compete with current commercial liquid electrolytes.8 Several such materials exist, for instance thio-LISICONs (e.g., Li10GeP2S12, σi = 1.2 × 10⁻² S cm−1) and Li-stuffed garnets (e.g., Li6.4La3Zr1.4Ta0.6O12, σi = 10−3 S cm−1).9–11 Nevertheless, many of these candidate materials suffer a number of drawbacks, which are preventing their commercialisation. For example, thio-LISICONs are unstable in air and decompose at cell voltages >4 V vs. Li/Li+.12,13 Many are also reported to react with lithium metal.12 Li-stuffed garnets can undergo proton exchange (H+/Li+), substantially reducing levels of Li+ ion conductivity.14,15 They are also widely reported to exhibit high interfacial resistance with electrode materials (up to ∼2000 Ω cm2).16 One solution to lowering this interfacial resistance is to use materials with the same crystal structure to enable lattice matching, for example by developing an all-spinel solid-state battery.
The spinel structure, AB2O4, has been studied extensively and is known to consist of cubic close packed O2− anions, with A-site cations occupying an eighth of the tetrahedral sites and B-site cations filling half of the available octahedral sites for ‘normal’ spinels.17,18 Depending on the cations present, the spinel structure may also be inverse ([B]tet[A,B]octO4) or random ([B0.67A0.33]tet[A0.67B1.33]octO4). Cubic spinels generally crystallise in the Fd![[3 with combining macron]](https://www.rsc.org/images/entities/char_0033_0304.gif) m space group. In Li-based spinels, Li+ ion conductivity typically follows a two-step conduction mechanism involving Li ions in 8a tetrahedral sites hopping into empty 16c octahedral sites and then onto adjacent 8a sites, forming a three-dimensional 8a-16c-8a pathway for ionic migration19 that means spinels often exhibit interesting and useful electrical properties. As a result, several manganese-based spinels have been considered as potential high voltage cathode materials (>4.7 V vs. Li+/Li), e.g., LiCoMnO4 and LiNi0.5Mn1.5O4.20–22 However, these are incompatible with current LIB cell designs due to the breakdown of organic electrolytes above ca. 4.5 V vs. Li+/Li. Spinel-based titanates such as Li4Ti5O12 are currently of interest as anode materials in LIB applications, as they exhibit excellent dimensional stability during Li (de)intercalation.23,24 In contrast, spinel-based materials for solid electrolyte applications have received considerably less attention, since they often incorporate redox active transition metals. One potential candidate material is Li2NiGe3O8, previously reported by Kawai et al. to exhibit a modest Li+ ion conductivity of ∼10−7 S cm−1 at 63 °C (comparable to the tetragonal phase of the Li-stuffed garnet Li7La3Zr2O12) and which is electrochemically inactive below 5 V vs. Li+/Li.25
m space group. In Li-based spinels, Li+ ion conductivity typically follows a two-step conduction mechanism involving Li ions in 8a tetrahedral sites hopping into empty 16c octahedral sites and then onto adjacent 8a sites, forming a three-dimensional 8a-16c-8a pathway for ionic migration19 that means spinels often exhibit interesting and useful electrical properties. As a result, several manganese-based spinels have been considered as potential high voltage cathode materials (>4.7 V vs. Li+/Li), e.g., LiCoMnO4 and LiNi0.5Mn1.5O4.20–22 However, these are incompatible with current LIB cell designs due to the breakdown of organic electrolytes above ca. 4.5 V vs. Li+/Li. Spinel-based titanates such as Li4Ti5O12 are currently of interest as anode materials in LIB applications, as they exhibit excellent dimensional stability during Li (de)intercalation.23,24 In contrast, spinel-based materials for solid electrolyte applications have received considerably less attention, since they often incorporate redox active transition metals. One potential candidate material is Li2NiGe3O8, previously reported by Kawai et al. to exhibit a modest Li+ ion conductivity of ∼10−7 S cm−1 at 63 °C (comparable to the tetragonal phase of the Li-stuffed garnet Li7La3Zr2O12) and which is electrochemically inactive below 5 V vs. Li+/Li.25
Li2NiGe3O8 can be described as an ordered or ‘complex’ spinel in space group P4332, with Li+ ions occupying tetrahedral 8c sites, and 1![[thin space (1/6-em)]](https://www.rsc.org/images/entities/char_2009.gif) :
:![[thin space (1/6-em)]](https://www.rsc.org/images/entities/char_2009.gif) 3 cation ordering of Ni and Ge on the 4b and 12d octahedral sites, respectively.25 Conduction pathways in complex spinels are less well studied compared to normal spinels, but can involve additional steps depending on the nature of the ordering present. Previous work using variable-temperature time-of-flight neutron powder diffraction (ToF ND) indicated the presence of a second Li 12d octahedral site in Li2NiGe3O8 at high temperatures (∼350–850 °C), leading to the proposition of a three-dimensional 8c-12d-8c conduction pathway.26 Theoretical studies by Nakayama et al. predicted the activation energy for this particular pathway to be 0.47 eV, lower than other previously proposed pathways.19
3 cation ordering of Ni and Ge on the 4b and 12d octahedral sites, respectively.25 Conduction pathways in complex spinels are less well studied compared to normal spinels, but can involve additional steps depending on the nature of the ordering present. Previous work using variable-temperature time-of-flight neutron powder diffraction (ToF ND) indicated the presence of a second Li 12d octahedral site in Li2NiGe3O8 at high temperatures (∼350–850 °C), leading to the proposition of a three-dimensional 8c-12d-8c conduction pathway.26 Theoretical studies by Nakayama et al. predicted the activation energy for this particular pathway to be 0.47 eV, lower than other previously proposed pathways.19
An improved understanding of ionic diffusion mechanisms in spinel materials, and Li+ ion conductors at large, is crucial if such materials are to be improved and optimised for use as solid electrolytes in all-solid-state LIBs. To this end, we have used a combination of techniques, including impedance, muon and solid-state NMR spectroscopies to enhance our understanding of the crystal structure of the complex spinel Li2NiGe3O8 and the Li+ ion diffusion dynamics therein.
2 Experimental methods
2.1 Synthesis and characterisation
Samples of Li2NiGe3O8 were synthesised via traditional solid state methods. Stoichiometric amounts of Li2CO3 (Sigma-Aldrich, 99%), NiO (Alfa Aesar, 99%) and GeO2 (Sigma-Aldrich, 99.999%) were mixed and ground in an agate mortar and pestle, placed into Au boats and fired at 923 K for 5 hours. Prior to heating, the starting reagents were dried at either 453 (for Li2CO3) or 773 K (for oxides) for 12 hours. The samples were then calcined at 1173 K for 36 hours, with intermediate regrinding. Identical specimens of Li2NiGe3O8 were used for all XRD, impedance, solid-state NMR and μSR studies.Samples were characterised by X-ray diffraction (XRD) using a Bruker D2 Phaser diffractometer with Cu Kα (λ = 1.5418 Å) radiation. The ICDD's PDF-4+ database (2019 edition) and SIeve+ software were used for phase analysis. Rietveld refinements were performed using the GSAS-II software.27
2.2 Impedance spectroscopy
Pellets of Li2NiGe3O8 were prepared for impedance spectroscopy measurements by uniaxial pressing. Pellets were placed onto sacrificial powder in an alumina crucible and sintered at 1223 K for 6 or 24 hours, resulting in pellets with 66% and 81% density, respectively. Both pellet faces were polished and gold electrodes applied to each as a paste. Each pellet was then annealed at 1123 K for 2 hours. All heating steps described used heating/cooling rates of 5 °C min−1. Impedance measurements were collected using a Solartron Analytical/Ametek ModuLab XM MTS system from 1 MHz to 30 mHz with a 100 mV applied AC voltage. Measurements were taken during heating from 336 to 541 K.2.3 Solid-state NMR spectroscopy
Solid-state NMR spectra were acquired using a Bruker 500 Avance III HD spectrometer, equipped with a wide-bore 11.7 T Oxford magnet, using Larmor frequencies of 194.4 MHz for 7Li (I = 3/2) and 73.6 MHz for 6Li (I = 1). Powdered samples were packed into conventional 4.0 or 1.3 mm ZrO2 rotors and magic-angle spinning (MAS) rates of 10 and 60 kHz were employed, respectively. Both 6Li and 7Li chemical shifts were referenced to 1 M LiCl(aq).Conventional 7Li MAS NMR spectra were obtained using a single-pulse experiment with typical pulse lengths of 3 μs. 6Li MAS NMR spectra were acquired using a Hahn echo experiment (90x–τ–180y) with a typical π/2 pulse length of 3 μs. Typical radiofrequency field strengths of 84 kHz were employed and an experimentally optimised recycle interval of 0.2 s was used for both 7Li and 6Li. Standard variable-temperature (VT) 6Li MAS NMR experiments were completed between 260 and 412 K using conventional hardware and the parameters stated above. In all cases, temperatures were calibrated using the 1H signal of MeOH; quoted temperatures thus reflect the true sample temperature during the experiment.
Additional static variable-temperature 6Li NMR experiments were completed for Li2NiGe3O8 over the temperature range 204 to 609 K using a Bruker 400 Avance III HD spectrometer, equipped with a wide-bore 9.7 T magnet, using a Larmor frequency of 58.9 MHz for 6Li. The sample was packed into a 5.0 mm glass tube and placed into a Bruker 5.0 mm static probe. The static NMR spectra were acquired using a standard solid echo experiment (90x–τ–90y), with a typical π/2 pulse length of 5 μs. Here, τ represents an echo delay of 200 μs between 197 and 542 K and 250 μs at 609 K. The interpulse delay was increased in order to acquire the whole echo at higher temperatures. Typical radiofrequency field strengths of 50 kHz were employed and the experimentally optimised recycle interval was 0.05 s. In all cases, true sample temperatures during experiments have been determined using a lead nitrate calibrant.
2.4 Muon spin relaxation (μSR) spectroscopy
All μSR measurements were performed using the EMU instrument at the ISIS pulsed muon facility. Around ∼1 g of sample was packed into a disk of 30 mm diameter and 1.5 mm thickness and sealed in a Ti sample holder with a ∼25 μm thick Ti foil window. The sample was implanted with 3.2 MeV spin-polarised positive muons, and the out-coming positrons detected by 96 scintillator segments arranged in two circular arrays. Data were collected from 39–555 K using a closed cycle refrigerator under three different applied longitudinal magnetic fields (0, 5 and 10 G). Initial symmetry calibrations were conducted using a 20 G transverse magnetic field. Data analysis was conducted using the WiMDA program.28 Collection of data in multiple longitudinal fields enabled (i) the controlled decoupling of interactions between the implanted muons and any local magnetic field distributions, and (ii) additional constraints in and hence more reliable results from the fitting process.3 Results and discussion
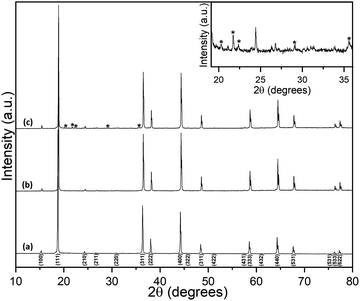
Room-temperature powder XRD data for Li2NiGe3O8 are shown in Fig. 1. Bragg peaks were indexed to the P4332 space group, with no additional or missing reflections, giving a refined lattice parameter a = 8.1848(5) Å, in good agreement with previous reports.25,26 Details of the corresponding Rietveld refinement and a list of refined structural parameters are given in the ESI.† A Li2NiGe3O8 pellet sintered at 1223 K for 24 h showed small additional Bragg peaks which are likely caused by lithium volatilisation, resulting in the onset of thermal decomposition and formation of impurities. Despite a rigorous search of the 2019 edition of the ICDD PDF-4+ database, we were unable to identify the additional phases present. It is noted that these peaks were not observed in data collected for a pellet sintered at the same temperature for 6 h.3.1 Lithium-ion conductivity analysis by impedance spectroscopy
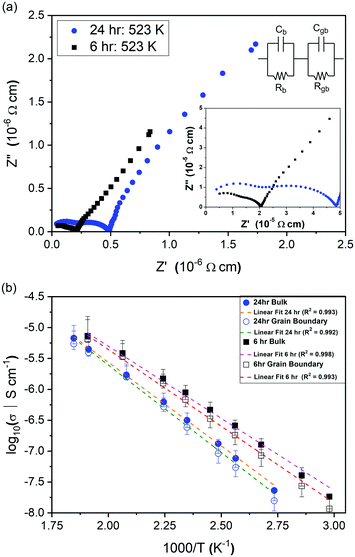
Impedance data were collected for Li2NiGe3O8 pellets sintered for 6 and 24 h. Owing to the lack of mixed valence Ni and Ge species in Li2NiGe3O8, the electrical conductivity is expected to be negligible, as previously reported.19,25 Hence, the responses observed in impedance data are likely due to Li+ ion conduction. The complex impedance spectra obtained in Fig. 2(a) show two partly resolved arcs followed by a low frequency spike.Irrespective of the sintering time, the arc observed at higher frequencies has an associated capacitance of ∼3.1 × 10⁻¹² F, indicative of bulk, intra-granular responses. The second, intermediate frequency arc, with capacitance ∼1 × 10⁻¹¹ F, is attributed to the response from the grain boundary component.29 Under both sintering conditions, a subsequent low-frequency Warburg spike, inclined at ∼50° to the horizontal axis, was observed with associated capacitance of ∼10−6 F, indicative of complete or partial ion blocking at the electrode, representative of ionic conductivity in Li2NiGe3O8.29
To extract conductivities from the arcs attributed to intra-granular and grain boundary responses in the complex impedance spectra, fitting was performed using Z-View. Bulk conductivities were taken from the intersection of two manually fitted parallel RC semicircles, with errors calculated from the intersection of the semicircles with the Z′ axis. The extracted bulk conductivities, as a function of inverse temperature, are shown in Fig. 2(b). For both samples, the data follows typical Arrhenius-type behaviour, enabling activation energies to be calculated. The pellet sintered for 6 h exhibited an activation energy of 0.46 ± 0.01 eV, whilst the pellet fired for 24 h showed a higher value, 0.53 ± 0.01 eV, closer to that previously reported by Kawai et al. (0.55 eV) for Li2NiGe3O8 sintered for 24 h.25 Assuming all Li in the spinel unit cell contribute to diffusion, an intra-grain diffusion coefficient, DLi, of 2.26 × 10⁻¹³ cm s−1 can be estimated from impedance data at 336 K using the Nernst–Einstein equation:30
It is evident from Fig. 2(a) and (b) that longer sintering times leads to a concomitant decrease in both bulk and grain boundary conductivities. This difference is attributed to the loss of lithium and subsequent formation of additional phases during sintering at temperatures close to the reported melting point of Li2NiGe3O8 (1243 K).25
3.2 Probing Li diffusion using solid-state NMR
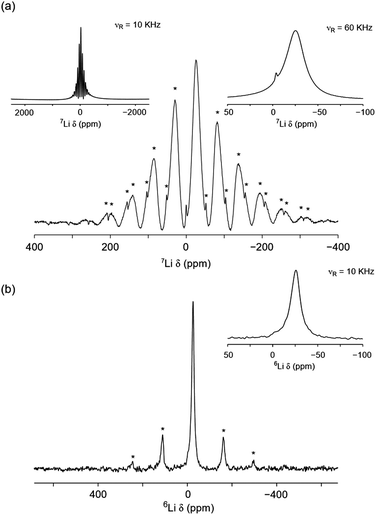
Using solid-state NMR spectroscopy it is possible to probe both local structural changes and ion mobility. Both lithium nuclides (6Li and 7Li) are suitable for NMR spectroscopy, however, one is often preferred over the other, depending on the specific system under investigation. Typically, 7Li is favoured because of its higher natural abundance (92.5%) when compared to 6Li (7.5%). However, its large quadrupole moment can give rise to relatively broad lines when Li is in a low symmetry site. In such cases, 6Li is often preferred because it can allow close or overlapped resonances to be resolved. Moreover, because of its smaller quadrupolar interaction, the 6Li shift may be more closely approximate to the isotropic chemical shift, thereby providing a better measure of the Li bonding environment.31 The 7Li and 6Li MAS NMR spectra obtained for Li2NiGe3O8 are shown in Fig. 3(a) and (b), respectively. The 7Li MAS NMR spectrum acquired at 10 kHz exhibits a lineshape characteristic of a paramagnetic-containing species, i.e., a complex manifold of spinning sidebands. The spectrum obtained indicates the presence of two resonances at δ ≈ −25 and 0 ppm, likely corresponding to two distinct Li sites, in good agreement with the reported P4332 phase of Li2NiGe3O8.The variation in 6,7Li chemical shift with coordination number is well reported for a variety of crystalline systems.32 Typically, in diamagnetic systems, LiO4 environments exhibit chemical shifts between δiso = 0–3 ppm, whilst LiO6 environments are between −1 and 0 ppm.31,32 In paramagnetic systems, these shifts can be altered substantially by the presence of a paramagnetic species, i.e., the presence of an unpaired electron(s).33,34
Based on the chemical shifts reported in the literature, coupled with the X-ray diffraction data presented here, and the relative intensities of each resonance, the resonance at δ ≈ −25 ppm is believed to correspond to the tetrahedral 8c site and the resonance at δ ≈ 0.0 ppm corresponds to the octahedral 12d site. Hence, at room temperature, it appears that small amounts of Li occupy the vacant octahedral site, which is in contrast to previous diffraction studies.26 In the spectrum, the tetrahedral site is shifted from its expected position, indicating that it is directly affected by the presence of paramagnetic Ni2+, i.e., it is experiencing a Knight shift, although the shift observed here is relatively small when compared to similar reported systems where the resonance can be shifted by several hundreds of ppm.33,34 A fast spinning (60 kHz) 7Li MAS NMR spectrum was also acquired for Li2NiGe3O8 (shown as an inset in Fig. 3(a)), which revealed the presence of two resonances, one broad resonance at δ = −25.3 ppm, belonging to the tetrahedral Li site and a sharper resonance at δ = −3.9 ppm corresponding to the octahedral Li site. It is noted that the extra resolution afforded by faster MAS rates indicates that a Knight shift is also observed for the octahedral site. At slower MAS rates the lineshape is broadened, which hinders the extraction of an accurate shift for this site. Again, the intensities indicate that a small quantity of Li is occupying the octahedral sites. To verify the quantity of Li on each site, the spectrum was fitted to determine the approximate ratio of tetrahedral to octahedral sites. It is noted that this is somewhat challenging based on the broadened nature and overlap of the two sites. Occupancies of 0.024 and 0.976 were obtained for the octahedral and tetrahedral sites, respectively (Fig. S4, ESI†). This is in good agreement with the slow spinning (10 kHz) 7Li MAS NMR spectrum.
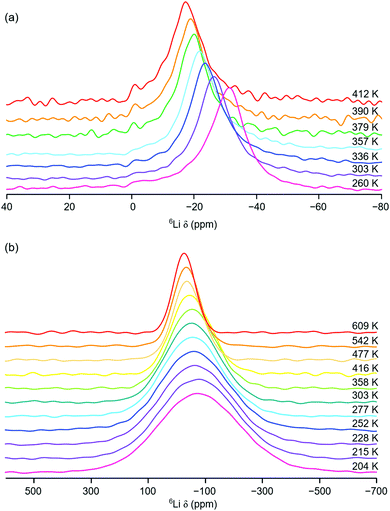
Initial variable-temperature 6Li MAS NMR studies of Li2NiGe3O8 were completed over the temperature range 260 to 412 K. The corresponding spectra are shown in Fig. 4(a). Between 260 and 357 K, a single broad resonance is observed. As the temperature is increased to 379 K a second resonance appears at δ = −1.1 ppm, indicating the presence of a second Li site, believed to correspond to the octahedral Li site. The appearance of this site upon heating indicates diffusion of the Li ions from the tetrahedral 8c site onto one of the three neighbouring vacant 12d octahedral sites via a hopping mechanism. The presence of a second site is in good agreement with previous high temperature (∼350–850 °C) ToF ND structural studies of Li2NiGe3O8.26 However, the solid-state NMR data presented indicate that Li diffusion onto the octahedral site(s) occurs at lower temperatures than previously reported.26 In fact, our 7Li MAS NMR data (vide supra) suggest that, even at room temperature, some of the vacant octahedral 12d sites are occupied. However, owing to relatively poor signal-to-noise in the VT 6Li MAS NMR spectra, it is challenging to accurately determine the precise temperature at which Li ions become mobile and move between the 8c and 12d sites.
As the temperature is increased, there is an obvious, yet gradual, linear change in chemical shift of the resonance corresponding to the tetrahedral site, towards more positive values. For example, the resonance is centred at δ = −31.3 ppm at 260 K and moves to δ = −17.2 ppm at 412 K. This is in contrast to the trend expected with increasing temperature for a paramagnetic system.
Typically, as temperature is increased, Li chemical shift values move to lower (or more negative) values, thereby obeying Curie–Weiss behaviour.35 As stated earlier, a Knight shift is observed for the tetrahedral site in the 7Li MAS NMR spectrum obtained at room temperature. This indicates that the tetrahedral Li site is closer in the structure to the paramagnetic Ni2+ centre. In contrast, the resonance assigned to the octahedral 12d site exhibits a very small change in chemical shift, moving from δ = −1.1 ppm to δ = −0.9 ppm, with increasing temperature. It is noted that, owing to the relatively low intensity and broad nature of the resonance, it is challenging to accurately determine the precise chemical shift observed. However, the resonance is not shifted to the same extent as that corresponding to the tetrahedral Li site. This suggests that the octahedral 12d site is positioned further away from the Ni2+ in the structure and therefore does not experience the same effect of the paramagnetic species, i.e., no significant Knight shift. As temperature is increased and Li ions increasingly migrate from the tetrahedral site onto the octahedral site they move further and further away from the paramagnetic species. As a result, their chemical shift changes (becoming more positive). In Li2NiGe3O8, the octahedral Li site is ∼4 Å from the Ni centre, compared to a separation of ∼3.2 Å between the tetrahedral site to the Ni centre. Similar VT 7Li MAS NMR experiments were completed between 260 and 357 K and the same trend in chemical shift was observed, Fig. S5 in the ESI.† Hence, the VT 6Li and 7Li MAS NMR data are in good agreement.
To further investigate Li+ ion mobility in Li2NiGe3O8, additional static variable-temperature 6Li NMR experiments were completed over a greater temperature range (204 to 609 K). It is noted that, due to hardware limitations, it is not possible to acquire 6Li MAS NMR data over this temperature range. The VT static 6Li NMR spectra obtained are shown in Fig. 4(b). Below room temperature, a single broad and relatively featureless lineshape is observed. As the temperature is increased, line narrowing is observed, indicative of Li+ ion mobility within Li2NiGe3O8, in good agreement with the VT 6Li MAS NMR data.
The variation in 6Li chemical shift and full width at half maximum (FWHM) with increasing temperature are shown in Fig. 5, where a linear change in chemical shift is observed and a gradual narrowing of the resonance is also observed, again indicative of Li ion motion. In contrast to the MAS NMR data, it was not possible to resolve distinct Li sites or the individual contributions from the 8c tetrahedral and 12d octahedral Li sites in the observed lineshape. In this instance, the 6Li NMR data is only capable of identifying the presence of Li+ ion mobility within Li2NiGe3O8 and not the precise contribution of each site. To gain further insight into the ion mobility, 6Li T1 measurements were attempted for Li2NiGe3O8 using a saturation recovery experiment. However, owing to the paramagnetic nature of the sample, the relaxation properties of the system were too fast and could not be accurately measured. Similarly, using the VT NMR data acquired, and analysis of the corresponding FWHM, attempts were made to obtain an activation energy for Li migration. Unfortunately, due to a combination of hardware limitations and the specific characteristics of the system under investigation, we were unable to acquire the full motional narrowing curve for Li2NiGe3O8 (Fig. 5(b)). Hence, we were unable to obtain an activation energy.
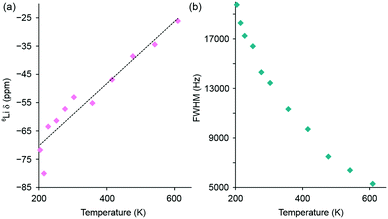 | ||
| Fig. 5 Variation in (a) 6Li chemical shift and (b) full width at half maximum (FWHM) with increasing temperature for the 6Li static NMR data obtained for Li2NiGe3O8. The corresponding spectra are shown in Fig. 4(b). | ||
3.3 Investigation of intra-grain diffusion by μSR
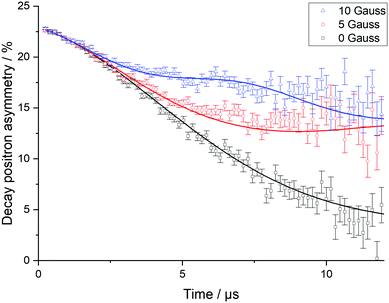
To explore Li+ ion diffusion in greater depth, muon spectroscopy, μSR, was used. Positively charged muons, μ+, have a lifetime of 2.197 μs and are 100% spin polarised. They can be implanted ∼200 μm into a sample and are expected to reside near oxygen sites.36–39 The μ+ spin can precess depending on the different magnetic fields it experiences, such as external applied fields, fields from nearby nuclei, or those from unpaired electrons in paramagnetic species. The diffusion of Li+ ions leads the μ+ to undergo a spin flip due to the inherent nuclear magnetic moment of lithium. When the μ+ decays, the positron produced is most likely to be emitted in the direction of the μ+ spin at decay. By recording the positrons emitted from opposite sides of the sample, the asymmetry of positrons can then be followed as a function of time and the evolution of the muon spin ensemble deduced.Muon decay asymmetry data collected in longitudinal magnetic fields of 0, 5 and 10 G at various temperatures were fitted using WiMDA. For each temperature point, data from all three fields were fitted to a single model using Keren's analytic generalisation of the Abragam function, multiplied by an exponential relaxation term to account for the presence of paramagnetic Ni.40 Example fitted data for Li2NiGe3O8 at room temperature are shown in Fig. 6.
From the different fits, the calculated fluctuation rate, ν, and local magnetic field distribution, Δ, were extracted and their variation with temperature is shown in Fig. 7(a) and (b). The fluctuation rate shows a plateau at lower temperatures, followed by an Arrhenius-like increase due to thermally activated diffusion of lithium ions above ∼300 K. This increase in fluctuation rate continues to 421 K; the subsequent decrease observed at higher temperatures is likely indicative of Li+ ions hopping at rates too fast for μSR to capture.36,37 The values obtained for Δ, Fig. 7(b), support this hypothesis; Δ is constant, within errors, at low temperatures, due to the slow rate of lithium hopping, but then shows a significant decrease from ∼380 K related to the effect of motional narrowing, where Li+ ions are moving quickly and their nuclear spins differ from point to point within the sample. Above 442 K, lithium diffusion coefficients become too large for the muons to capture, and Δ values plateau again.
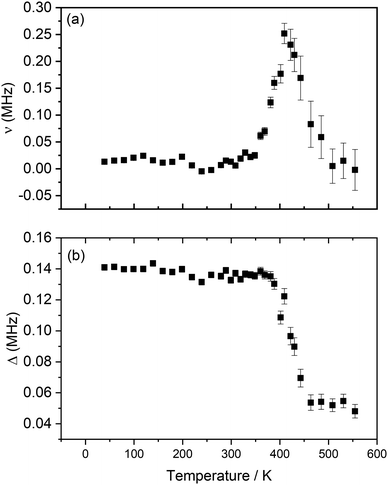 | ||
| Fig. 7 Variation of ν (a) and Δ (b) with temperature obtained from the fitting of raw asymmetry data to the Keren function for Li2NiG3O8, measured from 40 K to 555 K. | ||
3.4 Elucidating diffusion mechanisms
The lithium ion diffusion coefficient for Li2NiGe3O8 can be calculated using the equation:where Ni is the number of accessible Li sites in the ith path, Zν,i is the vacancy fraction of the destination sites in the ith path, Si is the hopping distance between sites, and ν is the fluctuation rate at 300 K, and assumed to be related to Li+ ions hopping between 8c and 12d crystallographic sites, as reported previously.26,41
Based on the findings obtained using μSR and solid-state NMR spectroscopy, additional analysis was conducted on the crystal structural refinements, using the ToF ND data previously reported by our group.26 Therein, refinements conducted on room temperature data had indicated within standard statistical approaches that the 8c site was fully and solely occupied by Li; occupancy of the 12d migratory interstitial had only been noted where datasets had been collected at temperatures above ambient conditions. This does not preclude the possibility of very low concentrations of lithium hopping between the two sites at, or close to, ambient conditions – such results would merely be statistically indistinguishable from the fully ordered structure reported. This assumption is in good agreement with the 6,7Li MAS NMR and μSR data presented (Fig. 3 and 7). Therefore, in order to calculate the true diffusion coefficient at 300 K, refined occupancies of both the 8c and 12d sites from 350 ≤ T/°C ≤ 850 were linearly extrapolated (Fig. S6, ESI†) to give proposed fractional occupancies, or Zν,i, of 0.97 and 0.03 for the 8c and 12d sites respectively at 300 K (Table S2, ESI†). This is in good agreement with the occupancies obtained from the 7Li MAS NMR data (vide supra).
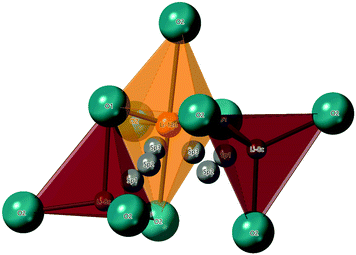
The hopping distance, Si, in Li2NiGe3O8 can be calculated by considering that an ion hopping between the 8c and 12d sites likely passes through three saddle points (SP) along the way, in the LiO4 tetrahedral and LiO6 octahedral faces, and an empty tetrahedral site. Once in the 12d site, Li+ ions can hop to one of two neighbouring 8c sites (one of which is the original 8c site). A reasonable hopping distance of 2.95 Å can thus be calculated from the distances between the 8c-SP1-SP2-SP3-12d sites along this proposed conduction pathway (Fig. 8).
By following these assumptions, the calculated diffusion coefficient, DLi, for Li2NiGe3O8 at 300 K is found to be 3.89 × 10⁻¹² cm2 s−1 (Table S2, ESI†). This is in good agreement with the figure extracted from impedance spectroscopy data, and is similar to values reported for other spinel-type materials, e.g., Li4Ti5O12 which has a diffusion coefficient, DLi of between 3.2 × 10⁻¹¹ to 4.0 × 10⁻¹² cm2 s−1, depending on the technique used and precise degree of lithiation.42,43 By comparison, other solid electrolyte candidate materials based on the Li-stuffed garnet structure, e.g., Li6.5Al0.25La2.92Zr2O12, with a faster ionic conductivity and shorter hopping distance (1.67 Å), has a Li+ ion diffusion coefficient of 4.62 × 10⁻¹¹ cm2 s−1.39
An activation energy of 0.43 ± 0.03 eV for lithium hopping in our powdered sample of Li2NiGe3O8 was calculated from an Arrhenius plot of log DLi over the thermally activated region (Fig. 9), in good agreement with the value obtained from EIS data on a pellet sintered for 6 h (0.46 ± 0.01 eV), but considerably lower than that observed after a 24 h sinter (0.53 ± 0.01 eV). This is further evidence that long dwell times at temperatures close to the melting point result in Li loss through volatilisation. As a result, additional studies aimed at identifying less extreme consolidation methods are currently underway. Length-scale dependent ion dynamics are well known in the literature with LiFePO4 being a particular prominent example,44 where the activation energy changes several-fold and the diffusion constant by several orders-of-magnitude. In Li2NiGe3O8 the change in activation energy is far less pronounced.
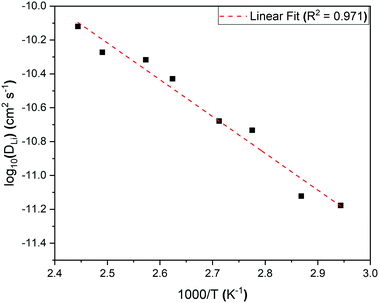 | ||
| Fig. 9 Arrhenius plot of the diffusion coefficient in the temperature range 340 K to 410 K for the complex spinel, Li2NiGe3O8. The calculated activation energy from the slope is 0.43 ± 0.03 eV. | ||
4 Conclusions
Lithium-ion diffusion mechanisms in the complex spinel Li2NiGe3O8 have been investigated using a range of complementary techniques. Building on previous reports of an 8c-12d-8c conduction pathway, using μSR and 6,7Li solid-state NMR spectroscopy, we have shown that Li+ ion hopping becomes thermally activated at ∼300 K, resulting in partial occupancy of the migratory interstitial site at lower temperatures than previously reported. A lithium diffusion coefficient of 3.89 × 10⁻¹² cm2 s−1 at 300 K and an activation energy for lithium hopping of 0.43 ± 0.03 eV were determined using μSR on powdered samples. This energy is considerably lower than that observed for sintered pellets (0.46 ± 0.01 and 0.53 ± 0.01 eV, depending on the sintering conditions), suggesting that the investigation of an alternate consolidation route, avoiding Li volatilisation, may be worthwhile. This work also highlights the necessity of using multiple complementary techniques, such as impedance spectroscopy, solid-state NMR and μSR, as local probes in order to gain a more complete understanding of hopping mechanics in important ionic conductors.Conflicts of interest
There are no conflicts to declare.Acknowledgements
The PhD work of DZCM under the supervision of NRM and RB was funded by EPSRC through a Doctoral Training Partnership grant awarded to the University of Sheffield. RB acknowledges support by the Lloyd's Register Foundation and Royal Academy of Engineering under the Research Fellowships scheme. The authors extend their gratitude to the ISIS Neutron & Muon Facility for the award of EMU Beamtime. KEJ and ARH would like to thank the EPSRC Doctoral Training Partnership EP/N509462/1 for the award of a studentship to ARH and Dr David Apperley for experimental assistance.References
- M. Armand and J.-M. Tarascon, Nature, 2008, 451, 652–657 CrossRef CAS PubMed.
- J. B. Goodenough and K. Park, J. Am. Chem. Soc., 2013, 135, 1167–1176 CrossRef CAS PubMed.
- N. Nitta, F. Wu, J. T. Lee and G. Yushin, Mater. Today, 2015, 18, 252–264 CrossRef CAS.
- P. G. Balakrishnan, R. Ramesh and T. P. Kumar, J. Phys. Chem. Lett., 2006, 155, 401–414 CAS.
- J. B. Goodenough and Y. Kim, Chem. Mater., 2010, 22, 587–603 CrossRef CAS.
- Q. Li, J. Chen, L. Fan, X. Kong and Y. Lu, Green Energy Environ., 2016, 1, 18–42 CrossRef.
- Samsung, 2016, http://www.samsung.com/us/note7recall/.
- J. C. Bachman, S. Muy, A. Grimaud, H. Chang, N. Pour, S. F. Lux, O. Paschos, F. Maglia, S. Lupart, P. Lamp and L. Giordano, Chem. Rev., 2016, 116, 140–162 CrossRef CAS PubMed.
- N. Kamaya, K. Homma, Y. Yamakawa, M. Hirayama, R. Kanno, M. Yonemura, T. Kamiyama, Y. Kato, S. Hama and K. Kawamoto, Nat. Mater., 2011, 10, 682–686 CrossRef CAS PubMed.
- Y. Li, J.-T. Han, C.-A. Wang and J. B. Goodenough, J. Mater. Chem., 2012, 3, 15357–15361 RSC.
- R. Kanno and M. Murayama, J. Electrochem. Soc., 2001, 148, 742–746 CrossRef.
- A. C. Luntz, J. Voss and K. Reuter, J. Phys. Chem. Lett., 2015, 6, 4599–4604 CrossRef CAS PubMed.
- J. Kasemchainan, P. G. Bruce and J. Matthey, Technol. Rev., 2018, 62, 177–180 CAS.
- V. Thangadurai, S. Narayanan and D. Pinzaru, Chem. Rev., 2014, 43, 4714–4727 CAS.
- A. Orera and J. Campo, Inorg. Chem., 2016, 55, 1324–1332 CrossRef CAS PubMed.
- K. Hofstetter, A. J. Samson, S. Narayanan and V. Thangadurai, J. Power Sources, 2018, 390, 297–312 CrossRef CAS.
- W. H. Bragg, Philos. Mag., 1915, 30, 305–315 CAS.
- S. Nishikawa, Proc. Math. Phys. Soc. Tokyo, 1915, 8, 199–209 CAS.
- M. Nakayama, R. Jalem and T. Kasuga, Solid State Ionics, 2014, 262, 74–76 CrossRef CAS.
- H. Kawai, M. Nagata, H. Tukamoto and A. R. West, Electrochem. Solid-State Lett., 1998, 1, 212–214 CrossRef CAS.
- A. Manthiram, K. Chemelewski and E. Lee, Energy Environ. Sci., 2014, 7, 1339–1350 RSC.
- M. M. Thackeray, J. Am. Ceram. Soc., 1999, 54, 3347–3354 Search PubMed.
- B. M. Wagemaker, D. R. Simon, E. M. Kelder, J. Schoonman, C. Ringpfeil, U. Haake, D. Lützenkirchen-hecht, R. Frahm and F. M. Mulder, Adv. Mater., 2006, 18, 3169–3173 CrossRef.
- T. Ohzuku, A. Ueda and N. Yamamota, J. Electrochem. Soc., 1995, 142, 1431–1435 CrossRef CAS.
- H. Kawai, M. Tabuchi, M. Nagata, H. Tukamoto and A. R. West, J. Mater. Chem., 1998, 8, 1273–1280 RSC.
- N. Reeves-Mclaren, R. I. Smith and A. R. West, Chem. Mater., 2011, 23, 3556–3563 CrossRef CAS.
- B. H. Toby and R. B. Von Dreele, J. Appl. Crystallogr., 2013, 46, 544–549 CrossRef CAS.
- F. L. Pratt, Phys. B, 2000, 289–290, 710–714 CrossRef.
- J. T. S. Irvine, D. C. Sinclair and A. R. West, Adv. Mater., 1990, 2, 132–138 CrossRef CAS.
- M. M. Ahmad, RSC Adv., 2015, 25824–25829 RSC.
- K. MacKenzie and S. Mark, Multinuclear Solid-State Nuclear Magnetic Resonance of Inorganic Materials (Pergamon Materials Series), Elsevier Science Ltd, 2002, pp. 629–639 Search PubMed.
- Z. Xu and J. F. Stebbins, Solid State Nucl. Magn. Reson., 1995, 5, 103–112 CrossRef CAS PubMed.
- Y. J. Lee, F. Wang and C. P. Grey, J. Am. Chem. Soc., 1998, 120, 12601–12613 CrossRef CAS.
- C. P. Grey and Y. J. Lee, Solid State Sci., 2003, 5, 883–894 CrossRef CAS.
- L. S. Cahill, R. P. Chapman, C. W. Kirby and G. R. Goward, Appl. Magn. Reson., 2007, 32, 565–581 CrossRef CAS.
- P. J. Baker, I. Franke, F. L. Pratt, T. Lancaster, D. Prabhakaran, W. Hayes and S. J. Blundell, Phys. Rev. B: Condens. Matter Mater. Phys., 2011, 84, 1–8 Search PubMed.
- M. Mansson and J. Sugiyama, Phys. Scr., 2013, 88, 1–13 CrossRef.
- M. J. Ariza, D. J. Jones, J. Roziere, J. S. Lord and D. Ravot, J. Phys. Chem. B, 2003, 107, 6003–6011 CrossRef CAS.
- M. Amores, T. E. Ashton, P. J. Baker, E. J. Cussen and S. A. Corr, J. Mater. Chem. A, 2016, 4, 1729–1736 RSC.
- A. Keren, Phys. Rev. B: Condens. Matter Mater. Phys., 1994, 50, 10039–10042 CrossRef CAS PubMed.
- R. J. Borg and G. J. Dienes, An Introduction to Solid State Diffusion, Academic, San Diego, CA, 1988 Search PubMed.
- J. Sugiyama, H. Nozaki, I. Umegaki, K. Mukai, K. Miwa, S. Shiraki, T. Hitosugi, A. Suter, T. Prokscha, Z. Salman, J. S. Lord and M. Martin, Phys. Rev. B: Condens. Matter Mater. Phys., 2015, 92, 1–9 CrossRef.
- W. J. H. Borghols, M. Wagemaker, U. Lafont and E. M. Kelder, J. Phys. Chem. B, 2009, 12, 17786–17792 Search PubMed.
- G. Krishna, P. Dathar, D. Sheppard, K. J. Stevenson and G. Henkelman, Chem. Mater., 2011, 4032–4037 Search PubMed.
Footnote |
| † Electronic supplementary information (ESI) available. See DOI: 10.1039/c9cp02907a |
| This journal is © the Owner Societies 2019 |

