
 Open Access Article
 This Open Access Article is licensed under a Creative Commons Attribution-Non Commercial 3.0 Unported Licence
Local electronic structure of the peptide bond probed by resonant inelastic soft X-ray scattering†
L.
Weinhardt
 *abc,
A.
Benkert
ad,
F.
Meyer
d,
M.
Blum
ce,
D.
Hauschild
ab,
R. G.
Wilks
f,
M.
Bär
fgh,
W.
Yang
e,
M.
Zharnikov
i,
F.
Reinert
d and
C.
Heske
abc
*abc,
A.
Benkert
ad,
F.
Meyer
d,
M.
Blum
ce,
D.
Hauschild
ab,
R. G.
Wilks
f,
M.
Bär
fgh,
W.
Yang
e,
M.
Zharnikov
i,
F.
Reinert
d and
C.
Heske
abc
aInstitute for Photon Science and Synchrotron Radiation (IPS), Karlsruhe Institute of Technology (KIT), Hermann-v.-Helmholtz-Platz 1, 76344 Eggenstein-Leopoldshafen, Germany. E-mail: lothar.weinhardt@kit.edu
bInstitute for Chemical Technology and Polymer Chemistry (ITCP), Karlsruhe Institute of Technology (KIT), Engesserstr. 18/20, 76128 Karlsruhe, Germany
cDepartment of Chemistry and Biochemistry, University of Nevada, Las Vegas (UNLV), 4505 Maryland Parkway, NV 89154-4003, USA
dUniversity of Würzburg, Experimental Physics VII, Am Hubland, 97074 Würzburg, Germany
eAdvanced Light Source (ALS), Lawrence Berkeley National Laboratory, 1 Cyclotron Road, Berkeley, CA 94720, USA
fInterface Design, Helmholtz-Zentrum Berlin für Materialien und Energie GmbH, Albert-Einstein-Str. 15, 12489 Berlin, Germany
gHelmholtz-Institute Erlangen-Nürnberg for Renewable Energy, Albert-Einstein-Str. 15, 12489 Berlin, Germany
hDepartment of Chemistry and Pharmacy, Friedrich-Alexander-Universität Erlangen-Nürnberg, Egerlandstr. 3, 91058 Erlangen, Germany
iApplied Physical Chemistry, Heidelberg University, Im Neuenheimer Feld 253, 69120 Heidelberg, Germany
First published on 31st May 2019
Abstract
The local valence orbital structure of solid glycine, diglycine, and triglycine is studied using soft X-ray emission spectroscopy (XES), resonant inelastic soft X-ray scattering (RIXS) maps, and spectra calculations based on density-functional theory. Using a building block approach, the contributions of the different functional groups of the peptides are separated. Cuts through the RIXS maps furthermore allow monitoring selective excitations of the amino and peptide functional units, leading to a modification of the currently established assignment of spectral contributions. The results thus paint a new-and-improved picture of the peptide bond, enhance the understanding of larger molecules with peptide bonds, and simplify the investigation of such molecules in aqueous environment.
Introduction
Amino acids are the most basic building blocks of life. They connect via peptide bonds to form peptides, which, in turn, are folded into proteins. Thus, in addition to the secondary and tertiary structure of the proteins, the primary structure (i.e., the amino acid sequence) plays a fundamentally important role for the function of the protein. It is therefore of high interest to understand the bonding between the amino acids, as well as the interaction of the peptides with their environment (e.g., in aqueous solution).Soft X-ray spectroscopic techniques, namely X-ray absorption spectroscopy (XAS), X-ray emission spectroscopy (XES), and resonant inelastic X-ray scattering (RIXS) have proven to be very powerful tools to probe the electronic structure of such molecules. XAS, in particular, has been used to study amino acids,1–13 small peptides,1–4,8,13–19 and proteins8,16,17,20–24 – as a solid, in the gas phase, as well as in aqueous solution. A spectral database of the XAS spectra of all proteinogenic amino acids is available.5 XAS spectra for peptides and proteins are very complex, and thus considerable work has been put into extracting the chemical and molecular structure information. Special attention has been paid to the XAS signature of the peptide bond,4 and even a “modified building block approach” was developed to predict the spectra of peptides.17
In comparison, only a few publications using XES and RIXS to study amino acids can be found.9,25–29 These also include a library of proteinogenic amino acids at all relevant absorption edges29 and allow for a “building block picture”.28 However, to our knowledge, peptides have not been studied with these techniques at all. And while XAS probes the unoccupied electronic states, XES and RIXS also give insights into the occupied valence states, including those directly responsible for the peptide bond. Applying these techniques, it is thus now possible to give a comprehensive description of the electronic structure of the peptide bond. Note that, due to the low fluorescence yield for soft X-rays, XES and RIXS experiments are challenging and require special care to minimize beam-induced damage to the studied molecules. Under our experimental conditions, this can be achieved by reducing the exposure of a given sample volume to about or less than a tenth of a second.26–29
In an early XES study on amino acids, glycine adsorbed on a Cu(110) surface was probed,25 while later studies focus on amino acids in bulk films/powders27,29 and aqueous solutions at different pH values.9,26,28 Gråsjö et al.9 show a strong influence of protonation/deprotonation at the amino and carboxyl groups. In a later study,26 we could furthermore show that the N K spectrum of the molecule with protonated amino group is strongly affected by proton dynamics on the time scale of the X-ray emission process. Building on the local character of the X-ray emission process, we could demonstrate that the spectra with excitation on selected functional groups (i.e., N K for the amino group and O K for the carboxyl(ate) group) are specific for this functional group and only slightly affected by the rest of the molecule.28,29 Based on the above-mentioned XES database of all proteinogenic amino acids,29 fingerprint spectra for these functional groups can now be used in a “building block approach” to study peptides and proteins. For these larger molecules, however, the situation becomes more complicated, since they possess other nitrogen- and oxygen-containing functional groups as well, in particular at the peptide bond itself (i.e., the formation of an amide group). To overcome this complication, we here use diglycine and triglycine as model peptides and compare them with glycine to derive the influence of the additional functional group on the N and O K spectra. We show that it is possible to separate the contributions of the amino/carboxylate groups from those of the peptide bond by taking suitable difference spectra and/or selecting suitable excitation energies from the RIXS maps of these molecules. This opens a new pathway for studying the peptide bond in complex molecules and, furthermore, allows us to derive a comprehensive and improved description of the peptide bond in small glycine-based peptides.
Experimental and theoretical section
XES and RIXS experiments were carried out at beamline 8.0.1 of the Advanced Light Source (ALS), Lawrence Berkeley National Laboratory (Berkeley, USA) with the dedicated Solid And Liquid Spectroscopic Analysis (SALSA) roll-up station.30 Spectra were collected using a high-transmission soft X-ray spectrometer31 with a variable line space (VLS) grating and a combined resolving power E/ΔE (both X-ray spectrometer and beamline) of better than 1000. For the calibration of the excitation and emission energy scales, the spectra of N2 gas32 and TiO233 at the N and O K edges and the elastically scattered (Rayleigh) lines at these energies were used, resulting in an uncertainty of the absolute energy scales of about ±0.2 eV, while the relative uncertainty between measurements is better than ±0.05 eV.Glycine, diglycine, and triglycine powders (Alfa Aesar, purity >99%) were pressed into pellets under ambient conditions with a hydraulic press (5 tons per cm2), using clean Teflon contact sheets. The resulting pellets (about 1 mm thick and 15 × 24 mm2 wide) were fixed to the sample holder using carbon tape, and then transferred into the vacuum chamber for measurement. To minimize/avoid radiation damage effects, the spectra were recorded at reduced beamline flux and while the samples were continuously moved under the beam, such that a given spot on the sample was, in total, exposed to X-rays for less than 90 ms. The choice of scan speed and flux was based on a separate radiation damage study, which is discussed in the ESI† in conjunction with Fig. S1.
As references for specific functional groups, acetic acid and acetamide solutions were measured. The pH value of the 25 wt% acetic acid solution (Sigma-Aldrich, purity >99%) was adjusted to 12.8 by adding NaOH to the solution, leading to a deprotonation of the acid group. A 1 mol l−1 solution of acetamide was prepared by dissolving acetamide powder (Sigma-Aldrich, purity >99%) in water. For the measurements, the flow-through liquid cell setup30 of the SALSA endstation was used, separating the sample liquid from the vacuum of the analysis chamber by a Si3N4 membrane (Silson). During the measurement, the sample liquids were continuously replenished to avoid radiation damage, such that a given volume of the liquid was exposed to X-rays for less than 5 ms.
XES and XAS spectra of isolated zwitterionic glycine, diglycine, and triglycine molecules were calculated using density-functional theory (DFT) within the StoBe-DeMon package,34 as described in more detail in the ESI.†
Results and discussion
In Fig. 1, the structural formulas of glycine, diglycine, and triglycine are shown. Glycine is the smallest amino acid and consists of an amino group and an acid (carboxyl) group, connected by CH2. In a condensation reaction, two (or three) glycine molecules can be connected via peptide (or amide) bonds (–C![[double bond, length as m-dash]](https://www.rsc.org/images/entities/char_e001.gif) ONH–), forming diglycine or triglycine, while releasing water in the process. In the solid state, all three molecules are found in the zwitterionic state [i.e., with a protonated amino and deprotonated acid (carboxylate) group], as presented in Fig. 1. Using XES at the N and O K edges, the local electronic structure at the nitrogen (blue) and oxygen (red) atoms can be probed. The corresponding non-resonant XES spectra of the three molecules are compiled in Fig. 2(a) for the N K edge and Fig. 2(b) for the O K edge, respectively.
ONH–), forming diglycine or triglycine, while releasing water in the process. In the solid state, all three molecules are found in the zwitterionic state [i.e., with a protonated amino and deprotonated acid (carboxylate) group], as presented in Fig. 1. Using XES at the N and O K edges, the local electronic structure at the nitrogen (blue) and oxygen (red) atoms can be probed. The corresponding non-resonant XES spectra of the three molecules are compiled in Fig. 2(a) for the N K edge and Fig. 2(b) for the O K edge, respectively.
 | ||
| Fig. 1 Chemical structure of the zwitterions of glycine (Gly), diglycine (DiGly), and triglycine (TriGly). In all three structures, the amino group is protonated (–NH3+) and the carboxyl group is deprotonated (forming carboxylate, COO−). Oxygen and nitrogen atoms are numbered and labelled. | ||
 | ||
| Fig. 2 (a) Non-resonant N K XES spectra of glycine (Gly), diglycine (DiGly), and triglycine (TriGly), normalized to area. Below the spectrum of glycine, two calculated spectra are shown (taken from ref. 26): a “static” electronic ground state DFT calculation and a “dynamic” calculation that includes molecular dynamics during the X-ray emission process. At the top (blue), weighted differences between the spectra of di-/triglycine and glycine are shown. Below the difference spectra, DFT calculations for the nitrogen atoms at the peptide bonds are shown as vertical bars (as calculated) and thin lines (broadened by Voigt profiles). (b) Non-resonant O K XES spectra of the three molecules, normalized to area. Below the spectrum of glycine, the DFT calculation for an isolated glycine zwitterion is depicted as black bars. Weighted difference spectra are again shown in blue, together with the DFT calculations for the oxygen atoms at the peptide bonds as vertical bars (as calculated) and thin lines (broadened by Voigt profiles). | ||
Glycine only contains a single N atom, and thus its N K XES spectrum (red in Fig. 2(a)) exclusively probes the (protonated) amino group (–NH3+) of the molecule. The spectrum exhibits a distinct line at ∼395 eV with a shoulder at its high emission energy side, a broad intense structure containing several features between ∼387 and ∼394 eV, and a weak peak at ∼384 eV. To discuss these different features, spectral calculations from ref. 26 are plotted below the experimental spectrum of glycine. These calculations were performed for glycine in aqueous solution, in which glycine is also found in the zwitterionic state. However, due to the different environment in the aqueous solution, some differences can occur, but by comparing the experimental spectrum in the solid state with that in solution,26 we find that these differences are small. Consequently, the calculations are used to discuss the main features of the solid sample spectra as well. Two types of calculations are shown: a “static” electronic ground state DFT calculation, and a “dynamic” calculation that includes dynamic effects that occur in the molecule on the time scale of the X-ray emission process (i.e., the core hole lifetime). Below the static calculation, the individual peak positions and intensities, as derived from the calculation, are shown as black bars. The static calculation does not reproduce the experimental spectrum in a satisfactory way – only some features of the experimental spectrum can be identified in this calculation. Most prominently, the observed spectral line at ∼395 eV is not reproduced in the static calculation. In contrast, this peak is indeed derived in the dynamic calculation, which, overall, gives a very good description of the experimental spectrum. As discussed in detail in ref. 26, the –NH3+ group undergoes ultrafast dissociation in the core-ionized state, and we find significant spectral contributions that can be related to a neutral amino group (–NH2) after dissociation. The dominant peak at ∼395 eV then corresponds to the lone-pair orbital of the neutral amino group, while the shoulder at ∼396 eV is due to the frontier orbital of the (undissociated) –NH3+ group.
For di- and triglycine, nitrogen atoms are found at two sites, namely at the amino group and at the peptide bond(s). Correspondingly, significant spectral differences in the N K XES spectra are observed. While the features of the amino group can still be identified, two additional spectral lines at ∼395.8 and ∼386.6 eV appear, and the spectral shape of the broad features between ∼388 and ∼394 eV changes. Making use of the fact that XES allows the local probing of selected functional groups in a building block approach,28,29 we subtract the N K XES spectrum of glycine (representing the amino group) from those of di- and triglycine to extract the contribution of the nitrogen in the peptide bond. This is done in Fig. 2(a) (top two spectra shown in blue) by subtracting the spectrum of glycine after normalizing its area to half of that of the spectrum of diglycine (and one-third of triglycine). The two difference spectra are very similar, with only some variation in intensity at ∼390 eV and the shoulder at ∼395 eV (note that, for better comparison, the diglycine difference spectrum was multiplied by 4/3). In the following, we will refer to these spectra as the “N K emission spectra of the peptide bond”.
For a detailed discussion of the spectral features, line positions and intensities were calculated for isolated di- and triglycine molecules and shown as vertical bars below the difference spectra. The most prominent lines are labelled, and the iso-density surfaces of the corresponding molecular orbitals are depicted in Fig. 3 as well. To allow for a better comparison between theory and experiment, spectra were simulated based on the calculations using a simple approach with Voigt line profiles to approximate the broadening caused by experimental resolution, lifetime, as well as vibrational fine structure. The Gaussian full-width-of-half-maximum (FWHM) was 0.6 eV, while the Lorentzian FWHM was linearly increased towards lower emission energies (with a slope of 0.2), starting from 0.4 eV for the HOMO transition. In the ESI,† iso-density surfaces of all valence orbitals of the three molecules are shown (Fig. S2–S4, ESI†). Note that these are static calculations, which do not include nuclear dynamics on the fs time scale (as discussed for the amino group above). However, based on earlier studies on glycine with neutral amino group26 (as opposed to the protonated amino group) and ammonia,35 it can be expected that nuclear dynamics will play a much smaller role for N K emission from the peptide nitrogen. Consequently, we expect that the static calculations give a reasonable description of the experimental spectra.
The HOMO, HOMO−1, and HOMO−2 orbitals of diglycine are predominantly located at the carboxylate group (see Fig. S3, ESI†) and consequently show no intensity in the N K emission spectra of the peptide bond. The spectrum is dominated by a sharp peak at 395.8 eV, which can be attributed to the lone-pair electrons at the nitrogen atom of the peptide bond (HOMO−3, see Fig. 3). The peak at 391.9 eV can be attributed to the HOMO−10, −11, and −12 orbitals, which are rather delocalized over the entire molecule except for the amino group (see Fig. S3, ESI†). The peak at 386.7 eV is likely indicative of a transition from the HOMO−15 orbital, which is mostly localized at the peptide nitrogen.
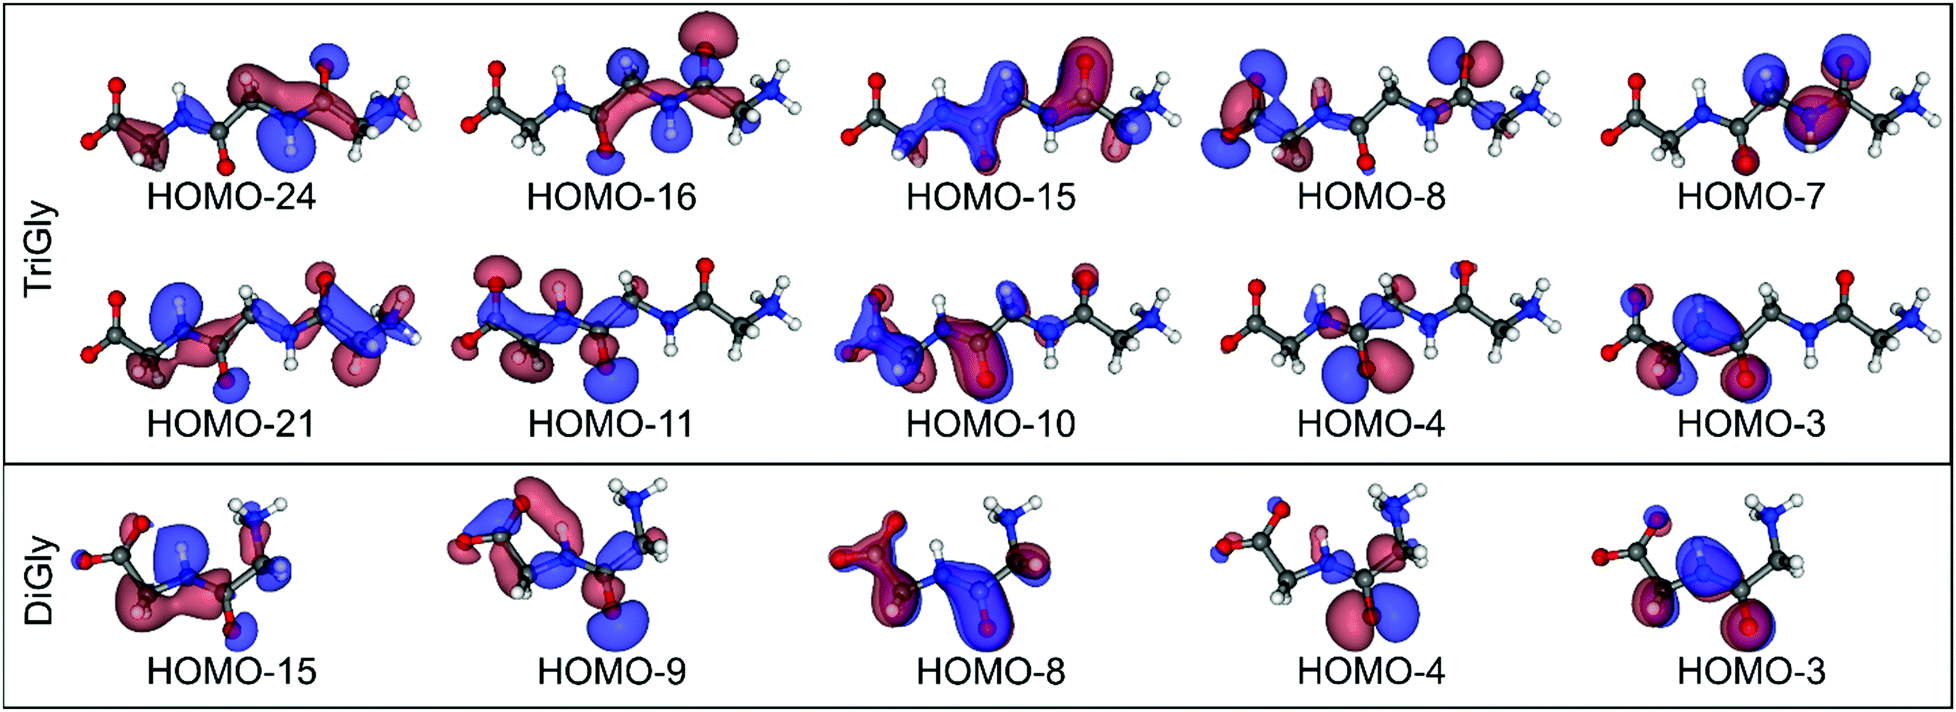 | ||
| Fig. 3 Molecular structure and calculated orbital iso-density surfaces of selected occupied molecular orbitals of diglycine (bottom) and triglycine (top). | ||
As described above, the N K emission spectrum of the peptide bonds of triglycine is very similar to that of diglycine and the spectral features can be attributed to orbitals located around the two peptide bonds, which have very similar shapes. This is illustrated by the comparison in Fig. 3. For example, the sharp peak at 395.8 eV consists of transitions from the HOMO−3 orbital at the N2 nitrogen atom and from the HOMO−7 orbital at the N3 nitrogen atom. We note that our calculations show a binding energy difference of 1.5 eV for the N 1s levels of N2 and N3, which can be attributed to the proximities of N2 and N3 to the carboxylate and amino groups, respectively. The energy difference between HOMO−3 and HOMO−7 is very similar, and thus both transitions appear at the same energy. We attribute this to the strong localization of the two orbitals, hardly affected by their environment. The situation is different for orbitals more delocalized over the molecule, and thus the structures below ∼393 eV become more complicated, presumably leading to the additional intensity at ∼390 eV as compared to the spectrum of diglycine.
In the zwitterionic glycine, the two oxygen atoms of the carboxylate group are nearly equivalent, and we hence expect no significant differences in their local electronic structure. The O K emission spectrum of glycine in Fig. 2(b) (bottom, red), shown together with calculated line intensities (black and gray bars), consists of a dominant peak at 526.8 eV, a small shoulder at 525.4 eV, and a peak at 522.5 eV, which is flanked on both sides by regions of low intensity. The main line with its shoulder on the low-energy side can be attributed to the three highest occupied molecular orbitals of glycine, with strong contributions from the lone-pair electrons at the carboxylate group (see also Fig. S2, ESI†). The peak at 522.5 eV is a superposition of contributions from the next three lower orbitals that are responsible for the sigma- and pi-bonding at the carboxylate group.
In di- and triglycine, oxygen atoms are found on additional site(s) at the peptide bond. This leads to strong spectral changes in the spectral region from 520 to 525 eV, while there is no change in peak position and only a minor change in peak shape of the main line at 526.8 eV (in comparison to glycine). In detail, the peak at 522.5 eV decreases in relative intensity but extends to lower emission energies and new intensity – with some substructure – is found in the “valley” around ∼524.5 eV. In Fig. 2(b) (top, blue), we have subtracted the weighted O K spectrum of glycine (representative for the carboxylate group) from those of di- and triglycine to isolate the contributions from the peptide bond oxygen(s). These spectra are again compared to the calculated emission intensities and positions for transitions at the oxygen atoms of the peptide bond(s). This comparison shows that the main line at 526.8 eV can be attributed to the lone-pair-related orbitals at the peptide bond(s) (HOMO−3 and −4 for O3 in di- and triglycine, and HOMO−7 and −8 for O4 in triglycine). The structures at lower energies can be attributed to more delocalized, bonding orbitals. A summary of the most prominent features in the N and O K XES spectra of glycine, diglycine, and triglycine can be found in Table S2 (ESI†).
Further insights into the electronic structure, including the unoccupied states, are gained from the RIXS maps presented in Fig. 4. In these maps, the color-coded emission intensity is shown as a function of emission and excitation energies. In the top row, the N K RIXS maps of glycine, diglycine, and triglycine are shown, while the bottom row depicts the O K RIXS maps.
 | ||
| Fig. 4 N K (top) and O K (bottom) RIXS maps of glycine (Gly), diglycine (DiGly), and triglycine (TriGly). The color-coded RIXS intensity is shown as a function of excitation and emission energy. For better visualization of differences in the O K RIXS maps, the map of glycine is also superimposed on the maps of diglycine and triglycine as black contour lines. | ||
The N K RIXS map of glycine is dominated by spectator emission, which is found for emission energies below 397 eV and excitation energies above the absorption onset at ∼403.0 eV.26 By integrating the emission intensity in the spectator region at each excitation energy, we compute the partial fluorescence yield (PFY) XAS spectrum of glycine. This spectrum is depicted in Fig. 5(a) and compared to the calculations shown as vertical bars and thin black lines. The spectrum is characterized by a broad and rather featureless structure with a maximum at 406.5 eV, which can be attributed to N 1s to σ* transitions at the amino group. A closer look at the map reveals that the spectral shape of the emission spectra (i.e., a horizontal cut in the map) does not change significantly for most excitation energies. An exception is the region close to the absorption onset (i.e., detuned from the first absorption resonance), where the relative intensity of the emission peak at 395 eV (compare Fig. 2 and ref. 26) is reduced. This finding can be explained as follows26 (and supports the assignment of this peak to nuclear dynamics): the time scale of the X-ray emission process is reduced for detuned (below-edge) excitation,36 effectively reducing the spectral weight of those molecules that have already undergone nuclear dynamics.
 | ||
| Fig. 5 Partial fluorescence yield XAS spectra of glycine (Gly), diglycine (DiGly), and triglycine (TriGly) at (a) the N and (b) the O K edges. Below each spectrum, corresponding DFT calculations are shown as vertical bars (as calculated) and thin black lines. The latter are broadened by Gaussians with a FWHM of 1 eV (4 eV) for excitation energies below (above) 402.5 eV (N K edge) and 534.0 eV (O K edge). This was done to approximate vibrational substructure and lifetime broadening, which is known to significantly increase for higher-lying resonances.40 | ||
For emission energies above 397 eV, we find the participant region, which includes the elastically scattered photons (Rayleigh line) at equal excitation and emission energies (marked with “E” in Fig. 4). It is quite weak in the case of glycine. Furthermore, it contains loss structures for excitation energies around the absorption onset (marked with “L” in Fig. 4). These loss structures extend over the full range between the elastic line and the spectator emission, and can be attributed to vibrational excitations (close to the Rayleigh line) and nuclear dynamics (for higher energy losses).37
The RIXS maps of diglycine and triglycine differ significantly from that of glycine. Most prominently, we find additional structure at an excitation energy of 401.3 eV as also seen in the PFY XAS spectra in Fig. 5(a), which agree well with literature data.2,4,10 The XAS spectra of diglycine and triglycine have previously been extensively studied in experiment and theory.2–4 Based on these studies, the peak at 401.3 eV is attributed to N 1s to π* transitions at the amide (peptide bond) nitrogen. At this excitation energy, a resonance at the Rayleigh line and a pronounced loss structure are observed as well. Different from the loss structure observed for glycine, this loss structure does not extend down to the spectator emission, which suggests that only vibrational excitations take place at the peptide nitrogen, while no ultrafast dissociation occurs. Above the N K absorption edge of the amino group nitrogen, contributions from the amino and the peptide bond nitrogen atoms overlap. Specifically, the lone-pair peak of the peptide (emission energy of 395.8 eV, see also Fig. 2) can be easily identified – especially for triglycine, it dominates the RIXS map. In the PFY XAS spectra in Fig. 5(a) (i.e., derived from the RIXS map as mentioned above), additional differences to the glycine spectrum can be found: the spectral shape of the broad feature around 406.5 eV changes slightly, and additional intensity around 411 eV is observed, which are both attributed to σ* transitions at the amide nitrogen.2 The latter assignment can also be seen directly in the RIXS maps, which, for these excitation energies, show an intensity increase of the lone-pair emission of the peptide bond nitrogen (at 395.8 eV), while the peak at 394.9 eV (i.e., from the amino group nitrogen) decreases in intensity.
To derive a site-specific view on the electronic structure at the peptide bond, we further analyze the RIXS spectra that are (resonantly) excited at 401.3 eV (Fig. 6(a)). While no intensity is observed for glycine (as already seen in the RIXS map), the spectra for diglycine and triglycine are very similar and resemble the (non-resonant) difference spectra between di-/triglycine and glycine discussed above (Fig. 2(a)). For the detailed discussion, the difference spectrum between diglycine and glycine is plotted again at the top of Fig. 6(a). Compared to the difference spectrum, we find spectator shifts of all emission lines to lower emission energies, which is caused by the presence of the excited (spectator) electron in the emission final state (due to the resonant excitation). Furthermore, a narrowing of the lone-pair peak at 394.9 eV and a reduction in relative intensity of its low-energy shoulder is observed. We attribute these changes to differences in vibronic coupling and symmetry selection in the resonant RIXS process.
 | ||
| Fig. 6 (a) N K RIXS spectra of glycine (Gly), diglycine (DiGly), and triglycine (TriGly), excited at 401.3 eV. For comparison, the weighted difference between the non-resonant spectra of diglycine and glycine is shown at the top. (b) O K RIXS spectra of glycine, diglycine, and triglycine, excited at 532.8 eV. For comparison, the spectra of aqueous solutions of acetamide (top) and acetic acid (bottom) are also shown. Above the spectrum of triglycine, weighted and magnified differences between the spectra of di-/triglycine and glycine are depicted (the weighting is discussed in detail in the text). | ||
Unlike the N K RIXS maps, the O K RIXS maps of glycine, diglycine, and triglycine in Fig. 3 (bottom panels) look rather similar to each other. This is not surprising, given the similarity of the electronic structure at the carboxylate and peptide bond oxygen atoms. In particular, all three maps (and the extracted PFY XAS spectra in Fig. 5(b)) are characterized by the O 1s to π* transition at an excitation energy of 532.5 eV and a broad structure above 534 eV. Around the O 1s to π* transition, we find a weak emission feature that shifts diagonally at an emission energy ∼6 eV below the excitation energy. We attribute this feature to an electronic Raman loss feature, which corresponds to a HOMO–LUMO excitation and note that it is strongest for glycine and weakest for triglycine; it thus probably occurs at the carboxylate group. Upon close inspection, some additional differences between the maps of glycine, diglycine, and triglycine are identified, as additionally visualized by the PFY XAS spectra in Fig. 5(b), which agree well with the literature data.4 For excitation energies above 534 eV, we find additional emission intensity at ∼524 eV, as in the non-resonant spectra discussed above (Fig. 2(b)). Moreover, small shifts in energy and a change in relative intensities are observed for the O 1s to π* transition. For better visualization, black contour lines in Fig. 4 (bottom) represent the O K RIXS map of glycine. Specifically, we find a shift of the emission feature at 522.3 eV (for glycine) to 522.8 eV (for triglycine). At the same time, this feature slightly shifts in excitation energy, from 532.6 eV (glycine) to 532.4 eV (triglycine), indicating a slightly lower excitation energy for the O 1s to π* transition at the peptide bond oxygen. Finally, the relative intensity of the emission feature at 525.5 eV decreases when going from glycine to diglycine to triglycine.
For a detailed investigation of these changes, Fig. 6(b) shows the O K RIXS spectra of glycine, diglycine, and triglycine, resonantly excited at 532.8 eV, in comparison with reference spectra of aqueous solutions of acetic acid (pH 12.8, “anionic acetic acid”) and acetamide. Furthermore, we have computed differences between the spectra of di-/triglycine and glycine (“DiGly-Gly” and “TriGly-Gly”) to separate the contributions from the carboxylate group and the peptide bond. For resonant excitation, it cannot be assumed that the absorption cross section at the peptide bond is equal to that at the carboxylate group. To compute meaningful difference spectra, we have thus assumed that the spectral shape of the peptide bond contributions is identical for diglycine and triglycine. With this assumption, we have introduced a factor f and computed the following difference spectra: “DiGly-Gly” = IDiGly − f × (2/3) × IGly and “TriGly-Gly” = IDiGly − f × (1/2) × IGly, with IGly, IDiGly, and ITriGly being the area-normalized spectra of glycine, diglycine, and triglycine, respectively. f was derived by minimizing χ2 between the two differences (resulting in f = 0.76). The difference spectra are shown in Fig. 6(b).
All spectra are dominated by two spectral lines at 526.5 and 525.5 eV. For anionic acetic acid and an acetate solution, these peaks in the resonant spectra have previously been attributed to three orbitals by comparing with (non-resonant) calculations of an isolated ion:38,39 the two oxygen lone-pair orbitals and a further orbital delocalized over the entire ion. Based on these calculations, ref. 38 and 39 attribute the peak at 526.5 eV to contributions from one of the lone-pair orbitals, as well as from the delocalized orbital. The peak at 525.5 eV is assigned to transitions involving the second lone-pair orbital. Comparing the spectra of acetic acid with that of acetamide, we observe that the relative intensity of the peak at 525.5 eV is lower for acetamide, i.e., for the amide oxygen compared to the carboxylate oxygen atoms. We thus argue that the peak at 525.5 eV rather stems from transitions of the delocalized orbital, which we expect to be more sensitive to the different environments at the carboxylate and amide groups, respectively. In this picture, the peak at 526.5 eV consists of contributions from the lone-pair orbitals only. Note that the three peaks all overlap for non-resonant excitation (see Fig. 2(b)) and only split up due to spectator shifts for resonant excitation, which are not included in the non-resonant calculations in ref. 38 and 39. The peak positions and relative intensities of these two lines in the glycine spectrum are very similar to the anionic acetic acid reference, and those of the peptide bond contributions (“DiGly-Gly” and “TriGly-Gly”) are very similar to the acetamide reference.
In the spectral region between 518 and 524.5 eV, we observe strong changes when comparing the two reference liquids and the spectra of glycine, diglycine, and triglycine. Consequently, we attribute the intensity in this region to orbitals that are more delocalized and specific for the functional groups (carboxylate, amide), but are also influenced by the remainder of the molecules.
Conclusion
We have derived a comprehensive picture of the local electronic structure of the peptide bond. For this purpose, we used XES and RIXS maps at the N and O K edges and compared spectra of solid powder films of glycine, diglycine, and triglycine with DFT spectra calculations as well as the spectra of reference solutions of acetamide and acidic acid. We find that the local contributions of the peptide bond can be distinctly separated from those of the amino and carboxylate groups by deriving weighted difference spectra, as well as by using suitable excitation energies in the RIXS maps of the peptides. Based on the comparison with theory, the most prominent spectral features can be assigned to specific orbitals of the molecule. Furthermore, we find spectator shifts in the RIXS maps and can identify spectral signatures of nuclear dynamics on the time scale of the X-ray emission process. They lead to vibrational coupling and ultrafast dissociation at the protonated amino group, while only vibrational coupling is observed at the peptide bond (amide group). Using the resonant excitation regime of the RIXS map, we argue for a modification of the currently established assignment of spectral contributions in view of the degree of delocalization of the various orbitals (in particular the lone-pair orbitals). This study thus demonstrates the possibility of selectively separating the local contributions of the peptide bond from those at the amino and carboxylate groups, which is expected to be a very important tool for the investigation of larger molecules with peptide bonds, such as peptides and proteins, and monitoring their interactions with aqueous environments.Conflicts of interest
There are no conflicts to declare.Note from RSC Publishing
This article was originally published with incorrect page numbers. This is the corrected, final version. The Royal Society of Chemistry apologises for these errors and any consequent inconvenience to authors and readers.Acknowledgements
This work was supported by the German Research Society (DFG; projects no. RE 1469/7-1 and ZH 63/16-1). This research used resources of the Advanced Light Source, which is a DOE Office of Science User Facility under contract no. DE-AC02-05CH11231. M. Bär and R. G. Wilks acknowledge funding by the Impuls- und Vernetzungsfonds of the Helmholtz Association (VH-NG423).References
- J. Boese, A. Osanna, C. Jacobsen and J. Kirz, J. Electron Spectrosc. Relat. Phenom., 1997, 85, 9–15 CrossRef CAS.
- M. L. Gordon, G. Cooper, C. Morin, T. Araki, C. C. Turci, K. Kaznatcheev and A. P. Hitchcock, J. Phys. Chem. A, 2003, 107, 6144–6159 CrossRef CAS.
- G. Cooper, M. Gordon, D. Tulumello, C. Turci, K. Kaznatcheev and A. P. Hitchcock, J. Electron Spectrosc. Relat. Phenom., 2004, 137–140, 795–799 CrossRef CAS.
- Y. Zubavichus, M. Zharnikov, A. Schaporenko and M. Grunze, J. Electron Spectrosc. Relat. Phenom., 2004, 134, 25–33 CrossRef CAS.
- Y. Zubavichus, A. Shaporenko, M. Grunze and M. Zharnikov, J. Phys. Chem. A, 2005, 109, 6998 CrossRef CAS PubMed.
- K. Kaznacheyev, A. Osanna, C. Jacobsen, O. Plashkevych, O. Vahtras, H. Ågren, V. Carravetta and A. P. Hitchcock, J. Phys. Chem. A, 2002, 106, 3153–3168 CrossRef CAS.
- C. P. Schwartz, R. J. Saykally and D. Prendergast, J. Chem. Phys., 2010, 133, 044507 CrossRef PubMed.
- Y. Zubavichus, A. Shaporenko, M. Grunze and M. Zharnikov, Nucl. Instrum. Methods Phys. Res., Sect. A, 2009, 603, 111 CrossRef CAS.
- J. Gråsjö, E. Andersson, J. Forsberg, L. Duda, E. Henke, W. Pokapanich, O. Björneholm, J. Andersson, A. Pietzsch, F. Hennies and J.-E. Rubensson, J. Phys. Chem. B, 2009, 113, 16002 CrossRef PubMed.
- Y. Zubavichus, A. Shaporenko, M. Grunze and M. Zharnikov, J. Phys. Chem. B, 2006, 110, 3420 CrossRef CAS PubMed.
- E. F. Aziz, N. Ottosson, S. Eisebitt, W. Eberhardt, B. Jagoda-Cwiklik, R. Vácha, P. Jungwirth and B. Winter, J. Phys. Chem. B, 2008, 112, 12567–12570 CrossRef CAS PubMed.
- B. M. Messer, C. D. Cappa, J. D. Smith, K. R. Wilson, M. K. Gilles, R. C. Cohen and R. J. Saykally, J. Phys. Chem. B, 2005, 109, 5375–5382 CrossRef CAS PubMed.
- B. M. Messer, C. D. Cappa, J. D. Smith, W. S. Drisdell, C. P. Schwartz, R. C. Cohen and R. J. Saykally, J. Phys. Chem. B, 2005, 109, 21640–21646 CrossRef CAS PubMed.
- J. Stewart-Ornstein, A. P. Hitchcock, D. Hernández Cruz, P. Henklein, J. Overhage, K. Hilpert, J. D. Hale and R. E. W. Hancock, J. Phys. Chem. B, 2007, 111, 7691–7699 CrossRef CAS PubMed.
- O. González-Magaña, G. Reitsma, M. Tiemens, L. Boschman, R. Hoekstra and T. Schlathölter, J. Phys. Chem. A, 2012, 116, 10745–10751 CrossRef PubMed.
- C. P. Schwartz, J. S. Uejio, A. M. Duffin, A. H. England, D. N. Kelly, D. Prendergast and R. J. Saykally, Proc. Natl. Acad. Sci. U. S. A., 2010, 107, 14008–14013 CrossRef CAS PubMed.
- J. Stewart-Ornstein, A. P. Hitchcock, D. Hernández Cruz, P. Henklein, J. Overhage, K. Hilpert, J. D. Hale and R. E. W. Hancock, J. Phys. Chem. B, 2007, 111, 7691–7699 CrossRef CAS PubMed.
- R. G. Wilks, J. B. MacNaughton, H.-B. Kraatz, T. Regier and A. Moewes, J. Phys. Chem. B, 2006, 110, 5955–5965 CrossRef CAS PubMed.
- Y. Zubavichus, A. Shaporenko, M. Grunze and M. Zharnikov, J. Phys. Chem. B, 2007, 111, 9803–9807 CrossRef CAS PubMed.
- M. Kubin, J. Kern, S. Gul, T. Kroll, R. Chatterjee, H. Löchel, F. D. Fuller, R. G. Sierra, W. Quevedo, C. Weniger, J. Rehanek, A. Firsov, H. Laksmono, C. Weninger, R. Alonso-Mori, D. L. Nordlund, B. Lassalle-Kaiser, J. M. Glownia, J. Krzywinski, S. Moeller, J. J. Turner, M. P. Minitti, G. L. Dakovski, S. Koroidov, A. Kawde, J. S. Kanady, E. Y. Tsui, S. Suseno, Z. Han, E. Hill, T. Taguchi, A. S. Borovik, T. Agapie, J. Messinger, A. Erko, A. Föhlisch, U. Bergmann, R. Mitzner, V. K. Yachandra, J. Yano and P. Wernet, Struct. Dyn., 2017, 4, 054307 CrossRef PubMed.
- Y. Zubavichus, A. Shaporenko, M. Grunze and M. Zharnikov, J. Phys. Chem. B, 2008, 112, 4478–4480 CrossRef CAS PubMed.
- D. Hernández Cruz, M.-E. Rousseau, M. M. West, M. Pézolet and A. P. Hitchcock, Biomacromolecules, 2006, 7, 836–843 CrossRef PubMed.
- M.-E. Rousseau, D. Hernández Cruz, M. M. West, A. P. Hitchcock and M. Pézolet, J. Am. Chem. Soc., 2007, 129, 3897–3905 CrossRef CAS PubMed.
- X. Liu, C.-H. Jang, F. Zheng, A. Jürgensen, J. D. Denlinger, K. A. Dickson, R. T. Raines, N. L. Abbott and F. J. Himpsel, Langmuir, 2006, 22, 7719–7725 CrossRef CAS PubMed.
- A. Nilsson, N. Wassdahl, M. Weinelt, O. Karis, T. Wiell, P. Bennich, J. Hasselström, A. Föhlisch, J. Stöhr and M. Samant, Appl. Phys. A: Mater. Sci. Process., 1997, 65, 147–154 CrossRef CAS.
- M. Blum, M. Odelius, L. Weinhardt, S. Pookpanratana, M. Bär, Y. Zhang, O. Fuchs, W. Yang, E. Umbach and C. Heske, J. Phys. Chem. B, 2012, 116, 13757 CrossRef CAS PubMed.
- F. Meyer, L. Weinhardt, M. Blum, M. Bär, R. G. Wilks, W. Yang, C. Heske and F. Reinert, J. Chem. Phys., 2013, 138, 034306 CrossRef CAS PubMed.
- F. Meyer, M. Blum, A. Benkert, D. Hauschild, S. Nagarajan, R. G. Wilks, J. Andersson, W. Yang, M. Zharnikov, M. Bär, C. Heske, F. Reinert and L. Weinhardt, J. Phys. Chem. B, 2014, 118, 13142–13150 CrossRef CAS PubMed.
- F. Meyer, M. Blum, A. Benkert, D. Hauschild, Y. L. Jeyachandran, R. G. Wilks, W. Yang, M. Bär, C. Heske, F. Reinert, M. Zharnikov and L. Weinhardt, J. Phys. Chem. B, 2017, 121, 6549–6556 CrossRef CAS PubMed.
- M. Blum, L. Weinhardt, O. Fuchs, M. Bär, Y. Zhang, M. Weigand, S. Krause, S. Pookpanratana, T. Hofmann, W. Yang, J. D. Denlinger, E. Umbach and C. Heske, Rev. Sci. Instrum., 2009, 80, 123102 CrossRef CAS PubMed.
- O. Fuchs, L. Weinhardt, M. Blum, M. Weigand, E. Umbach, M. Bär, C. Heske, J. Denlinger, Y. D. Chuang, W. McKinney, Z. Hussain, E. Gullikson, M. Jones, P. Batson, B. Nelles and R. Follath, Rev. Sci. Instrum., 2009, 80, 63103 CrossRef CAS PubMed.
- M. Kato, Y. Morishita, M. Oura, H. Yamaoka, Y. Tamenori, K. Okada, T. Matsudo, T. Gejo, I. H. Suzuki and N. Saito, J. Electron Spectrosc. Relat. Phenom., 2007, 160, 39–48 CrossRef CAS.
- B. Watts and H. Ade, J. Electron Spectrosc. Relat. Phenom., 2008, 162, 49–55 CrossRef CAS.
- K. Hermann, L. G. M. Pettersson, M. E. Casida, C. Daul, A. Goursot, A. Koester, E. Proynov, A. St-Amant and D. R. Salahub, Contributing Authors: V. Carravetta, H. Duarte, C. Friedrich, N. Godbout, J. Guan, C. Jamorski, M. Leboeuf, M. Leetmaa, M. Nyberg, S. Patchkovskii, L. Pedocchi, F. Sim, L. Triguero, and A. Vela, StoBe-DeMon Version 3.1, 2011 Search PubMed.
- L. Weinhardt, E. Ertan, M. Iannuzzi, M. Weigand, O. Fuchs, M. Bär, M. Blum, J. D. Denlinger, W. Yang, E. Umbach, M. Odelius and C. Heske, Phys. Chem. Chem. Phys., 2015, 17, 27145–27153 RSC.
- F. Gel’mukhanov and H. Ågren, Phys. Rep., 1999, 312, 87 CrossRef.
- L. Weinhardt, M. Weigand, O. Fuchs, M. Bär, M. Blum, J. D. Denlinger, W. Yang, E. Umbach and C. Heske, Phys. Rev. B: Condens. Matter Mater. Phys., 2011, 84, 104202 CrossRef.
- Y. Horikawa, T. Tokushima, Y. Harada, O. Takahashi, A. Chainani, Y. Senba, H. Ohashi, A. Hiraya and S. Shin, Phys. Chem. Chem. Phys., 2009, 11, 8676 RSC.
- R. Golnak, K. Atak, E. Suljoti, K. F. Hodeck, K. M. Lange, M. A. Soldatov, N. Engel and E. F. Aziz, Phys. Chem. Chem. Phys., 2013, 15, 8046–8049 RSC.
- J. Stöhr, NEXAFS Spectroscopy, Springer-Verlag, Berlin Heidelberg, 1992 Search PubMed.
Footnote |
| † Electronic supplementary information (ESI) available. See DOI: 10.1039/c9cp02481f |
| This journal is © the Owner Societies 2019 |