
 Open Access Article
 This Open Access Article is licensed under a Creative Commons Attribution-Non Commercial 3.0 Unported Licence
The mechanism for nitrogenase including all steps†
Per E. M.
Siegbahn

Department of Organic Chemistry, Arrhenius Laboratory, Stockholm University, SE-106 91, Stockholm, Sweden. E-mail: per.siegbahn@su.se
First published on 18th June 2019
Abstract
The catalytic cofactor of the most common form of nitrogenase contains seven irons and one molybdenum bound together by sulfide bonds. Surprisingly, a central carbide has been demonstrated by experiments. Another noteworthy structural component is a large homocitrate ligand. In recent theoretical studies it has been shown that the central carbide is needed as a place for the incoming protons that are necessary parts of a reduction process. It has also been shown that a role for the homocitrate ligand could be that it may be rotated to release one bond to molybdenum. In the present study, the carbide protonation steps are reinvestigated with similar results to those reported before. The actual activation of N2 in the E4 state is an extremely complicated process. It has been found experimentally that two hydrides should leave as H2, in a reductive elimination process, to allow N2 activation in E4 in an easily reversible step. It is here suggested that after H2 is released, it is necessary for the metal cofactor to get rid of one proton. This is achieved by protonating the homocitrate and then rotating it to release one of the bonds to Mo. After this rotation, N2 can bind. In the E5 step, the homocitrate is rotated back to its original position and remains that way until the end of the catalytic process. The N2 protonation steps are energetically easy. Since a protonated carbide has never been observed experimentally, it is necessary to also have a mechanism for deprotonating the carbon at the end of the catalytic cycles. Such a mechanism is suggested here.
I. Introduction
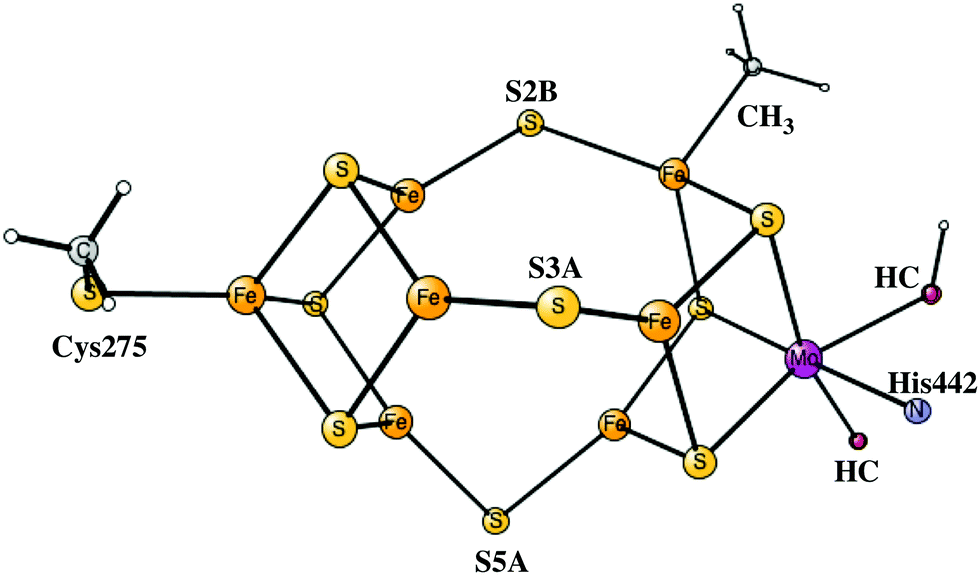
Nitrogenases are the only enzymes in nature that can activate the very strong triple bond of the nitrogen molecule. The active site of the most common form of nitrogenase has an iron cluster with seven irons connected by sulfides, and also includes a molybdenum atom, see Fig. 1. X-ray structures of increasing accuracy have been determined since the first structure was obtained in 1992.1 The most recent structure has a resolution of 1.0 Å and shows surprisingly a carbide in the center of the cofactor.2 The mechanism by which nitrogenase activates N2 has been studied for decades.3 The most recent review is from 2015.4 A breakthrough in the mechanistic studies came in 2013, when EPR-ENDOR was used to study the active state of the cofactor, known as E4.5,6 It was shown that hydrides have a key role in activating N2. Two bridging hydrides were detected and were found to leave the cluster when N2 was bound to the cofactor. It was concluded that the hydrides form H2 and therefore leave two additional electrons on the cofactor to activate N2. This finding nicely explained the known fact that for every N2 activated, one H2 is formed. A structure with two bridging hydrides and two protonated sulfides was suggested for the E4 state. There was no sign that the carbide in the center of the cluster would take part in the mechanism.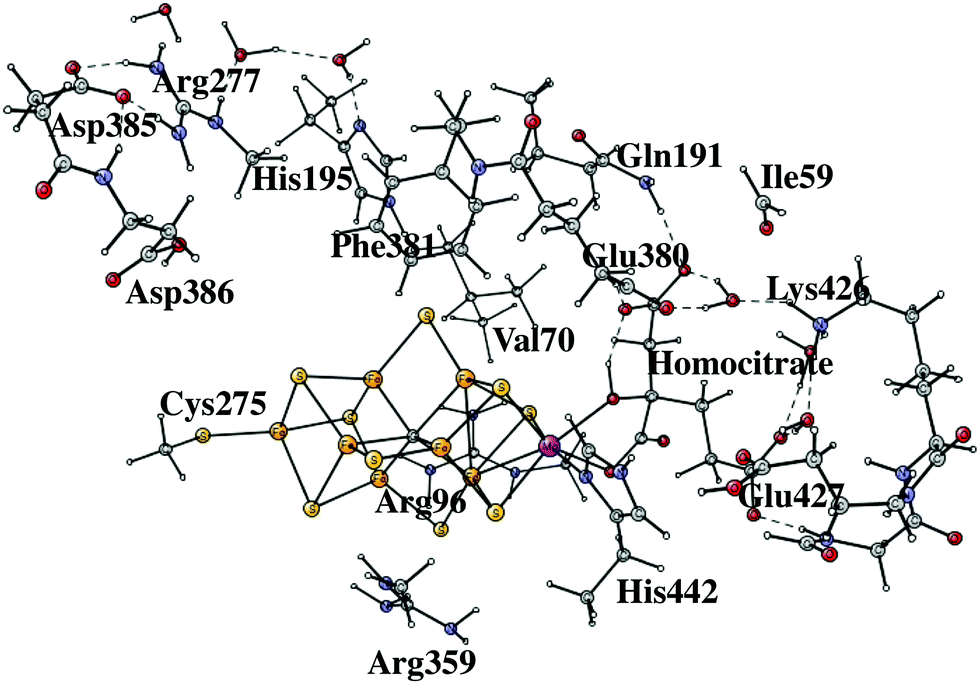 | ||
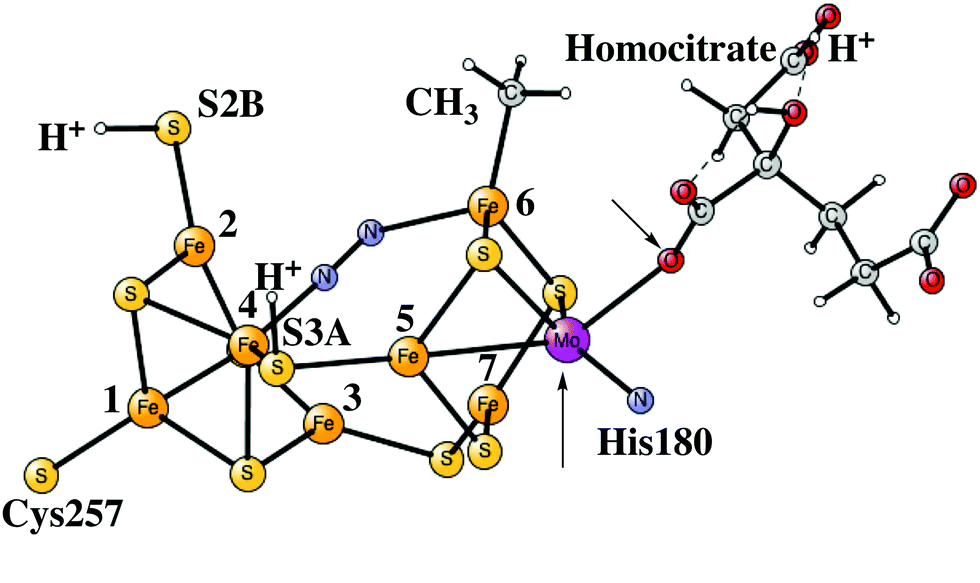
| Fig. 1 The model used for the present calculations showing which residues were included. | ||
The experimentally suggested structure for E4 was put into question by computational DFT studies on the mechanism.7–9 A thoroughly tested protocol was used in the calculations, applied successfully to a large number of redox enzymes, most noteworthy photosystem II (PSII).10 These studies indicated that the experimentally suggested E4 structure is very high in energy and can actually be ruled out as a possibility, unless DFT completely fails in a way never seen before. Another thorough study of possible E4 structures has recently been performed.11 In that study, a large number of different density functionals were tested. Very different energetics were obtained for the different functionals, perhaps indicating that DFT could not be trusted for calculations on nitrogenase. Still, all functionals agree on the important point that the experimentally suggested E4 structure is high in energy. It is clear that a different approach than just comparing results for many functionals is needed to sort out the DFT results. Such an approach was recently tested for nitrogenase.9 It was suggested that DFT could be used as a single parameter method, the parameter being the amount of exact exchange in the hybrid functional. In this way the entire spectrum of the results of different DFT functionals could be spanned. By comparing the results in detail to the experimental EPR results,4,5 the accuracy of the functionals could be evaluated, see further Section II. The same approach has been used for PSII, where the differences between functionals are nearly as large. The predictability for PSII turned out to be very good by a comparison to experiments performed only afterwards.10 The optimal parameter has been so far always in the range of 15–20%.
During the first decade after the first X-ray structure, mainly two theoretical groups, the ones of Noodleman14 and Dance,15 were involved in the study of nitrogenase. This work was, of course, quite hampered by the fact that the presence of the atom in the center of the cluster was not known. Nevertheless, very detailed investigations of optimal redox states were made using advanced broken symmetry techniques. It was found to be difficult to make conclusions about the identity of the interstitial atom based on comparisons to spectroscopic results. In more recent studies, Dance et al. investigated proton positions on the cofactor and protonation pathways.16 The interstitial atom was chosen as an unprotonated carbide. The stability of that type of structure has not been confirmed by others.8,9,13
Many of the earlier studies on the mechanism were also made before the central atom was determined to be a carbide, among them the studies of Blöchl et al. in 2003 and 200717 and of Ahlrichs et al. in 2004.18 A nitride was used instead of the central carbide in the structure. The mechanism of the latter group was later discarded experimentally by an ESEEM/ENDOR study.19 Nørskov et al. studied the entire mechanism of nitrogen protonation.20 In a more recent study they presented a very different mechanism. They suggested that the cofactor needs an initial activation, in which H2S is replaced by N2.21 The energy required for the activation was assumed to be small. However, in a recent study using the present methodology, a very high activation energy was calculated for that mechanism so it was concluded to be unlikely.7 In 2016, Adamo et al. suggested that the central carbide should be protonated with one proton.22
In 2016, a mechanism for H2 release and N2 binding in nitrogenase was suggested by Raugei et al.23 They found that the most stable E4 state was in perfect agreement with the structure suggested indirectly from experiments. There were two bridging hydrides and an unprotonated carbide in the center. Later studies by others could not confirm the stability of that type of structure, see above.8,9,13 In 2018, the same authors found that their previously suggested structure was very unstable with respect to losing a H2 molecule, in agreement with the findings by the others. They then continued, still with the same E4 structure as before, and presented a quite different mechanism in which the two hydrides in E4 endergonically form a locally bound H2 molecule.24 To avoid the problem with the very large computed exergonicity when H2 is released, the key to their mechanism is that this bound H2 molecule could only be released with a very high barrier. If the barrier is lower than 18 kcal mol−1, there would be no protonation of N2, but a high barrier should prevent the molecularly bound H2 from being released. There are many bound H2 complexes in the literature, but none of them behaves like the one suggested in ref. 24. In all the published cases there is at most a weakly bound H2 molecule, which can be released without significant barriers. A search for the barrier to release a bound H2 molecule from nitrogenase was then made using the present methodology in another study.9 A weak local minimum for a bound H2 molecule was obtained with a very small barrier for its release.
The mechanism for ammonia formation in nitrogenase consists of a large number of steps. Before the catalytic cycle starts, it is here suggested that there will be an activation process consisting of four reductions. In this process, the interstitial carbide becomes protonated three times. At this point, the catalytic cycles start and after four initial steps, N2 can bind to the cofactor. Once N2 is bound, its protonation to two ammonias occurs in five steps. After ammonia has been formed, the process returns to the beginning, and a new substrate can enter. When N2 or ATP ceases, there will be a return of the cofactor to its ground state, which means that the protonated carbide will be deprotonated, and it returns to its interstitial position. All these steps of the presently suggested mechanism will be described below.
II. Methods and models
A few lessons can be learned from the previous study on photosystem II (PSII). In that case several key predictions were made on the mechanism using the present approach, before any experiments were available.25 All these predictions were supported in detail by experiments performed years later. This experience of using DFT is not in line with what others have. The conclusion for the reason for this different experience is that there have been two major problems in the application of DFT on realistic systems. This conclusion was made after two decades of applications of DFT on enzymes. First, in judging the accuracy of a method like B3LYP,28 references have been made to benchmark tests for atomization energies of small molecules. These energies are the differences between the ones for stable molecules and the ones for atomic radicals. The relevance of these benchmark tests for the type of saturated complexes that appear in mechanisms of enzymes and organometallic catalysis has not been evaluated. For example, it is clear that free atoms are not present in nature. Second, the introduction of a large number of density functionals, with different parametrizations giving very different answers to many problems, has confused the issue of the accuracy of DFT for saturated systems. These new functionals have often been developed to correct the errors in the atomization energies, which could have led to unsystematic errors for larger realistic complexes. The main conclusion from the comparisons made between the functionals has often been that DFT is unreliable for the problem studied. To avoid these problems, an approach, which has been developed which has been applied to a large number of redox active enzymes,10 is used in the present study.It has been found that DFT behaves very systematically for saturated complexes.9 The best starting point is to use B3LYP since it is the hybrid functional with the smallest number of empirical parameters. In fact, the sensitivity of the results for B3LYP is essentially dependent on only one parameter, the amount of exact exchange. Starting with the standard 20% exact exchange and decreasing this percentage in steps, a measure of the sensitivity can be obtained. The effect is mainly present for redox energies, which in general varies by 1 kcal mol−1 for every 1% change of the exact exchange. It has been found that in all cases tried so far, the optimal fraction is in the range 15–20%. The difference between 15 and 20% can then be used as an estimate of the error in the calculations. The results for 10% are already quite poor, and for non-hybrid methods with 0%, the energetic results are very poor. In most of the calculations described here this fraction is set to 15%. A test of this approach has been made for nitrogenase, where the conclusion could be made that the structure indirectly suggested from experiments cannot be the right structure.9 An interesting verification of this prediction has recently been made for nitrogenase11 in the experimentally suggested active state. In line with the present prediction, not a single DFT functional gave energetics or structure in line with the experimental suggestion, actually quite far from it.
For the geometry optimization, B3LYP with a moderate basis set with double zeta plus polarization has been used (lacvp*),26 which does not give very accurate geometries. This does not mean that B3LYP cannot be used for energies, since it has long been known that there is no correspondence between accurate energies and accurate bond distances.26 As yet another test of this conclusion, a geometry optimization was made including p-functions on the hydrogens. The most sensitive energy for this extension of the basis set is where the two hydrides leave as a hydrogen molecule. The final energy difference between the points with the hydrides and without them, changed by only 0.7 kcal mol−1, a truly unimportant effect, as expected. The final energies for the optimized structures were obtained with a large cc-pvtz(-f) basis set and with lacvp3+ on the metals. The lacvp* basis set was used for obtaining dielectric effects with a dielectric constant equal to 4.0. The choice of dielectric constant is not critical for the present energy comparisons using large models, and 4.0 was used as a standard choice.10 Dispersion effects were added using the empirical D2 formula of Grimme.31 The choice of D2 was made since a lot of experience has been gathered over the years using D2.10 D3 has been tested in many cases before and quite similar results were usually obtained, but there are some cases where D3 was concluded to give less reasonable results. Differential zero-point effects were taken from the corresponding structures of the smaller model,7 and the transition states were obtained by one-dimensional searches. To obtain the binding energy of a water molecule to the FeMoco, the empirical binding energy of water in bulk water of 14.0 kcal mol−1 was used. All the calculations were performed using the Jaguar program.27 For the large basis set, it was necessary to use an analytic rather than the normal pseudo-spectral approach. Broken symmetry was used in all calculations.32
The initial steps of the present study of the mechanism for nitrogenase are similar to the one done earlier7 but differ on important points. The previous model of the cofactor contained about 160 atoms, while the present one has about 270 atoms, shown in Fig. 1. The models are in both cases based on the high-resolution structure.2 The extensions of the model were made in two regions, outside His195 and outside the homocitrate ligand. Two problems with the previous model were discovered already when the previous results were summarized,7 both connected with the His195 region. It was found that the pKa of this histidine was significantly too high, by about five pKa units, to generate a correct modeling of the energetics. As a temporary solution, the protonation energies of His195 were simply reduced by 7 kcal mol−1. In the present model, Arg277, Asp385 and Asp386 and three water molecules were therefore added in a hydrogen bonded network including His195. By this addition, Asp386 became neutralized and the pKa of His195 was significantly reduced. Therefore, His195 is now unprotonated in most steps in the catalytic cycle and does not appear to be directly involved in proton delivery to FeMoco, as it was in the previous study. An unprotonated His195 is in agreement with a recent detailed QM/MM study.13 In a previous paper, the homocitrate was found to move significantly and the groups around this ligand are therefore required to be included in the model. In most cases, the backbone atoms are fixed from the X-ray structure, exceptions are Cys275, Arg96 and Arg359, where only one H-atom was frozen. For Ile59 only the backbone CO and two fixed hydrogens were used. Precisely which atoms were fixed are shown by a # in the ESI.† The atoms fixed are mostly backbone atoms since the backbones are generally quite rigid. Even with the above changes of the model, the general feature of the mechanism with the protonation of the central carbon remains the same.
The second deficiency of the previous model was that the activation of N2 occurred after seven reductions of the initial ground state cofactor, and consequently for an EPR-invisible state. This was in contrast to the EPR experiments which showed that the activation occurs for a doublet state,4–6 suggested to occur after four reductions from the ground state. By the extension of the model, it was now found that it was energetically possible to reduce the cofactor eight times starting with the ground state, of which only four are part of the catalytic cycle. Therefore, the N2 activation has now been found to occur for a doublet state in agreement with experiments.
The charge of the entire model is −2, leading to a charge of −4 for the cofactor itself without its hydrogen bonding neighbours. This leads to an oxidation state for the ground state of Mo3+3Fe2+4Fe3+ with a quartet spin, which is in full agreement with spectroscopic studies.29,30 The spin coupling for the irons in the ground state is + − + − + + −, with the numbering as in the X-ray structure. Mo3+ has a low spin of −1.4. For those reduced states where carbon is protonated, the coupling strength between metal spins is reduced, and the energetic difference between different spin-coupling is quite small, but + − − − + + + is generally preferred. These two couplings will be termed 1 and 2 in the discussion below. Both of them have in most cases been compared for two different total spin states. The best spin state for each state will be described below. In this context, it can be noted that there is a very large number of possible spin-couplings and it is not possible to test all of them. Better couplings than those reported here can therefore not be excluded, but the difference is not expected to be significant in the present context, since the energy difference between the two couplings tried is usually small, much smaller than for the ground state.
An important correction compared to the previous study was finally introduced. It was found that the binding energy of the Fe–C bond was very sensitive to the amount of exact exchange, the smaller the amount of exact exchange, the stronger was the Fe–C bond. To make both protonation and deprotonation steps exergonic a correction was made, increasing each Fe–C bond strength by 4 kcal mol−1. Using a value below 3 or above 5 kcal mol−1 would not work as well. Connected to the cleavage of the Fe–C bond, there is a reduction of the metals. It is very common that redox energies can have errors of this size, which can be corrected by lowering the exact exchange, usually from 20 to 15%, see above. However, it is not possible to switch to a method with even less exchange in nitrogenase, since these methods behave quite poorly in the catalytic cycle. Errors in bond strengths using B3LYP are very systematic with bonds that are nearly always too small. The errors are therefore usually cancelled by the simultaneous breakage of a bond and formation of another bond. However, in the carbon protonation process, five of the six Fe–C bonds become broken in sequence, leading to a build-up of the error and the correction became necessary. It should be noted that this correction only affects the results of the steps where carbon is protonated and deprotonated. Once a terminal CH3 has been formed, no more Fe–C bonds are broken or formed, and for the protonation steps after that and for the N2 activation, there are no longer any corrections of this type of the DFT results.
III. Results
The starting point for the present investigation is based on the conclusions described in the Introduction and in the computational section. The experimentally suggested structure for E4 with an unprotonated carbon and two hydrides has been found to be extremely high in energy and could therefore with high certainty be ruled out as a possibility.9 Therefore, a different mechanism is needed as described in the previous paper and below.The redox potential of the P-cluster
When the FeMo cofactor is reduced, the electrons are donated from the nearby P-cluster in the FeMo-protein.33 When this process is studied by calculations, it is important to have an estimate of the redox potential involved. The redox potential of the P-cluster has been measured to be −0.4 V. However, in sending the electron from the P-cluster to the FeMo cofactor, a quite complicated process is involved including the hydrolysis of two ATPs and the binding and release of another protein, the Fe-protein. In the previous study, it was assumed that all the energy from the hydrolysis of the two ATPs would go into lowering the redox potential of the P-cluster. This meant that the actual redox potential became lowered to −1.6 V. This conclusion might not be considered valid from the results of a detailed experimental study of the reduction process.34 In that study, it was surprisingly found that ATP hydrolysis occurs at a late stage after electron transfer has been initiated. It was concluded from that finding that the ATP hydrolysis energy should not change the redox potential of the P-cluster at all. Experimentally, the binding between the FeMo- and Fe-proteins occurs rapidly prior to the ET steps. After that, FeMoco is reduced by an electron from the P-cluster. In the present study, the following picture of the reduction is suggested. After the binding between the MoFe-protein and the Fe-protein, there could be an essentially thermo-neutral activation process of the bound complex, which leads to lowering of the reduction potential of the P-complex in the FeMo protein. The cost for this lowering could then be compensated by a simultaneous gain obtained by a structural change. These two processes, the structural change and the change of the reduction potential of the P-complex, should be coupled, implying that one will not occur without the other. This could occur in one of two ways. In the first one, an electron is sent to the P-cluster coupled with the structural change. In the other one, a proton is released from the P-cluster coupled with the structural change. Both possibilities would lead to significant lowering of the redox potential of the P-cluster. After sending the electron from the P-cluster to the FeMoco, the two proteins should be very strongly stuck together. However, in the final step of these events, the energy of the ATP hydrolysis should be used to separate the proteins, again in an essentially thermoneutral process. The advantage with this view is that it allows the hydrolysis of the ATP to be used to indirectly lower the reduction potential of the P-cluster, even though it occurs after electron transfer has been initiated. In a previous paper, a redox potential of −1.6 V was used, but in the present paper this is increased to −1.47 V to allow for a driving force of 3 kcal mol−1 for the entire electron transfer process. In the experimentally suggested picture, the redox potential would stay as −0.4 V and the hydrolysis of the ATP would mean a large loss of energy. With a redox potential of −0.4 V in the present study, most transitions would be strongly endergonic, see below, while with −1.47 V they are now all exergonic.The carbon protonation steps
In the previous study, the energies of the reductions and protonations of the FeMoco were evaluated separately. In the present study, it was considered enough to calculate the energetics of these steps together, by adding an (e−, H+) couple in each transition. The same energy values for the addition of an electron and a proton as used in the previous study7 are used with one exception. The exception is that in the present study a driving force of 3 kcal mol−1 has been added for the electron transfer process. This means that the energy to add an (e−, H+) couple should be compared to 348.6 kcal mol−1. This energy can be derived directly from experimental values for the redox potential of the donor and the energy for the substrate reaction.7 In the present procedure of adding an (e−, H+) couple, the upper index of labeling the states can be dropped, previously used to separate the two states with and without an added proton. As for all the reduction steps, the proton is assumed to come from the medium. There are many (movable) water molecules around the cofactor, which could be used in these processes. The diagram for the first four reductions is shown in Fig. 2. These steps constitute the activation process and the states are therefore termed A-states. The details are given in the ESI.†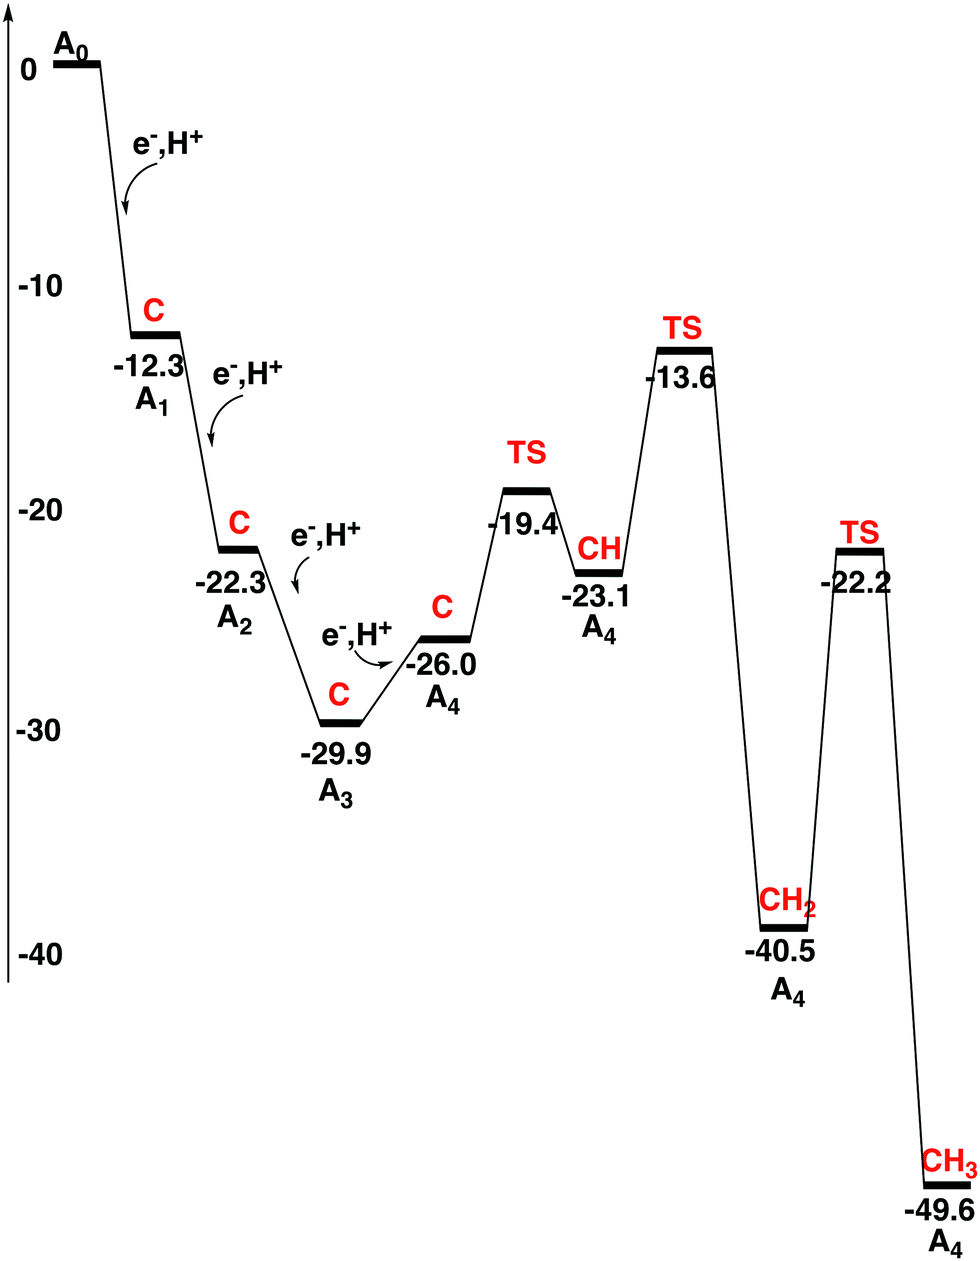 | ||
| Fig. 2 Energy diagram for the activation process of the FeMo-cofactor. The protonation state of the central carbon for each state is shown in red. | ||
In the first reduction step, S3A in the belt of the FeMoco becomes protonated, just like in the previous study. The exergonicity becomes −12.3 kcal mol−1. Spin-coupling 1 (see Section II) was found to be optimal for the A1 state with a triplet spin. Mo has a high spin of more than 2.0. Solutions with a low spin on Mo are significantly higher in energy. This may be surprising since the ground state has a low spin on Mo. For the subsequent reductions, solutions with low spin on Mo were therefore not attempted. They do not show up automatically in the SCF convergence either. The second reduction is also similar to what was found in the previous study. S2B in the belt becomes protonated with an exergonicity of −10.0 kcal mol−1. In the third reduction, the protonation occurs as in previous transitions, and now also the third sulfur in the belt, S5A, becomes protonated. This transition is exergonic by −7.6 kcal mol−1, see Fig. 2. The protonation of C to CH is endergonic by +12.9 kcal mol−1.
The fourth reduction step is more complicated than before. Initially, a fourth proton becomes bound to the FeMoco as a hydride. This step is endergonic by +3.9 kcal mol−1. In A4 there are now three SH protons and one hydride. After that, the hydride moves over to carbon with a barrier of only +6.6 kcal mol−1, but this transformation is still endergonic by a small amount of +2.9 kcal mol−1. CH formation counted from the A3 state is altogether endergonic by +6.8 kcal mol−1. CH2 formation can then be made with a barrier of +16.3 kcal mol−1 with respect to the A3 state, which by TST indicates a sufficiently fast transformation. The exergonicity, counted from the A3 state, is −10.6 kcal mol−1. A CH3 structure is obtained with a barrier of +18.3 kcal mol−1. Considering usual errors using DFT, this step should also be kinetically possible. However, formation of CH3 at a later stage in the mechanism cannot be excluded. Keeping CH2 until the N2 activation step is here considered to be less likely. The exergonicity of CH3 formation is −6.2 kcal mol−1. In the product, CH3 bridges between Fe4 and Fe5, with a protonated S3A bound terminally to Fe5, see Fig. 3. This concludes the carbon protonation in the activation step.
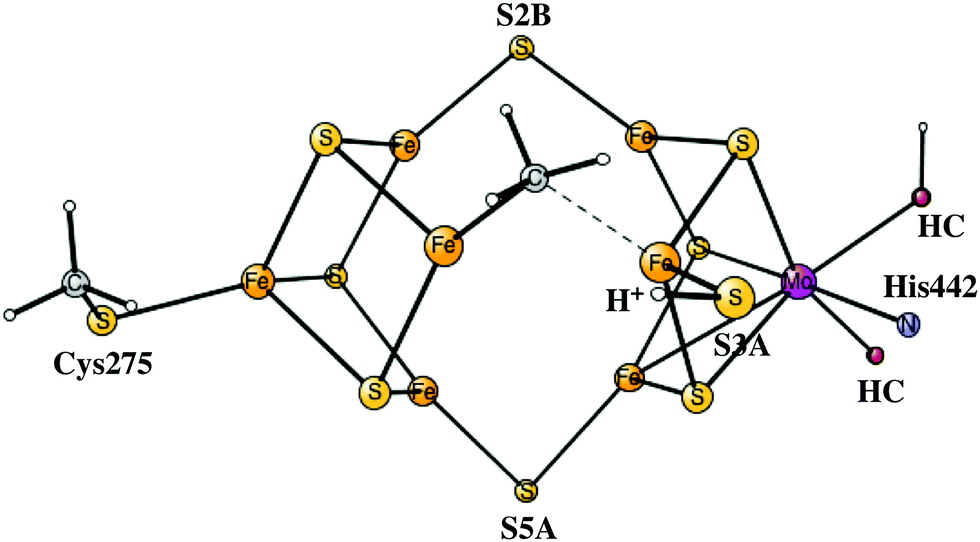 | ||
| Fig. 3 The structure of the fully activated A4 state, which is also the E0 starting state for the catalytic cycles. For the homocitrate, only the oxygens binding to molybdenum are shown. | ||
A few conclusions can be drawn from the results for different spin-couplings. The first one is that the specific spin-coupling does not seem to be a qualitatively important factor for the energetics and thereby for the mechanism. Another conclusion is that spin-coupling 2 is preferred when carbon is protonated. No exception was found here. For the states with an unprotonated carbon, spin-coupling 1 is slightly preferred. The only state where spin-coupling 1 is significantly better is for the A0 ground state, where the quartet is 5.4 kcal mol−1 lower in energy than the doublet with spin-coupling 1. In the previous study different spin-couplings were only tried for the protonated carbon states, where spin-coupling 2 was preferred, and it was therefore incorrectly used for all states, even the ones where carbon was unprotonated.7 The differences between the two spin-couplings can be explained by two effects. First, the spin on Mo changes from low-spin in the ground state to high-spin in all the other states. This significantly increases the gain obtained by antiferromagnetic exchange coupling between Mo and the nearest irons, and it therefore becomes favourable to strengthen these couplings at the cost of breaking some antiferromagnetic couplings between the irons. The second effect favouring spin-coupling 2 comes in when carbon becomes protonated, which increases some of the Fe–Fe distances and, therefore, reduces the gain by the antiferromagnetic coupling between these atoms.
Finally, it is interesting to look at what would happen if the experimental analysis of the electron transfer step was followed. The conclusion was that the hydrolysis of ATP should not contribute to the lowering of the redox potential of the P-cluster, which would therefore remain at −0.4 V. In the present study a value of −1.47 V is used instead, see above. With −0.4 V, the driving force would be lowered for every transition by 24.7 kcal mol−1. In Fig. 2 the exergonicity from A0 to A3 is −29.9 kcal mol−1. With a reduction potential of −0.4 V, this would turn into an endergonicity of +44.1 kcal mol−1. The present exergonicity of the A3 to A4 reduction of −19.7 kcal mol−1 would only turn into a slight endergonicity of +3.5 kcal mol−1. However, keeping carbon unprotonated as suggested in the experimental mechanism, the endergonicity of this step would be increased to +28.6 kcal mol−1.
The N2 activation steps
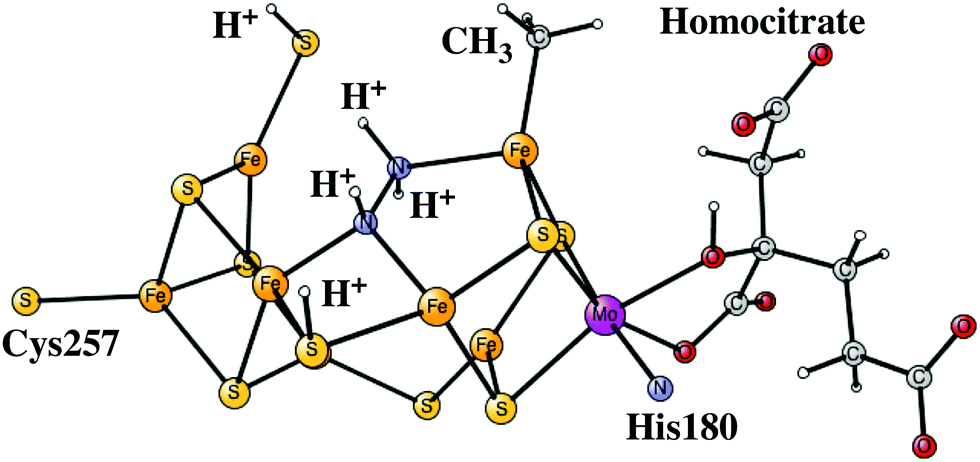
The four An activation steps described above only occur once. After this, the actual catalytic cycles start, which should go on until either ATP or N2 ceases. In line with the usual nomenclature, these steps are termed En, with E0 being identical to A4, described above. The details of the E-states are given in the ESI.† The oxidation state of E0 after the four reductions from A0 is Mo3+7Fe2+. This type of state has a similar oxidation state of the FeMoco to that of the P-cluster and should be much more reducing than the A0 ground state, but is still not expected to be reducing enough to activate N2. It should be noted that reducing the cluster further by adding electrons to the metals and protons to the ligands would most probably lead to unstable states since Fe(I) would appear. Still, it is possible to reach states that are more reduced by a sophisticated scenario,4–6 described below.In the step from E0 to E1, there is oxidation of the metals in the FeMoco rather than reduction, since a hydride is formed in E1. This hydride is situated in the centre of the cluster previously occupied by carbon. It has three bonds to iron, to Fe3, Fe4 and Fe7. S3A is terminally bound to Fe5, just like in A4 and is the only sulfur protonated. If the E0 state is placed at zero in energy, the E1 state is at −10.2 kcal mol−1, see Fig. 4. For a structure where the hydride is moved to S2B, the energy goes up by +12.2 kcal mol−1.
 | ||
| Fig. 4 Energy diagram for the N2 activation process of the FeMo-cofactor. The number of hydrides for each state is shown in red. | ||
In the second reduction after the activation steps, a proton is added to S2B, which means that the metals are reduced back to the oxidation state for E0. The exergonicity of the E1 to E2 transition is as large as −23.8 kcal mol−1, which creates a minor problem for the next transition, see below. To protonate the homocitrate instead of S2B is at this stage +11.1 kcal mol−1 higher in energy.
In the third reduction, there are several options. There can be one or two hydrides, the spin can be singlet or triplet, the spin-coupling could be 1 or 2, and homocitrate could be protonated or not. All these possibilities have been investigated. S2B, S3A and S5A are protonated. If the S5A proton is moved to form a second hydride, the energy becomes much higher. The computed transition energy from E2 to E3 is quite small with only −1.0 kcal mol−1. This driving force is probably too small, but it should be remembered that if the step where the electron is transferred to the P-cluster is included, the driving force is increased by another −3.0 kcal mol−1. It is also possible that the lowest structures have not yet been found. A minor error from DFT is also possible. As a final point, it could be noted that the E3 state actually has one Fe(I), since there is only one hydride.
In summary, for the first three reductions after the activation part, it appears that there is not yet any gain by protonating the homocitrate. This conclusion is a little bit different from the one drawn previously,12 and this is due to the finding of new structures with lower energies. Another conclusion from the present results is that the first two reductions have large driving forces, in particular for the second one, while the third one has a much lower driving force.
The state that activates N2 is E4 and is reached in the fourth reduction. The proton is added as a second hydride. S2B, S3A and S5A stay protonated. The oxidation state of E4 is the same as that of E0, since two hydrides and two protons have been added. This structure was used as a starting point for the structural change involving the homocitrate in a recent study.12 The protonation of the homocitrate is a quite complicated process. The protonation starts at one of the carboxylates not bound to Mo. After this, there is a rotation of the entire homocitrate with the help of the positive Lys426. The structural change occurs which lowers the energy by −7.6 kcal mol−1 for the E4 state with two hydrides. In this process, the homocitrate loses one of its bonds to Mo, and Mo becomes 5-coordinated. The barrier for this rotation is 16.2 kcal mol−1, which means that it is feasible on the time scale of a step in the catalytic cycle. The doublet is preferred with the quartet much higher in energy.
There is experimental support for the rotation of the homocitrate, from a study where a structural change of the homocitrate was discussed and modeled.35 By an MM-simulation they found that it was possible to open up an empty site on Mo, much like in the present study. Experimentally, when Lys426 was mutated to other amino acids, there were significant effects on the N2 activation rate.
The N2 binding mechanism
As indicated in the previous subsection, there is an energetic advantage to rotate the homocitrate in the E4 state. However, it is still not obvious that the rotation will occur in the ground state of E4 with two hydrides, since there may be other competing reactions, which first have to be investigated. A reaction that is known to occur in E4 is the release of the two hydrides as H2 with a reductive elimination mechanism, termed re,4–6 leading to an excited E2* state, with a redox state of Mo(III)5Fe(II)2Fe(I), which is clearly very reducing. The barrier for this step was therefore calculated and found to be only +9.3 kcal mol−1, 6.8 kcal mol−1 lower than the barrier for the rotation of the homocitrate. The optimized TS is shown in Fig. 5. Even more importantly, the barrier is 6.8 kcal mol−1 lower than the competing reaction for removing one hydride and one proton on sulfur, the hp reaction which is thermodynamically preferred. The latter result is absolutely necessary for the reduction of N2. Otherwise, with an hp step, the process would just go back to the ground state of E2 and the only thing gained would be the release of an H2 molecule. It is important to note that the energy of E2 with one hydride in the centre is −28.3 kcal mol−1 lower than the one for the E2* state without any hydrides in the center. If the rotation of the homocitrate would occur before the re step, the selectivity difference for the re step compared to the hp step would be much reduced. The barrier for re after homocitrate rotation would still be low with +9.8 kcal mol−1, but the barrier for hp would be almost as low with +11.2 kcal mol−1. This energy difference of 1.4 kcal mol−1 would lead to a significantly higher loss of H2 for each N2 reduced. The release of H2 by a re reaction with a non-rotated homocitrate, resulting in the E2* state, is exergonic by −5.3 kcal mol−1. So far, it has therefore been clear that there is no advantage of rotating the homocitrate anywhere in the process, which is a quite surprising result after the finding that the rotation is favourable in energy at the E4 stage.12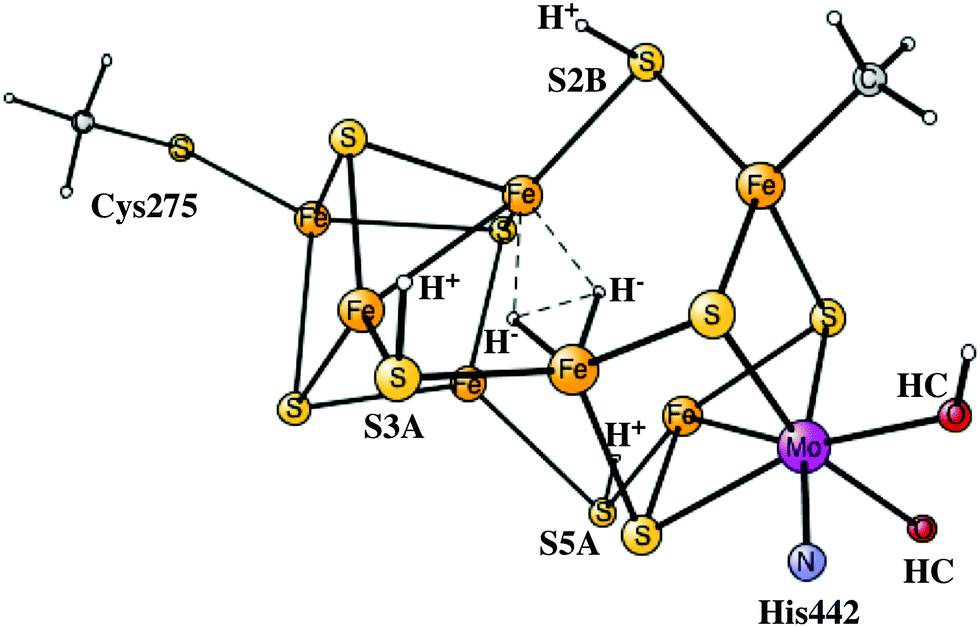 | ||
| Fig. 5 The re transition state for a non-rotated homocitrate (HC). | ||
The surprises continue at the stage when N2 should bind, after the re step. It is found that N2 still does not bind anywhere to the cofactor. The loss of entropy is significantly larger than the gain of enthalpic binding. All attempts to bind N2, in the now empty centre of the cofactor, only leads to the release of N2. Only very high energy (local) minima were found, in which N2 was strongly unbound. On the other hand, if N2 would be bound simultaneously as a proton moves from S5A to N2 to form N2H, the process would be much more favourable. The process to reach N2H from E2*, when the hydrides have been released as H2, would now be exergonic by −2.2 kcal mol−1. An increase of the entropy of the cluster itself by −5.7 kcal mol−1, found in a previous study,7 is included in the binding of N2. These results would mean that the entire process from E4, with two hydrides, to the binding of N2, bound as N2H, would be exergonic by −7.5 kcal mol−1. At this stage it, therefore, seems that the rotation of the homocitrate never enters in the steps of N2 binding either. However, there is one remaining major problem.
The problem is that it is difficult to see how the N2H structure could form without a preceding binding of N2 itself, at least not for one with a strongly unbound N2 as found here at this stage until now. The main reason, by far, for the endergonicity of binding N2, is that a proton has moved to S5A of the cofactor simultaneously as the reduction to E4 occurs. The protonation is necessary and cannot be avoided, and S5A is the best position for the proton. This proton competes with N2 for the electrons on the cofactor. As the proton takes a partial electron from the cofactor, it becomes much harder for N2 to obtain enough electrons to become bound. This result is for the homocitrate in its original position. The interest therefore focused on trying to bind N2 with a rotated homocitrate. First, rotation of the homocitrate for the E2* state, without the two hydrides, is essentially thermoneutral (endergonic by +0.3 kcal mol−1). For the E4 state with the two hydrides, the same rotation is exergonic by −7.6 kcal mol−1. The best binding of N2 for the rotated homocitrate was found for an end on binding to Fe4 and Fe6, with N2 pointing into the cavity, see Fig. 6. However, the binding is still endergonic but now only with +3.2 kcal mol−1, including the loss of entropy for N2 of 9.9 kcal mol−1 and the gain of entropy for the open cluster of 5.7 kcal mol−1. However, there is still a problem to protonate N2. When a proton is moved to N2, the energy becomes very high. The N2H structure is therefore unreachable in E4. It is concluded here that, at the end of the E4 step, an unprotonated N2 is bound for a rotated homocitrate. The final result gives a very good reason for rotating the homocitrate. As mentioned above, no other advantage was found anywhere previously in the process.
 | ||
| Fig. 6 The core structure for the MoFe-cofactor of nitrogenase in the E4-N2 state is fully activated. The redox state is Mo(III)5Fe(II)2Fe(I). The arrows indicate an open coordination of the homocitrate. | ||
It is possible to understand why N2 binds much better with a rotated homocitrate. In that process, the homocitrate takes one proton from S5A of the cofactor and simultaneously loses a bond between Mo and the homocitrate, which gives additional electrons to the cofactor to bind N2.
The final computational result that N2 is unbound at the end of the E4 step shows that the DFT calculations have some error. Experimentally, a weakly bound N2 has been demonstrated. As already described above, the error of DFT in the binding of carbon is estimated to be about 4 kcal mol−1 for each Fe–C bond. A similar problem in the binding of N2 is therefore not unlikely. The error must be a few kcal mol−1, which is a normal error for DFT. In the process of protonating N2 in E5, it also becomes advantageous to rotate the homocitrate back to its original position. The homocitrate will stay that way in the rest of the catalytic steps.
The difficulty of binding N2 was noted also in the previous study.7 In that study, this was solved by adding yet another electron to reach an E5 state but without a proton added, but that is probably not a realistic solution. An activation in E5 is, furthermore, contradicted by EPR experiments, which indicate N2 activation in the E4 state.
An interesting additional finding is that CO is strongly unbound in the same minimum where N2 binds. This finding is in line with the experimental result that CO is not a competitive substrate.5
The nitrogen protonation steps
After the activation of N2 in the E4 state, the nitrogen protonation steps start with the E5 state. The first addition of an (H+, e−) pair after N2 activation leads to the E5 state. The energies for about 20 different structures were compared. The initial step in the E4 to E5 transition is the protonation of N2 with a computed exergonicity of −11.1 kcal mol−1. The spin on nitrogen is −0.5 and the singlet state is slightly preferred to the triplet. The structure is shown on top in Fig. 7. After that step, still in the E5 state, the homocitrate can rotate back to its original position in the ground state of the cofactor. This rotation leads to the release of a proton from the homocitrate, with the proton ending up on N2, shown as the NNH2 structure at the bottom in Fig. 7. Placing the proton as a hydride is +4.0 kcal mol−1 higher, and on a sulfide is another 12.5 kcal mol−1 higher in energy. Both protons on N2 are on the nitrogen pointing towards the open face of the cluster between Fe2 and Fe6. Placing the proton to form an HN–NH structure is much higher in energy by nearly 30 kcal mol−1, showing the big advantage of the formation of the open cluster structure leading to a much less crowded situation for the substrate. The spin on nitrogen in the NNH2 structure is +0.3 and the triplet is preferred. This step is very exergonic by −30.9 kcal mol−1. The large exergonicity in the E4 to E5 transition illustrates the very unstable situation of the strongly reducing E4 state, which is necessary for activating N2.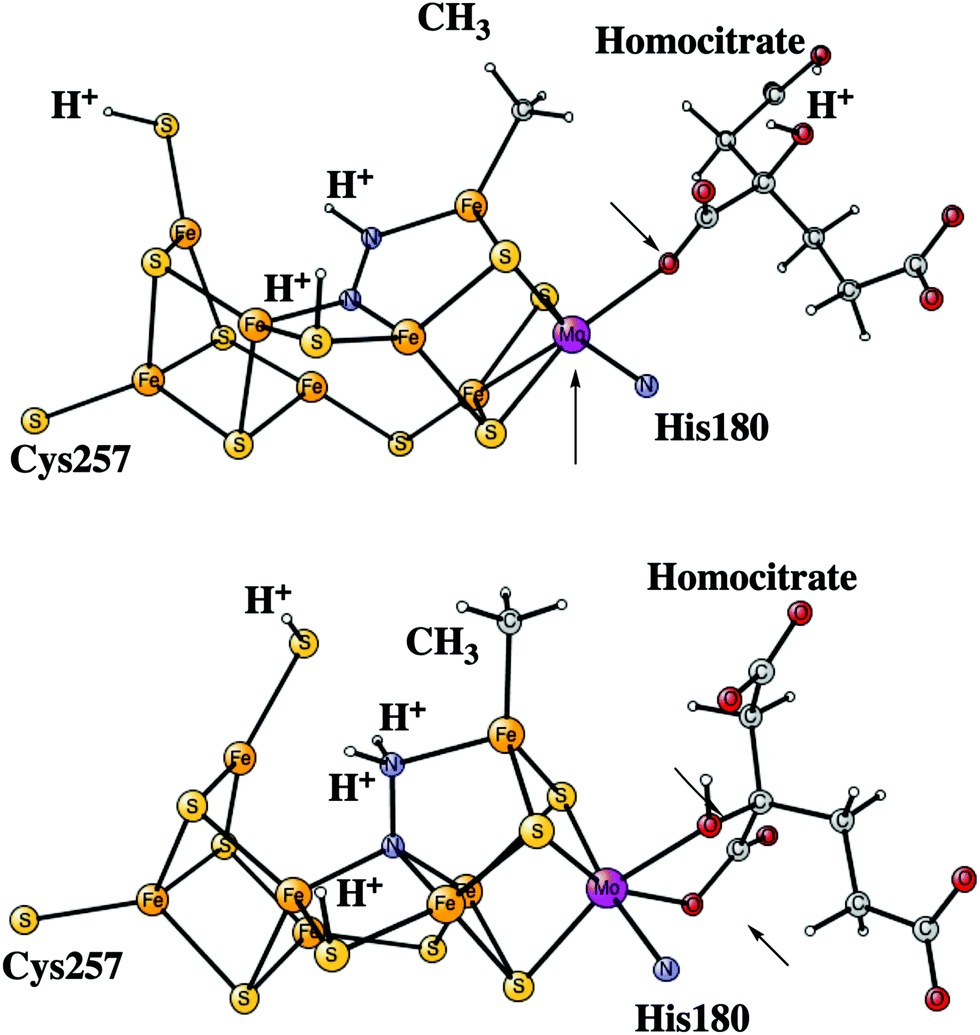 | ||
| Fig. 7 The core structure for the MoFe-cofactor of nitrogenase in the E5-N2H (top) and E5-NNH2 (bottom) states. The arrows indicate the open (top) and the closed (bottom) coordination of the homocitrate. | ||
Another addition of an (H+, e−) pair leads to the E6 state. From this point on, the closed coordination of the homocitrate is preferred. The added proton ends up on nitrogen to form an HN–NH2 group, with the doubly protonated nitrogen closest to the open face of the cluster between Fe2 and Fe6. The structure is shown in Fig. 8. There is hardly any spin on nitrogen. The exergonicity of this transition was computed to be −22.2 kcal mol−1. Placing the proton to form an N-NH3 structure is much higher in energy, by nearly 30 kcal mol−1 (lacvp*).
 | ||
| Fig. 8 The core structure for the MoFe-cofactor of nitrogenase in the E6-N2H3 state. Homocitrate has a closed coordination. | ||
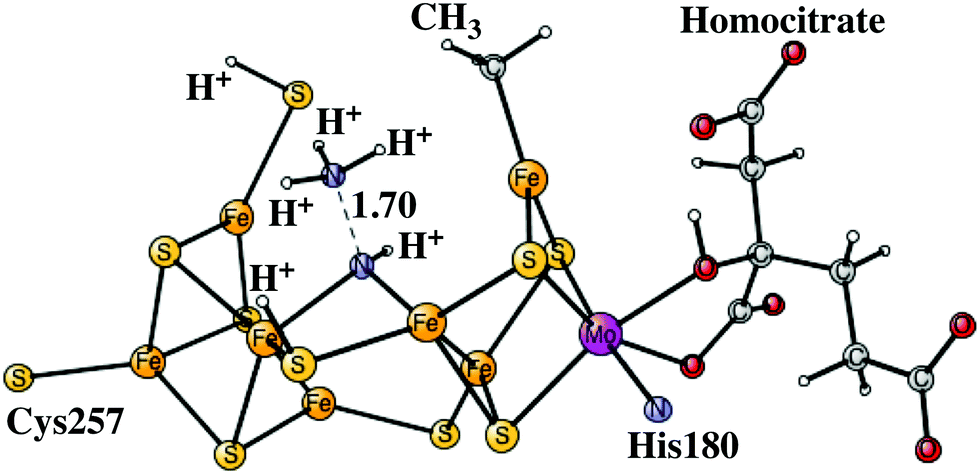
The next reduction leads to the E7 state. There are two possibilities for the nitrogen structure. The protonation could either lead to a H2N–NH2 structure, or to a HN–NH3 structure shown in Fig. 9. Both of them are singlet states. The former structure is more stable by −1.4 kcal mol−1. To reach that structure from the E6 structure is slightly endergonic by +2.8 kcal mol−1. At this stage it is possible to cleave the N–N bond. The starting point is the HN–NH3 structure. The transition state occurs at an N–N distance of 1.7 Å and the local barrier is only +7.4 kcal mol−1. The approximate transition state, shown in Fig. 10, is 11.6 (= 7.4 + 2.8 + 1.4) kcal mol−1 higher in energy than the E6 state. The cleavage is very exergonic by −52.1 kcal mol−1 compared to the energy for the HN–NH3 structure, and leads to the release of an ammonia molecule. The exergonicity includes an estimated gain of an energy of −14 kcal mol−1 (just as for H2O) for the release of NH3 to the surrounding water. The binding of the remaining NH group is shown in Fig. 11. The triplet is preferred compared to the singlet. It has four bonds to the irons, and both S2A and S3B are still protonated. The spin on nitrogen is +0.2. The total exergonicity of the E6 to E7 transition becomes −47.9 (= −52.1 + 1.4 + 2.8) kcal mol−1. The cleavage of the N–N bond in H2N–NH2 has a much higher barrier, higher than 25 kcal mol−1 at the lacvp* level.
 | ||
| Fig. 9 The core structures for the MoFe-cofactor of nitrogenase in the E7 H2N–NH2 (top) and in the E7 HN-NH3 (bottom) structures. Homocitrate has a closed coordination. | ||
 | ||
| Fig. 10 The core structure for the MoFe-cofactor of nitrogenase for the N–N transition state of the E7 HN–NH3 state. Homocitrate has a closed coordination. | ||
 | ||
| Fig. 11 The core structures for the MoFe-cofactor of nitrogenase for the E7-NH product after N–N cleavage and NH3 release (top), and for the E8-NH2 structure (bottom). Homocitrate has a closed coordination. | ||
Adding another (H+, e−) pair leads to the E8 state which has an NH2 group bound to Fe4 and Fe5, shown in Fig. 11. The E7 to E8 transition is exergonic by −9.8 kcal mol−1. There is no spin on NH2. The final protonation leads to a complicated sequence of events, not studied in detail here. The first step is the protonation of NH2 which leads to the release of the second ammonia. After that, the structure closes by forming a bond between Fe6 and S2B. The proton on S2B is then moved to a central hydride position. This product structure is the E1 state in the first part of the catalytic cycle, and catalysis can continue on the next cycle. The E8 to E1 transition is exergonic by −31.3 kcal mol−1. The energy diagram for the entire reduction of N2 is shown in Fig. 12.
 | ||
| Fig. 12 The energy diagram for all the protonation steps of N2 from E4 back to E1. | ||
The carbon deprotonation steps
A protonated carbon in FeMoco has never been observed experimentally, as mentioned in the introduction. It is in this context important to note that structural information is only available for the A0 ground state. However, even an X-ray structure of A0 obtained directly after catalytic turnover does not have a protonated carbon. Since a protonated carbon has been suggested here as an essential part of the mechanism, it is important to try to understand how carbon can be deprotonated after catalytic cycling is over. It should be noted from the beginning that a carbon that is always unprotonated in the mechanism of nitrogenase can be ruled out by the general rules for the present type of studies, unless DFT completely fails in a way never seen before for this type of system, see the introduction. Therefore, the fact that a deprotonation mechanism of carbon should exist could in principle be taken directly from experiments.As ATP and N2 cease, the situation will change back to the situation for the resting state. The redox potential for the P-cluster should then be back to −0.4 V, which should be much higher than for the states of the FeMoco after the reductions. Therefore, it is here argued that the P-cluster and its electron transfer chain should act as an oxidant for the FeMoco, with a redox potential of about −0.4 V. The situation is similar to that of NiCO dehydrogenase, when the redox potential is changed from −0.6 V to −0.3 V. At −0.6 V the substrate is reduced, but at −0.3 V, the process reverses to oxidation.36 The transfer of an electron from the FeMoco could either occur directly to the P-cluster, from where the electron should go out through the electron transfer chain, or it can occur in the opposite order with an electron from the P-cluster going out first. The one that is preferred will be the one with the lowest barrier. Due to the low redox potentials of the reduced states of the FeMoco, this electron transfer should be exergonic. Below, it will be investigated if it is possible to oxidize the FeMoco with a redox potential of −0.4 V and simultaneously deprotonate the carbon. The oxidation mechanism will start with an arbitrary E-state. The removal of hydrides and protons on sulfur in the E-states by oxidation is very easy using this potential. For example, removing the hydride by oxidation in the best E1 state, to reach A4, is exergonic by −24.9 kcal mol−1, and to remove the final proton on S3A by oxidation to reach the A3 state is exergonic by −13.0 kcal mol−1. The detailed study therefore starts with an A3 state where the only additional protons on the FeMoco are bound to carbon as CH3, see Fig. 13. The sulfurs are thus unprotonated. This A3 state is a triplet with spin-coupling 2, the singlet with spin-coupling 1 is +8.2 kcal mol−1 higher in energy. It is quite different from the A3 state discussed above, which has three protons on the belt sulfurs and no protons on carbon. The energy diagram for the deprotonation process is shown in Fig. 14.
 | ||
| Fig. 13 The optimized CH3 containing A3 state, which is the starting point for the deprotonation steps studied here. | ||
 | ||
| Fig. 14 Energy diagram for the deprotonation process of the FeMo-cofactor. The protonation state of the central carbon for each state is shown in red. | ||
To remove an electron and a proton from the A3 state using a redox potential of −0.4 V to form an A2 state with a CH2 is calculated to be endergonic by +4.8 kcal mol−1, which would indicate that something more has to happen if the A3 to A2 transition should occur. At this point, the effects of outside waters were investigated. Adding two waters right above the Fe2–Fe4–Fe5–Fe6 plane for the CH2 structure turns out to be exergonic by −3.7, where 14 kcal mol−1 is used for the binding of a water molecule in bulk water, see Section II. Placing the same two waters on the CH3 structure for A3 is endergonic, leading to a decreased endergonicity for the A3 to A2 transition from adding water from +4.8 to +1.1 kcal mol−1, going to a CH2 structure in A2. Since this step is still endergonic, an additional step in A2 has to be taken from CH2 to CH. Without the waters this step is endergonic by +5.2 kcal mol−1. However, placing the two waters in the same way over the product CH state is very exergonic with −21.9 kcal mol−1. This means that there is an effect of −18.2 (−21.9 + 3.7) kcal mol−1 in the CH2 to CH transition by adding waters. These waters therefore change the CH2 to CH transformation from being endergonic by +5.2 kcal mol−1 to becoming exergonic by −13.0 kcal mol−1, a dramatic effect. There are several reasons for this effect, but the main origin is the presence of a protonated sulfur in the CH structure, which the CH2 structure does not have. The protonated sulfur forms a strong hydrogen bond to a water with a distance of 1.86 Å. For the CH2 structure, on the other hand, there is only a weak donating bond from water to the sulfur with a distance of 2.61 Å. The exergonicity from the A3 structure with a CH3 to the A2 structure with a CH becomes −11.9 (+1.1 − 13.0) kcal mol−1.
It can be added that also effects other than the hydrogen bonding are probably responsible for the big effect of adding waters. The charge distributions of the FeMoco are quite different for the CH and CH2 structures in A2. As indicated by the population analysis, the charge of the four irons nearest to the waters is significantly more positive for the CH structure. However, the population analysis has known deficiencies and can only be used qualitatively. Also, it needs to be pointed out that the description of the water surrounding of the FeMoco with only two waters is very simplified. However, taking away one of the waters only increases the relative energies by 4.0 kcal mol−1. Adding a third water in this region would most probably lower the barrier by much less than the second water did. There are obviously also other water molecules surrounding the FeMoco, but the ones far away from the deprotonation reaction should give very small contributions even if they are bound exergonically to the cluster.
An approximate TS has also been located between the CH2 and CH structures in A2. Using the same two waters, the barrier becomes +13.9 kcal mol−1 from the CH2 structure. Together with the endergonicity forming the CH2 structure in A2 of +1.1 kcal mol−1, the barrier becomes +15.0 kcal mol−1 which should lead to a rather high rate using TST. The reaction path contains another notable feature, and this is a local minimum with an H3O+ above the Fe2–Fe4–Fe5–Fe6 plane for the CH structure. This structure is already −7.7 kcal mol−1 lower than the CH2 structure, and has an energy of −6.6 (−7.7 + 1.1) kcal mol−1 lower than the A3 state. When the proton is transferred from the H3O+ to the S3A sulfur the energy goes down further to −11.9 kcal mol−1 (see above). The presence of the low lying H3O+ is a very clear indication of a strong hydrogen bonding network for the CH structure.
The next proton removal from carbon occurs in the A1 state. Going from the CH structure in A2 to the one in A1 is endergonic by +8.0 kcal mol−1, where water binding contributes significantly to the endergonicity. As mentioned above, two water molecules are bound exergonically by as much as −21.9 kcal mol−1 in the A2 CH structure, due to the presence of the S3A-H ligand. When the S3A proton is removed going to A1, the strong hydrogen bonding is also removed. In the A1 CH structure the binding of the two waters at the same place is only exergonic by −2.4 kcal mol−1. Without the two waters, the A2 to A1 transition is exergonic by −11.5 (+8.0 − 21.9 + 2.4) kcal mol−1. From the CH structure in A1 with two water molecules, the barrier is very low to remove the remaining proton from carbon with only +6.5 kcal mol−1. Together with the endergonicity of +9.6 kcal mol−1 the barrier counted from the A2 CH structure is therefore +14.5 (8.0 + 6.5) kcal mol−1, which from TST should be quite fast. The mechanism is very similar to the one in the A2 state from CH2 to CH1. After the TS, a meta-stable H3O+ is formed above the Fe2–Fe4–Fe5–Fe6 plane also in A1, at an energy of −16.0 kcal mol−1 below the CH structure, indicative of a very strong hydrogen bonding network, which is necessary for the low barrier. Going from CH to C in A1 is exergonic by −28.1 kcal mol−1. Adding the endergonicity of forming the CH structure of +8.0 kcal mol−1, the A2 to A1 transition becomes exergonic by −20.1 kcal mol−1. For the final C-structure, binding the two water molecules is exergonic by −9.0 kcal mol−1 (−37.0 + 28) kcal mol−1.
The transition from A1 to A0 does not involve any deprotonation of carbon. Instead, the proton on S3A is removed. The two water molecules are unbound to the FeMoco in A0, which is in agreement with the X-ray structure. Without the water molecules in A1, the A1 to A0 transition is exergonic by −14.6 kcal mol−1. With the water molecules in A1, the exergonicity is decreased to −12.6 kcal mol−1.
IV. Summary
The activation of N2 by Mo-containing nitrogenase is here found to be an extremely complicated process, much more complicated than previously thought. It was already known from experiments that the binding of N2 requires a preceding formation of two hydrides, which then leave as H2 in a re reaction.4–6 In that process, the metal cofactor becomes strongly reducing with two Fe(I). Rather surprisingly, the cofactor is still not reducing enough to bind N2. The problem is that the final proton added to S5A when E4 is formed takes electrons from the metals in the cofactor. To give an additional reduction of the cofactor, the homocitrate takes the S5A proton and rotates to a position with only one bond to Mo. After that step, the metals are more reducing and N2 can bind. The calculations give a weakly unbound N2, which indicates a minor DFT error, since the binding of N2 is experimentally found to be weakly exergonic.It has previously been found that the protonation of the carbide is strongly preferred over the protonation of the sulfides after a few initial reduction steps. The protonation of the carbide is required since this allows the cofactor to be reduced by three more electrons than if only the sulfides were protonated. The reason for this is that for every electron reduction, a proton has to bind to compensate the charge.
A protonated carbide of the cofactor has never been observed. This may not be a problem for the present mechanism per se, since structural information is only available for the ground state, where also the present calculations find an unprotonated carbide. However, the carbide has been found to be unprotonated also after catalytic turnover. If the present methodology is not totally wrong in a way never seen before, the computational result with the protonation of the carbide must be considered as quite certain; there must be a pathway to deprotonate the carbide after catalytic turnover. Such a pathway has been suggested here. An important point in this context is that once the external reduction of the P-cluster of the FeMo-protein has ceased, the P-cluster turns from a reductant into an oxidant with a sufficiently high redox potential to oxidize the cofactor, which at that point has a very low redox potential.
Conflicts of interest
There are no conflicts to declare.Acknowledgements
This work was generously supported by the Knut and Alice Wallenberg Foundation and by grants from the Swedish research council. Computer time was provided by the Swedish National Infrastructure for Computing.References
- J. Kim and D. C. Rees, Science, 1992, 257, 1677–1682 CrossRef CAS PubMed
.
- T. Spatzal, M. Aksoyoglu, L. Zhang, S. L. A. Andrade, E. Schleicher, S. Weber, D. C. Rees and O. Einsle, Science, 2011, 334, 940 CrossRef CAS PubMed
-
R. N. F. Thorneley and D. J. Lowe, Molybdenum Enzymes, ed. T. Spiro, Wiley, N.Y., 1985, p. 221 Search PubMed
- B. M. Hoffman, D. Lukoyanov, Z. Y. Yang, D. R. Dean and L. C. Seefeldt, Chem. Rev., 2014, 114, 4041–4062 CrossRef CAS PubMed
- B. M. Hoffman, D. Lukoyanov, D. R. Dean and L. C. Seefeldt, Acc. Chem. Res., 2013, 46, 587–595 CrossRef CAS PubMed
- D. Lukoyanov, Z.-Y. Yang, N. Khadka, D. R. Dean, L. C. Seefeldt and B. Hoffman, J. Am. Chem. Soc., 2015, 137, 3610–3615 CrossRef CAS PubMed
- P. E. M. Siegbahn, J. Am. Chem. Soc., 2016, 138, 10485–10495 CrossRef CAS PubMed
- P. E. M. Siegbahn, J. Comput. Chem., 2018, 39, 743–747 CrossRef CAS PubMed
- P. E. M. Siegbahn and M. R. A. Blomberg, Front. Chem., 2018, 6 DOI:10.3389/fchem.2018.00644
- M. R. A. Blomberg, T. Borowski, F. Himo, R.-Z. Liao and P. E. M. Siegbahn, Chem. Rev., 2014, 114, 3601–3658 CrossRef CAS PubMed
- L. Cao and U. Ryde, Phys. Chem. Chem. Phys., 2019, 21, 2480–2488 RSC
- P. E. M. Siegbahn, Inorg. Chem., 2018, 57, 1090–1095 CrossRef CAS PubMed
- L. Cao, O. Caldararu and U. Ryde, J. Chem. Theory Comput., 2018, 14, 6653–6678 CrossRef CAS PubMed
- G. M. Sandala and L. Noodleman, Methods Mol. Biol., 2011, 49, 293–312 CrossRef CAS PubMed
- I. Dance, Inorg. Chem., 2011, 50, 178–192 CrossRef CAS PubMed
- I. Dance, Dalton Trans., 2015, 44, 18167–18186 RSC
- J. Schimpfl, H. M. Petrilli and P. E. Blöchl, J. Am. Chem. Soc., 2003, 125, 15772–15778 CrossRef PubMed
- U. Huniar, R. Ahlrichs and D. Coucouvanis, J. Am. Chem. Soc., 2004, 126, 2588–2601 CrossRef CAS PubMed
- H. I. Lee, P. M. C. Benton, M. Laryukhin, R. Y. Igarashi, D. R. Dean, L. C. Seefeldt and B. M. Hoffman, J. Am. Chem. Soc., 2003, 125, 5604–5605 CrossRef CAS PubMed
- B. Hinnemann and J. K. Nørskov, J. Am. Chem. Soc., 2004, 126, 3920–3927 CrossRef CAS PubMed
- J. B. Varley, Y. Wang, K. Chan, F. Studt and J. K. Nørskov, Phys. Chem. Chem. Phys., 2015, 17, 29541–29547 RSC
- L. Rao, X. Xu and C. Adamo, ACS Catal., 2016, 6, 1567–1577 CrossRef CAS
- S. Raugei, L. C. Seefeldt and B. M. Hoffman, Proc. Natl. Acad. Sci. U. S. A., 2018, 115, E10521 CrossRef CAS PubMed
- D. Lukoyanov, N. Khadka, D. R. Dean, S. Raugei, L. C. Seefeldt and B. M. Hoffman, Inorg. Chem., 2017, 56, 2233–2240 CrossRef CAS PubMed
- P. E. M. Siegbahn, Biochim. Biophys. Acta, 2013, 1827, 1003–1019 CrossRef CAS PubMed
- P. E. M. Siegbahn, J. Comput. Chem., 2001, 22, 1634–1645 CrossRef CAS
-
Jaguar, version 8.9, Schrodinger, Inc., New York, NY, 2015 CrossRef CAS; A. D. Bochevarov, E. Harder, T. F. Hughes, J. R. Greenwood, D. A. Braden, D. M. Philipp, D. Rinaldo, M. D. Halls, J. Zhang and R. A. Friesner, Int. J. Quantum Chem., 2013, 113, 2110–2142 CrossRef CAS
- A. D. Becke, J. Chem. Phys., 1993, 98, 5648–5652 CrossRef CAS
- R. Bjornsson, F. Neese, O. Helgasson and S. DeBeer, Inorg. Chem., 2017, 56, 1470–1477 CrossRef CAS PubMed
- B. Benediktsson and R. Bjornsson, Inorg. Chem., 2017, 56, 13417–13429 CrossRef CAS PubMed
- S. Grimme, J. Comput. Chem., 2006, 27, 1787–1799 CrossRef CAS PubMed
- L. Noodleman and D. A. Case, Adv. Inorg. Chem., 1992, 38, 423 CrossRef CAS
- B. K. Burgess and D. J. Lowe, Mechanism of Molybdenum Nitrogenase, Chem. Rev., 1996, 96, 2983–3011 CrossRef CAS PubMed
- S. Duval, K. Danyal, S. Shaw, A. K. Lytle, D. R. Dean, B. M. Hoffman, E. Anthony and L. C. Seefeldt, Proc. Natl. Acad. Sci. U. S. A., 2013, 110, 16414–16419 CrossRef CAS PubMed
- M. C. Durrant, A. Francis, D. J. Lowe, W. E. Newton and K. Fisher, Biochem. J., 2006, 397, 261–270 CrossRef CAS PubMed
- M. Can, F. A. Armstrong and S. W. Ragsdale, Chem. Rev., 2014, 114, 4149–4174 CrossRef CAS PubMed
Footnote |
| † Electronic supplementary information (ESI) available: The details of the carbon protonation steps and the N2 activation steps, as well as coordinates for the structures in the N2 activation and protonation process. The coordinates being fixed are marked with a #. The coordinates for the other structures are available from the author upon request. See DOI: 10.1039/c9cp02073j |
| This journal is © the Owner Societies 2019 |