Hydrogen quenches the size effects in carbon clusters†
Received
25th February 2019
, Accepted 1st May 2019
First published on 2nd May 2019
Abstract
A characteristic fingerprint of atomic clusters is that their properties can vary in a non-smooth way with the cluster size N. This is illustrated herein by studying the cluster size dependence of several properties of neutral CN and cationic C+N carbon clusters: C–C bond lengths, cluster structure, intrinsic cluster stability, ionization energy, and spatial distribution of the reactivity index for charge exchange with electrophiles. Nonetheless, clusters can lose the size dependence of their properties by interaction with other chemical species, which is rationalized in this study by analyzing carbon clusters fully saturated with hydrogen to form linear alkanes, CNH2N+2. In all cases, the lowest energy structures are zigzagging linear chains, the variations of C–C bond lengths and  angles with alkane size are very minor and smooth, the stability function shows practically no structure as a function of the alkane size, the ionization energies just decrease smoothly with alkane size, and the spatial distribution of the reactivity index is analogous and highly delocalized in all the alkanes. In summary, the interaction of carbon clusters with hydrogen to form alkanes quenches all the size-dependent features that the carbon clusters originally owned. The arrival at the quenching of the size effects follows an involved path. In each CNHn family with fixed N, the values of the properties of the molecules like the ionization potential, the electron affinity, and others show sizable oscillations as the number of hydrogen atoms grows from the pure carbon cluster to the alkane.
1 Introduction
The most important characteristic of atomic clusters and nanoparticles is the non-smooth dependence of their properties with the cluster size, that is, with the number of atoms in the cluster. This non-smooth variation has been detected in the physical and chemical properties. As an illustration, a few noteworthy cases can be selected among the many possible examples.
The structures of the clusters often vary with the cluster size. As a remarkable example, the structures of cationic boron clusters B+N with sizes between 17 and 25 atoms are short cylinders formed by two rings, whereas smaller clusters are quasiplanar.1 On the other hand, the main allotrope of bulk solid boron, rhombohedral α-B, is formed by icosahedral B12 clusters connected by strong covalent bonds.2 Electronic properties are also quite sensitive to cluster size. The ionization energy of alkali metal clusters presents sudden drops at the magic numbers N = 8, 20, 40, 58, 92,…,3 which are explained by the high stability achieved by the closing of electronic shells that occurs at these particular cluster sizes.4,5 The binding energies of atomic core orbitals can be very sensitive to the size of the nanoparticles and can be probed by X-ray absorption near-edge structure (XANES) spectroscopy.6 Mercury clusters reveal a band gap closure with increasing cluster size, which corresponds to an insulator–metal transition.7 Optical properties represent another interesting case. The color of gold nanorods depends on their aspect ratio (ratio between the lengths of the longitudinal and transverse axes of the nanorod), because the aspect ratio influences the optical absorption spectrum.8 Magnetism at the nanoscale is intricate and rich in surprises. For instance, the magnetic moment per atom of nickel clusters shows an overall decrease as a function of cluster size, but oscillations are superimposed to that decrease, with deep local minima at Ni6 and Ni13, and another minimum at Ni55–Ni56.9 Larger nanoparticles also display a substantial dependence of the magnetization with temperature and particle volume. For instance, a temperature-induced ferromagnetic to superparamagnetic transition has been observed in Fe nanoparticles only below a threshold size.10 Following the discovery of the catalytic properties of small gold nanoparticles by Haruta and coworkers,11 one of the areas where the cluster size effects show more promise is nanocatalysis.12 In their seminal work Haruta and coworkers investigated the role of gold nanoparticles on the direct oxidation of propene by a mixture of O2 and H2, and observed that the selectivity towards the final product is highly sensitive to the size and shape of the gold particles. The adsorption energies of O, O2, OH, OOH, H2O, H2O2 and CO on the surface of Pt and Au clusters and nanoparticles depend sensitively on the cluster size, and the convergence to the bulk occurs faster for Pt.13,14
Magic numbers (magic sizes) are a characteristic of clusters, and the numerical values of the cluster properties usually show noticeable changes after those magic numbers, as mentioned above for the ionization potentials of metal clusters. The magic numbers often arise from the closing of shells, either electronic shells4,5 or atomic shells,15 or to specially favorable electronic and atomic structures like in C60.16 Magic numbers have been also observed in the case of clusters synthesized on metal surfaces. Artaud et al.17 have recently reported the discovery of a novel family of metastable non-Kekulé carbon clusters of magic sizes and morphologies that covalently anchor to the substrate preventing the growth of graphene.
The selected examples reviewed above give evidence of the variety of size effects occurring in clusters. An interesting topic seldom studied is the quenching of the size effects in clusters. This can occur by the interaction of the clusters with other species, and in this work we focus on the quenching of the size effects in small carbon clusters by hydrogen. For this purpose we have considered a family of molecules with a similar structure, the linear alkanes CNH2N+2 with N = 2–25. In Section 2 we briefly present the computational method used in the calculations. The results showing how the presence of H atoms quenches the size effects are reported in Sections 3.1 and 3.2. The alkane CNH2N+2 is the heaviest molecule at the end of each CNHn family, and the variation of the properties as the number n of hydrogen atoms increases in the family is analyzed in Section 3.3. Finally, the conclusions are summarized in Section 4.
2 Computational approach
The atomic structures, cluster stabilities, electronic properties and reactivity of neutral CN and cationic C+N carbon clusters with N ≤ 16, and neutral CNH2N+2 and cationic (CNH2N+2)+ alkanes with N = 2–25 have been investigated using the density functional theory as implemented in the Gaussian09 atomistic simulation package.18 The hybrid B3LYP method19,20 was employed to treat exchange and correlation effects, and the molecular orbitals were expanded on a cc-PVQZ basis21 set. In the case of the pure carbon clusters, for each cluster-size we have used a number of different isomers reported in the literature as starting geometries for the structural optimization within the B3LYP method.22 Besides, for all the neutral CN and cationic C+N isomers studied we have analyzed the two lowest-lying electronic spin states. On the other hand, alkanes are hydrocarbon compounds consisting of C and H atoms. Their chemical structure consists of single bonds only. Three types of alkanes exist: linear, branched and cyclic. In the present study we focus on the linear alkanes CNH2N+2: in these molecules all the carbon atoms have sp3 hybridization, form a zigzagging chain-like structure and are fully saturated with H atoms. Starting with the most simple case of ethane, C2H6, the initial geometries for the geometrical optimizations of neutral CNH2N+2 and cationic (CNH2N+2)+ alkanes have been constructed by sequentially adding internal –CH2– units between the two end –CH3 groups.
Reactivity indexes introduced by Fukui et al.23 have been computed for the CN and CNH2N+2 clusters. The Fukui functions provide a measure of the local reactivity of a molecule. In the framework of density functional theory the Fukui function
| | 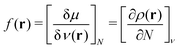 | (1) |
provides a quantitative measure of the change of the chemical potential
μ of a system in response to a local change δ
ν(
r) in the external potential
ν(
r) (due to the presence of a reagent species) for fixed number
N of electrons. The function
f(
r) can also be viewed as the local change of the electron density due to a global change in the number of electrons for fixed external potential. It is useful to consider the Fukui functions from above,
f+(
r), and from below,
f−(
r),
24 that is
| |  | (2) |
which measure the change in the local electron density as the number of electrons changes from
N to
N + d
N or to
N − d
N, respectively. In the present case we are interested in
f−(
r). In practice,
f−(
r) can be computed, by using a finite difference approximation, as the density difference:
25,26| | | f−(r) = ρν,N(r) − ρν,N−1(r), | (3) |
where
ρν,N(
r) and
ρν,N−1(
r) are the ground-state electronic densities of the neutral and cationic molecules in the geometrical configuration of the neutral.
3 Results and discussion
3.1 Size effects in small carbon clusters
The lowest-energy structures of neutral CN and cationic C+N carbon clusters with N = 2–16 calculated by the B3LYP method have been discussed in a previous work22 and here we only summarize the results. Neutral C2–C10 form cumulenic linear structures with nearly equal bond lengths, and C11–C16 exhibit monocyclic-ring structures. For C4, C6 and C8 we found low-lying cyclic isomers with energies differing by less than 0.15 eV from the linear structures. Concerning the cationic clusters, C+2, C+4–C+7 and C+9 are linear, and C+10–C+16 exhibit monocyclic-ring structures. The ground state structure of C+3 is a bent configuration, 0.19 eV more stable than the perfect linear isomer. C+8 has a cyclic ground-state configuration and a low-lying linear isomer nearly degenerate. Finally, C+6 is a slightly non-planar distorted hexagon with practically the same energy as the linear form.
Fig. 1 shows different curves of C–C bond-length values for neutral CN and cationic C+N carbon clusters from N = 2 to 16. The diamonds (blue curve) and triangles (green curve) report the average C–C bond lengths for CN and C+N, respectively. The average in the cyclic clusters is over all C–C bonds, but in the linear clusters the average is over the internal bonds excluding the two C–C bonds at the cluster ends. The circles (black curve) and squares (red curve) correspond to C–C bond lengths at the ends of the linear CN and C+N clusters, respectively. The reason for distinguishing between internal C–C bonds and C–C bonds at the cluster ends in linear clusters is that the internal C atoms have two C neighbors, while the C atoms at the ends of the cluster only have one neighbor. It is worth noticing that all the bond length curves display an irregular and oscillating trend. This effect is more pronounced for the smallest clusters with a linear arrangement.
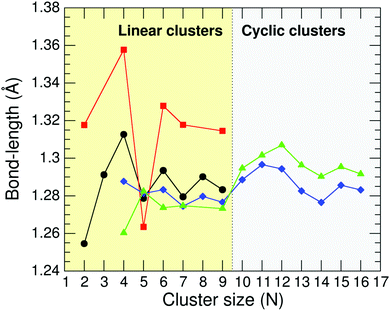 |
| | Fig. 1 C–C bond-lengths (in Å) in neutral CN and cationic C+N carbon clusters from N = 2 to 16. C–C bond-length at the edges of the linear CN clusters (black circles), and C+N clusters (red squares). Average C–C bond-lengths for CN and C+N clusters (blue diamonds and green triangles, respectively). The average in the cyclic clusters is over all C–C bonds. In the linear clusters, the average is over the internal bonds excluding the two C–C bonds at the cluster ends. | |
In addition to the transition from linear to cyclic structures and the oscillations of the bond lengths, these clusters also show a pronounced size dependence of other properties. The cluster stability, measured by the cluster binding energy, has an interesting oscillating behavior as a function of cluster size.22 But the best way to appreciate the variations of the cluster stability is through the stability function. Fig. 2 shows the stability functions Δ2(CN) and Δ2(C+N) of neutral and cationic carbon clusters, respectively. The stability function of the neutral clusters is defined
| | | Δ2(CN) = E(CN+1) + E(CN−1) − 2E(CN), | (4) |
where
E(C
N) represents the total energy of the cluster with
N atoms, and a similar definition applies to the cationic clusters. The functions
Δ2(C
N) and
Δ2(C
+N) measure the stability of the cluster of size
N compared to the averaged energy of the clusters with neighbor sizes,
N + 1 and
N − 1. Clusters more stable than the neighbors are characterized by positive peaks in a plot of the stability function
versus N.
Fig. 2 indeed reveals that
Δ2(C
N) and
Δ2(C
+N) possess a rich structure and noticeable cluster size effects, with pronounced stability peaks for particular cluster sizes. In a previous work
22 we have shown that the details of the succession of high and low values of the stability function compare very well with the local variations of the cluster abundance measured by mass spectrometry in cluster beams produced by pulsed laser vaporization of graphite.
27 It is interesting to notice the energy scale of
Fig. 2, that is, the range of values of
Δ2(C
N) and
Δ2(C
+N). Those values vary between −2 eV and 3 eV.
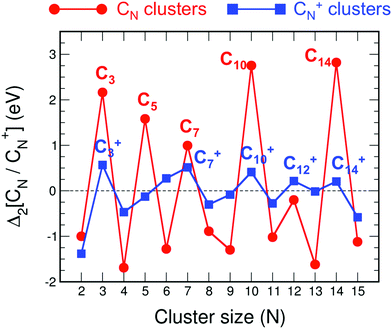 |
| | Fig. 2 Stability functions Δ2(CN) and Δ2(C+N) of neutral (red) and cationic (blue) carbon clusters up to N = 15. | |
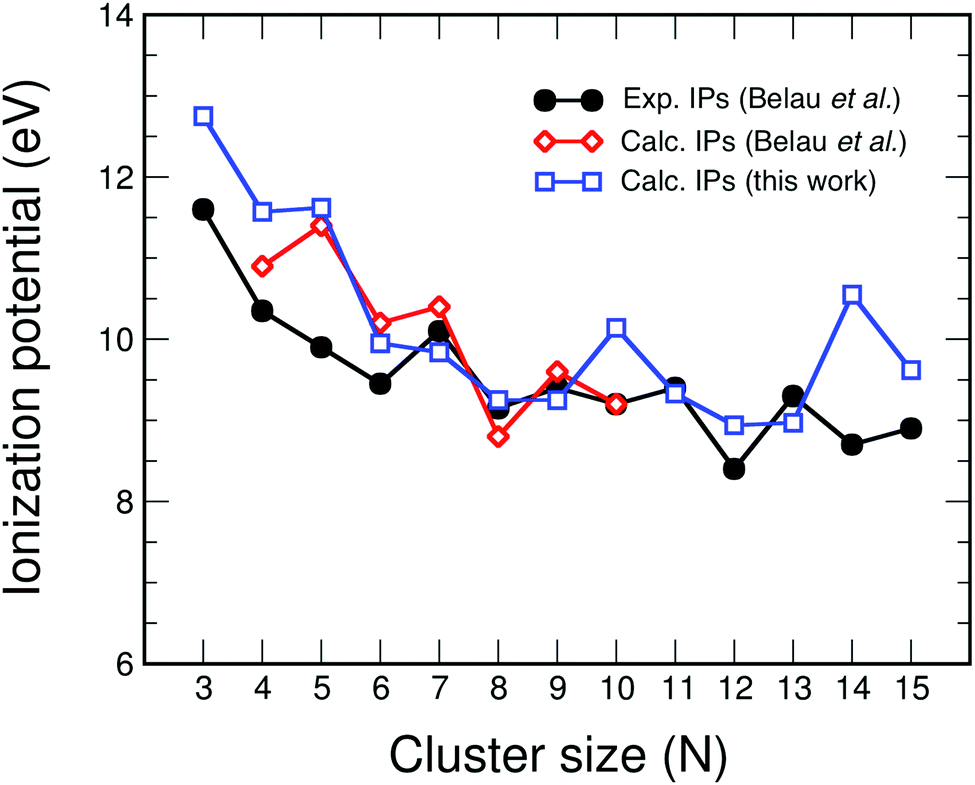
The ionization energy IP of carbon clusters also reveals clear size effects. Fig. 3 shows our calculated ionization energies of the carbon clusters CN with N up to 15 compared to the values measured by photoionization spectroscopy by Belau et al.,27 and to results of highly accurate coupled cluster (CC) calculations, also performed by Belau et al.27 for clusters up to N = 10. We only provide a short discussion of the main features because Belau et al. have presented a detailed and comprehensive analysis of the comparison between the experiments and the CC results. One can notice the smaller values of the experimental IPs compared to the CC and B3LYP calculations up to C6. This difference has been ascribed by Belau et al. to the likely presence of clusters in electronic excited states in their experiments. In fact, charge exchange28,29 and electron impact experiments30 yielded values in better accord with the theoretical results of Fig. 3. The agreement between theory and experiment is quite satisfactory for C7 to C9. Finally, the comparison is less satisfactory for N larger than 9, where again the theoretical IPs are higher than the experimental ones (for C10, C12, C14 and C15) in a size-range where the occurrence on clusters in excited electronic states is less likely. In this size region the IPs from electron impact experiments are even lower, and the trend of alternation of local maxima and minima is shifted with respect to the alternation seen in the photoionization experiments; that is, low IP values in the photoionization experiment correspond to high IP values in the electron impact experiments, and vice versa. In spite of the differences between experiment and theory in Fig. 3, which should deserve a further study, the message we want to extract from this figure, that is relevant for the present work, is that IP varies with the cluster size in a non-smooth way, that is, IP shows pronounced cluster size effects.
 |
| | Fig. 3 Comparison between experimental (black circles)27 and calculated adiabatic ionization energies (in eV) of carbon clusters. Two sets of calculations are included: results from coupled cluster CC calculations (red diamonds),27 and B3LYP results (this work; blue squares). | |
3.2 Quenching of the size effects by hydrogen
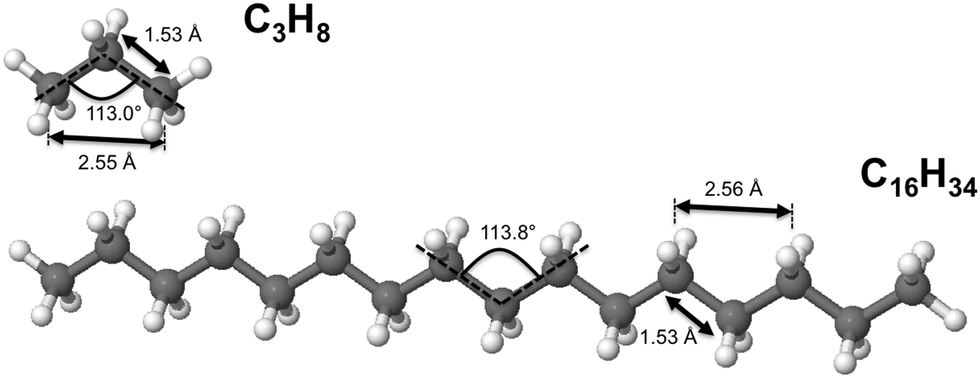
The remarkable size effects observed in the stability, ionization energies and C–C bond lengths of CN and C+N clusters can be quenched by functionalizing the clusters. To investigate this issue we consider the functionalization of the carbon clusters with hydrogen by forming linear alkanes, with composition CNH2N+2, in which all the C–C bonds are single bonds. The C3H8 and C16H34 alkanes are shown in Fig. 4. Neutral and cationic linear alkanes have been studied.
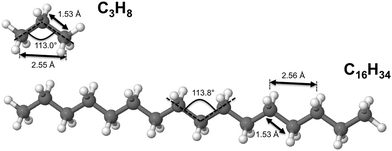 |
| | Fig. 4 Computed gas-phase structure of the C3H8 and C16H34 alkanes. | |
The C–C bond lengths in the neutral alkanes range, for all sizes studied, between 1.529 Å and 1.535 Å and the  angles in the carbon chains range between 113.4° and 113.8°. The variation in the C–C bond lengths, 0.006 Å is negligible in the scale of bond length changes observed in Fig. 1 for pure carbon clusters. This observation puts in evidence the quenching of structural effects by hydrogen functionalization. Interestingly, the quenching in the case of the cationic alkanes is less drastic. Fig. 5 reports C–C bond-lengths and
  angles for the ground state structures of cationic (CNH2N+2)+ alkanes up to N = 25. The squares (red curve) shown in the left panel of Fig. 5 as a function of N represent the average C–C bond lengths, where that average is taken over the all the bonds excluding the two C–C bonds at the alkane ends. The circles (red curve) correspond to the C–C bond lengths at the ends of the alkane. The angles, also separated in two curves, are given in the right panel of Fig. 5. The diamonds (blue curve) represent the
  angles at the end of the alkane structure, and the triangles (green curve) are averages over all the
  angles excluding the angles at the end of the alkane chain. It is noticeable that abrupt changes in the variation of the
  angles with N are quenched starting from N = 5. Beyond N = 5, a monotonic and smooth variation towards a limiting value of the angle is observed. In a similar way, the bond lengths vary monotonically starting from N = 5 (red curve) and N = 7 (black curve). This quenching of size effects contrasts with the non-smooth and non-monotonic behavior displayed by the C–C bond lengths of the pure carbon clusters in Fig. 1. In this respect, one should notice, however, that the cationic alkanes are more resilient than the neutrals.
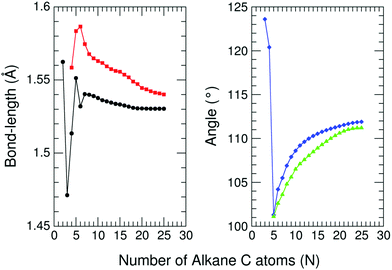 |
| | Fig. 5 C–C bond-lengths (in Å) and  angles (in degrees) for cationic (CNH2N+2)+ alkanes in their ground-state structures as a function of N up to N = 25. Left panel: Squares (red curve) represent the average C–C bond lengths, where that average is taken over the all the bonds excluding the two C–C bonds at the alkane ends; circles (red curve) correspond to the C–C bond lengths at the ends of the alkane. Right panel: Diamonds (blue curve) represent the angles (in degrees) for cationic (CNH2N+2)+ alkanes in their ground-state structures as a function of N up to N = 25. Left panel: Squares (red curve) represent the average C–C bond lengths, where that average is taken over the all the bonds excluding the two C–C bonds at the alkane ends; circles (red curve) correspond to the C–C bond lengths at the ends of the alkane. Right panel: Diamonds (blue curve) represent the  angles at the end of the alkane structure, and the triangles (green curve) are averages over all the angles at the end of the alkane structure, and the triangles (green curve) are averages over all the  angles excluding those at the end of the alkane chain. angles excluding those at the end of the alkane chain. | |
The calculated stability functions of neutral CNH2N+2 and cationic (CNH2N+2)+ alkanes have been plotted as a function of N in Fig. 6. In the case of neutral alkanes the stability function is defined as
| | | Δ2(N) = E(N + 1) + E(N − 1) − 2E(N), | (5) |
where
N indicates the number of carbon atoms in the alkane, and
E(
N) represents the energy of the C
NH
2N+2 alkane. Because the linear alkanes have one CH
3 group at each of the two ends of the chain, the alkane with
N carbon atoms has
N − 2 inner CH
2 groups.
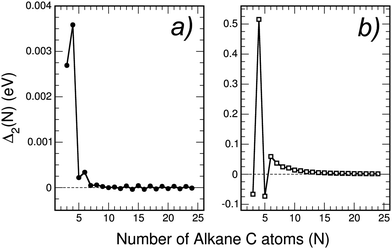 |
| | Fig. 6 Stability function Δ2(N) (in eV) of: (a) neutral alkanes CNH2N+2, and (b) cationic alkanes (CNH2N+2)+ for N = 3–24. Notice that the scale of energies has been enlarged by a factor of ×1000 with respect to Fig. 1 in the case of neutral alkanes, and by a factor of ×10 for cationic alkanes. | |
Using in Fig. 6 an energy scale like that in Fig. 2, the plot of Δ2(N) for neutral alkanes is just a horizontal line indistinguishable from the horizontal axis, that is Δ2(N) = 0 independent of size N. This means that the size effects observed in Fig. 2 for pure neutral carbon clusters have been completely quenched by the functionalization with hydrogen in the linear alkanes. Fig. 6 shows that by enlarging the energy scale in a factor of ×1000, that is, focusing on a meV scale, faint size effects can be appreciated in Δ2(N), which oscillates with N. The oscillations are extremely weak, and only noticeable for N lower than 7. In the case of cationic alkanes the energy scale has to be enlarged by only a factor of ×10 in order to appreciate faint size effects. Again, those faint size effects are restricted to N lower than 7, with stability maxima appearing at N = 4 and N = 6 (also in the neutral case), and the oscillations have totally disappeared for N larger than 7.
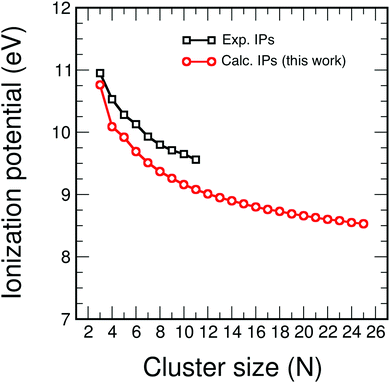
The calculated ionization potentials
| | | IP(N) = E(CNH2N+2)+ − E(CNH2N+2) | (6) |
of linear alkanes are shown in
Fig. 7. Experimental ionization potentials,
31 available for
N = 3–11, are also included, and the comparison of calculated and experimental IPs is satisfactory. The calculated IPs are slightly smaller than the experimental IPs, with differences quite constant (except for C
3H
8), and in all cases below 5%. Comparison with the calculations of other authors
32 is also satisfactory. The ionization potential of the linear alkanes decreases with
N but the decrease is smooth, and in contrast to the behavior of IP for the pure carbon clusters (see
Fig. 3), abrupt size effects have been completely quenched in the linear alkanes by the effect of hydrogen. The values of IP have not yet reached a saturation value for the largest alkanes studied here, C
25H
52. The calculated electron affinities of the alkanes are negative; that is, the linear alkane anions are not stable against electron detachment. This is in contrast to pure carbon anions.
33
 |
| | Fig. 7 Calculated ionization potentials (in eV) of CNH2N+2 alkenes (red circles), compared to available experimental ionization potentials (black squares).31 | |
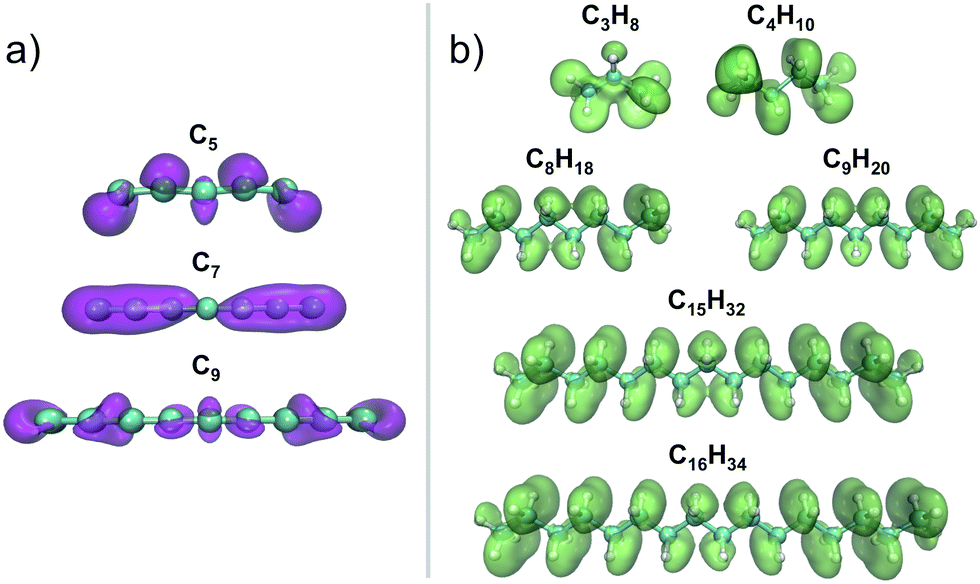
The large ionization potentials and negative electron affinities of the alkanes are consistent with the well-known low reactivity of these molecules with ionic and other polar substances. The chemical reactivity is often studied by using the Fukui functions.23 As noticed above in Section 2, in a density functional framework, a good approximation to the Fukui function measuring the local reactivity of a molecule towards (electron-poor) electrophiles is given by the electron density difference between the neutral and the cationic molecules.25,26 For the case of carbon clusters and alkanes, respectively,
| |  | (7) |
Regions where this function is large are especially reactive towards electrophiles; that is, electrophiles withdraw electronic charge preferentially from those regions. The electron density difference Δ
ρ(
r) reveals in
Fig. 8 that the Fukui function

shows substantial delocalization through the alkane chains. This delocalization is an effect common to all alkane sizes, and the spatial distribution of

is similar in all of them. In contrast, the Fukui function of carbon clusters,

, presents differences when one compares different cluster sizes, as illustrated in the specific cases of C
5, C
7, and C
9 in
Fig. 8.
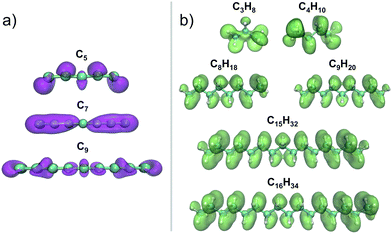 |
| | Fig. 8 Surfaces with a constant value (equal to 0.02 e Å−3) of the Fukui functions  and and  for several carbon clusters and alkanes. The spatial distribution of the Fukui functions is measured by the difference between the electron densities of the corresponding neutral and cationic species. The regions where f−(r) is localized are regions prone to release electronic charge when the molecule reacts with electrophiles. for several carbon clusters and alkanes. The spatial distribution of the Fukui functions is measured by the difference between the electron densities of the corresponding neutral and cationic species. The regions where f−(r) is localized are regions prone to release electronic charge when the molecule reacts with electrophiles. | |
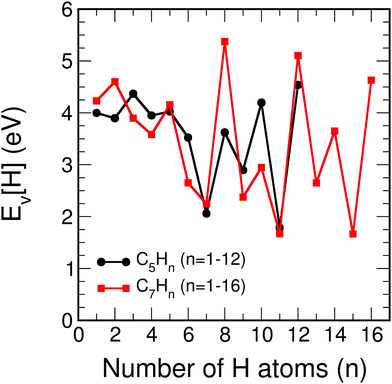
3.3 Trends in the properties of each CNHn family as n increases. The road to saturation
Although our main purpose, developed in the previous sections, consists in studying how the addition of hydrogen affects the size effects in CN clusters, that is, the variation of the properties as the number of C atoms in the cluster increases, a complementary but different question that we have also investigated is how the properties of CN clusters of fixed N change as hydrogen is added until full saturation is reached in the alkanes. For this purpose, the two representative families C5Hn (n = 1–12) and C7Hn (n = 1–16) have been selected. For each cluster C5Hn or C7Hn an extensive set of isomers have been considered and the lowest energy structure has been determined in each case. Fig. 9 shows the energies required to remove a single H atom from the CNHn clusters (n = 5, 7), which we call hydrogen evaporation energy for consistency with the notation used in other sections:| | | Ev(CNHn) = E(CNHn−1) + E(H) − E(CNHn), | (8) |
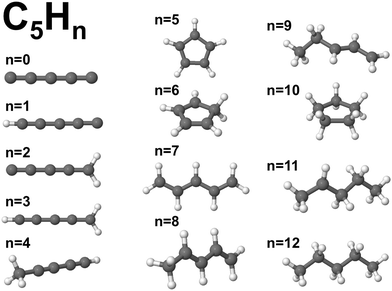
where the energies on the right hand side of the equation are the energies of the corresponding molecules and the energy of an isolated H atom, respectively. In the C5Hn family, an even–odd effect appears in the evaporation energy for molecules with n between 6 and 12, where molecules with even n have larger evaporation energies than molecules with odd n. Those differences arise from the details of the chemical bonding in the different molecules. Those details can be appreciated with the help of Fig. 10, which shows the calculated lowest energy structures of C5Hn with n = 1–12.
 |
| | Fig. 9 Energy to remove an H atom, Ev (in eV), as a function of the number of hydrogen atoms, n, from the C5Hn (n = 1–12) and C7Hn (n = 1–16) molecules. | |
 |
| | Fig. 10 Calculated ground state structures of C5Hn (n = 0–12) molecules. | |
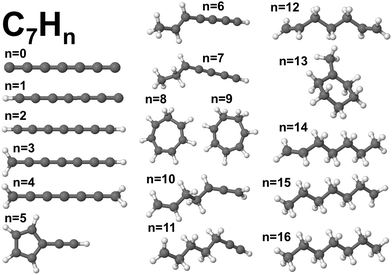
C5H12 is a non-cyclic saturated hydrocarbon, in which all the C–C bonds are single bonds. The molecule is very stable and consequently the energy to remove a single H atom is large, Ev(C5H12) = 4.54 eV. After removing one H atom, the molecule obtained, C5H11, contains one unsaturated C orbital, which indicates that C5H11 is highly reactive. In fact, this molecule is only observed in extreme conditions.34 The low stability of this molecule is reflected in a low value of the energy to remove an H atom, Ev = 1.79 eV. C5H10 is a symmetric cyclic molecule with saturated bonds, which makes the molecule quite stable, with large Ev = 4.20 eV. Loss of an H atom leads to C5H9, with an unsaturated C orbital. This molecule is, then, reactive and removing an H atom only costs an energy Ev = 2.90 eV. C5H8, with all the C bonds saturated, has a larger evaporation energy, Ev = 3.62 eV. C5H7 has a C atom with a non-saturated bond, and its higher reactivity leads to a low Ev = 2.06 eV. C5H6 has all C bonds saturated, and Ev increases up to a value of 3.52 eV. In summary, the even–odd oscillations in the magnitude of Ev for C5Hn in the range n = 6–12 are correlated with the presence or absence of unsaturated carbon orbitals. Local maxima of Ev occur for molecules with all bonds saturated (n = 6, 8, 10, 12), while the local minima correspond to molecules with an unsaturated C orbital (n = 7, 9, 11). The behavior is different in the region between n = 1 and n = 5, where all the evaporation energies are larger than 3.9 eV, in spite of the fact that all these molecules, except C5H4, have unsaturated C orbitals and are reactive. A similar trend in the hydrogen evaporation energies occurs in the C7Hn family, whose ground state structures are shown in Fig. 11. The even–odd oscillation shown in Fig. 9, that is, the correlation between local maxima of Ev and full bond saturation applies between n = 6 and n = 16, and Ev is again relatively large between n = 1 and n = 5. The trend of Ev as the number of H atoms in the molecule increases, starting with CNH and ending with the fully saturated molecule CNH2N+2, is non smooth. However, as shown in the previous sections, after the C clusters are fully saturated with hydrogen, that is, when saturated alkanes are formed, the properties vary very smoothly with the alkane size, that is, with the number of CH2 groups added.
 |
| | Fig. 11 Calculated ground state structures of C7Hn (n = 1–16) molecules. | |
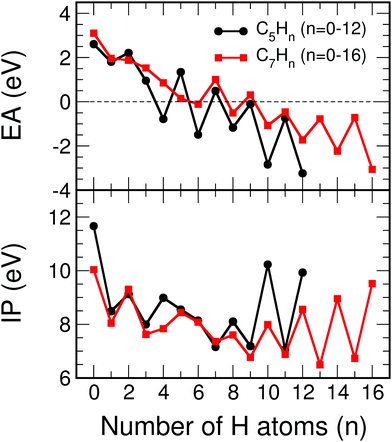
The ionization potentials and the electron affinities of C5Hn (n = 1–12) and C7Hn (n = 1–16) have been plotted in Fig. 12. Similar to the behavior of Ev discussed above, IP shows large amplitude even–odd oscillation in each family between n = 6 and n = 2N: molecules with even values of n have larger ionization potentials than molecules with odd values of n. As mentioned above, the molecules with even values of n have all carbon orbitals saturated, while molecules with odd values of n have one unsaturated bond. The even–odd oscillation is also quite convincing for n smaller than 6, with some misfit in the transition between the two regions. A complementary way of interpreting the even–odd oscillations in IP is in terms of spin pairing, since molecules with even n have even number of electrons (4N + n, excluding the core electrons of the carbon atoms). Even–odd oscillations of IP are also well known in alkali metal clusters.3,35 In spite of the sizable oscillations of IP shown in Fig. 12, two observations can be made. The values of IP for the molecules at the end of each family, IP(C5H12) = 9.93 eV and IP(C7H16) = 9.52 eV, are larger than the IPs of other members of the family, with the only exception of C5H10 in the C5Hn family. Second, the values of IP(C5H12) and IP(C7H16) are very close, which explains the trend observed in Fig. 7, that is, the quenching of size effects discussed in the first part of this work.
 |
| | Fig. 12 Electron affinity, EA (in eV), and ionization potential, IP (in eV), as a function of the number of hydrogen atoms, n, of C5Hn (n = 0–12) and C7Hn (n = 0–16) molecules (see structures in Fig. 10 and 11). | |
The electron affinities also show even–odd oscillations, between n = 3 and n = 12 in the C5Hn series, and between n = 5 and n = 16 in the C7Hn series. The oscillations confirm the spin paring, because the maxima of EA occur for clusters with odd number of electrons, where capture of one electron leads to an even number. However, the most important feature is that the electron affinity changes sign in the middle of each family. That is, EA becomes negative, which indicates that those molecular anions are not stable against electron detachment. In spite of this fact it is also worth to notice that the electron affinities of C5H12 and C7H16 are the most negative ones in their respective families, and that their values are nearly the same, supporting again the quenching of size effects in the saturated alkanes.
4 Summary and conclusions
The most fascinating characteristic of small atomic clusters is that the values of most of their properties do not scale smoothly with the cluster size N. Instead, the values of those properties can vary substantially in this regime in which every atom counts. This has been illustrated here by analyzing several properties of neutral CN and cationic C+N carbon clusters. The cluster structure changes from linear to cyclic at about C10. The C–C bond lengths display an oscillating and irregular variation with the cluster size N. The cluster stability (related to the abundance measured in experiments of cluster formation in the gas phase) shows oscillations between highly stable and less stable clusters with increasing N. Also the variation of the ionization energy with N deviates from a smooth behavior. Finally, the spatial distribution of the Fukui functions f−(r) (which reveal the regions more prone to realease electronic charge when the clusters react with electrophiles) shows differences between carbon clusters of different sizes. However, clusters can lose the size dependence of their properties by interaction with other chemical species. We have analyzed the case of carbon clusters fully saturated with hydrogen to form linear alkanes, CNH2N+2, with sizes up to N = 25. In all cases, the lowest energy structures are linear chains, the variations of C–C bond lengths and  angles are minor and smooth, the stability functions show practically no structure as a function of alkane size, the ionization energies show no relevant features and decrease smoothly with alkane size, and the spatial distribution of the Fukui functions is analogous in all the linear alkanes. In summary, the interaction of carbon clusters with hydrogen to form alkanes quenches all the size-dependent features originally owned by the carbon clusters. The road to arrive at the quenching of the size effects is intricate. In each CNHn family of fixed N, the values of the properties of the molecules like the ionization potential, the electron affinity, and others show sizable oscillations as the number n of hydrogen atoms grows from the pure carbon cluster, where n = 0, to the alkane, where n = 2N + 2.
Conflicts of interest
The authors declare no competing financial interests.
Acknowledgements
We acknowledge funding from the Spanish MINECO (Grants MAT2017-85089-C2-1-R and RYC-2015-17730), Comunidad de Madrid (FotoArt-CM Project P2018/NMT-4367) through the Program of R&D activities between research groups in Technologies 2018, co-financed by European Structural Funds, Junta de Castilla y León (Grant VA021G18), University of Valladolid (GIR Grupo de Física de Nanoestructuras), and the EU via the ERC-Synergy Program (Grant ERC-2013-SYG-610256 Nanocosmos) and EU Horizon 2020 Research and Innovation program (Grant 785219 – Graphene Flagship Core2–). We also thank the computing resources from CTI-CSIC.
Notes and references
- E. Oger, N. Crawford, R. Kelting, P. Weis, M. Kappes and R. Ahlrichs, Angew. Chem., Int. Ed., 2007, 46, 8503–8506 CrossRef CAS PubMed.
- D. Emin, Phys. Today, 1987, 40, 56–62 CrossRef.
- W. A. Saunders, K. Clemenger, W. A. de Heer and W. D. Knight, Phys. Rev. B: Condens. Matter Mater. Phys., 1985, 32, 1366–1368 CrossRef CAS.
- W. D. Knight, K. Clemenger, W. A. de Heer, W. A. Saunders, M. Y. Chou and M. L. Cohen, Phys. Rev. Lett., 1984, 52, 2141–2143 CrossRef CAS.
- C. Baladrón and J. A. Alonso, Phys. B, 1988, 154, 73–81 CrossRef.
- Y. Dai, T. J. Gorey, S. L. Anderson, S. Lee, S. Lee, S. Seifert and R. E. Winans, J. Phys. Chem. C, 2017, 121, 361–374 CrossRef CAS.
- B. von Issendorff and O. Cheshnovsky, Annu. Rev. Phys. Chem., 2005, 56, 549–580 CrossRef CAS PubMed.
- J. Pérez-Juste, M. A. Correa-Duarte and L. M. Liz-Marzán, Appl. Surf. Sci., 2004, 226, 137–143 CrossRef.
- S. E. Apsel, J. W. Emmert, J. Deng and L. A. Bloomfield, Phys. Rev. Lett., 1996, 76, 1441–1444 CrossRef CAS PubMed.
- J. Bansmann, V. Senz, R. P. Methling, R. Röhlsberger and K. H. Meiwes-Broer, Mater. Sci. Eng., C, 2002, 19, 305–310 CrossRef.
- T. Hayashi, K. Tanaka and M. Haruta, J. Catal., 1998, 178, 566–575 CrossRef CAS.
-
Nanocatalysis, ed. U. Heiz and U. Landman, Springer, 2007 Search PubMed.
- L. Li, A. H. Larsen, N. A. Romero, V. A. Morozov, C. Glinsvad, F. Abild-Pedersen, J. Greeley, K. W. Jacobsen and J. K. Nørskov, J. Phys. Chem. Lett., 2013, 4, 222–226 CrossRef CAS PubMed.
- F. Calle-Vallejo, J. I. Martnez, J. M. Garca-Lastra, P. Sautet and D. Loffreda, Angew. Chem., Int. Ed., 2014, 53, 8316–8319 CrossRef CAS PubMed.
- T. P. Martin, Phys. Rep., 1996, 273, 199–241 CrossRef CAS.
-
J. A. Alonso, Structure and Properties of Atomic Nanoclusters, Imperial College Press, London, 2nd edn, 2012 Search PubMed.
- A. Artaud, L. Magaud, K. Ratter, B. Gilles, V. Guisset, P. David, J. I. Martnez, J. A. Martn-Gago, C. Chapelier and J. Coraux, Nano Lett., 2018, 18, 4812–4820 CrossRef CAS PubMed.
-
M. J. Frisch, G. W. Trucks, H. B. Schlegel, G. E. Scuseria, M. A. Robb, J. R. Cheeseman, G. Scalmani, V. Barone, B. Mennucci, G. A. Petersson, H. Nakatsuji, M. Caricato, X. Li, H. P. Hratchian, A. F. Izmaylov, J. Bloino, G. Zheng, J. L. Sonnenberg, M. Hada, M. Ehara, K. Toyota, R. Fukuda, J. Hasegawa, M. Ishida, T. Nakajima, Y. Honda, O. Kitao, H. Nakai, T. Vreven, J. A. Montgomery, Jr., J. E. Peralta, F. Ogliaro, M. Bearpark, J. J. Heyd, E. Brothers, K. N. Kudin, V. N. Staroverov, R. Kobayashi, J. Normand, K. Raghavachari, A. Rendell, J. C. Burant, S. S. Iyengar, J. Tomasi, M. Cossi, N. Rega, J. M. Millam, M. Klene, J. E. Knox, J. B. Cross, V. Bakken, C. Adamo, J. Jaramillo, R. Gomperts, R. E. Stratmann, O. Yazyev, A. J. Austin, R. Cammi, C. Pomelli, J. W. Ochterski, R. L. Martin, K. Morokuma, V. G. Zakrzewski, G. A. Voth, P. Salvador, J. J. Dannenberg, S. Dapprich, A. D. Daniels, Ã. Farkas, J. B. Foresman, J. V. Ortiz, J. Cioslowski and D. J. Fox, Gaussian-09 Revision E.01, Gaussian Inc., Wallingford CT, 2009 Search PubMed.
- A. D. Becke, J. Chem. Phys., 1993, 98, 5648–5652 CrossRef CAS.
- P. J. Stephens, F. J. Devlin, C. F. Chabalowski and M. J. Frisch, J. Phys. Chem., 1994, 98, 11623–11627 CrossRef CAS.
- T. H. Dunning, J. Chem. Phys., 1989, 90, 1007–1023 CrossRef CAS.
- J. I. Martnez and J. A. Alonso, Phys. Chem. Chem. Phys., 2018, 20, 27368–27374 RSC.
- K. Fukui, Science, 1982, 218, 747–754 CrossRef CAS PubMed.
- J. I. Martnez, M. J. López and J. A. Alonso, J. Chem. Phys., 2005, 123, 074303 CrossRef PubMed.
- P. W. Ayers and R. G. Parr, J. Am. Chem. Soc., 2000, 122, 2010–2018 CrossRef CAS.
- P. W. Ayers, R. C. Morrison and R. K. Roy, J. Chem. Phys., 2002, 116, 8731–8744 CrossRef CAS.
- L. Belau, S. E. Wheeler, B. W. Ticknor, M. Ahmed, S. R. Leone, W. D. Allen, H. F. Schaefer and M. A. Duncan, J. Am. Chem. Soc., 2007, 129, 10229–10243 CrossRef CAS PubMed.
- S. B. H. Bach and J. R. Eyler, J. Chem. Phys., 1990, 92, 358–363 CrossRef CAS.
- R. Ramanathan, J. A. Zimmerman and J. R. Eyler, J. Chem. Phys., 1993, 98, 7838–7845 CrossRef CAS.
- J. Benedikt, S. Agarwal, D. Eijkman, W. Vandamme, M. Creatore and M. C. M. van de Sanden, J. Vac. Sci. Technol., A, 2005, 23, 1400–1412 CrossRef CAS.
-
CRC Handbook of Chemistry and Physics, ed. D. R. Lide, CRC Press, Boca Raton, FL., 81st edn, 2000 Search PubMed.
- C. Cao and H. Yuan, J. Chem. Inf. Comput. Sci., 2002, 42, 667–672 CrossRef CAS PubMed.
- N. G. Gotts, G. von Helden and M. T. Bowers, Int. J. Mass Spectrom. Ion Processes, 1995, 149–150, 217–229 CrossRef.
- J. Pacansky and A. Gutierrez, J. Phys. Chem., 1983, 87, 3074–3079 CrossRef CAS.
- W. A. de Heer, Rev. Mod. Phys., 1993, 65, 611–676 CrossRef CAS.
Footnote |
| † The authors dedicate this work to Professor Pablo Espinet on the occasion of his 70th birthday. |
|
| This journal is © the Owner Societies 2019 |
Click here to see how this site uses Cookies. View our privacy policy here. 
 Open Access Article
 This Open Access Article is licensed under a
  *a and
Julio A.
Alonso
*a and
Julio A.
Alonso
 angles with alkane size are very minor and smooth, the stability function shows practically no structure as a function of the alkane size, the ionization energies just decrease smoothly with alkane size, and the spatial distribution of the reactivity index is analogous and highly delocalized in all the alkanes. In summary, the interaction of carbon clusters with hydrogen to form alkanes quenches all the size-dependent features that the carbon clusters originally owned. The arrival at the quenching of the size effects follows an involved path. In each CNHn family with fixed N, the values of the properties of the molecules like the ionization potential, the electron affinity, and others show sizable oscillations as the number of hydrogen atoms grows from the pure carbon cluster to the alkane.


 angles in the carbon chains range between 113.4° and 113.8°. The variation in the C–C bond lengths, 0.006 Å is negligible in the scale of bond length changes observed in Fig. 1 for pure carbon clusters. This observation puts in evidence the quenching of structural effects by hydrogen functionalization. Interestingly, the quenching in the case of the cationic alkanes is less drastic. Fig. 5 reports C–C bond-lengths and
  angles for the ground state structures of cationic (CNH2N+2)+ alkanes up to N = 25. The squares (red curve) shown in the left panel of Fig. 5 as a function of N represent the average C–C bond lengths, where that average is taken over the all the bonds excluding the two C–C bonds at the alkane ends. The circles (red curve) correspond to the C–C bond lengths at the ends of the alkane. The angles, also separated in two curves, are given in the right panel of Fig. 5. The diamonds (blue curve) represent the
  angles at the end of the alkane structure, and the triangles (green curve) are averages over all the
  angles excluding the angles at the end of the alkane chain. It is noticeable that abrupt changes in the variation of the
  angles with N are quenched starting from N = 5. Beyond N = 5, a monotonic and smooth variation towards a limiting value of the angle is observed. In a similar way, the bond lengths vary monotonically starting from N = 5 (red curve) and N = 7 (black curve). This quenching of size effects contrasts with the non-smooth and non-monotonic behavior displayed by the C–C bond lengths of the pure carbon clusters in Fig. 1. In this respect, one should notice, however, that the cationic alkanes are more resilient than the neutrals.
 angles (in degrees) for cationic (CNH2N+2)+ alkanes in their ground-state structures as a function of N up to N = 25. Left panel: Squares (red curve) represent the average C–C bond lengths, where that average is taken over the all the bonds excluding the two C–C bonds at the alkane ends; circles (red curve) correspond to the C–C bond lengths at the ends of the alkane. Right panel: Diamonds (blue curve) represent the
  angles at the end of the alkane structure, and the triangles (green curve) are averages over all the
  angles excluding those at the end of the alkane chain.
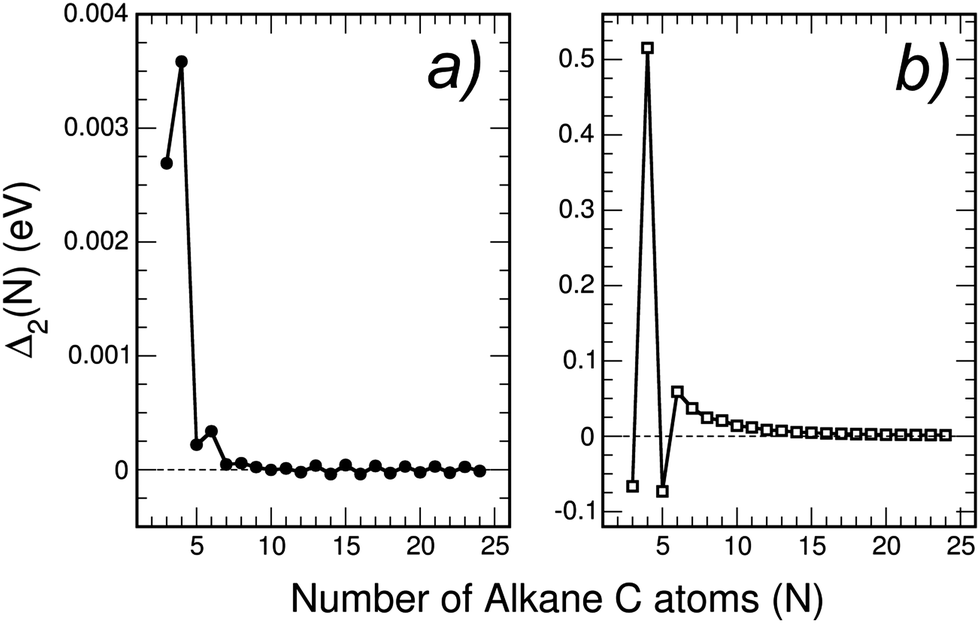

 shows substantial delocalization through the alkane chains. This delocalization is an effect common to all alkane sizes, and the spatial distribution of
  is similar in all of them. In contrast, the Fukui function of carbon clusters,
  , presents differences when one compares different cluster sizes, as illustrated in the specific cases of C5, C7, and C9 in Fig. 8.
 and
and  for several carbon clusters and alkanes. The spatial distribution of the Fukui functions is measured by the difference between the electron densities of the corresponding neutral and cationic species. The regions where f−(r) is localized are regions prone to release electronic charge when the molecule reacts with electrophiles.


 angles are minor and smooth, the stability functions show practically no structure as a function of alkane size, the ionization energies show no relevant features and decrease smoothly with alkane size, and the spatial distribution of the Fukui functions is analogous in all the linear alkanes. In summary, the interaction of carbon clusters with hydrogen to form alkanes quenches all the size-dependent features originally owned by the carbon clusters. The road to arrive at the quenching of the size effects is intricate. In each CNHn family of fixed N, the values of the properties of the molecules like the ionization potential, the electron affinity, and others show sizable oscillations as the number n of hydrogen atoms grows from the pure carbon cluster, where n = 0, to the alkane, where n = 2N + 2.