
 Open Access Article
 This Open Access Article is licensed under a
 Creative Commons Attribution 3.0 Unported Licence
Phenylacetylene as a gas phase sliding balance for solvating alcohols†
Ginny
Karir‡
 ,
Nils O. B.
Lüttschwager
and
Martin A.
Suhm
*
,
Nils O. B.
Lüttschwager
and
Martin A.
Suhm
*
Institut für Physikalische Chemie, Georg-August-Universität Göttingen, Tammannstraße 6, 37077 Göttingen, Germany. E-mail: msuhm@gwdg.de
First published on 26th March 2019
Abstract
Phenylacetylene offers two similarly attractive π binding sites to OH containing solvent molecules, the phenyl ring and the acetylenic triple bond. By systematically varying the solvent molecule and by methylating aromatic or acetylenic CH groups, the docking preference can be controlled. It ranges from almost exclusive acetylene docking to predominant phenyl docking, depending on how electron density is deposited into the conjugated system and how large the London dispersion interaction is. FTIR spectroscopy of supersonic jet expansions is used to observe the competitive docking preferences in phenylacetylene and some of its methylated derivatives. A new data evaluation procedure that estimates band strength uncertainties based on a Monte Carlo approach is introduced. We test how well two density functionals (B3LYP-D3 and M06-2X) in combination with a def2-TZVP basis set are able to describe the docking switch. B3LYP-D3 is slightly biased towards acetylenic hydrogen bond docking and M06-2X is strongly biased towards phenyl hydrogen bond docking. More accurate theoretical predictions are invited and some previous experimental assignments are questioned.
1. Introduction
Phenylacetylene has a long research tradition as a multivalent binding partner towards molecules such as water, alcohols, diethylether, formic acid, ammonia, trifluoroethanol, methylamine and others, including itself.1–15 It has been termed as “chameleon” because of its versatile binding behaviour with different molecules.4 It offers the acetylenic CH group (![[triple bond, length as m-dash]](https://www.rsc.org/images/entities/char_e002.gif) CH) as a hydrogen bond donor and the π systems of the acetylene and benzene moieties as hydrogen bond acceptors. All three docking sites have been postulated and observed experimentally, depending on the solvent molecule and the environment.4,13,16–18 Matrix isolation is able to stabilize metastable docking sites as observed for water,12 methanol,13 formic acid14 and HCl,16 where higher energy structures were also detected along with the global minima, whereas the low temperature supersonic jet studies (IR/UV double resonance and microwave experiments) so far have only revealed a single π binding site for each binding partner (e.g. acetylenic π and phenyl π for water and H2S, respectively).2,4,15,18 This indicates that the interconversion barriers between the π docking sites are easily surmountable in the gas phase even under rapid cooling in supersonic jet expansions, such that already relatively low energy differences can act as a driving force for conformational switches. The trapping of metastable conformations appears to be difficult in the low temperature gas phase. This makes jet spectroscopy of phenylacetylenes an ideal benchmarking tool19,20 to investigate which quantum chemical methods are able to capture the subtle interplay of non-covalent interactions for this class of compounds in a quantitative way. N2 and Ar matrix isolation studies on phenylacetylene are less useful in benchmarking quantum chemical methods as these matrices perturb weakly bound complexes and may distort intrinsic binding preferences. The complex of phenylacetylene with water stands out because its acetylenic preference has been confirmed by MW spectroscopy.15 For others, only a single gas phase UV/IR study is currently available.4
CH) as a hydrogen bond donor and the π systems of the acetylene and benzene moieties as hydrogen bond acceptors. All three docking sites have been postulated and observed experimentally, depending on the solvent molecule and the environment.4,13,16–18 Matrix isolation is able to stabilize metastable docking sites as observed for water,12 methanol,13 formic acid14 and HCl,16 where higher energy structures were also detected along with the global minima, whereas the low temperature supersonic jet studies (IR/UV double resonance and microwave experiments) so far have only revealed a single π binding site for each binding partner (e.g. acetylenic π and phenyl π for water and H2S, respectively).2,4,15,18 This indicates that the interconversion barriers between the π docking sites are easily surmountable in the gas phase even under rapid cooling in supersonic jet expansions, such that already relatively low energy differences can act as a driving force for conformational switches. The trapping of metastable conformations appears to be difficult in the low temperature gas phase. This makes jet spectroscopy of phenylacetylenes an ideal benchmarking tool19,20 to investigate which quantum chemical methods are able to capture the subtle interplay of non-covalent interactions for this class of compounds in a quantitative way. N2 and Ar matrix isolation studies on phenylacetylene are less useful in benchmarking quantum chemical methods as these matrices perturb weakly bound complexes and may distort intrinsic binding preferences. The complex of phenylacetylene with water stands out because its acetylenic preference has been confirmed by MW spectroscopy.15 For others, only a single gas phase UV/IR study is currently available.4
Here, we apply the intermolecular energy balance concept21–23 to phenylacetylene and its meta-methylated derivative. Several examples of intermolecular balances have been described in a recent review.21 In one of the experiments, docking of methanol to diphenyl ether was studied. Diphenyl ether offers two hydrogen bonding sites to methanol. The π cloud of the phenyl ring can be an accepting site offering the possibility of OH⋯π interaction, while alternatively, the ether oxygen can be the site where methanol can form an OH⋯O hydrogen bond, establishing the two states of the balance.24 The competition between these two sites of diphenylether–methanol complexes can essentially be tipped to either side by chemical substitution on the ether or the alcohol.22,25,26 Aromatic ring methylation has been used before to tip the balance in anisole microsolvation experiments.26 While we have included the case of water and ethanol solvation, the main focus of this work is on methanol and tert-butyl alcohol, which differ significantly in their secondary dispersion interaction. Although phenylacetylene offers three docking sites, like the structurally somewhat related phenyl vinyl ether,22 only two are competitive towards alcohols and water. Both involve phenylacetylene as a hydrogen bond acceptor, either via its acetylenic (Ac) or its phenyl (Ph) π cloud. Fig. 1 (which contains two exemplary structures Ac, Ph) shows the different binding motifs of an alcohol R–OH to a phenylacetylene derivative. The third docking site in which phenylacetylene acts as a proton donor was not observed experimentally in the earlier UV/IR supersonic expansion study, being higher in energy as compared to the former two docking sites.1
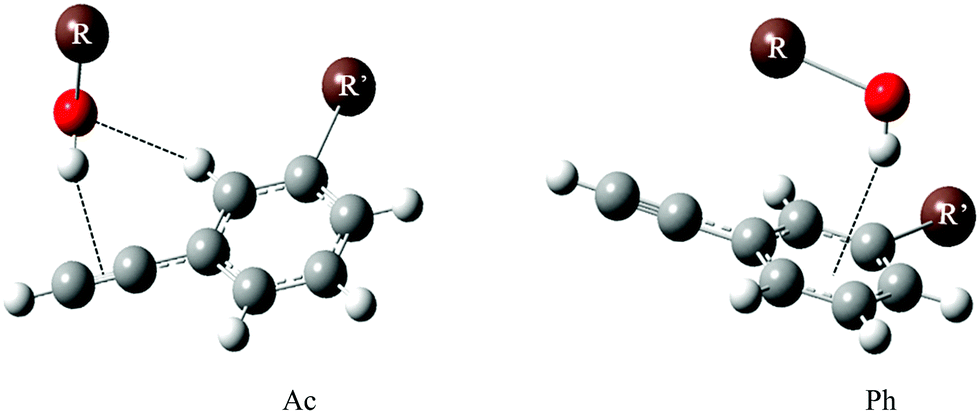 | ||
| Fig. 1 Acetylenic (Ac) and phenyl (Ph) docking of an alcohol R–OH (R = H, CH3, C2H5, C4H9) to the sliding intermolecular balance offered by R′-substituted phenylacetylene (R′ = H/CH3). | ||
In this FTIR study, we determine the docking site of the alcohol based on its observed OH stretching fundamental downshift relative to the alcohol monomer. This requires a quantum chemical method which is able to predict at least semi-quantitatively the band position of such complexes. If two isomer bands are observed, the same quantum chemical method is used to predict the IR band strength ratio for the docking sites, thus allowing for a semi-empirical quantification of the abundance ratio of phenyl-bound (Ph) to acetylene-bound (Ac) complexes. If only one isomer is observed, an upper threshold for the abundance of the missing isomer is estimated based on the same computed intensity data and the uncertainty of the band integral of the observed band. The B3LYP-D3/def2-TZVP method has been shown to perform reasonably well when investigating other OH⋯π and CH⋯O interactions.21,27 Although it has been experimentally demonstrated to overestimate the total interaction energy in similar van der Waals complexes,28 there are reasons to believe that much of this absolute overestimation cancels when looking at the energy difference between two similar docking sites. Once the assignment is established, a range of quantum chemical methods can be tested with respect to their ability to describe the correct energy order of the observed isomers.22 Here, we focus on the M06-2X functional and use the same basis set. It is imperative to include zero point vibrational energy (ZPVE) correction in this analysis, as the different binding sites differ in shallowness. The smaller these corrections for the energy difference between the competing docking sites are in the harmonic approximation, the more likely it is that anharmonicity does not distort the picture, as most of the modes in the two isomers are more or less identical and thus their anharmonicity largely cancels. On the other hand, ZPVE corrections can also be turned into an assignment aid. The larger the harmonic ZPVE corrections are, the more likely it is that deuteration favours one isomer over the other.21 ZPVE destabilization is expected to be more pronounced in the Ac isomer, which captures the alcohol in a more or less in-plane C–H⋯O–H⋯π arrangement, whereas the Ph isomer allows for some roaming of the OH group above the aromatic ring plane with reduced restoring forces. Deuteration is thus expected to increase the Ac docking isomer abundance at the expense of Ph docking.
In this work we show that phenylacetylene is an appropriate substrate for intermolecular balance experiments that measure the performance of quantum chemical calculations of hydrocarbon solvation. We start by testing the B3LYP-D3/def2-TZVP method for a number of phenylacetylene-donor molecule complexes in terms of downshifts and energy rankings, including also O-deuterated donors to secure the assignment. We show that analogous M06-2X predictions are in most cases in disagreement with experimental observation, with a systematic bias of about 1 kJ mol−1 in favour of phenyl docking. We comment on previous gas phase assignments based on UV/IR spectroscopy and different quantum chemical methods,5 which differ in some of the assignments and OH stretching wavenumbers.
2. Experimental and computational details
The spectroscopic method used has been discussed elsewhere29,30 also in relation to other techniques. Here, we give only a brief description: a highly He-diluted donor/acceptor gas mixture is introduced into a 67 L Teflon-coated reservoir and expanded through a long pulsed (600 × 0.2) mm2 slit nozzle. The expansion is probed by synchronized FTIR (Bruker IFS 66v/S) scans in the OH/CH/OD stretching region. Based on monomer rotational contours, effective rotational temperatures of 10–20 K can be estimated. This is warmer than in skimmed molecular beams and can help in equilibrating between different conformations. A calcium fluoride beam splitter, lenses, and windows were used in combination with a 150 W tungsten filament and an optical filter (4200–2450 cm−1) to maximize the signal-to-noise ratio in the OH stretching range of the vibrational spectra. The FTIR spectrometer was equipped with a liquid nitrogen cooled 3 mm2 InSb detector, and a spectral resolution of 2 cm−1 was used. Sufficiently low background pressure during the expansion was ensured by a 23 m3 buffer volume, evacuated by a series of rotary pumps pumping at a speed of up to 2500 m3 h−1 during a 25 s delay between subsequent pulses. This provides linear IR spectra of all species present in the expansion.The compounds are monitored simultaneously via their OH/OD and CH stretching bands. By concentration variation, mixed dimers can be identified reliably and trimer impurities can be minimized. The FTIR method is not conformationally selective, but also does not rely on a well-behaved UV chromophore. Therefore, the relative abundance of two isomers in the absence of spectral overlap can be estimated without the risk of overlooking any IR-active ingredient in the expansion. To ensure the absence of larger clusters, the expansions are prepared at high dilution, compromising the signal-to-noise ratio. Frequency calibration of the spectral transitions is provided simultaneously. Reliable predictions for band positions and reliable experimental band strength ratios are imperative for the intermolecular energy balance concept, as are sufficiently low barriers between the isomers which can be overcome by the collisions in the early stage of the expansion. Because variations in the barrier height and uncertainties in the infrared band strength are unavoidable and because more variability in the investigated systems aids the evaluation of quantum chemical predictions, we find it more important to study a large number of systems, rather than to achieve a high signal-to-noise ratio for only a few systems. The latter would shift the main uncertainty to theoretical auxiliary quantities such as harmonic transition dipole ratios and variations in interconversion barrier. Spectral overlap between isomers can be an issue and has to be dealt with individually, potentially increasing the uncertainty for specific donor–acceptor combinations. Again, this calls for a large number of systems to identify outliers.
In order to better assess the uncertainty of our measurements of FTIR band strengths, we developed a new integration method which is an automation and extension of our previous data evaluation routine. Previously,23 several experimenters would integrate the same dataset several times and a mean and standard deviation would be calculated to account for the uncertainty in the placement of the integration window. The new method presented in this paper evaluates uncertainty using a Monte Carlo (MC) approach.31 The integration is repeated many (100![[thin space (1/6-em)]](https://www.rsc.org/images/entities/char_2009.gif) 000) times while the integration window is modified and the noise in the spectrum is artificially altered. Therefore, we retrieve a more realistic estimate of the statistical component of our measurement uncertainty that includes the noise.
000) times while the integration window is modified and the noise in the spectrum is artificially altered. Therefore, we retrieve a more realistic estimate of the statistical component of our measurement uncertainty that includes the noise.
The MC integration algorithm can be summarized as follows:
1. The variance and autocorrelation of the noise in the input spectrum are estimated.
2. Random32 spectra with added noise are generated from the input spectrum, using the estimated noise variance and autocorrelation to generate noise samples.
3. Random integration window widths are generated.
4. For each random spectrum, bands are integrated using the random integration window widths.
5. Integral ratios and subsequently statistics of the resulting distribution over band integral ratios are calculated; if only a single band is observable, upper or lower bounds for the band integral ratio are estimated from the width of the integral distribution of the observed band.
More details to each step are provided in the ESI† (Fig. S1–S3). The new data evaluation routine was written in the Julia programming language.33 Random number generation was done using the Distributions.jl package.34
For our FTIR measurements, we used the following chemicals without further purification: phenylacetylene (Sigma Aldrich, 98%), 1-phenyl-1-propyne (Alpha Aesar, 98%), 3-methylphenylacetylene (Sigma Aldrich, 97%), methanol (Sigma-Aldrich, 99.98%), methanol-d1 (euriso-top, 99 atom% D), tert-butyl alcohol (Roth, ≥99%), tert-butyl alcohol-d1 (Sigma Aldrich, 99 atom% D), ethanol (Sigma-Aldrich, 99.8%), D2O (Sigma-Aldrich, 99.9 atom% D), H2O (demineralized, electrical conductance <0.2 μS cm−1) and He (Linde, 99.996%). In some cases, water impurities could be distilled out during the early stage of the experiment when flowing helium through the thermostated saturators, which were separately filled with the donor and acceptor compounds. Typically, 300 to 650 gas pulses were probed and the spectra were co-averaged after eliminating some scans with poorly compensated atmospheric water. Still, atmospheric water vapor is a source of excess noise in the relevant weakly shifted OH stretching region and may distort some of the band intensity ratios. Higher resolution spectra would allow for a better separation of water ro-vibrational lines and complex bands, but the low absorbance of these weakly bound complexes (typically less than log10(I0/I) = 10−4), which compete with donor molecule oligomers except for very high alcohol dilution, does not currently allow for such higher resolution FTIR spectra.
Quantum-chemical calculations were performed using the Gaussian09 (Rev. E01) suite of programs.35 The DFT functional B3LYP with Grimme's two-body D3 corrections and Becke–Johnson damping36,37 was used in combination with the def2-TZVP basis set. Spectral panels and tables are sorted in the sequence of expected Ac–Ph energy difference at this level of computation. For performance comparison, the M06-2X method was combined with the same basis set. Various guessed input geometries were used for geometry optimization to arrive at the reported minimum structures. The two competing docking sites in phenylacetylene and its meta-methylated derivatives are shown qualitatively in Fig. 1. Harmonic frequency calculations were performed to ensure that the optimized structures were minima on the potential energy surface and also, in case of B3LYP, to assign IR absorption bands. Optimization and harmonic frequency calculations were done using opt = tight and int = ultrafine keywords.38 The computed wavenumbers of the complexes were scaled to the experimental monomer OH band positions to facilitate the comparison with experimentally observed complex features.
3. Results and discussion
3.1. Theoretical results
Optimized structures of the complexes involving all the three docking sites in phenylacetylene (phenyl π site or acetylenic π site as acceptors andCH as donor) were computed for various systems. As mentioned above we focused mainly on O–H⋯π complexes of methanol (m) and tert-butyl alcohol (t) with phenylacetylene (p) and its methylated derivative, 3-methylphenylacetylene (3mp) which are shown in Fig. 2. Complexes of ethanol (e) and water (w) as donors with p, 3mp as well as m and t complexes with 1-phenyl-1-propyne (pp) as acceptor were also investigated. In the supplement, these and other calculated structures are graphically summarized together with their relative zero-point corrected energy (ΔE0) and exceptions to the dominant binding motifs (Fig. S4, ESI†). Our nomenclature of the complexes lists the donor molecule acronym, connected by a dash to the acceptor molecule abbreviation, adding the acceptor docking site (Ac, Ph) as an index where needed. For example, the acetylene bound complex of m with p, is denoted as (m–p)Ac. The Ac bound complexes mostly adopt a structure having simultaneous O–H⋯π and C–H⋯O interactions (Fig. 2 and Fig. S4, ESI†). The C–H⋯O interaction is a weaker secondary interaction which stabilizes this structure more than the one in which the donor OH group sits in an out-of-plane orientation, offering only an O–H⋯π interaction. Furthermore, the acetylenic π system itself is anisotropic due to the attached phenyl ring, likely contributing to the difference between in-plane and out-of-plane coordination. In this work we do not attempt to separate between these two qualitative influences but rather focus on the observable in-plane preference. In the case of Ph bound structures the OH moiety of the donor prefers to point towards the phenyl carbon atom opposite to the acetylenic group of p or 3mp. Unlike p, 3mp offers two distinguishable docking sites for Ac bound and Ph bound structures due to methylation in meta position. Fig. 2 presents the most stable Ac bound and Ph bound structure for p and 3mp complexes. Higher energy isomers are labelled with index 2 and are shown in Fig. S4 (ESI†). In the Ac bound (m–3mp)Ac2 and (t–3mp)Ac2 complexes the aromatic methyl group and alcohol are positioned on opposite sides of the 3mp subunit. In the higher energy Ph bound (m–3mp)Ph2 complex, the OH group of methanol points towards another carbon atom of the phenyl ring (see Fig. S4, ESI†). Relative interaction energies, both electronic and ZPVE corrected, are given in Table 1. It can be seen from Table 1 that the lowest energy structure of tert-butyl alcohol complexes changes from Ac bound to Ph bound as the acceptor is changed from p to 3mp at B3LYP-D3 level. The methylation of the phenyl ring tips the balance towards Ph bound complexes whereas methylation of the acetylenic moiety of phenylacetylene in pp results in exclusively Ac bound complexes as global minima. The relative interaction energies of pp complexes and the jet-cooled FTIR spectra are given in Table S1 and Fig. S5, respectively, in the ESI.†
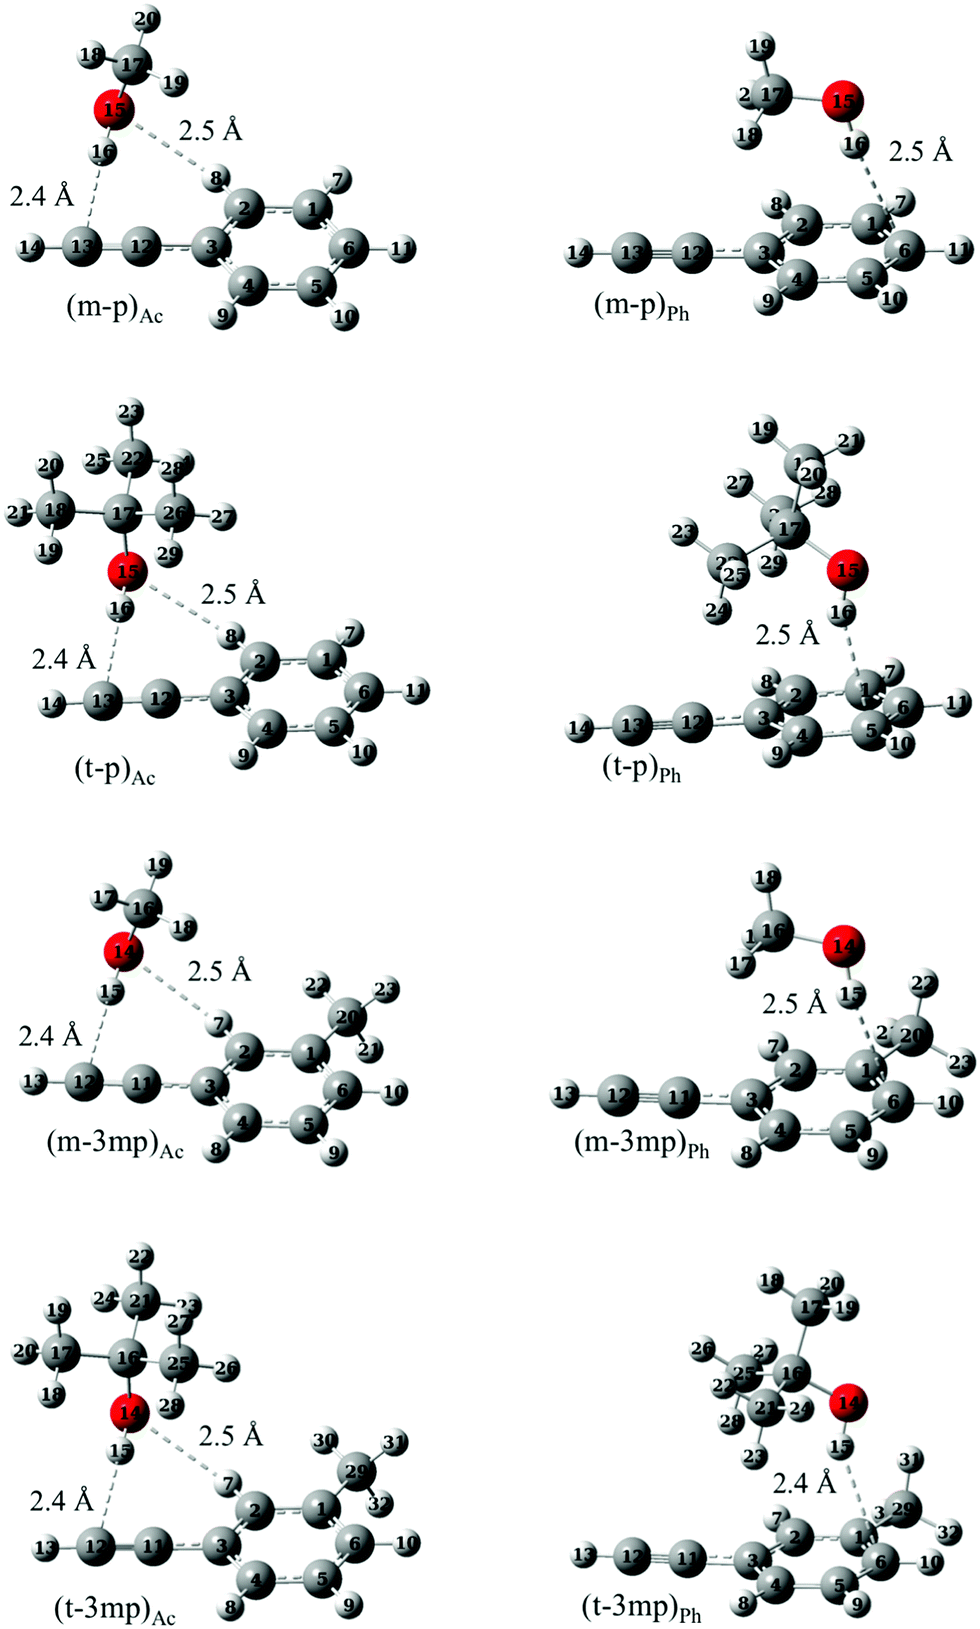 | ||
| Fig. 2 Optimized geometries of acetylene and phenyl bound complexes of phenylacetylene (p) or 3-methylphenylacetylene (3mp) with methanol (m) or tert-butyl alcohol (t) at B3LYP-D3/def2-TZVP level. | ||
| B3LYP-D3/def2-TZVP | M06-2X/def2-TZVP | ||||||||||
|---|---|---|---|---|---|---|---|---|---|---|---|
| Complex | I Ph/IAc | ΔEel | ΔE0 | σ Ac/σPh | c Ph/cAc | c Ph/(cAc + cPh) | ΔEel | ΔE0 | σ Ac/σPh | c Ph/cAc | c Ph/(cAc + cPh) |
| ΔEel = EelAc − EelPh; ΔE0 = E0Ac − E0Ph.a Including a 0.1 (20%) increase in cPh/(cAc + cPh) and enlarged error bar for the possibility of a second populated Ac isomer distorting the Boltzmann analysis. | |||||||||||
| et–p | <0.4 | −3.1 | −1.5 | 1.5 | <0.6 | <0.4 | −1.5 | 0.1 | 1.0 | <0.4 | <0.3 |
| eg–p | <0.4 | −2.1 | −0.9 | 1.7 | <0.7 | <0.4 | −0.3 | 0.7 | 1.1 | <0.5 | <0.3 |
| m–p | <0.6 | −3.1 | −1.4 | 1.7 | <1.0 | <0.5 | −1.0 | −0.1 | 1.1 | <0.7 | <0.4 |
| t–p | <0.6 | −2.6 | −1.3 | 1.5 | <0.9 | <0.5 | −1.1 | −0.1 | 1.4 | <0.8 | <0.4 |
| wd–p | <0.3 | −2.7 | −1.1 | 2.9 | <0.9 | <0.5 | −0.3 | 0.6 | 2.0 | <0.6 | <0.4 |
| md–3mp | 0.5 ± 0.4 | −1.4 | −0.7 | 1.4 | 0.8 ± 0.5 | 0.5 ± 0.3a | 0.3 | 0.9 | 1.1 | 0.6 ± 0.4 | 0.5 ± 0.3a |
| w–p | <0.5 | −2.7 | −0.6 | 3.8 | <2.0 | <0.7 | −0.3 | 0.8 | 2.7 | <1.4 | <0.6 |
| m–3mp | 0.6 ± 0.2 | −1.4 | −0.5 | 1.4 | 0.8 ± 0.3 | 0.6 ± 0.2a | 0.3 | 1.2 | 1.1 | 0.6 ± 0.3 | 0.5 ± 0.2a |
| td–3mp | >1.6 | −0.3 | 0.3 | 1.5 | >2.3 | >0.7 | 0.3 | 0.9 | 1.4 | >2.1 | >0.7 |
| t–3mp | >1.6 | −0.3 | 0.6 | 1.5 | >2.4 | >0.7 | 0.3 | 1.2 | 1.4 | >2.3 | >0.7 |
3.2. FTIR jet spectra
Fig. 3 shows a typical example of competitive docking of m to p and its meta methyl derivative (3mp), as observed in the OH stretching region. We have also measured theCH stretching region (Fig. S6, ESI†) but because there is heavy spectral overlap between monomeric and complexed phenylacetylene, it is very hard to detect the signature of the complex. In between the methanol monomer m (structured and broad due to overall and internal rotation around the CO axis despite a rotational temperature near 10–20 K) and the homodimer (m)2, fundamental transitions of the mixed dimers are observed. For the unsubstituted phenylacetylene (upper trace c), a single band is found at 3622 cm−1. For 3mp (bottom trace a), the corresponding transition is observed somewhat lower at 3620 cm−1, but it is now accompanied by a less downshifted second band of similar intensity at 3639 cm−1. The comparison of the complex spectra (m–3mp) with the spectrum of m alone in the OH stretching region shows that these product features were not present in the 3mp-free expansion and thus can be unambiguously attributed to the complex between m–3mp (Fig. S7, ESI†). Based on earlier studies of related compounds4,13 and approximate quantum chemical calculations, it is likely that these two signals are due to acetylene or phenyl docking of the methanol. To find out which is which, the analogous spectrum for O-deuterated methanol (md) bound to 3mp was measured (centre trace b). After linear frequency scaling to the same monomer position, it looks very similar to the non-deuterated case (bottom trace a), except for a slightly reduced intensity of the less shifted band, close to the limit of statistical significance. Deuteration reduces the hydrogen bond weakening effect of ZPVE, in particular for the more localized, stiffer interactions. It is qualitatively plausible and robustly confirmed by quantum chemical calculations for all investigated systems (Table 1) that this is always the case for the acetylenic docking site (Ac), more so than for the phenyl docking site (Ph). Therefore, the closely balanced docking situation in m–3mp is shifted slightly towards Ac by deuteration and also shifted in the same direction by removal of the methyl group in meta position at the phenyl ring. A successful quantum chemical prediction should be able to describe this switch from balanced to Ac-docking preference. As will be elaborated below, this trend is qualitatively captured by both computational methods (Table 1). For B3LYP-D3, the predicted energy advantage for Ac docking increases from 0.5 to 1.4 kJ mol−1 (from bottom to top in Fig. 3). For M06-2X, there is an even larger shift by 1.3 kJ mol−1 from the bottom to the top system, but now the m–3mp prediction is that Ph docking should be more attractive than Ac docking by 1.2 kJ mol−1. This is in quantitative disagreement with the bottom spectrum in Fig. 3. Therefore the B3LYP-D3 level is in better agreement with the experimental observations. However the possibility of an intensity contribution from (m–3mp)Ac2 ((md–3mp)Ac2) to the observed band of (m–3mp)Ac ((md–3mp)Ac) at 3620 cm−1 (2671 cm−1) cannot be ruled out since the computed wavenumber shifts are very similar for both isomers. This may give Ac a statistical advantage and potentially rescue the M06-2X prediction. This isomerism adds uncertainty to the m–3mp intensity analysis, but the most straightforward interpretation based on the deuteration experiment remains a somewhat stronger stability and shift for Ac docking in m–3mp. We account for the situation in the subsequent Boltzmann population analysis (vide infra) by adding 20% (0.1) to the determined Ph abundance fraction cPh/(cAc + cPh) for m–3mp and md–3mp and by enlarging the symmetric error bar accordingly, to keep the lower limit unchanged. This does not significantly change any of the later conclusions about the switching point, but it shows that such a sequence of three complexes is not yet sufficient to allow for firm conclusions about the quality of theoretical methods. Success could be coincidental and the observed intensity ratio may not reflect the actual abundance in a quantitative way. Furthermore, observation of two docking sites might also be attributed to kinetic trapping, if the barriers between the docking sites are too high to be overcome. This calls for a broader study of complexes, which should include cases where a single isomer is observed despite a close lying competitor site.
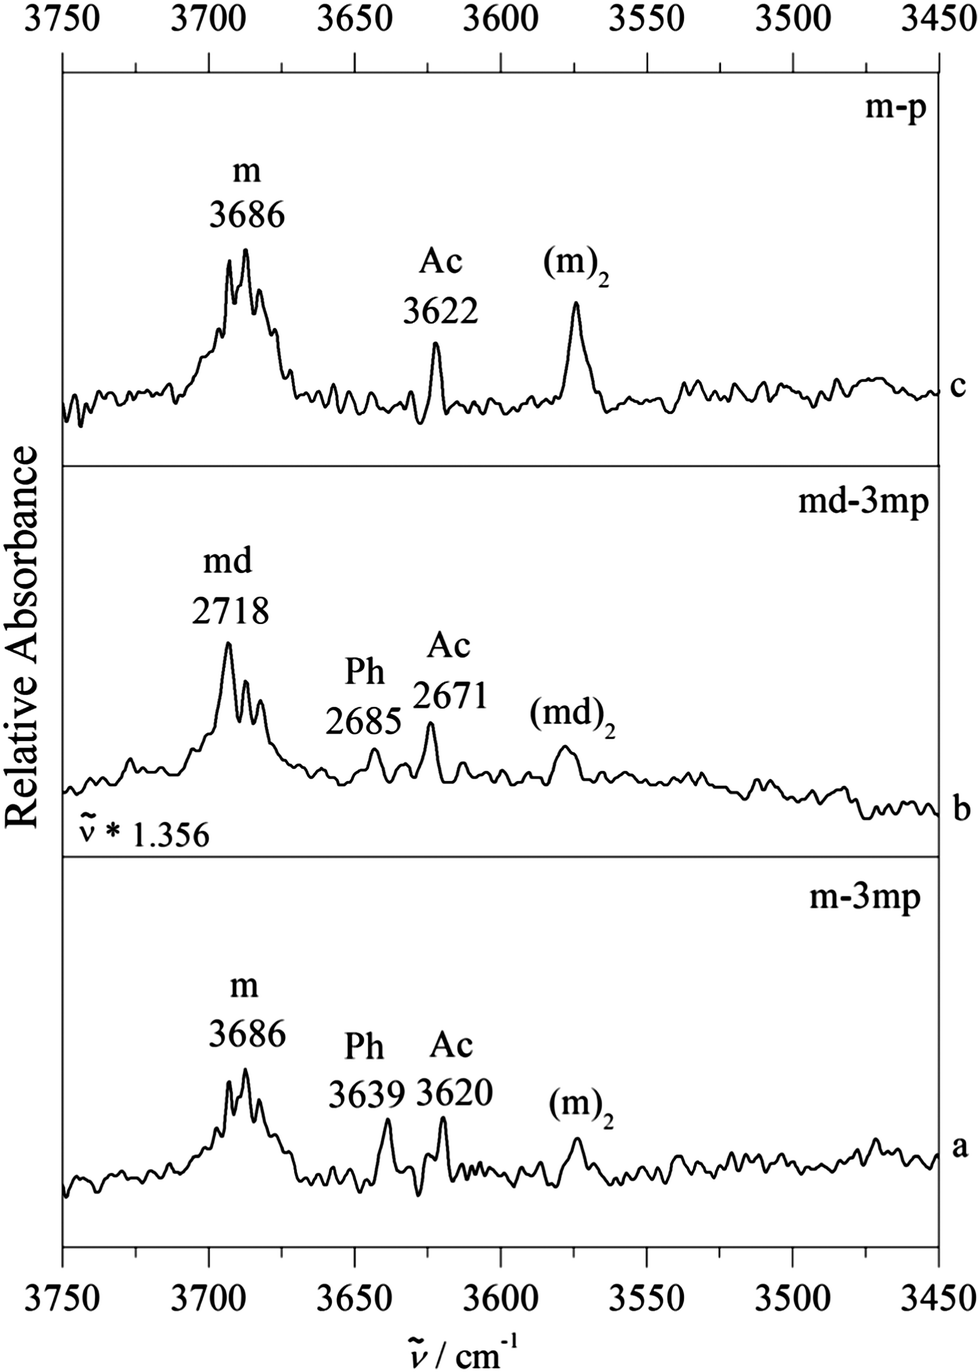 | ||
| Fig. 3 FTIR spectra of supersonic jet expansions of methanol (m) with phenylacetylene (p) and 3-methylphenylacetylene (3mp) in the OH stretching region of m. (a) Co-expansion of m with 3mp. (b) Co-expansion of methanol-d1 (md) with 3mp. The OD stretch region is scaled to the OH stretch region by using a scaling factor of 1.356 (3686/2718). (c) Co-expansion of m with p. Ph indicates the phenyl bound binary complex whereas Ac indicates the acetylenic bound complex. Bands of monomers and homodimer complexes are marked as m, md and (m)2, (md)2, respectively. | ||
Fig. 4 provides such examples, where now m is replaced by t. Single docking sites are observed in all cases. For p as the acceptor molecule, there is a mixed complex band between the t and (t)2 signals. meta-Methylation of the phenyl group increases the wavenumber of the band, which would be unexpected if the docking site stayed the same. We thus conclude that Ac docking is observed for p and Ph docking for 3mp, independent on whether t is deuterated or not. Evidently, in all three cases the interconversion barrier is low enough to prevent kinetic trapping and the methylation effect is strong enough to tip the balance entirely from one to the other site (within our detection limit). We note beforehand that formally both theoretical methods are able to explain this switch at the right place (Table 1), although in the B3LYP-D3 case one would expect some Ac docking for td–3mp (only 0.3 kJ mol−1 energy difference) and in the M06-2X case one would strongly expect some competing Ph docking for t–p (only 0.1 kJ mol−1 energy difference).
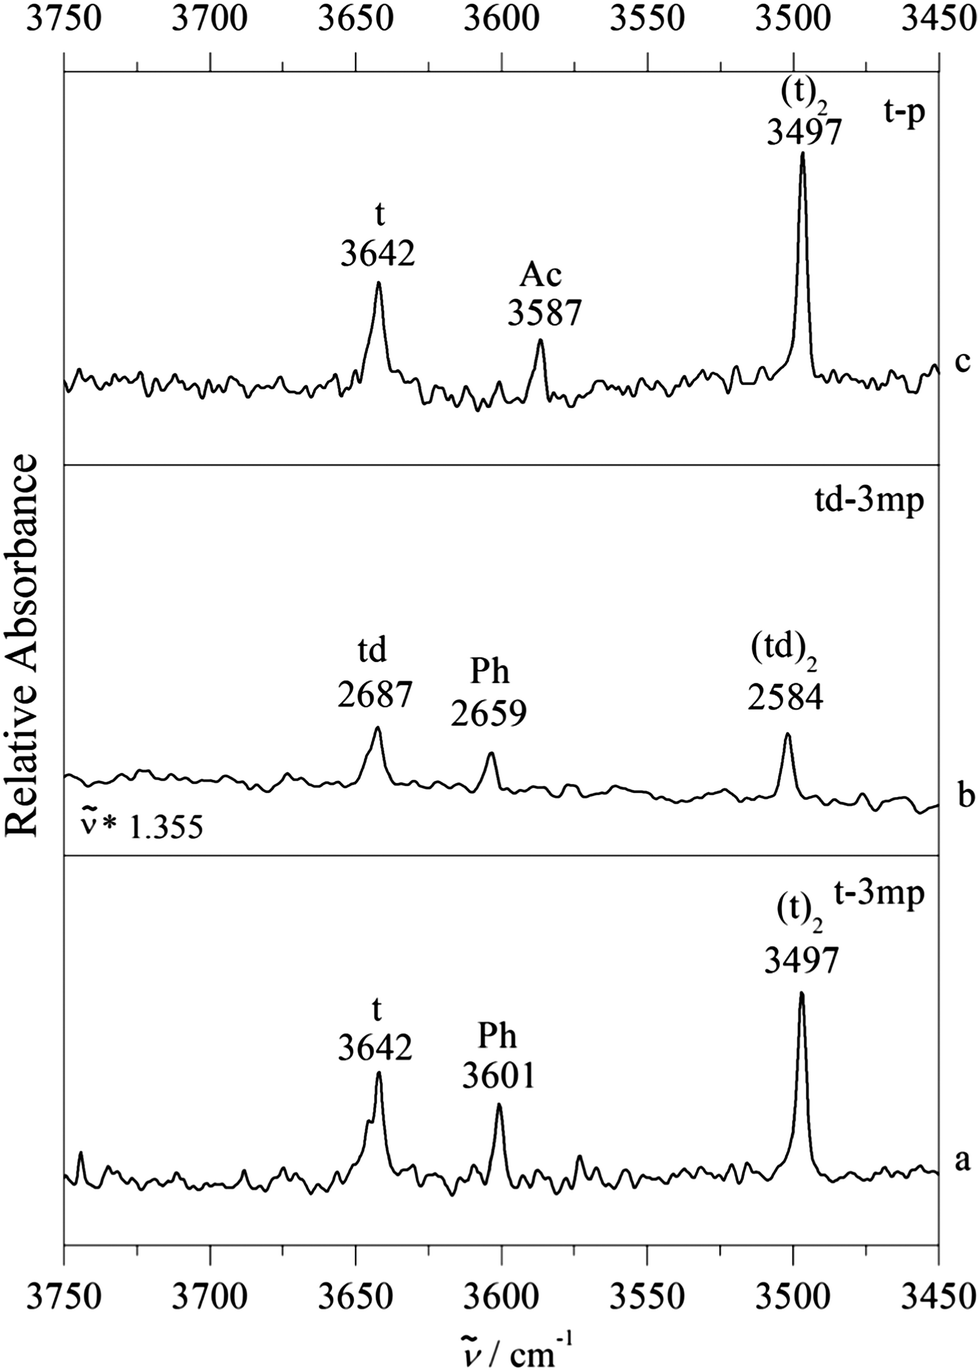 | ||
| Fig. 4 FTIR spectra of supersonic jet expansions of tert-butyl alcohol (t) with phenylacetylene (p) or 3-methylphenylacetylene (3mp) in the OH stretching region of t. (a) Co-expansion of t with 3mp. (b) Co-expansion of tert-butyl alcohol-d1 (td) with 3mp. The OD stretch region of td is scaled to the OH stretch region of t by using a scaling factor of 1.355 (3642/2687). (c) Co-expansion of t with p. Ph indicates the phenyl bound binary complex whereas Ac indicates the acetylenic bound complex. Bands of monomers and homodimer complexes are marked as t, td and (t)2, (td)2, respectively. | ||
Clearly, such analyses of isolated intermolecular balance cases with deuteration effects can give hints about the predictive performance of quantum chemical methods, but the evidence remains circumstantial. More powerful is a systematic variation of the hydrogen bonded donor, as shown in Fig. 5. In addition to the non-deuterated examples from Fig. 3 and 4, it includes ethanol (e) and water (w). In the case of water (see the ESI† for the D2O case, Fig. S8), potential mixed dimer bands are heavily overlapped by water monomer ro-vibrational transitions, but we can assume the presence of the Ac isomer.1,15 Ethanol exists in two conformers, the trans (et) and the gauche (eg) form with et being the lowest energy conformer.39 As the trans conformer is more stable by 0.5 kJ mol−1 and relaxation from gauche to trans ethanol is efficient in supersonic expansions, it is expected that the complex with trans ethanol is preferentially observed40,41 as long as this is not overcompensated by an enhanced stability of eg in the complex. When estimating this relative stability, it is not only important to compare the calculated complex stabilities, but also the ability of the theoretical method to reproduce the experimental monomer difference. When taking this into account, the B3LYP energy sequence is predicted to be Ac(et) < Ac(eg) < Ph(eg) < Ph(et) and the M06-2X sequence is Ph(eg) < Ac(eg) < Ph(et) < Ac(et). At the B3LYP level, Ac docking of et provides the global minimum, once the calculated eg–et energy difference of 0.0 kJ mol−1 is adjusted to the experimental value of 0.5 kJ mol−1.41 At the M06-2X level Ph docking of eg provides the global minimum before and after adjustment. For the two e isomers, similar complexation shifts are predicted, but because eg is experimentally 16 cm−1 lower, the absolute predictions differ. The experimental spectrum (trace a of Fig. 5) is consistent with an Ac(et) assignment, if one considers analogous deviations between B3LYP prediction and experiment for related cases (Fig. 5). Like in the previous cases, ambiguity in assignment is reduced by analogy but not completely removed due to the deficiency in the monomer description. The supplement also contains spectra for m and t complexes with 1-phenyl-1-propyne (pp). This system is not included in Fig. 5 because it is too far from a molecular energy balance. B3LYP-D3 calculations predict the Ac docking to be >2 kJ mol−1 more stable than Ph docking (Fig. S4, S5 and Table S1, ESI†) due to the electron donating effect of the terminal methyl group and the spectra indicate the exclusive presence of the corresponding complex band. The most important aspect of Fig. 5 is the systematic slight overestimation of the harmonic B3LYP-D3 shift magnitude for Ac docking, compared to experiment, once the monomer positions are matched by scaling to compensate for the major part of OH stretching anharmonicity and harmonic B3LYP error. For Ph docking in 3mp, a systematic underestimation of the calculated shift is found instead. It is generally more challenging to accurately predict weak hydrogen bond shifts than typical shifts of the order of 100–200 cm−1. Nevertheless, even an imperfect theoretical model can assist in a robust spectral assignment by transferring the error from one system to a related one. Table 2 summarizes the underlying spectral predictions for the B3LYP-D3 calculations in the double-harmonic approximation (for an analogous table of the M06-2X predictions see the ESI,† Table S2).
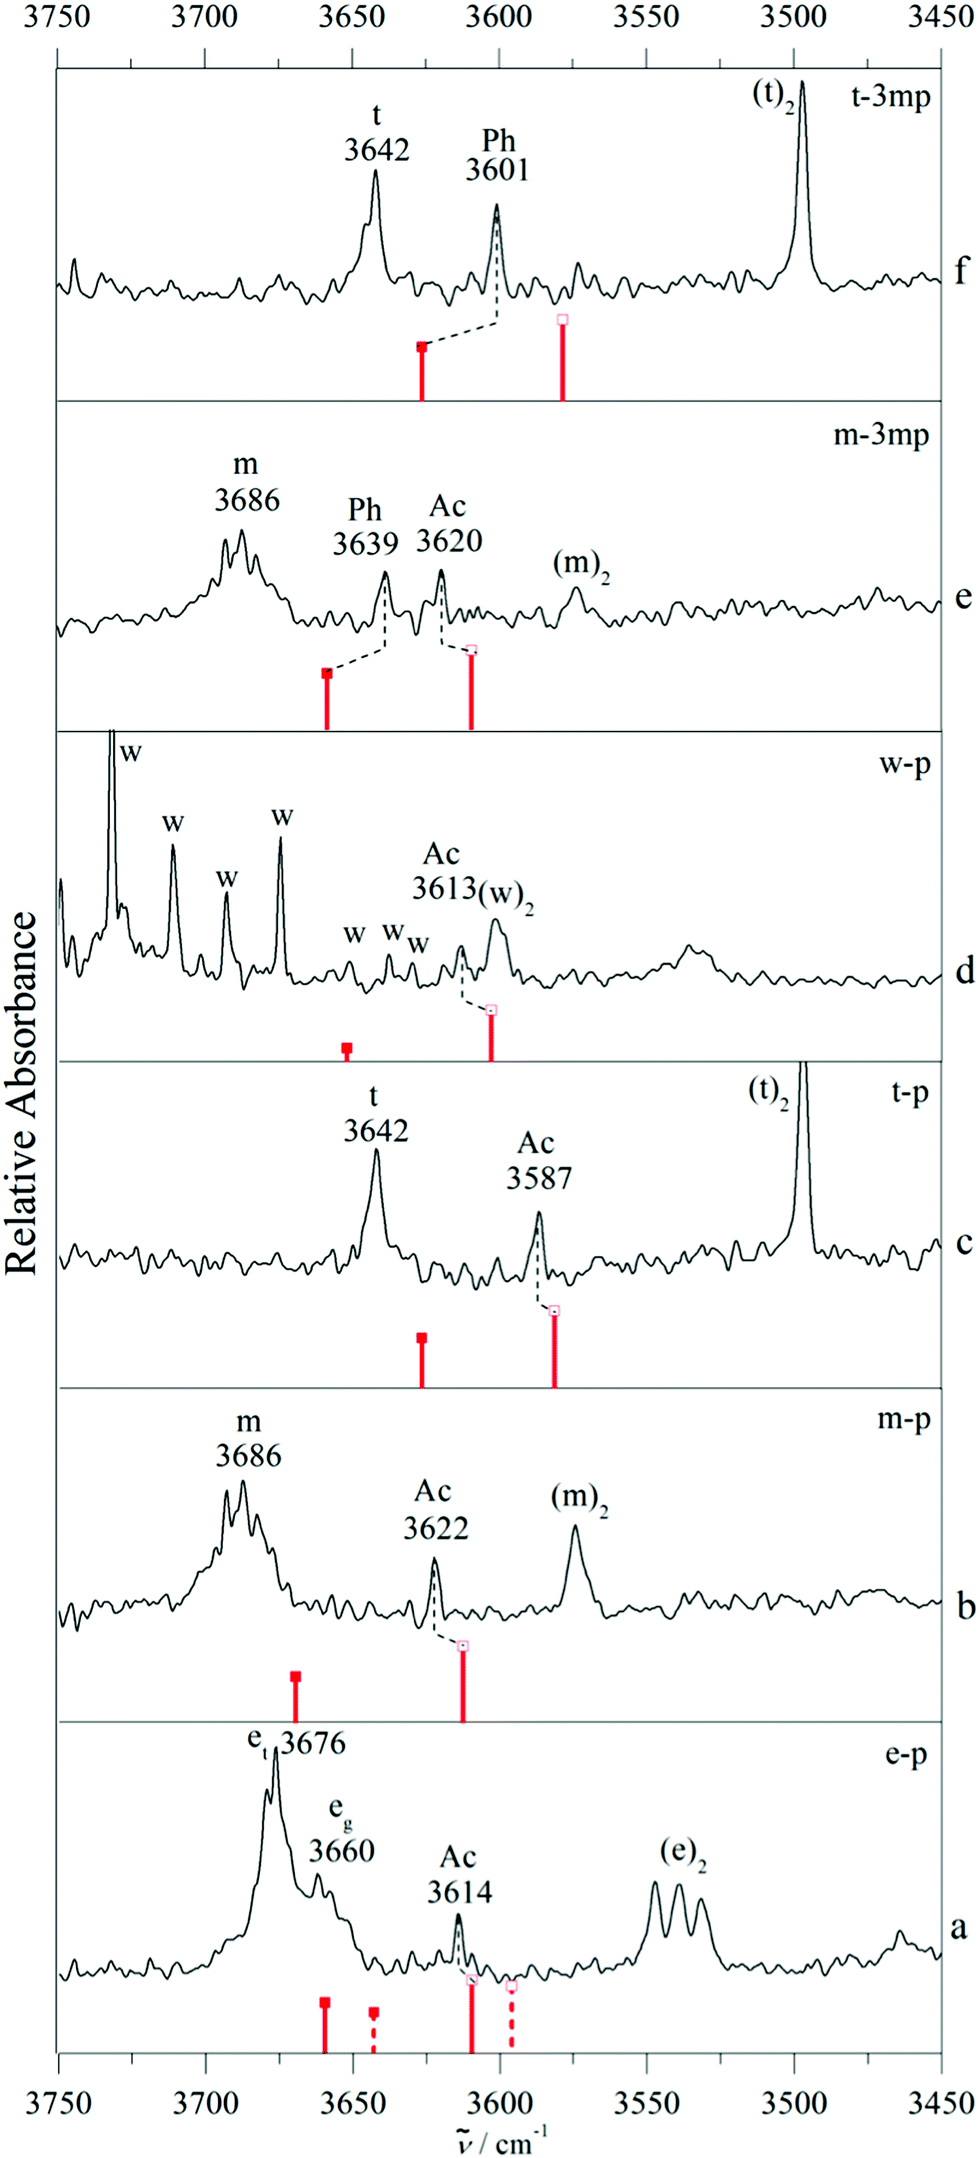 | ||
| Fig. 5 FTIR spectra of supersonic jet expansions of various donor molecules: methanol (m), ethanol (e), with options et and eg, tert-butyl alcohol (t), water (w) with acceptors phenylacetylene (p) or 3-methylphenylacetylene (3mp) in the OH stretching region of the donor. The red bars with solid and empty squares indicate the phenyl (Ph) and acetylenic (Ac) bound complexes, respectively, and represent the calculated monomer-scaled wavenumbers and relative band strengths at B3LYP-D3/def2-TZVP level (which also provides the sorting of the spectra according to increasing Ph docking preference from bottom to top). In trace a, the full bars represent complexes of et and dashed bars represent eg. The dashed lines connecting the squares indicate the experimental assignment. (a) e–p complex, (b) m–p complex, (c) t–p complex, (d) w–p complex, (e) m–3mp complex, (f) t–3mp complex. | ||
| Donor | Monomer | Complex | Coordination | |||||
|---|---|---|---|---|---|---|---|---|
| Ph | Ac | |||||||
| ω f OH/cm−1 | σ OH/km mol−1 | f Scaling factor | ΔωfOH/cm−1 | σ OH/km mol−1 | ΔωfOH/cm−1 | σ OH/km mol−1 | ||
| a The OD stretch of the donor is considered in these deuterated variants. b In case of w and wd the shift is calculated from the symmetric OH and OD monomer stretch, respectively. | ||||||||
| et | 3676 | 23 | 0.9646 | et–p | −16 | 122 | −67 (−62) | 178 |
| eg | 3660 | 18 | 0.9644 | eg–p | −17 | 98 | −64 | 163 |
| m | 3686 | 25 | 0.9667 | m–p | −16 | 115 | −73 (−64) | 191 |
| t | 3642 | 12 | 0.9615 | t–p | −16 | 124 | −62 (−55) | 192 |
| wda | 2672 | 4 | 0.9795 | wd–pb | −2 | 20 | −34 (−30) | 57 |
| mda | 2718 | 18 | 0.9791 | md–3mp | −21 (−33) | 79 | −57 (−47) | 110 |
| w | 3657 | 4 | 0.9695 | w–pb | −5 | 32 | −54 (−44) | 122 |
| m | 3686 | 25 | 0.9667 | m–3mp | −27 (−47) | 132 | −76 (−66) | 186 |
| tda | 2687 | 9 | 0.9746 | td–3mp | −12 (−28) | 73 | −47 | 106 |
| t | 3642 | 12 | 0.9615 | t–3mp | −16 (−41) | 124 | −64 | 186 |
We note that some of our IR assignments of phenylacetylene complexes differ from previous work.4 For water, we agree in assigning the observed complex to Ac docking,1,15 but our OH stretching wavenumber (3613 cm−1) differs significantly from the one reported before (3629 cm−1, Fig. 4 in ref. 4).4 Although our spectra suffer from monomer ro-vibrational line congestion, this discrepancy is difficult to explain and too large for calibration inaccuracies in the laser experiment.
More importantly, we disagree by assigning the methanol complex to Ac docking, whereas previously it was assigned to Ph docking. Here, the experimental wavenumbers differ less (3622 vs. 3615 cm−1) and the difference might simply be attributed to laser calibration. Our assignment rests on the very systematic deviation between B3LYP-D3 prediction and experiment for a large number of systems, supported by isotope effects in the methylated derivative presented in Fig. 3. For ethanol, the wavenumber difference is again small (3614 vs. 3619 cm−1). Note that the sign of the experimental deviation is now negative, but our assignment is inverted in full analogy to methanol. We justify our Ac assignment (somewhat weakened by trans–gauche isomerism, although Ac docking for eg would fall in a region of no signal, see Fig. 5a) by shift analogy across systems, whereas the Ph assignment in the literature is based on a CH stretching Fermi resonance argument.5 Perhaps the most uncertain assignment is that of t–3mp, which has not been measured before and where the single observed shift of −41 cm−1 is intermediate between the B3LYP prediction for Ac docking (−64 cm−1) and Ph docking (−16 cm−1). In such a case, comparison to related cases such as m–3mp is instructive, where the predicted shifts are about 10 cm−1 more negative. There, Ac docking is observed at −66 cm−1 and Ph docking at −47 cm−1, such that the t–3mp band is likely due to Ph docking. Furthermore, in a purely experimental argument, Ac docking is hardly affected when moving from m–p to m–3mp. It appears unlikely that it moves from −55 to −41 cm−1 in the sequence t–p to t–3mp, again confirming Ph docking. We are thus confident that our docking assignments are correct, because they fit the alkylation series of the solvent molecules smoothly. However, independent checks by UV/IR or MW spectroscopy in controversial cases would be welcome to confirm this.
3.3. Intermolecular balance analysis
After having validated the balance conditions of low interconversion barrier and consistent spectral assignment for a total of 9 phenylacetylene balance systems, the predicted integrated band strength ratios can be used to convert the observed infrared intensity ratios (or lower/upper bounds for such ratios) in the spectra into abundance ratios cPh/cAc and Ph abundance fractions cPh/(cAc + cPh). In case only a single band is observed, the average between the maximum (minimum) Ph fraction consistent with experimental uncertainty (see Table 1) and the Ph fraction 0 (1) is a meaningful average estimate. In case both, Ph and Ac complex bands are observed, the best estimate of the fraction is listed in Table 1 with error bars derived from the MC-based uncertainty evaluation introduced above. These semi-empirical Ph fractions are plotted in Fig. 6 against the theoretically predicted, ZPVE corrected energy difference between Ph and Ac docking. Ideally, Ph docking should have an abundance fraction >0.5 if it is predicted to be more stable and <0.5 if it is predicted to be less stable than the Ac bound complex (white rectangular areas). If the theoretical model is poor, the energy predictions will qualitatively disagree with the experimental abundance (grey rectangular areas). Note that in those cases where the Ph docking complex is achiral, the isoenergetic Ph abundance would actually be 0.33 instead of 0.5. This does not apply to cases where two isomers are observed and the statistical advantage of Ac docking may be partly offset by the flatness of the Ph docking potential. Therefore, we approximate by neglecting this symmetry factor. In theory, the data points should thus roughly fall on a sigmoidal curve dictated by the Boltzmann distribution,23 connecting the white areas, but individual conformational freezing temperatures in (non-equilibrium) jet expansion may lead to further deviations. If a theoretical prediction is perfect and molecules in the jet expansion are sufficiently equilibrated, the turning point of the sigmoidal curve is observed near 0.0 kJ mol−1 energy difference ΔE0. If the theoretical model has a systematic bias towards Ac or Ph docking, the sigmoidal curve is shifted horizontally. The filled symbols corresponding to B3LYP-D3 predictions in Fig. 6 seem to be slightly shifted to negative energy difference. With the def2-TZVP basis set, there is a slight bias towards Ac docking by perhaps 0.5 ± 0.5 kJ mol−1. In contrast, the empty symbols corresponding to M06-2X predictions mimic a curve which is shifted by about 1.0 ± 0.5 kJ mol−1 to positive energy difference, i.e. it is clearly biased towards Ph docking. Most of the spectra exhibiting predominant Ac docking are wrongly predicted to prefer Ph docking at M06-2X level. A 2:1 weighting of the B3LYP-D3:M06-2X predictions for energies and abundances would actually provide a rather satisfactory description of the experimental observations in the present case. This is shown in the table of contents figure for the present results, for illustrative purposes only. Although the conformational freezing temperature will vary from system to system depending on the individual barrier size separating the docking sites, the general trend of the population as a function of energy difference indicates a conformational freezing temperature of the order of 100 K. We have also carried out calculations on the experimentally studied phenylacetylene–H2S18 as unambiguous Ph docking preference can be a valuable additional data point but the energy difference between Ac and Ph H2S complexes is greater than 2.5 kJ mol−1, Ph being the global minimum, at both levels of theory (Fig. S9, ESI†). The strong Ph preference makes this system less suitable for the detection of theory deficiencies in predicting the correct global minimum. More accurate predictions of the Ph:Ac balance in the phenylacetylene system and its derivatives for the different alcohols are welcome from dedicated theory groups.
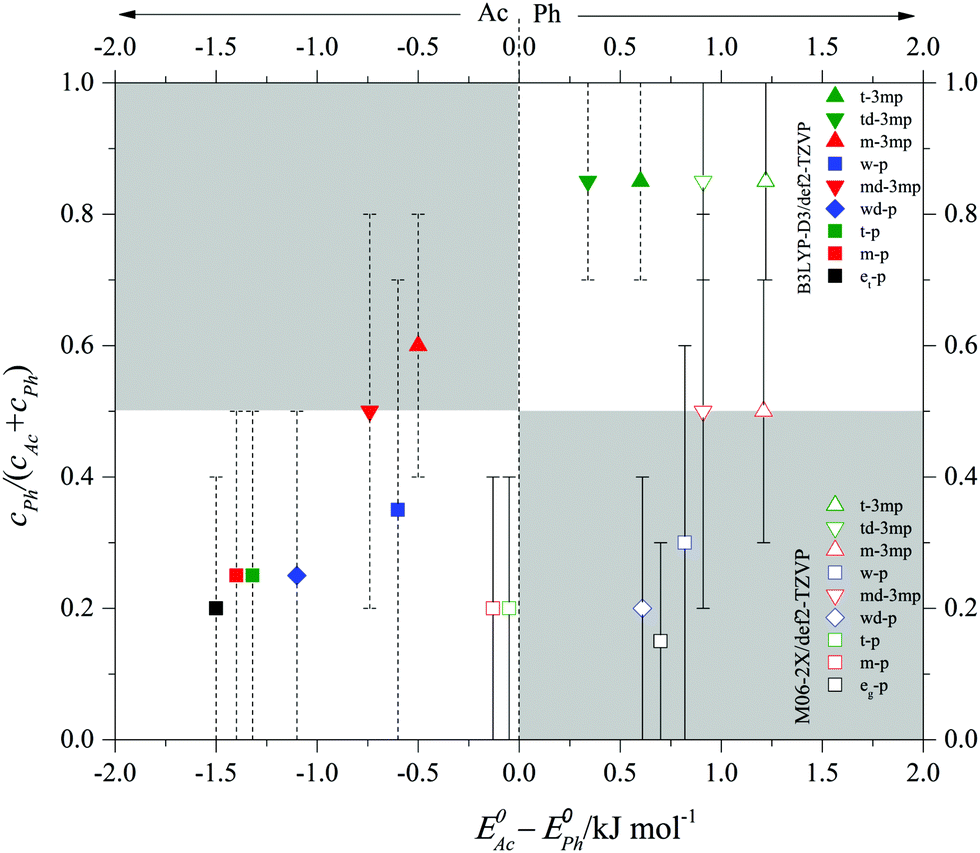 | ||
| Fig. 6 Semi-empirical abundance fraction cPh/(cAc + cPh) of Ph bound complexes of various donors (w, wd, m, et/eg, t, td, md) with phenylacetylene (p) and 3-methylphenylacetylene (3mp) as a function of the predicted zero point corrected (at B3LYP-D3/def2-TZVP level for solid symbols and M06-2X/def2-TZVP for empty symbols) energy difference between the Ac and Ph coordination sites (ΔE0). The error bars indicate the upper or lower bounds or uncertainty intervals for a confidence level of 95%, see Table 1. Negative energies indicate that Ac coordination is predicted to be more stable. | ||
4. Conclusions
Solvation of phenylacetylene is found to consistently prefer the acetylenic π system. Methylation of the acetylene in 1-phenyl-1-propyne further increases this preference. No phenyl solvation can be detected in supersonic jet expansions for the alcohols employed in this study, as well as for water. By adding a single methyl group to the phenyl ring of phenylacetylene, the energy advantage of the acetylenic binding site becomes so small that some phenyl solvation population survives cooling in the jet expansion, despite the low barrier for solvation site switching. For tert-butyl alcohol as a donor, the phenyl site is even preferred. The predominance of systems which show a single docking site underscores that the interconversion barrier between phenyl and acetylene docking is low which should largely prevent conformational freezing and thus aid the molecular energy balance experiment. The π-system of phenylacetylene is shown to be a particularly favourable scaffold for solvent molecules to slide along even at low temperature in the search for the global minimum docking position. This is an important property for the concept of intermolecular energy balances21 used to test theoretical solvation studies. Quantum chemical methods which claim to capture such subtle solvation differences must predict the correct energy order for the two solvation sites across the investigated binding partners. This is nearly the case for B3LYP-D3/def2-TZVP, but less so for M06-2X/def2-TZVP, within the harmonic approximation. Anharmonicity in the zero point vibrational energy may detune this theory-experiment relationship, but we expect it to be largely cancelling between the two OH–π sites.We invite theoreticians to test their own preferred quantum chemical and vibrational dynamics methods against this subtle benchmark, also with respect to better frequency predictions. We also invite UV/IR and MW spectroscopists to reinvestigate the structural preferences we found and to strengthen this benchmark experiment. Extending our experimental efforts to aromatic compounds with more than one acetylenic substituent42 could be interesting.
Conflicts of interest
There are no conflicts to declare.Acknowledgements
We thank Thomas Forsting, Maxim Gawrilow, Hannes Gottschalk, Robert Medel, Katharina Meyer, Sönke Ostwald, Anja Poblotzki and Charlotte Zimmermann for very valuable help and discussions and Petra Lawecki for administrative help. This work is supported by the German Research Foundation (DFG, SPP 1807, SU 121/5-2, project number 271107160). GK acknowledges a short-term postdoctoral scholarship by the University of Göttingen.References
- P. C. Singh, B. Bandyopadhyay and G. N. Patwari, Structure of the Phenylacetylene–Water Complex as Revealed by Infrared-Ultraviolet Double Resonance Spectroscopy, J. Phys. Chem. A, 2008, 112, 3360–3363 CrossRef CAS PubMed.
- P. C. Singh and G. N. Patwari, IR-UV Double Resonance Spectroscopic Investigation of Phenylacetylene–Alcohol Complexes. Alkyl Group Induced Hydrogen Bond Switching, J. Phys. Chem. A, 2008, 112, 5121–5125 CrossRef CAS PubMed.
- R. Sedlak, P. Hobza and G. N. Patwari, Hydrogen-Bonded Complexes of Phenylacetylene with Water, Methanol, Ammonia, and Methylamine. The Origin of Methyl Group-Induced Hydrogen Bond Switching, J. Phys. Chem. A, 2009, 113(24), 6620–6625 CrossRef CAS PubMed.
- S. Maity, M. Guin, P. C. Singh and G. N. Patwari, Phenylacetylene: A Hydrogen Bonded Chameleon, ChemPhysChem, 2011, 12, 26–46 CrossRef CAS PubMed.
- S. Maity, G. N. Patwari, R. Sedlak and P. Hobza, A π-Stacked Phenylacetylene Dimer, Phys. Chem. Chem. Phys., 2011, 13, 16706–16712 RSC.
- S. Maity, D. K. Maity and G. N. Patwari, Interaction of Alcohols with 2-Fluoro- and 4-Fluorophenylacetylenes: Infrared-Optical Double Resonance Spectroscopic and Computational Investigation, J. Phys. Chem. A, 2011, 115, 11229–11237 CrossRef CAS PubMed.
- Y. Zeng, M. Zhu, X. Li, S. Zheng and L. Meng, Assessment of Intermolecular Interactions at Three Sites of the Arylalkyne in Phenylacetylene-Containing Lithium-Bonded Complexes: Ab-Initio and QTAIM Studies, J. Comput. Chem., 2012, 33, 1321–1327 CrossRef CAS PubMed.
- D. Vojta and M. Vazdar, The Study of Hydrogen Bonding and π–π Interactions in Phenol-Ethynylbenzene Complex by IR Spectroscopy, Spectrochim. Acta, Part A, 2014, 132, 6–14 CrossRef CAS PubMed.
- A. Dey, S. I. Mondal, S. Sen, D. Ghosh and G. N. Patwari, Electrostatics Determine Vibrational Frequency Shifts in Hydrogen Bonded Complexes, Phys. Chem. Chem. Phys., 2014, 16, 25247–25250 RSC.
- S. I. Mondal, A. Dey, S. Sen, G. N. Patwari and D. Ghosh, Spectroscopic and Ab Initio Investigation of 2,6-Difluorophenylacetylene-Amine Complexes: Coexistence of C–H–N and Lone-Pair–π Complexes and Intermolecular Coulombic Decay, Phys. Chem. Chem. Phys., 2015, 17, 434–443 RSC.
- D. Vojta, T. Horvat, S. Miljanić and M. Vazdar, Unraveling the Weak Hydrogen Bonds of Ethynylpyridines and Ethynylbenzene with Trimethylphosphate – A Combined FT-Raman Spectroscopic and Quantum-Chemical Study, J. Mol. Liq., 2016, 218, 499–507 CrossRef CAS.
- G. Karir and K. S. Viswanathan, Phenylacetylene-Water Complex: Is it n⋯σ or H⋯π in the Matrix?, J. Mol. Struct., 2016, 1107, 145–156 CrossRef CAS.
- G. Karir and K. S. Viswanathan, The Elusive C–H⋯O Complex in the Hydrogen Bonded Systems of Phenylacetylene: A Matrix Isolation Infrared and Ab Initio Study, J. Chem. Sci., 2016, 128, 1557–1569 CrossRef CAS.
- G. Karir, G. Kumar, B. P. Kar and K. S. Viswanathan, Multiple Hydrogen Bond Tethers for the Grazing Formic Acid in its Complexes with Phenylacetylene, J. Phys. Chem. A, 2018, 122(8), 2046–2059 CrossRef CAS PubMed.
- M. Goswami and E. Arunan, Microwave Spectroscopic and Theoretical Studies on the Phenylacetylene⋯H2O Complex: C–H⋯O and O–H⋯π Hydrogen Bonds as Equal Partners, Phys. Chem. Chem. Phys., 2011, 13, 14153–14162 RSC.
- G. Karir and K. S. Viswanathan, H–π Landscape of the Phenylacetylene–HCl System: Does This Provide the Gateway to the Markovnikov Addition?, J. Phys. Chem. A, 2017, 121(31), 5797–5808 CrossRef CAS PubMed.
- G. Karir, The “Strange Case” of Phenylacetylene: Competition between H–π and n–σ* Contacts, Studied Using Matrix Isolation Infrared Spectroscopy and Ab Initio Computations, PhD thesis, IISER Mohali, 2018.
- M. Goswami and E. Arunan, Microwave Spectrum and Structure of C6H5CCH⋯H2S Complex, J. Mol. Spectrosc., 2011, 268, 147–156 CrossRef CAS.
- R. A. Mata and M. A. Suhm, Benchmarking Quantum Chemical Methods: Are We Heading in the Right Direction?, Angew. Chem., Int. Ed., 2017, 56, 11011–11018 CrossRef CAS PubMed.
- J. Řezáč and P. Hobza, Benchmark Calculations of Interaction Energies in Noncovalent Complexes and their Applications, Chem. Rev., 2016, 116, 5038–5071 CrossRef PubMed.
- A. Poblotzki, H. C. Gottschalk and M. A. Suhm, Tipping the Scales: Spectroscopic Tools for Intermolecular Energy Balances, J. Phys. Chem. Lett., 2017, 8, 5656–5665 CrossRef CAS PubMed.
- D. Bernhard, F. Dietrich, M. Fatima, C. Pérez, H. C. Gottschalk, A. Wuttke, R. A. Mata, M. A. Suhm, M. Schnell and M. Gerhards, The Phenyl Vinyl Ether–Methanol Complex: A Model System for Quantum Chemistry Benchmarking, Beilstein J. Org. Chem., 2018, 14, 1642–1654 CrossRef CAS PubMed.
- H. C. Gottschalk, A. Poblotzki, M. A. Suhm, M. M. Al-Mogren, J. Antony, A. A. Auer, L. Baptista, D. M. Benoit, G. Bistoni, F. Bohle, R. Dahmani, D. Firaha, S. Grimme, A. Hansen, M. E. Harding, M. Hochlaf, C. Holzer, G. Jansen, W. Klopper, W. A. Kopp, L. C. Kröger, K. Leonhard, H. Mouhib, F. Neese, M. N. Pereira, I. S. Ulusoy, A. Wuttke and R. A. Mata, The Furan Microsolvation Blind Challenge for Quantum Chemical Methods: First Steps, J. Chem. Phys., 2018, 148, 014301 CrossRef PubMed.
- C. Medcraft, S. Zinn, M. Schnell, A. Poblotzki, J. Altnöder, M. Heger, M. A. Suhm, D. Bernhard, A. Stamm, F. Dietrich and M. Gerhards, Aromatic Embedding Wins over Classical Hydrogen Bonding – A Multi-Spectroscopic Approach for the Diphenyl Ether-Methanol Complex, Phys. Chem. Chem. Phys., 2016, 18, 25975–25983 RSC.
- F. Dietrich, D. Bernhard, M. Fatima, C. Pérez, M. Schnell and M. Gerhards, The Effect of Dispersion on the Structure of Diphenyl Ether Aggregates, Angew. Chem., Int. Ed., 2018, 57, 9534–9537 CrossRef CAS PubMed.
- H. C. Gottschalk, J. Altnöder, M. Heger and M. A. Suhm, Control over the Hydrogen Bond Docking Site in Anisole by Ring Methylation, Angew. Chem., Int. Ed., 2016, 55, 1921–1924 CrossRef CAS PubMed.
- R. Medel, M. Heger and M. A. Suhm, Molecular Docking via Olefinic OH⋯π Interactions: A Bulky Alkene Model System and Its Cooperativity, J. Phys. Chem. A, 2015, 119, 1723–1730 CrossRef CAS PubMed.
- S. Maity, P. Ottiger, F. A. Balmer, R. Knochenmuss and S. Leutwyler, Intermolecular Dissociation Energies of Dispersively bound 1-Naphthol·Cycloalkane Complexes, J. Chem. Phys., 2016, 145, 244314 CrossRef PubMed.
- M. A. Suhm and F. Kollipost, Femtisecond Single-Mole Infrared Spectroscopy of Molecular Clusters, Phys. Chem. Chem. Phys., 2013, 15, 10702–10721 RSC.
- J. Zischang, J. J. Lee and M. A. Suhm, Communication: Where Does the First Water Molecule Go in Imidazole?, J. Chem. Phys., 2011, 135, 061102 CrossRef PubMed.
- JCGM 101:2008. Evaluation of Measurement Data-Supplement 1 to the “Guide to the Expression of Uncertainty in Measurement”-Propagation of Distributions using a Monte Carlo Method. Joint Committee for Guides in Metrology.
- All random numbers are based on pseudo-random number generation but for simplicity we write “random” here.
- J. Bezanson, S. Karpinski, V. B. Shah and A. Edelman, Julia: A Fast Dynamic Language for Technical Computing, arXiv preprint, arXiv:1209.5145, 2012.
- JuliaStats, Distributions.jl, a Julia package for probability distributions and associated functions, https://github.com/JuliaStats/Distributions.jl, v0.16.4, 2018.
- M. J. Frisch, et al., Gaussian 09, revision E.01, Gaussian, Inc., Wallingford, CT, 2009 Search PubMed.
- S. Grimme, Density Functional Theory with London Dispersion Corrections, Wiley Interdiscip. Rev.: Comput. Mol. Sci., 2011, 1, 211–228 CAS.
- S. Grimme, S. Ehrlich and L. Goerigk, Effect of the Damping Function in Dispersion Corrected Density Functional Theory, J. Comput. Chem., 2011, 32, 1456–1465 CrossRef CAS PubMed.
- M. A. Vincent and I. H. Hillier, The Structure and Interaction Energies of Weak Complexes of CHClF2 and CHF3 with HCCH: A Test of Density Functional Theory Methods, Phys. Chem. Chem. Phys., 2011, 13, 4388–4392 RSC.
- T. N. Wassermann and M. A. Suhm, Ethanol Monomers and Dimers Revisited: A Raman Study of Conformational Preferences and Argon Nanocoating Effects, J. Phys. Chem. A, 2010, 114, 8223–8233 CrossRef CAS PubMed.
- C. R. Quade, A Note on Internal Rotation–Rotation Interactions in Ethyl Alcohol, J. Mol. Spectrosc., 2000, 203, 200–202 CrossRef CAS PubMed.
- R. K. Kakar and C. R. Quade, Microwave Rotational Spectrum and Internal Rotation in Gauche Ethyl Alcohol, J. Chem. Phys., 1980, 72, 4300–4307 CrossRef CAS.
- J. A. Stearns and T. S. Zwier, Infrared and Ultraviolet Spectroscopy of Jet-Cooled ortho-, meta-, and para-Diethynylbenzene, J. Phys. Chem. A, 2003, 107, 10717–10724 CrossRef CAS.
Footnotes |
| † Electronic supplementary information (ESI) available. See DOI: 10.1039/c9cp00435a |
| ‡ Current address: Inorganic and Physical Chemistry (IPC), Indian Institute of Science, CV Raman Road, Bengaluru 560012, Karnataka, India. |
| This journal is © the Owner Societies 2019 |