 Open Access Article
Creative Commons Attribution 3.0 Unported Licence
Micromechanical exfoliation of graphene on the atomistic scale†‡
Robert C.
Sinclair
 ,
James L.
Suter
 and
Peter V.
Coveney
 *
*
Centre for Computational Sciences, University College London, 20 Gordon Street, London, WCH1 0AJ, UK. E-mail: p.v.coveney@ucl.ac.uk; Tel: +44 (0)20 7679 2000
First published on 25th February 2019
Abstract
Mechanical exfoliation techniques are widely used to create high quality graphene samples for analytical use. Increasingly, mechanical methods are used to create large quantities of graphene, yet there is surprisingly little molecular insight into the mechanisms involved. We study the exfoliation of graphene with sticky tape using molecular dynamics. This is made possible by using a recently developed molecular dynamics forcefield, GraFF, to represent graphene's dispersion interactions. For nano-sized flakes we observe two different mechanisms depending on the polymer-adhesive used. A peeling mechanism which mixes shearing and normal mode exfoliation promotes synthesis of graphene rather than many-layered graphite. Armed with this new chemical insight we discuss the experimental methods that could preferentially produce graphene by mechanical exfoliation. We also introduce a mathematical model describing the repeated exfoliation of graphite.
1 Introduction
Methods of reliably synthesising pristine graphene are scant within academia and industry.1–3 Without doubt, producing and processing graphene presents many difficulties, but the lack of theoretical insight into these problems is holding the composite materials field back.Micromechanical cleavage of graphite using sticky tape to prise apart graphene layers was the first method used to produce graphene4 and is still widely used in academic research and in industrial environments. The adhesive substrate provides a means to directly apply force to individual graphene layers to prise them apart, which is suited to produce very high quality large graphene sheets.5 It is still the primary way of manipulating graphene sheets for probing its mechanical6 and electrical7 properties. However, it is an imprecise method and much effort is expended on trivial tasks like producing graphene as opposed to graphite, locating suitable graphene flakes on the exfoliation tape, removing the substrate material, and cleaning off debris. There is clearly scope for improvement.
Other mechanical exfoliation techniques have shown promise as scalable methods for producing graphene.5,8 It is commonly understood2 that mechanical exfoliation is propagated either normal to the graphene plane, known in engineering terms as a mode I fracture and achieved via sonication;2 or lateral to the plane in a shearing motion, known as mode II fracture and realised in processes such as ball-milling2 or pressure driven fluid dynamics.9 To bring them to fruition it is important to improve the primitive understanding we have of the mechanical exfoliation mechanisms. Indeed it is remarkable how little attention has been paid to comprehending this key process.
Graphene's desirable properties rely on its uniquely large aspect ratio.10,11 Therefore, to gain a good understanding of graphene's behaviour, any theory used to describe it must subsume multiple length scales. Molecular dynamics (MD) can achieve this by retaining atomic precision while simulating hundreds of nanometres over hundreds of nanoseconds. Liquid phase exfoliation of graphene has been studied with MD before12,13 but without paying attention to graphene's unusual intermolecular forces.14–17 Molecular dynamics forcefields have until recently been unable to adequately describe the adsorption and friction between graphene sheets; however, we have created a new forcefield, GraFF,14,18 based on experimental and quantum mechanical data,19–23 that addresses their shortcomings. Using this new interaction potential we show here how graphene exfoliates through molecular dynamics simulation.
Our paper is organised as follows: in Section 2 a description of the simulations undertaken are presented along with all the computational details; Section 3 discusses the results of the simulations and describes new insight into graphene exfoliation mechanisms; Section 4 provides a Monte Carlo model to describe a graphite stack that is repeatedly exfoliated; finally section 5 concludes.
2 Computational methods
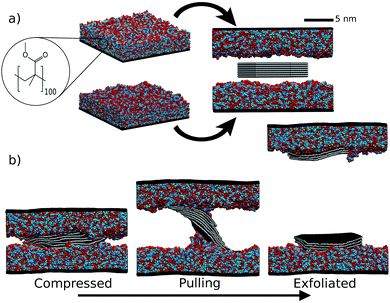
We simulated the exfoliation of graphene by polymer tapes; see Fig. 1. A graphite stack, comprising 7 graphene flakes, was compressed under isothermal–isobaric conditions (NPT) between two 4 nm thick polymer layers. This configuration was then pulled apart in the canonical ensemble (NVT) by increasing the box height at a constant speed to exfoliate the graphite. This setup is simple to perform experimentally, but has to our knowledge not been investigated at an atomic scale before.The polymer ‘sticky tape’ was modelled using poly-methyl-methacrylate (PMMA) and poly-dimethyl-siloxane (PDMS). The precise composition of commercial sticky tape brands is not publicly known but they certainly contain acrylate polymers, which have been used as pressure sensitive adhesives for many decades. PDMS is a common polymer used for graphene transfer. To make the polymer behave like a tape we build it on top of a continuous lattice extending through the xy plane; this represents the hard elastic polymer to which the adhesive polymer is attached. The polymers were built using an in house algorithm.24
The polymers were built on top of the lattice at a 0.5 relative density because PMMA has bulky side groups and the algorithm needs the extra volume to propagate the polymer chains and form entanglements. Polymers were made of 100 monomer units, which is probably below the molecular weight of commercial sticky tape but is above the entanglement length25 so that adhesive properties are retained.
First, the polymer tape's energy was minimised in LAMMPS, then compressed along the z axis over 200 ps to a density of 1. The simulation box was then increased by 25 Å perpendicular to the tape and allowed to equilibrate at 300 K for 2 ns. This allowed the polymer to relax after compression and form a naturally undulating surface, giving structures similar to those shown in Fig. 1a.
Two different equilibrated polymer tapes were then rearranged to face each other and a graphite slab placed in between them with 10 Å initial spacing between polymer and graphite. Graphite starting coordinates were built using an in house script.26 The polymer velocities are retained from the equilibration. The tape walls and PMMA/PDMS were then simulated together for 200 ps using NVT. Next, the sticky tape sections were simulated using NPT and allowed to compress in the z direction; concurrently, the graphite was simulated using NVT—this was done because we found it more stable when introducing the graphite into a system which had already been equilibrated at 300 K. Finally, the whole system was allowed to compress under atmospheric pressure for 500 ps.
Introducing graphene between the two polymer layers sometimes gave rise to unphysical systems. When the box was compressed under NPT conditions the polymer was often found to ‘topple’ over the graphite stack. We attribute this to the rather unphysical way these simulations are setup: those stacks that toppled over were excluded from the ensembles as they invariably looped across the periodic boundaries. This was done systematically: if two sheets that started off adjacent to each other drifted apart so that there was less than 10 kcal mol−1 dispersion interaction between them the stack was deemed to have toppled over and was discounted.
For the exfoliation simulation step the boxes were then strained in the z direction—perpendicular to the graphite layers—using a constant strain velocity of 10 m s−1, well within the speed at which one can pull sticky tape. When the simulation had zero stress in the z direction, over an average of 50 ps, i.e. a break had occurred, it was allowed to run for a further 200 ps before stopping.
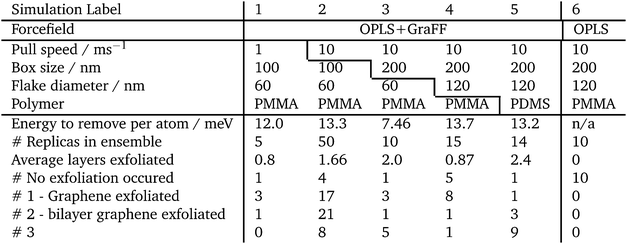
A summary of all the simulations performed is given in Table 1. The first simulations undertaken used graphene 6 nm wide graphene flakes and polymer tapes that were 10 × 10 × 4 nm3 in Table 1 these are labelled 1 and 2, comparing different strain rates. Simulation 2 was used to estimate the variance in the expected exfoliation, discussed below. From simulations 1 and 2 it was concluded that using strain rates of 1 or 10 ms−1 did not have a large effect on the outcome; therefore the following simulations used a strain rate of 10 ms−1 for computational efficiency. To investigate finite size effects in simulation 3 we doubled the lateral dimensions of the polymer tape; and in simulation 4 we doubled the size of the polymer tape and doubled the graphene flake width to 12 nm.
Simulations 4 and 5 have the largest flakes and polymer box sizes, and compare poly-methyl-methacrylate with poly-dimethyl-siloxane. These two simulations form the basis for most of the discussion in the next section of this paper. The other simulation details are listed in Table 1 for comparison.
Simulations were carried out using LAMMPS.27 Simulations used periodic boundary conditions; the timestep was 1 fs for equilibrations and 0.5 fs for exfoliation. Coulombic interactions were calculated using a particle–particle/particle-mesh method with a precision of 0.0001 kcal mol−1 Å−1; the cut-off for Lennard-Jones interactions was 11 Å; minimizations used a conjugate gradient method with a force tolerance of 10−6 kcal mol−1 Å−1 and energy tolerance of 10−6 kcal mol−1. Canonical (NVT) and isothermal–isobaric (NPT) ensemble simulations used a Nosé–Hoover barostat and thermostat. Graphite and graphene non-bonded interactions were handled using the GraFF forcefield as described by Sinclair et al.14,18 All other interactions, in the polymer and polymer–graphene interactions were modelled using the OPLS forcefield.28–31 It should be noted that, using a typical forcefield such as OPLS to parameterise these simulations, exfoliation has never previously been reported: the graphite stays attached to one polymer slab, and a gap always opens up between the other polymer layer and the graphite.
2.1 Ensemble size
These simulations have chaotic dynamics and are thus extremely sensitive to their initial conditions.32 For all systems we therefore simulated ensembles to acquire reproducible results. Each replica in the ensemble was built separately: the polymer slabs vary in their spacial arrangement, not just their initial atomic velocities, to ensure a range of configurations.A large ensemble of 50 replicas was studied to characterise the system's global behaviour (simulation 2 in Table 1). Each replica started with unique, uncorrelated atomic positions and velocities; the velocities were drawn from a Maxwell–Boltzmann distribution. The average number of flakes exfoliated and the energy required per atom to cause the exfoliation were used as the characteristic quantities by means of which to quantify a particular replica. A bootstrap with replacement was performed on this sample to quantify the confidence in the results that were derived. ‘Resamples’ from the original 50 simulations were taken, at random, with replacement, of size N. This was done 100![[thin space (1/6-em)]](https://www.rsc.org/images/entities/char_2009.gif) 000 times and the first and second standard errors from the distribution of resultant averages from all resamples gave the confidence intervals shown in Fig. 2.
000 times and the first and second standard errors from the distribution of resultant averages from all resamples gave the confidence intervals shown in Fig. 2.
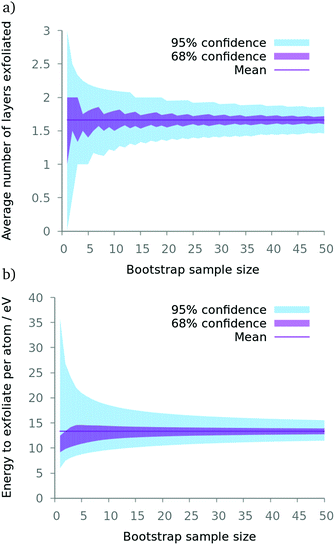 | ||
| Fig. 2 A bootstrap with replacement study on simulation 2 (see Table 1) with varying the resample size. Our simulations with larger boxes used around 15 replicas per ensemble. Here, one can see 15 is a reasonable point at which there are diminishing returns concerning the confidence in the average (a) number of layers exfoliated and (b) energy required to exfoliate the stack. | ||
3 Results and discussion
As mentioned before, mechanical exfoliation usually proceeds by either a normal or shear mechanism (see Fig. 4a). However, we find that micromechanical cleavage with PMMA exhibits a mixture of the two modes which we refer to as a peeling mechanism (see Fig. 4b). Graphene exhibits very little friction between adjacent layers33 and an extremely low bending energy34 which make it unique amongst laminar materials. Friction and bending are so easily overcome that when the force is applied in the normal direction the sheets are able to bend and slide in a peeling motion. This mechanism reduces the steep potential energy gradient that purely normal mode exfoliation would otherwise engender.To study the chemical specificity of this process we also simulated exfoliation using poly-dimethyl-siloxane (PDMS) as the adhesive. PDMS is a popular alternative to commercial sticky-tape adhesives for exfoliating graphene.35 In our setup PDMS is less viscous than PMMA, allowing for more rearrangement around the graphite during the compression time. Being less viscous, PDMS can also mold around the exfoliating graphite as it starts to peel and shear (see Fig. 4c). As the stack begins to shear we observe polymer chains attach to several sheets, making them less likely to exfoliate to a single layer.
The difference in exfoliation mechanism can be quantified by investigating the dispersion forces between the graphite stack and the two differnt polymer adhesive tapes. In the simulations, PDMS adhesive tape exhibits stronger dispersion interactions with graphite than PMMA. The total interaction energy between an outer 12 nm wide flake of graphene and polymer just before pulling is −77 ± 2 eV for PDMS and −59 ± 6 eV for PMMA. However, the interaction between a layer of polymer and a static, quasi-infinite graphene layer shows the opposite trend; the interaction energy between polymer and graphene is −0.838 ± 0.004 eV nm−2 for PDMS and −0.880 ± 0.008 eV nm−2 for PMMA. This discrepancy is due to the ease with which PDMS rearranges around the graphite stack during the compression stage and increases the amount of polymer in contact with the graphene.
Values for the interaction energy between a graphene flake and an adjacent polymer layer before the simulation starts pulling are the average and standard deviation of simulations 4 and 5, referred to in Table 1. The interaction between a polymer layer and a quasi-infinite graphene layer that extended through periodic boundaries is taken from 5 different polymer layers equilibrated on a static graphene sheet. The polymer layer was 4 nm thick in a 20 × 20 × 6 nm3 simulation box. The errors are the standard deviation of the distributions obtained.
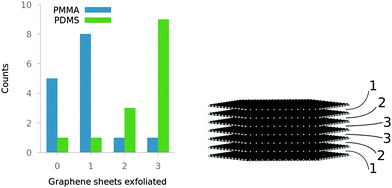
The increased contact with graphite discourages the formation of graphene; instead PDMS favours breaking the graphite in the middle of the stack. From the distribution described in Fig. 3, the average number of layers exfoliated in the simulations is 0.7 ± 0.3 for PMMA and 2.4 ± 0.8 for PDMS; clearly we are observing two distinct mechanisms (errors are the 95% confidence interval of the average on each distribution in Fig. 3).
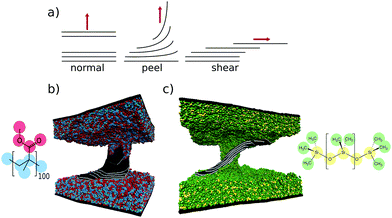 | ||
| Fig. 4 (a) Schematic showing different modes of exfoliating lamenar materials. Graphite is shown being exfoliated by PMMA in (b) and PDMS in (c). PDMS is more fluid and rearranges to stay in contact with the graphite, encouraging more shear component of the exfoliation. PMMA peels graphene layers from the top of the stack, whereas PDMS shears the layers apart, going some way to explaining the difference in exfoliation seen in Fig. 3. | ||
The biggest difference between the polymers we use is their viscosity. This is a dynamic property, therefore the timescales used could change the exfoliation outcome. Using a shorter dwell time may reduce the amount the polymer can mold to the graphite, promoting graphene exfoliation. In a similar way, using faster shearing speeds could reduce polymer rearrangement around the graphite, again promoting graphene production. In general, higher viscosity polymers should be invoked to promote graphene exfoliation. The use of cross-linked PDMS should further improve its performance.35
We can now begin to understand the different ways in which graphene can exfoliate. Normal mode fracture is seen on the macroscale, where the friction between large sheets does not allow them to slide past each other; on the nanoscale, shearing is observed with fluid polymers like PDMS; and as the substrate become less fluid a peeling mechanism is seen, which favours synthesis of graphene and relies on low friction between layers. The peeling mechanism we observe with PMMA is desirable because it more reliably produces graphene. The component of peeling will be proportional to the flake's surface area as this mechanism requires low friction between layers. If the sheets can easily slide past each other, only a small number of sheets will exfoliate with the polymer as fewer sheets have lower bending energy.
Indeed, we know that the bending stiffness of graphite increases exponentially with the number of layers.36 The peeling mechanism we have identified requires the exfoliating layers to bend; it therefore becomes exponentially harder to ‘pick up’ more graphene sheets. This reduces the number of cleavages required to reach a single graphene layer.
It is widely perceived that the reason graphene readily exfoliates with sticky tape is because the interlayer forces between graphene sheets are far weaker than those of graphene to polymer. This can be satisfactorily explained by the high dispersion forces found in materials like PMMA which do indeed contribute more non-bonded energy per unit-area than graphene. However, a more nuanced understanding is needed to explain why graphite is so stubborn in resisting solution phase exfoliation in similar polymers and solvents since, by similar arguments, exfoliation should be thermodynamically favoured. In a liquid phase it may not be possible to generate the necessary shear forces to slide large adjacent sheets past each other, and the entropic penalties associated with exposing the solvent to more surface may be too high. Of course, exfoliation of other laminar materials in polymer is often observed,37 so a complete understanding still does not exist.
The systems simulated here have been designed to investigate the original experiment by which graphene was first discovered by Giem et al.4 Using MD gives us atomistic insight into the system but is limited in the time and length scales that can be measured. We simulate in vacuum graphene flakes that are 12 nm in diameter, at the lower end of what is found experimentally. These nano-flakes are still of interest, for example when demonstrating superlubricity of graphene.33 Simulating sheets that are orders of magnitude larger would require novel multiscale modelling methods.24 Moreover, real graphene particles are not so regularly shaped, and these aspects will affect the behaviour.
4 Monte Carlo model
Using a mathematical model we can extrapolate our results to show how the mechanism of exfoliation affects the experimental outcome of repeatedly exfoliating a graphite stack. Starting with a graphite stack of N layers, (assuming graphite flakes are on the order of 100 μm in size, N is then approximately 30![[thin space (1/6-em)]](https://www.rsc.org/images/entities/char_2009.gif) 000); by repeatedly exfoliating from the top, we want to know what is left behind. If exfoliation of graphite caused the stack to fracture in the middle, it would take c = ⌈log2(N)⌉ cuts to guarantee production of graphene (upper square brackets denote the ceiling function, rounding the number of breaks up to the nearest integer larger than the bracketed value).
000); by repeatedly exfoliating from the top, we want to know what is left behind. If exfoliation of graphite caused the stack to fracture in the middle, it would take c = ⌈log2(N)⌉ cuts to guarantee production of graphene (upper square brackets denote the ceiling function, rounding the number of breaks up to the nearest integer larger than the bracketed value).
However, it is reasonable to assume that where the graphite breaks is a more stochastic process. Next, we assume that when the graphite stack is cut the break is equally likely to occur between any two graphene layers. We treat the problem as a Markov process: there are N possible states, one corresponding to every possible number of graphene layers in the stack. State 1 (graphene) is the absorbing state (also called the terminating state), all other states are transient. We therefore have n transient states, n = N − 1. The probability at each iteration to transition from state i to j is:
 | (1) |
We construct a matrix, B, which groups the transition probabillities among transient states. ![[b with combining circumflex]](https://www.rsc.org/images/entities/b_char_0062_0302.gif) is the n-dimensional column vector grouping the probabilities from any state to the absorbing one. Explicitly:
is the n-dimensional column vector grouping the probabilities from any state to the absorbing one. Explicitly:
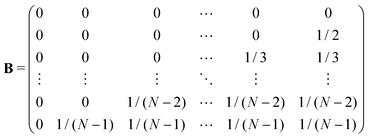 | (2) |
![[b with combining circumflex]](https://www.rsc.org/images/entities/b_char_0062_0302.gif) = [1,1/2,1/3,…,1/(N − 2),1/(N − 1)]T = [1,1/2,1/3,…,1/(N − 2),1/(N − 1)]T | (3) |
The initial state of the system is a stack of N sheets, i.e. the system has 100% chance of being in state N, the initial distribution can be described by α = [0,…,0,1], a vector of length n.
Let τ be the number of cuts till graphene is created (absorption into state 1). The PDF is then:
| g(c) = Pr(τ = c) = αBc−1b | (4) |
This provides a distribution describing the expected number of exfoliations from a graphite stack to produce graphene; see Fig. 5. Our assumption was that the stack is equally likely to break between any two sheets; using our simulation results we theorise graphite stack is more likely to break near the outer sheets using certain polymers. This model can account for such a scenario by modifying eqn (1), for example:
 | (5) |
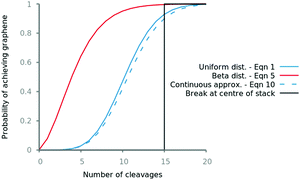 | ||
Fig. 5 Probability of synthesising graphene from a 30![[thin space (1/6-em)]](https://www.rsc.org/images/entities/char_2009.gif) 000 layer graphite stack after some number of exfoliation steps using different numerical and analytical (eqn (10) and (12)) methods. Beta binomial dist. α = 0.01. 000 layer graphite stack after some number of exfoliation steps using different numerical and analytical (eqn (10) and (12)) methods. Beta binomial dist. α = 0.01. | ||
A more intuitive understanding of the processes involved can perhaps be better achieved by treating the problem as a continuous one. Considering that our graphite stack has height h, after c cuts it will have height hc. If by exfoliating from the stack it is equally likely to break anywhere along its height, we have:
| h1 = h0X1, | (6) |
| hc = hc−1Xc, | (7) |
 | (8) |
 is given by:
 | (9) |
![[thin space (1/6-em)]](https://www.rsc.org/images/entities/char_2009.gif) x ≡ (log
x ≡ (log![[thin space (1/6-em)]](https://www.rsc.org/images/entities/char_2009.gif) x)a. For a proof of the above see Dettmann et al.38
x)a. For a proof of the above see Dettmann et al.38
If hg is the height of a single graphene sheet, this continuous approximation is valid whilst h ≫ hg. We can find the chance that graphene has been produced after c cuts by finding the probability hc ≤ hg. The probabilities Pr(0 < hc ≤ hg) and Pr(0 < fX(x) ≤ hg/h0) are equivalent; the following integral39 will therefore give us the probability of graphene being produced from a graphite stack after c exfoliations:
 | (10) |
 | (11) |
![[thin space (1/6-em)]](https://www.rsc.org/images/entities/char_2009.gif) x from 0 is made possible by substituting u = ex; after the substitution, integrating by parts easily arrives at eqn (11). Solutions to the above for h0 = 100 μm, hg = 3.35 Å are shown in Fig. 5.
x from 0 is made possible by substituting u = ex; after the substitution, integrating by parts easily arrives at eqn (11). Solutions to the above for h0 = 100 μm, hg = 3.35 Å are shown in Fig. 5.
The above describes repeated exfoliation from a single graphite stack. So far we have considered only cleaving sequentially from one stack; it is straightforward experimentally to exfoliate in a parallel fashion by shifting the sticky tape at each iteration. By this method one can repeatedly cleave every stack that is created. We find the probability of obtaining graphene by this method by considering the probability a single stack is not graphene: H(c) = 1 − G(c). Cleaving in a parallel fashion there will be a maximum of 2c stacks, each of which could be graphene; so the probability that graphene exists after c cleavages is:
| Gparallel(c) = 1 − H(c)2c | (12) |
Fig. 5 demonstrates how the way in which one exfoliates graphite can have a large impact on the effort required to synthesise graphene. Using the peeling mechanism which promotes exfoliation of smaller stacks can drastically reduce the number of cleavages required. The expected number of exfoliations to produce graphene from a 100 μm graphite stack is 11 for methods that break the stack anywhere but could be as low as 4 if the peeling mechanism is employed.
5 Conclusions
In this study we have, for the first time, provided atomistic insight into the mechanisms of mechanical exfoliation of graphene. To observe this phenomenon, careful consideration must be given to the graphene intermolecular interactions as standard forcefields are not able to simulate the behaviour with sufficient accuracy; here we have used the recently developed forcefield GraFF.14,18 We also present a transferable mathematical model for describing different modes of graphene exfoliation. Graphene's low bending energy and low friction between sheets allows graphite to shear even when the force is applied normal to the graphene plane, facilitating the production of graphene via a peeling mechanism. To promote graphene production, experimentalists should use rigid or viscous substrates. Mechanical exfoliation is a strong candidate for large scale production of graphene; however, understanding the fundamental mechanisms behind it is essential if reliable large scale manufacturing methods are to be found.Conflicts of interest
There are no conflicts to declare.Acknowledgements
We thank the Engineering and Physical Sciences Research Council (EPSRC) for a studentship for RSC and acknowledge partial funding from the EU H2020 Research and Innovation programme for the ComPat project http://www.compat-project.eu/ under grant agreement no. 671564. Simulations were run on ARCHER at Edinburgh Parallel Computing Centre http://www.archer.ac.uk, on SuperMUC at Leibniz Supercomputing Centre (LRZ) http://www.lrz.de and on Prometheus at Cyfronet http://www.cyfronet.krakow.pl/. Supercomputing time on ARCHER was provided by the UK Consortium on Mesoscale Engineering Sciences (UKCOMES) under the UK EPSRC Grant No. EP/L00030X/1; access to SuperMUC and Prometheus came from supercomputing awards at LRZ and Cyrfonet.References
- R. J. Young, I. A. Kinloch, L. Gong and K. S. Novoselov, Compos. Sci. Technol., 2012, 72, 1459–1476 CrossRef CAS.
- M. Yi and Z. Shen, J. Mater. Chem. A, 2015, 3, 11700–11715 RSC.
- A. Ciesielski and P. Samorì, Chem. Soc. Rev., 2014, 43, 381–398 RSC.
- K. S. Novoselov, A. K. Geim, S. V. Morozov, D. Jiang, Y. Zhang, S. V. Dubonos, I. V. Grigorieva and A. A. Firsov, Science, 2004, 306, 666–669 CrossRef CAS PubMed.
- X. Chen, J. F. Dobson and C. L. Raston, Chem. Commun., 2012, 48, 3703 RSC.
- C. Lee, X. Wei, J. W. Kysar and J. Hone, Science, 2008, 321, 385–388 CrossRef CAS PubMed.
- K. I. Bolotin, K. Sikes, Z. Jiang, M. Klima, G. Fudenberg, J. Hone, P. Kim and H. Stormer, Solid State Commun., 2008, 146, 351–355 CrossRef CAS.
- M. Yi, Z. Shen and J. Zhu, Chin. Sci. Bull., 2014, 59, 1794–1799 CrossRef CAS.
- Z. Shen, J. Li, M. Yi, X. Zhang and S. Ma, Nanotechnology, 2011, 22, 365306 CrossRef PubMed.
- A. S. Mayorov, R. V. Gorbachev, S. V. Morozov, L. Britnell, R. Jalil, L. A. Ponomarenko, P. Blake, K. S. Novoselov, K. Watanabe, T. Taniguchi and A. K. Geim, Nano Lett., 2011, 11, 2396–2399 CrossRef CAS PubMed.
- L. Gong, I. A. Kinloch, R. J. Young, I. Riaz, R. Jalil and K. S. Novoselov, Adv. Mater., 2010, 22, 2694–2697 CrossRef CAS PubMed.
- C.-J. Shih, S. Lin, M. S. Strano and D. Blankschtein, J. Am. Chem. Soc., 2010, 132, 14638–14648 CrossRef CAS PubMed.
- V. V. Chaban, E. E. Fileti and O. V. Prezhdo, J. Phys. Chem. C, 2017, 121, 911–917 CrossRef CAS.
- R. C. Sinclair, J. L. Suter and P. V. Coveney, Adv. Mater., 2018, 30, 1705791 CrossRef PubMed.
- V. V. Gobre and A. Tkatchenko, Nat. Commun., 2013, 4, 2341 CrossRef PubMed.
- S. Li, Q. Li, R. W. Carpick, P. Gumbsch, X. Z. Liu, X. Ding, J. Sun and J. Li, Nature, 2016, 539, 541 CrossRef CAS PubMed.
- E. Koren, E. Lörtscher, C. Rawlings, A. W. Knoll and U. Duerig, Science, 2015, 348, 679–683 CrossRef CAS PubMed.
- R. C. Sinclair, GraFF, 2018 DOI:10.5281/zenodo.2421114.
- R. Zacharia, H. Ulbricht and T. Hertel, Phys. Rev. B: Condens. Matter Mater. Phys., 2004, 69, 155406 CrossRef.
- W. Gao and A. Tkatchenko, Phys. Rev. Lett., 2015, 114, 096101 CrossRef PubMed.
- L. X. Benedict, N. G. Chopra, M. L. Cohen, A. Zettl, S. G. Louie and V. H. Crespi, Chem. Phys. Lett., 1998, 286, 490–496 CrossRef CAS.
- Z. Wang, S. M. Selbach and T. Grande, RSC Adv., 2014, 4, 3973–3983 RSC.
- Z. Liu, J. Z. Liu, Y. Cheng, Z. Li, L. Wang and Q. Zheng, Phys. Rev. B: Condens. Matter Mater. Phys., 2012, 85, 205418 CrossRef.
- J. L. Suter, D. Groen and P. V. Coveney, Adv. Mater., 2015, 27, 966–984 CrossRef CAS PubMed.
- M. Pütz, K. Kremer and G. S. Grest, Europhys. Lett., 2000, 49, 735–741 CrossRef.
- R. C. Sinclair, Make-graphitics, 2019 DOI:10.5281/zenodo.2548538.
- S. Plimpton, J. Comput. Phys., 1995, 117, 1–19 CrossRef CAS.
- W. L. Jorgensen, D. S. Maxwell and J. Tirado-Rives, J. Am. Chem. Soc., 1996, 118, 11225–11236 CrossRef CAS.
- P. Lazar, F. KarlickyÌA, P. JurecÌŇka, M. Kocman, E. OtyepkovaÌA, K. SÌŇafaÌArÌŇovaÌA and M. Otyepka, J. Am. Chem. Soc., 2013, 135, 6372–6377 CrossRef CAS PubMed.
- A. N. Rissanou and V. Harmandaris, Soft Matter, 2014, 10, 2876–2888 RSC.
- R. Nair, H. Wu, P. Jayaram, I. Grigorieva and A. Geim, Science, 2012, 335, 442–444 CrossRef CAS PubMed.
- P. V. Coveney and S. Wan, Phys. Chem. Chem. Phys., 2016, 18, 30236–30240 RSC.
- X. Feng, S. Kwon, J. Y. Park and M. Salmeron, ACS Nano, 2013, 7, 1718–1724 CrossRef CAS PubMed.
- R. I. González, F. J. Valencia, J. Rogan, J. A. Valdivia, J. Sofo, M. Kiwi and F. Munoz, RSC Adv., 2018, 8, 4577–4583 RSC.
- B. Jayasena and S. N. Melkote, Procedia Manuf., 2015, 1, 840–853 CrossRef.
- S. Cranford, D. Sen and M. J. Buehler, Appl. Phys. Lett., 2009, 95, 123121 CrossRef.
- J. L. Suter, D. Groen and P. V. Coveney, Nano Lett., 2015, 15, 8108–8113 CrossRef CAS PubMed.
- C. P. Dettmann and O. Georgiou, Stat. Probabil. Lett., 2009, 79, 2501–2503 CrossRef.
- M. Abramowitz and I. A. Stegun, Handbook of mathematical functions: with formulas, graphs, and mathematical tables, Courier Corporation, 1965, vol. 55, p. 69 Search PubMed.
Footnotes |
| † RCS, JLS and PVC conceived and designed the project. RCS performed the molecular dynamics simulations and subsequent analysis. All authors contributed to discussions, and RCS and PVC wrote the paper. |
| ‡ Electronic supplementary information (ESI) available: The accompanying document ‘Letter_RCS_SI.pdf’. This includes additional details of the simulations undertaken. We provide two videos that show typical examples of exfoliation with PMMA and PDMS. The videos show the same simulations as the snapshots in Fig. 4. See DOI: 10.1039/c8cp07796g |
| This journal is © the Owner Societies 2019 |

