 Open Access Article
Modeling of type IV and V sigmoidal adsorption isotherms†
Christoph
Buttersack

Institute for Non-Classical Chemistry at Leipzig University, Permoser Str. 15, 04318 Leipzig, Germany. E-mail: christoph.buttersack@uni-leipzig.de
First published on 14th February 2019
Abstract
Based on the biochemical theory of multiple ligand–receptor complexes (Klotz (1946)) a sigmoidal proceeding adsorption isotherm is derived. The special case of an arbitrarily large number of equal interaction sites and a separate one yields an equation which corresponds to the ζ-isotherm, disparately derived by Ward et al. (2007) for surface tension of solid—fluid interfaces. From the mathematical point of view it is analogous to the BET-isotherm for a limited number of adsorption layers (1938). It is shown that the isotherm maps type IV and V isotherms. The isotherm is compared with others including the type IV isotherm of Do and Do (2009). The present isotherm is unified in contrast to existing hybrid models. It is successfully applied to numerous literature data concerning the adsorption of water on microporous carbon and aluminophosphate molecular sieves.
1. Introduction
A sigmoidal course of an adsorption isotherm is caused by lateral attracting interactions between the adsorbed species. It is identical with type V of the IUPAC classification and is part of type IV and VI isotherms.1 An example for such isotherms the capillary condensation during the pore filling of micropores. It covers the adsorption of water on hydrophobic microporous solids such as aluminum phosphate (ALPO), silicon aluminum phosphate (SAPO) and similar zeolite analog materials,2–6 metal organic frameworks (MOFs)7 and activated carbon.8,9 At last the capillary condensation in mesoporous materials has to be mentioned. Here, type IV isotherms are mostly observed during the adsorption not only for N2 and Ar10 but also for water and numerous organics.11–18 An s-shaped isotherm can also occur when capillary condensation is improbable. Aqueous phase adsorption is sometimes attended by the formation of dimers, trimers and so on. Examples are protein–ligand interactions19,20 while examples of quite other systems with carbon21 and with inorganic sorbents22–24 are seldom.All these phenomena were subject of modeling by an appropriate isotherm. The probable most simplest equation for describing cooperative effects has been proposed by Dubinin and Serpinski.25 Deviating from Langmuir's equation only by a sign, the degree of coverage is
 | (1) |
To achieve an extension of the Langmuir concept to a sigmoidal isotherm, Malakhov and Volkhov28 have developed their cooperative multimodal sorption theory. After some simplification the Langmuir type equation
 | (2) |
 | (3) |
However, it is principally easier to define the mutual interaction between the adsorbed species as a function of the degree of coverage θ. This is done in the equation of Fowler and Guggenheim31
 | (4) |
It can be conceived as a Langmuir isotherm which is extended by an exponential term with an exponent proportional to the degree of coverage θ and a lateral interaction energy ω.
For non-localized adsorption systems eqn (4) needs to be extended by an additional term accounting for the adsorbate mobility. In the resulting equation of Hill-de Boer31
 | (5) |
The isotherms presented so far are formally related to monolayer sorption. The fractional uptake θ is ranging between zero and unity. The approaches presented in the following rely on the multisite or multilayer concept. The fractional uptake is here also considered to be the amount of adsorbed species per site or per monolayer fraction so that θ can comprise all positive numbers.
As an example for multisite sorption the general isotherm for the formation of adsorbate clusters has to be presented here. When S is the a primary binding site on the adsorbent A, the cluster formation is described by
| S + A ↔ SA; SA + A ↔ SA2; SA2 + A ↔ SA3 |
 | (6) |
That equation has originally been presented by Klotz19,20 for the multiple binding of ligands on proteins. Provided that an accurately measured experimental adsorption isotherm exists, the values of Ki signifying the formation of the monomer, dimer, trimer etc. can be obtained by non-linear regression. Values up to m = 10 have been determined.33
In most cases the experimental accuracy would be not so high, and in case of water clustering on apolar micropores it may reasonable to assume, beside the primary association, all following to have the same value. Then eqn (6) reduces to
 | (7) |
This is a function with only 3 adjustable parameters which are K1, K and m. The equation is part of Do and Do's model of water sorption in activated carbon. First presented with m = 634 it was later extended to m as free parameter resulting from the fitting procedure.35Eqn (7) has been used to describe the formation of water clusters around the primary adsorption sites. However, Do and Do assumed a limited clustering around functional sites at the carbon surface and subsequent formation of super-clusters around the primary clusters. The formation of these super-clusters, which are the reason of the sigmoidal course of the isotherm, was not described by eqn (7) but by another additional term.34,35 Do and Do's model is further discussed later on.
Eqn (7) with K = 1 is also important for the derivation of the BET model. For a limited number of n layers the result is36
 | (8) |
Brunauer, Emmett and Teller did not recognize that their equation can display a sigmoidal course. This is not surprising because that behavior can occur only at x > 1 which is beyond the limit of partial pressure. However, in 2007 the derivation of the so-called ζ-isotherm was published.37 The starting point was Anderson's modified BET equation which was found to be very successful in fitting of numerous experimental type II isotherms also at high partial pressure. It is mainly known in the literature as GAB-isotherm.38 Anderson has related the common BET isotherm not to the partial pressure but to a lower apparent pressure given by
| z = Kax | (9) |
 | (10) |
The isotherm can display a sigmoidal course for z > 1.41
A general multilayer isotherm, which maps also the course of type IV and V, has been published by Brunauer et al.42 after their pioneering work in 193839 as an extension of the BET equation by assuming that increasing the number of multi-layers n is coupled with an enhanced probability to be adsorbed on both sides of the capillary walls. The following equation, also known as BDDT isotherm, has been derived:
 | (11) |
For g > 1 and C < 1 type V isotherms result, type IV isotherms are obtained for g > 1 and C > 1. However, because of its complicated nature this equation was only seldom applied to isotherm analysis.38
Beside these theoretically founded isotherms numerous empirical or half-empirical equations exist.31 One of them is the Sips isotherm31
 | (12) |
The Dubinin equations
 | (13) |
The systems considered so far are regarded to be mainly homogeneous. However, a sigmoidal isotherm can also be the result of a heterogeneous energy distribution.48 Sips49 has derived his isotherm by assuming a Langmuir behavior on the homogeneous patches and a Gaussian energy distribution for an exponent of s < 1. That approach can also be transferred to s > 1. By superposition of several sigmoidal Sips isotherms, each assigned to a Gaussian energy distribution, nearly any course of an isotherm inside the whole range between type I and VI can be simulated, although the intrinsic interaction with the homogeneous patches is of Langmuir type.50 The energy distribution function is then a result of the curve fitting and needs verified by supporting experimental techniques. Hence the analysis of adsorption isotherms is rather complex. To reduce the experimental effort, adsorbents with a strict geometrical pore structure, e.g. zeolites, are preferred for the verification of theoretical adsorption isotherms.
On the theoretical side different principle ways of thinking have to be discerned. Langmuir51 pioneered the kinetic approach to the derivation of his adsorption isotherm in 1918. It is later used for the derivation of the BET,36 the GAB,39 and the Fowler–Guggenheim isotherm.52 Alternatively the derivation of the isotherms is based on classical thermodynamics or statistical thermodynamics.53 The first example of the latter concept has been presented by Fowler and Guggenheim in their deduction of a sigmoidal isotherm.54 Also the BET equation can be obtained via statistical thermodynamics.55 The derivation of a type V isotherm similar to that of Sips44 and another concerning both monomeric and dimeric adsorbates56 are further examples for this approach.
Against this background and based on the original idea of Klotz,19 the classical derivation of a sigmoidal isotherm is presented here and applied to the adsorption of water on hydrophobic surfaces. Most examples are referred to activated carbon but the adsorption on a zeolite-analog crystalline material is also presented. All experimental data are taken from the literature.
2. Methods
Calculations were performed either by Excel (usual accuracy of 15 decimal points) or SigmaPlot 2000 software for curve fitting by non-linear regression according to the Levenberg–Marquardt algorithm.57 All experimental data were taken from the literature by graphical conversion of plots to numerical values.3. Theory
The starting point of the presented work is the concept of Klotz19 originally and successfully applied to protein interactions with small molecules.20 Its application to capillary condensation has to consider that all equilibrium constants involved have to merge into a single one when surface effects with the pore walls can be neglected. Such surface interaction can be induced by primary adsorption sites interacting with the fluid inside the pore, which is either in the gaseous or after condensation in the liquid state. Acid sites can act as nucleation points for the phase transition of water in activated carbon; hydroxy groups at the inner surface of mesoporous silica have the same property. Their concentration surely influences the isotherm. However, when their influence is low, the Klotz equation, already presented in the introduction as eqn (7), reduces to the numeric series: | (14) |
| q = Kx | (15) |
K is discussed later in Section 5. For m = 1 eqn (14) reduces to that of Langmuir. Furthermore, the application of de L'Hôpital's role yields Henry's law for very low degrees of coverage
 | (16) |
 | (17) |
With great values of m the calculation using the Klotz equation is very unwieldy. But it can be simplified. The denominator of eqn (14) is a geometric series which can be mathematically transformed to58
 | (18) |
 | (19) |
 | (20) |
In the next step the Klotz equation is extended by allowing the first association constant K1 to be different from the following. Defining
| K1 = CK | (21) |
 | (22) |
Also for that notation the series of expansion can be eliminated. When the denominator is written as
 | (23) |
 | (24) |
That equation is nothing else than the ζ-equation which has been derived by Ward et al.37via a longer alternative way applying statistical thermodynamics. It is also identical with the n-layer BET isotherm for q = x.36 Special cases are obtained for the assumption that the index i is allowed to reach infinite. For q smaller than unity eqn (24) reduces then to
 | (25) |
For better understanding q is here replaced by Kx according to eqn (15). Obviously this is Anderson's39 modified BET equation originally developed for the assumption that the heat of adsorption in the second layer and the next following layers is less than the heat of liquefaction.
At last the original BET equation, being Anderson's equation with K = 1, is shown to be a special case of the Klotz equation. It has to be mentioned that Brunauer et al.36 have derived the BET-equation in a similar fashion when the layer-by-layer deposition was formulated by summing-up the covered volume per totally possible volume. One finds eqn (18) and (19) in their derivation with the only difference that they used the infinite instead the numerical series. Also Hill55 presented that approach following the concept of statistical thermodynamics with q = x, x < 0 and m → ∞.
4. Comparison of the Klotz-isotherm with others
Fig. 1 and 2 show the sigmoidal course of the Klotz isotherm for the simplest case that all binding constants are the same. At q = 1 the point of inflection occurs. This point is clearly defined by the original notation of the Klotz isotherm (14) but it is not defined in the simplified form of eqn (20) because it is a singularity. For the practical application it is useful to compare it with other established sigmoidal isotherms. In Fig. 1 the Klotz isotherm has the value of m = 10 and all other isotherms are fitted to it using θ values ranging between 0.2 and 0.8. Within that range the deviation is low, but it is great in the lower and the upper region. In the lower region the Fowler-Guggenheim eqn (4) has a positive deviation while negative deviations occur for the isotherms of Brunauer (11), Sips (12) and Dubinin–Astakhov (13). In the upper region the deviations are reversed. Fig. 2 shows the analog behavior for m = 100. Only the fit of the BDDT equation42 was impossible.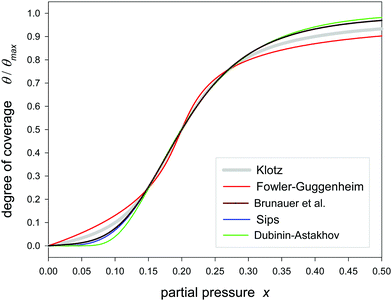 | ||
| Fig. 1 Fitting of different sigmoidal isotherms in the range of θ/θmax = 0.2–0.8 to the Klotz isotherm (eqn (24)) calculated with C = 1, K = 5 and m = 10. | ||
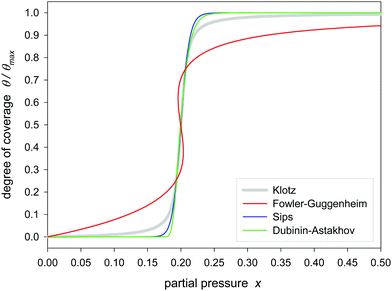 | ||
| Fig. 2 Fitting of different sigmoidal isotherms in the range of θ/θmax = 0.2–0.8 to the Klotz isotherm (eqn (24)) calculated with C = 1, K = 5 and m = 100. | ||
As a result of the isotherm comparison, empirical correlations between the exponents can be calculated. The exponent s of the Sips isotherm, presented in the introduction as eqn (12), can be converted to m by
 | (26) |
 | (27) |
 | (28) |
These correlations are independent on the respective other isotherm parameters. However, the interconversion of Dubinin–Astakhov to the Klotz isotherm is an interdependent function of both the exponents and the adsorption constants, and therefore not presented here. Further underlying data towards the isotherm interconversion is available in the ESI† (Fig. A1–A3).
While Fig. 1 and 2 comprise only type V isotherms, Fig. 3 shows that also type IV isotherms are covered when the first adsorption constant is allowed to be greater than the remaining ones (C > 1). Considering the case that the first adsorption constant is lower (C < 1) the isotherm the first low region is further diminished. The point of inflection is shifted to lower partial pressures (q < 1) for C > 1 and to higher pressures (q > 1) for C < 1. The influence the K-values in the second and further adsorption layers is not considered here. That will be the subject of another contribution.
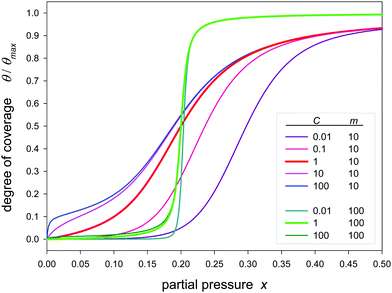 | ||
| Fig. 3 Plot of the Klotz isotherms (eqn (24)) with different values of C and m for K = 5. | ||
Of special interest are type IV isotherms. In contrast to the present isotherm, all others found in the literature are based on two parallel occurring sorption processes. One describes the adsorption on the adsorbent's functional sites, another comprises a pore filling mechanism. An empirical approach is the combination of a Langmuir and a Sips isotherm favored by Moon and his group.15–18 Among the theoretically derived isotherms only the model of Malakhov and Volkhov28 after its modification by Rutherford29 and the model of Do and Do34,35 are able to map the course of type IV. The latter should be presented here in more detail.
Do and Do have developed their “DD-model” with respect to the adsorption of water on a hydrophobic microporous material, being an activated carbon. In contrast to pure graphene, carbon is characterized by some functional groups which are able to act as primary sorption sites for water. After the surface adsorption a capillary condensation occurs at higher partial pressure which is characterized by a more or less sharp increase of the isotherm.8 The starting point of the DD-model is the idea that primarily adsorbed water clusters AβS around the functional group S partially detach according to the equilibrium
| AβS ↔ Aα + Aβ–αS |
That equilibrium leads then to the following isotherm34,35
 | (29) |
The first term with the fraction f and the thermodynamic adsorption constant Kf is responsible for the clustering at the primary site, the second with the fraction f has been derived from the detachment equilibrium and is characterized by the interaction constant Kμ between the water molecules filling the pores. The latter process starts when the critical clustering α is achieved. The pore filling for both terms is finished at a maximal number of β. Do and Do assumed in their first article34 a value of α = 5 but did not comment β. They mentioned that the first term is identical with BET when β is infinite. According to the eqn (22)–(24) the first term can be expressed by the n-layer BET isotherm. As noticed by Neitsch et al.60 the second term can also be simplified by division through
Then the resulting term is identical with the Sips isotherm. Hence, the detachment of water clusters is equivalent to the Langmuir type desorption of water clusters with the size α, and the full isotherm has the simplified general form:
 | (30) |
In their second article the authors of the DD-isotherm assumed that α may be a free fit parameter.35 In summary, eqn (30) contains 5 adjustable parameters, namely f, Kf, Kμ, α, and β (beside the saturation capacity).
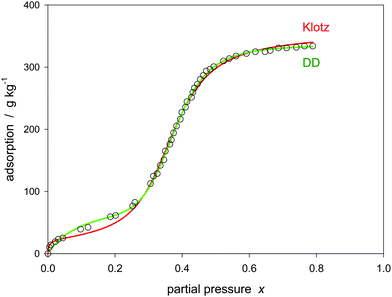
The DD-model can be compared with the Klotz isotherm which has only 3 parameters: K, C, and m. This is shown in Fig. 4 where a synthetic DD-isotherm is calculated with defined parameters and the Klotz-isotherm is fitted to it by non-linear regression. When all values above x = 0.75 are omitted, a fair match is achieved. Only at higher partial pressure the Klotz isotherm deviates strongly, the greater the exponent β of the DD-equation is. Compared with the hybrid DD-model, the Klotz isotherm represents a unified concept where all interactions, which are possible between the water and the surface and in between the water molecules itself, are comprised. This is theoretically preferred although, as discussed later, the DD-model may result in a better fitting of some experimental data. From the mathematical point of view the DD-model (eqn (30)) is a sum of two independent terms, the first describing the surface interaction and the second comprising the cluster formation. But strictly spoken such an additive superposition is only applicable when the terms are responsible for adsorption on distinct sites, for example inside the pores or on the external surface, or generally on a heterogeneous adsorbent. Admittedly, the Klotz model is also based on sums, but it is a quotient of two series of expansions. Hence the primary sorption and the cluster formation are inter-dependent processes.
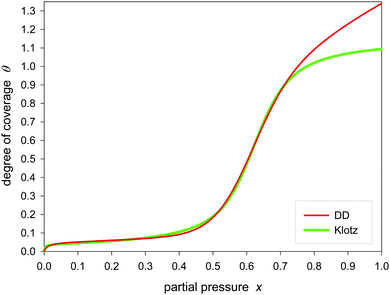 | ||
| Fig. 4 Fitting of the Klotz isotherm (eqn (24)) to the DD-model (eqn (30)) calculated with f = 0.05, Kf = 100, α = 10, Kμ = 100, β = 20. Within the range of x = 0–0.75. Regression analysis: K = 1.59, C = 200, and m = 30. | ||
5. Application to experimental data of water sorption on carbon
Numerous reports are available in the literature on delivering experimental data of type V and IV adsorption and desorption isotherms. As an example, the sorption of water on different carbons is considered here. To concentrate solely on the isotherms, the background concerning the chemical and morphological nature of the carbon is omitted here. In the beginning of the application review, reference is made to the work of Rutherford63 presenting the water adsorption isotherm on a carbon molecular sieve over a large range of partial pressure. Rutherford has accomplished a fitting of his data with his modified 4 parameter hybrid model (eqn (2) and (3)). Fig. 5 shows that the application of the 3-parameter Klotz isotherm also yields fair results.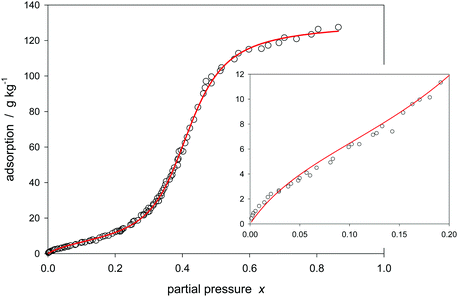 | ||
| Fig. 5 Klotz isotherm (eqn (24)) for modeling of water adsorption on carbon molecular sieve no. 19 (Table 1). | ||
Activated carbons differ in their fraction of functional groups. Thus, heat treatment under argon gives very hydrophobic carbons with a sharp increasing isotherm at high partial pressure while oxidation results in considerable adsorption already at low pressure followed by only a smooth pore filling increase.9Fig. 6 shows that the Klotz isotherm covers a range of different carbons.
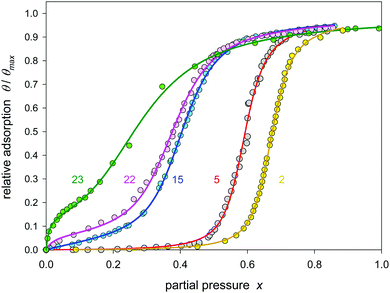 | ||
| Fig. 6 Klotz isotherm (eqn (24)) for modeling of water adsorption on activated carbon no. 2, 5, 15, 22, and 23 (Table 1). | ||
However, some examples have to be reported for which the model deviates. The example of Fig. 7 shows that the experiment is not covered at medium pressures before the pore filling sets in. This is because the model is limited to only one separate surface layer interaction. A respective extension of the model is obviously necessary. The DD-model can easily be fitted to that experiment, but as outlined before, it fails from the theoretical point of view.
Another example is focused on the high pressure region. As shown in Fig. 8, the isotherm is fully covered by a hybrid model such as DD but not by the Klotz model. To change the behavior of the Klotz model at high pressures it may be extended, for example by adding a possible linear correction according to
 | (31) |
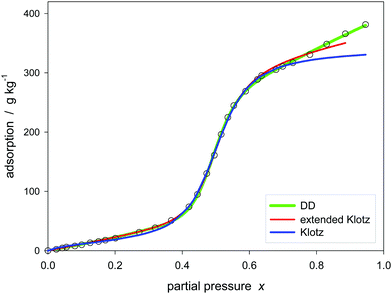 | ||
| Fig. 8 Model of Klotz (eqn (24)), extended Klotz (eqn (31)), and DD (eqn (30)) for water adsorption on carbon no. 14 (Table 1). | ||
The linear term represents an additional parallel occurring sorption on separate sites.
Table 1 shows a compilation of different experiments taken from the literature. The underlying plots are those already discussed; further are shown in the supplementary information. Table 1 also contains a statistical evaluation. The average relative error (ARE) provides a measure for comparison. In order to compare the theoretical eqn (24) with the empirical linear extension (eqn (31)) both fittings were characterized by the Akaike criterion for model selection. It is defined in its corrected form76 by the residual number of squares σ2, the number of used experimental points N, and the number of parameters k according to
 | (32) |
| No. | Literature | Figures | Adsorbent | Parameters | Statistics | ||||||||
|---|---|---|---|---|---|---|---|---|---|---|---|---|---|
| Q max/g kg−1 | C | K | m | K L | R | N | ARE/% | AICc | |||||
| Carbon | |||||||||||||
| 1 | 62 | 3 | CFK12 | ads | 253 ± 2.1 | 0.178 ± 0.13 | 2.336 ± 0.1290 | 9.0 ± 1.6 | 0.000 | 0.99918 | 35 | 1.32 | 214 |
| 3 | CFK12 | ads | 202 ± 52 | 0.034 ± 0.24 | 2.861 ± 3.4700 | 8.8 ± 6.6 | 0.224 ± 0.241 | 0.99947 | 35 | 1.36 | 201 | ||
| 2 | 63 | 5a | CS II | ads | 314 ± 2.5 | 0.19 ± 0.05 | 1.494 ± 0.0036 | 51.3 ± 2.7 | 0.000 | 0.99955 | 37 | 0.89 | |
| 3 | 64 | 3 | AC-1 | ads | 1152 ± 14 | 0.20 ± 0.10 | 1.278 ± 0.0018 | 106 ± 8 | 0.000 | 0.99890 | 26 | 1.58 | |
| 3 | AC-1 | des | 1089 ± 14 | 0.20 ± 0.30 | 1.596 ± 0.0023 | 197 ± 22 | 0.000 | 0.99670 | 30 | 3.00 | |||
| 4 | 63 | 5a | KUA1 | ads | 279 ± 1 | 0.20 ± 0.05 | 1.941 ± 0.0179 | 23.9 ± 1.6 | 0.000 | 0.99969 | 34 | 0.82 | |
| 5 | 9 | 31 | A | ads | 361 ± 5.6 | 0.21 ± 0.11 | 1.700 ± 0.0109 | 42.1 ± 4.8 | 0.000 | 0.99796 | 49 | 2.32 | |
| 6 | 65 | 2a | MSC-30 | ads | 1379 ± 9.0 | 0.22 ± 0.05 | 1.351 ± 0.0021 | 62.1 ± 2.9 | 0.000 | 0.99985 | 25 | 0.62 | |
| 7 | 66 | 2 | H | ads | 184 ± 0.9 | 0.32 ± 0.05 | 1.561 ± 0.0049 | 28.4 ± 1.2 | 0.000 | 0.99994 | 18 | 0.46 | |
| 2 | H | des | 178 ± 1.4 | >100 | 2.069 ± 0.0061 | 67.6 ± 4.8 | 0.000 | 0.99954 | 18 | ||||
| 8 | 67 | 6 | N-19 | ads | 565 ± 7.3 | 0.98 ± 0.45 | 1.453 ± 0.0032 | 47.5 ± 2.5 | 0.000 | 0.99940 | 22 | 1.16 | |
| 6 | N-19 | des | 510 ± 12 | 1.0 ± 6 | 1.836 ± 0.0021 | 276 ± 37 | 0.000 | 0.99211 | 28 | 4.80 | 278 | ||
| des | 472 ± 45 | 1.9 ± 71 | 1.833 ± 0.0014 | 341 ± 39 | 0.119 ± 0.145 | 0.99500 | 28 | 4.33 | 272 | ||||
| 9 | 68 | 5a | MSC3K | ads | 134 ± 0.5 | 1.2 ± 0.2 | 2.002 ± 0.0020 | 39.5 ± 0.9 | 0.000 | 0.99976 | 48 | 0.76 | |
| 10 | 66 | 2 | R1 | ads | 165 ± 2.7 | 1.22 ± 0.36 | 1.761 ± 0.0153 | 13.3 ± 1.1 | 0.000 | 0.99953 | 19 | 1.14 | |
| 2 | R1 | des | 164 ± 1.7 | 2.67 ± 1.88 | 2.188 ± 0.0146 | 25.4 ± 2.1 | 0.000 | 0.99918 | 19 | 1.79 | |||
| 11 | 69 | S1 (ESI) | A7 | ads | 268 ± 1.3 | 1.24 ± 0.18 | 2.370 ± 0.0062 | 18.5 ± 0.5 | 0.000 | 0.99979 | 34 | 0.69 | 167 |
| S1 (ESI) | A7 | ads | 243 ± 7.8 | 0.45 ± 0.18 | 2.414 ± 0.0276 | 17.8 ± 1.0 | 0.137 ± 0.047 | 0.99980 | 34 | 0.75 | 168 | ||
| 12 | 62 | 3 | CFC20 | ads | 234 ± 1.2 | 1.68 ± 0.54 | 2.279 ± 0.0051 | 27.4 ± 0.9 | 0.000 | 0.99932 | 30 | 0.96 | |
| 13 | 70 | 1 | AZ-46-0 | ads | 318 ± 3 | 300 ± 450 | 1.977 ± 0.0147 | 23.6 ± 1.2 | 0.000 | 0.99933 | 27 | 1.54 | |
| 14 | 71 | 3a | ads | 346 ± 2.1 | 8.27 ± 2.26 | 1.978 ± 0.0050 | 25.7 ± 0.6 | 0.000 | 0.99981 | 26 | 0.73 | 139 | |
| 3a | ads | 269 ± 7.7 | 0.085 ± 0.12 | 2.081 ± 0.1701 | 21.3 ± 6.1 | 0.390 ± 0.053 | 0.99980 | 26 | 1.66 | 149 | |||
| 15 | 9 | 41 | B | ads | 370 ± 1.3 | 2.9 ± 0.5 | 2.440 ± 0.0051 | 19.0 ± 0.4 | 0.000 | 0.99973 | 52 | 0.84 | |
| 16 | 72 | 1 (ESI) | PIT11 | ads | 1040 ± 13 | 3.1 ± 2.2 | 1.273 ± 0.0031 | 48.0 ± 2.1 | 0.000 | 0.99933 | 27 | 1.23 | |
| 1 (ESI) | PIT11 | des | 927 ± 17 | >50 | 1.641 ± 0.0054 | 67.4 ± 5.2 | 0.000 | 0.99838 | 15 | 2.25 | 139 | ||
| 1 (ESI) | PIT11 | des | 836 ± 44 | 4.7 ± 10 | 1.635 ± 0.0030 | 83.4 ± 6.7 | 0.117 ± 0.013 | 0.99936 | 15 | 1.72 | 132 | ||
| 17 | 9 | 31 | E | ads | 371 ± 3 | 3.4 ± 0.8 | 2.477 ± 0.0084 | 17.1 ± 0.5 | 0.000 | 0.99940 | 60 | 1.20 | |
| 18 | 68 | 5b | HF CM | ads | 109 ± 0.5 | 6.1 ± 1.0 | 2.609 ± 0.0110 | 12.4 ± 0.2 | 0.000 | 0.99979 | 31 | 0.71 | 96 |
| 5b | HF CM | ads | 104 ± 5 | 6.3 ± 1.2 | 2.626 ± 0.0210 | 12.9 ± 0.6 | 0.058 ± 0.050 | 0.99961 | 31 | 0.75 | 98 | ||
| 19 | 61 | 1 | 5A | ads | 132 ± 0.6 | 6.9 ± 1.1 | 2.393 ± 0.0061 | 18.4 ± 0.3 | 0.000 | 0.99945 | 98 | 0.99 | |
| 20 | 73 | 1 | DS-A | ads | 540 ± 5.3 | 9.2 ± 3.6 | 1.747 ± 0.0097 | 17.1 ± 0.5 | 0.000 | 0.99947 | 23 | 1.01 | |
| 21 | 63 | 5a | CFS97 | ads | 180 ± 0.7 | 10.5 ± 3.8 | 1.682 ± 0.0024 | 26.2 ± 0.3 | 0.000 | 0.99918 | 35 | 0.61 | |
| 22 | 9 | 41 | C | ads | 367 ± 1.8 | 18.2 ± 9.7 | 2.600 ± 0.0104 | 15.8 ± 0.4 | 0.000 | 0.99918 | 51 | 1.32 | |
| 23 | 70 | 1 | AZ-46-24 | ads | 363 ± 2 | 37.2 ± 7.0 | 3.385 ± 0.0540 | 7.0 ± 0.2 | 0.000 | 0.99962 | 26 | 1.03 | |
| 24 | 74 | 3 | CAC | ads | 393 ± 3.2 | 46 ± 65 | 1.862 ± 0.0106 | 21.5 ± 0.8 | 0.000 | 0.99948 | 21 | 1.31 | 139 |
| 3 | CAC | ads | 315 ± 14.0 | 40 ± 60 | 1.864 ± 0.0071 | 29.2 ± 2.3 | 0.237 ± 0.056 | 0.99975 | 21 | 1.15 | 127 | ||
| 25 | 74 | 3 | LAC1 | ads | 231 ± 5.4 | 4 ± 2 | 2.843 ± 0.0951 | 6.4 ± 0.8 | 0.000 | 0.99786 | 21 | 2.21 | 138 |
| 3 | LAC1 | ads | 153 ± 10.0 | 92 ± 400 | 3.416 ± 0.1054 | 10.0 ± 0.9 | 0.487 ± 0.103 | 0.99924 | 21 | 2.04 | 120 | ||
| 26 | 9 | 31 | D | ads | 360 ± 12 | 93 ± 60 | 2.698 ± 0.0310 | 15.7 ± 0.4 | 0.000 | 0.99891 | 47 | 1.53 | |
| (Fe)AlPO4-5 | |||||||||||||
| 27 | 4 | 8 | FAPO | Fe | 189 ± 3.6 | >50 | 5.363 ± 0.0090 | 113 ± 8 | 0.000 | 0.99688 | 24 | 2.68 | |
| 28 | 75 | B1, 25 °C | AQSOA-Z01 | Fe | 188 ± 1.5 | 15 ± 50 | 5.417 ± 0.0141 | 55 ± 3 | 0.000 | 0.99951 | 19 | 1.44 | 100 |
| B1, 25 °C | AQSOA-Z01 | Fe | 169 ± 2.4 | 0.38 ± 0.22 | 5.425 ± 0.0190 | 62 ± 6 | 0.380 ± 0.023 | 0.99956 | 19 | 1.66 | 107 | ||
| B2, 45 °C | AQSOA-Z01 | Fe | 182 ± 1.1 | >50 | 4.075 ± 0.0053 | 57 ± 1 | 0.000 | 0.99978 | 22 | ||||
| B2, 45 °C | AQSOA-Z01 | Fe | 162 ± 1.2 | 0.07 ± 0.02 | 4.145 ± 0.0220 | 48 ± 3 | 0.372 ± 0.012 | 0.99993 | 22 | 0.65 | 78 | ||
| 29 | 3 | 3a, 60 °C | AQSOA-Z01 | Fe | 203 ± 3 | 0.06 ± 0.16 | 4.102 ± 1.0900 | 16 ± 9 | 0.000 | 0.99859 | 15 | 2.50 | 90 |
| 3a, 60 °C | AQSOA-Z01 | Fe | 182 ± 15 | 0.02 ± 0.09 | 4.484 ± 2.6000 | 16 ± 11 | 0.153 ± 0.098 | 0.99956 | 15 | 2.35 | 95 | ||
| 30 | 3 | 3c, 45 °C | AQSOA-Z05 | 219 ± 4 | 0.03 ± 1.09 | 2.983 ± 0.7200 | 20 ± 12 | 0.000 | 0.99866 | 13 | 2.50 | ||
That model, which gives the lowest value of AICc, is the best from the statistical view.77 However, the AICc values in Table 1 are not differing very much. Hence both models can by applied. A problem is that the linear extension is assumed also to be valid in the first part of the full isotherm where it is influencing the C-value. When the capillary condensation is regarded as a phenomenon of the porous nature of the adsorbent and the linear increase is due to the adsorption on its non-porous counterpart, a chance for separating both phenomena exists. A respective method is introduced in the N2-adsorption porosimetry by the so-called αs-plot.78
The analysis of the experiments listed in Table 1 is ordered due to increasing C-parameters. It contains as well examples for type V with C ≤ 0, as type IV examples with C > 0. The K-values are ranging between 1.5 and 2.5. They should reflect the binding between the water molecules independent on the surface interaction. In other words, K defines the capillary condensation. As shown in Fig. 3, for great values of m the value of 1/K is identical with the partial pressure of the inflection point of the isotherm. In the case of K = 1 the capillary effect is absent. Thermodynamically K defines the equilibrium of
| H2O + (H2O)n−1 ↔ (H2O)n |
 | (33) |
| 2 < n < m | (34) |
Hence K is the cluster formation constant and RT![[thin space (1/6-em)]](https://www.rsc.org/images/entities/char_2009.gif) ln
ln![[thin space (1/6-em)]](https://www.rsc.org/images/entities/char_2009.gif) K defines the relative evaporation energy. Interestingly the K values decrease with increasing values of the maximal loading Qmax (Fig. A21 ESI†) suggesting that a small pore size diminishes the average binding strength in the pore filling liquid. But a sound interpretation in that direction would require samples with monodispersed pore diameters.
K defines the relative evaporation energy. Interestingly the K values decrease with increasing values of the maximal loading Qmax (Fig. A21 ESI†) suggesting that a small pore size diminishes the average binding strength in the pore filling liquid. But a sound interpretation in that direction would require samples with monodispersed pore diameters.
With respect to the basic series of expansion (eqn (14)) the exponent m is a measure of the maximal cluster size. It depends strongly on the employed isotherm. Conversions of that exponent to that of other theoretical sigmoidal isotherms have already been mentioned. Here, the examples listed in Table 1, range from 7 to values above 300. The value of m can be compared with cluster sizes in non-restricted neat bulk water: Average cluster sizes of some hundred are discussed in the literature.79 On the other hand, the hydrogen bond network of water is altered inside the pores of carbon materials by the confining geometry alone. For carbon nano-tubes strong effects on the water structure are reported, based on experiment80 and simulation.81 Due to the confinement, the clusters are assumed to be smaller. But after all, the question remains how a cluster is defined. For example, a recent study of molecular modeling considers cluster sizes of water during its adsorption in activated carbon ranging from 10 to 500065 while recent small-angle neutron scattering experiments support the conclusion that the cluster size remains constant throughout the sorption process.82
At last, two examples concerning the adsorption–desorption hysteresis are discussed. The H2 type hysteresis shown in Fig. 9 is characterized by C = 1.2, K = 1.76, m = 13 and a saturation value of Qmax = 165 g kg−1. The desorption starts at the same ideal saturation point, but the decrease with decreasing x is at first smaller compared to adsorption, only later the desorption proceeds with a stronger fall compared to the ramp of adsorption. The desorption is characterized by C = 2.7, K = 2.19, m = 25 and Qmax = 164 g kg−1. According to the classical view, the hysteresis is generally caused by the geometries of the vapor–liquid interface of the partially filled pores. Two different geometries are possible for the same vapor pressure only depending on the history of their formation.83 The change of geometry, which can be generally interpreted as a relaxation process,35 is irreversible but after all a thermodynamical equilibrium is achieved both in the adsorption and desorption branch. Whereas the classical interpretation is due to a different vapor–liquid interface, the analysis of the isotherms by the Klotz equation is solely based on the different average sizes of the water clusters. It is important to note that different cluster sizes are correlated with different K-values: The larger clusters have a greater internal binding strength, the density of water is therefore considered to be somewhat greater, and the vapor pressure is smaller. Different binding constants have already been presented by Do and Do during the interpretation of the hysteresis of water in carbon considering the parameters of their own isotherm. The parameter Kμ of the Sips term (see eqn (30)) was greater for the desorption compared to adsorption.35 Here, also the C-values are different. However, their accuracy is rather low for the desorption branch so that that a discussion is not indicated.
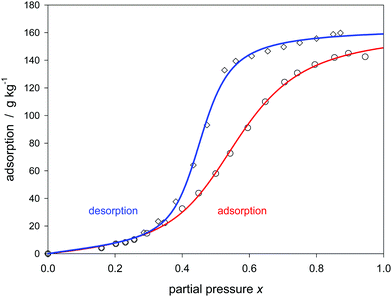 | ||
| Fig. 9 Hysteresis of water sorption on activated carbon no. 10 (Table 1) described by the Klotz isotherm (eqn (24)). | ||
Fig. 10 shows the adsorption–desorption hysteresis of another activated carbon material. The isotherms are much more steep. The adsorption branch is characterized by C = 0.2, K = 1.278, and m = 106, the desorption branch by C = 0.2, K = 1.596, and m = 197. Again the inner binding strength K of the liquid is greater for the desorption, significantly exceeding the error limits of ±0.002. However the course of the isotherms near the partial pressure of unity is not as expected. The extrapolation of the isotherms to infinite x does not result in the same saturation value for both branches. Around x = 0.9 both branches cross. Such a phenomenon is also observed in case of carbon no. 17 shown in Fig. A15 of the ESI.† Provided the experimental basis is correct, the isotherm seems to fail in the high pressure region. The reason is unclear. Perhaps the change of the average cluster size has an extra influence on the theoretical background of the isotherm.
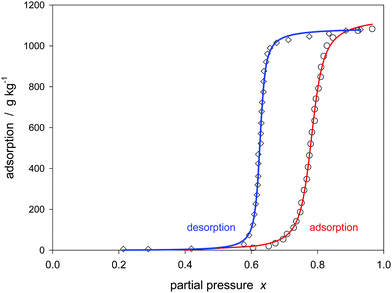 | ||
| Fig. 10 Hysteresis of water sorption on activated carbon no. 3 (Table 1) described by the Klotz isotherm (eqn (24)). | ||
6. Application to experimental data concerning aluminophosphate molecular sieves
As already mentioned in the introduction, the isotherms are principally influenced by the energy distribution of the sorption sites. Usually the activated carbons have a pore size distribution, and the surface contains statistically distributed functional sites.8 Therefore these materials can be regarded as heterogeneous.84 Also so-called carbon molecular sieves with a pore size below 1 nm, like that presented in Fig. 5, have a pore size distribution.29 In contrast, the Klotz equation is based on a homogeneous energy distribution and it has been only assumed that the heterogeneity has negligible minor effects. Therefore adsorbents, which are characterized both by a uniform pore size and a uniform internal pore surface, are of interest for the validation of the present isotherm. Sigmoidal isotherms concerning the adsorption of water are also found for aluminophosphates. AlPO4 which is isoelectronic with SiO4 can be crystallized to zeolite-analog microporous materials. When the P/Al ratio is unity, these materials are neutral and hydrophobic; they can adsorb water by cluster formation.85 The isotherms are usually strongly sigmoidal.3–6 AlPO4-5 has the AFI type zeolite structure and contains 1-dimensional micropores with a diameter of 0.742 nm.86The materials, presented in the following, contain some iron in addition.3–5Fig. 11 shows that the experimental water sorption isotherm follows eqn (24). Another literature source5,50,75 has the advantage that it contains a XRD spectrum that proves the crystallographic structure. Also a N2 adsorption at 77 K is provided in that literature. It shows that after micropore filling a further linear increase follows due to mesopore sorption. Both types of pores have an impact on the water sorption isotherm. As shown in Fig. 12, the first exhibit the sigmoidal increase, the second can be approximated by a linear function paralleling the course of the N2 sorption. The underlying experimental data has been already presented as an example for a “universal isotherm” which is built-up by summation of two sigmoidal Sips-isotherms. Both represent a specific energy distribution of a totally heterogeneous adsorbent.50 Since at least the mesopores are indeed heterogeneous, the combination of the present isotherm (eqn (24)) with the Sips part of that literature50 is an alternative for the linear function used here. (see Fig. A22 ESI†). The advantage of the linear function is that is has only one parameter. But an influence on the C-value remains, and as a result, the theoretical interpretation of C is questioned. The application of the present isotherm to other examples of water sorption on aluminophosphate molecular sieves is shown in the ESI† (Fig. A23 and A24).
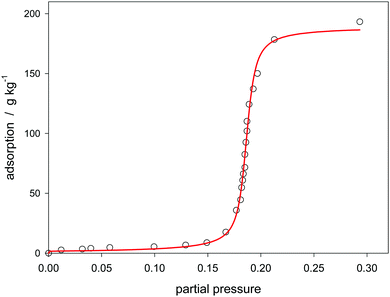 | ||
| Fig. 11 Adsorption of water on ferro aluminophosphate molecular sieve no. 27 (Table 1) at 25 °C modeled by the Klotz isotherm (eqn (24)). | ||
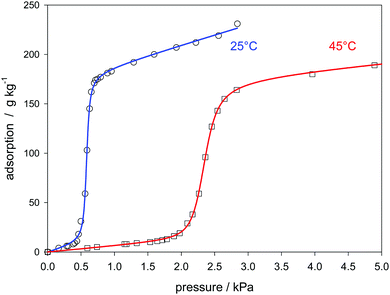 | ||
| Fig. 12 Model of the extended Klotz eqn (31) applied to the adsorption of water on an ferro aluminophosphate molecular sieve no 28 (Table 1). | ||
One might guess that eqn (24) can be applied for all water sorption isotherms on aluminophosphate molecular sieves. However, that is not the case. A further example,6 shown in Fig. A25 of the ESI,† reveals that obviously the first part of the type IV isotherm cannot be fitted. One has to assume that not only a monolayer but a multilayer is formed at that stage. This possibility is not covered by the present model. The solution of that problem will be addressed in a future publication of the author.
7. Conclusion
Based on straightforward considerations presented by Klotz in 1946,19 an isotherm is derived describing the sorption of type IV and type IV. The equation resembles the n-layer BET equation, but instead of the partial pressure it is based on the product of the partial pressure with a constant K. K is interpreted as the thermodynamic constant of the adsorbate clustering inside the adsorbent pores. Alternatively RT![[thin space (1/6-em)]](https://www.rsc.org/images/entities/char_2009.gif) ln
ln![[thin space (1/6-em)]](https://www.rsc.org/images/entities/char_2009.gif) K defines the relative evaporation energy compared to the bulk status. The exponent m, which corresponds to the number of layers in the BET theory, is here considered to represent the maximal cluster size.
K defines the relative evaporation energy compared to the bulk status. The exponent m, which corresponds to the number of layers in the BET theory, is here considered to represent the maximal cluster size.
The isotherm is compared with the model of Do and Do.35 Whereas the latter model is a hybrid one, essentially consisting of a superposition of the n-layer BET and the Sips equation, the present model has only a single term, describing an inter-dependent primary sorption and cluster formation. An analogous consideration refers to a recently published “universal isotherm”.50
The new isotherm is expected to describe the adsorption of strongly polar adsorbates in the pores of a hydrophobic solid where an adsorbate clustering or capillary condensation can occur. The adsorption of water on microporous hydrophobic carbons is an example for that type of interaction, and numerous experiments are found in the literature.
Therefore the new isotherm was applied to such experimental results. The isotherm successfully maps numerous data of the literature, including adsorption–desorption hysteresis. However, the interpretation of the obtained parameters has to be careful. A strong accuracy of the underlying data is mandatory, and the parameters have to be correlated to the results of other characterization methods. The latter is omitted in the present study for carbon-based materials.
In contrast, crystalline aluminophosphate molecular sieves have precisely defined mono-sized micropores beside a heterogeneous mesopore fraction, and the water sorption isotherm has a sigmoidal course. Also in that case the model has been successfully applied.
Nevertheless, experimental data which cannot be covered by the isotherm have been identified. While the present model has only a single parameter for the interaction with the inner porous surface, future work has to consider that interaction in more detail.
Conflicts of interest
There are no conflicts to declare.References
- K. W. S. Sing, Reporting physisorption data for gas/solid systems, Pure Appl. Chem., 1982, 54, 2201–2218 Search PubMed.
- T. Kohler, M. Hinze, K. Müller and W. Schwieger, Temperature independent description of water adsorption on zeotypes showing a type V adsorption isotherm, Energy, 2017, 135, 227–236 CrossRef CAS.
- H. W. B. Teo, A. Chakraborty and W. Fun, Improved adsorption characteristics data for AQSOA types zeolites and water systems under static and dynamic conditions, Microporous Mesoporous Mater., 2017, 242, 109–117 CrossRef CAS.
- S. Cho, D. A. Cha, Y. H. Hwang, O. K. Kwon and T. Hwang, Adsorbent layer for adsorption hat pump prepared with the surface-modified ferroaluminophosphate particles and inorganic silica binder, J. Sol-Gel Sci. Technol., 2016, 80, 297–305 CrossRef CAS.
- Y. D. Kim, K. Thu and K. C. Ng, Adsorption characteristics of water vapor on ferroaluminophosphate, Desalination, 2014, 344, 350–356 CrossRef CAS.
- K. Tsutsumi, K. Mizoe and K. Chubachi, Adsorption characteristics and surface free energy of AlPO4-5, Colloid Polym. Sci., 1999, 277, 83–88 CrossRef CAS.
- A. Nalaparaju, X. S. Zhao and J. W. Jiang, Molecular understanding for the adsorption of water and alcohols in hydrophilic and hydrophobic zeolitic organic frameworks, J. Phys. Chem. C, 2010, 114, 11542–11550 CrossRef CAS.
- L. Liu, S. Tan, T. Horikawa, D. D. Do, D. Nicolson and J. Liu, Water adsorption on carbon. A review, Adv. Colloid Interface Sci., 2017, 250, 64–78 CrossRef CAS PubMed.
- S. Furmaniak, P. A. Gauden, A. P. Terzyk and G. Rychlicki, Water adsorption on carbon - Critical review of the most popular analytical approaches, Adv. Colloid Interface Sci., 2008, 137, 82–143 CrossRef CAS PubMed.
- T. Horikawa, D. D. Do and D. Nicolson, Capillary condensation of adsorbates in porous materials, Adv. Colloid Interface Sci., 2011, 169, 40–58 CrossRef CAS PubMed.
- P. J. Branton, P. G. Hall and K. W. S. Sing, Physisorption of alcohols and water vapor by MCM-41, Adsorption, 1995, 1, 77–82 CrossRef CAS.
- H. Naono, M. Hakuman, T. Tanaka, N. Tamara and K. Nakai, Porous texture and surface character of dehydroxylated and rehydroxylated MCM-41 mesoporous silica. Analysis of adsorption isotherms of nitrogen gas and water vapor, J. Colloid Interface Sci., 2000, 225, 411–420 CrossRef CAS PubMed.
- S. Takahara, S. Kittaka, T. Mori, Y. Kuroda, T. Takamuku and T. Yamagushi, Neutron scattering and dielectric studies on dynamics of methanol and ethanol confinement in MCM-41, J. Phys. Chem. C, 2008, 112, 14385–14393 CrossRef CAS.
- C. Nguyen, C. G. Sonwane, S. K. Bhatia and D. D. Do, Adsorption of benzene and ethanol on MCM-41 material, Langmuir, 1998, 14, 4950–4952 CrossRef CAS.
- J. S. Oh, W. G. Shim, J. W. Lee, J. H. Kim, H. Moon and G. Seo, Adsorption equilibrium of water vapor on mesoporous materials, J. Chem. Eng. Data, 2003, 48, 1458–1462 CrossRef CAS.
- J. W. Lee, W. G. Shim and H. Moon, Adsorption equilibrium and kinetics for capillary condensation of trichloroethylene on MCM-41 and MCM-48, Microporous Mesoporous Mater., 2004, 73, 109–119 CrossRef CAS.
- J. W. Lee, W. G. Shim, M. S. Yang and H. Moon, Adsorption isotherms of polar and non-polar organic compounds on MCM-48, J. Chem. Eng. Data, 2004, 49, 502–509 CrossRef CAS.
- W. G. Shim, J. W. Lee and H. Moon, Heterogeneous adsorption characteristics of volatile organic compounds on MCM-48, Sep. Sci. Technol., 2006, 41, 3693–3719 CrossRef CAS.
- I. M. Klotz, F. M. Walker and R. B. Pivan, The binding of organic ions by proteins, J. Am. Chem. Soc., 1946, 68, 1486–1490 CrossRef CAS PubMed.
- I. M. Klotz, Protein interactions with small molecules, Acc. Chem. Res., 1974, 7, 162–168 CrossRef CAS.
- A. Gürses, C. Doğar, S. Karaca, M. Açikyildiz and R. Bayrak, Production of granular activated carbon from waste and its adsorption characteristics for dye, J. Hazard. Mater., 2006, B131, 254–259 CrossRef PubMed.
- S. Pura and G. Atun, Adsorptive removal of acid blue 113 and tartrazine by fly ash, Sep. Sci. Technol., 2009, 44, 75–101 CrossRef CAS.
- B. Koubaissy, G. Joly, I. Batonneau-Gener and P. Magnoux, Adsorptive removal of aromatic compounds present in waste water by using dealuminated faujasite zeolites, Ind. Eng. Chem. Res., 2011, 50, 5705–5713 CrossRef CAS.
- E. H. Ellison and D. Moodley, The hydrophobic effect as a driving force for solute uptake by dealuminated zeolite Y, Microporous Mesoporous Mater., 2007, 99, 251–260 CrossRef CAS.
- M. M. Dubinin, E. D. Zaverina and V. V. Serpinski, J. Chem. Soc., 1955, 1760–1766 RSC.
- G. Guiochon, S. G. Shirazi and A. Katti, Fundamentals of Preparative and Nonlinear Chromatography, Academic Press, Boston, 1994, p. 74 Search PubMed.
- J. Nowak, K. Gedicke, D. Antos, W. Piątkowski and A. Seidel-Morgenstern, Synergistic effects in competitive adsorption of carbohydrates on an ion-exchange resin, J. Chromatogr. A, 2007, 1164, 224–234 CrossRef CAS PubMed.
- A. O. Malakhov and V. V. Volkov, Cooperative multimolecular sorption equation: application to an alcohol–poly(1-trimethylsiyl-1-propyne) system, Polym. Sci., Ser. A, 2000, 42, 1120–1126 Search PubMed.
- S. W. Rutherford, Modeling water adsorption in carbon micropores: Study of water in carbon molecular sieves, Langmuir, 2006, 22, 702–708 CrossRef CAS PubMed.
- A. Chakraborty and B. Sun, An adsorption isotherm equation for multi-types adsorption with thermodynamic correctness, Appl. Therm. Eng., 2014, 72, 190–199 CrossRef CAS.
- D. D. Do, Adsorption analysis: Equilibria and Kinetics, Imperial College Press, 1998 Search PubMed.
- O. Talu and F. Meunier, Adsorption of associating molecules in micropores and application to water on carbon, AIChE J., 1996, 42, 809–819 CrossRef CAS.
- A. O. Pedersen, B. Hust, S. Andersen, F. Nielsen and R. Brodersen, Laurate binding to human serum albumin, Eur. J. Biochem., 1986, 154, 545–552 CrossRef CAS PubMed.
- D. D. Do and H. D. Do, A model for water adsorption in activated carbon, Carbon, 2000, 38, 767–773 CrossRef CAS.
- D. D. Do, S. Junpirom and H. D. Do, A new adsorption-desorption model for water adsorption in activated carbon, Carbon, 2009, 47, 1466–1473 CrossRef CAS.
- S. Brunauer, P. H. Emmett and E. Teller, Adsorption of gases in multimolecular layers, J. Am. Chem. Soc., 1938, 60, 309–319 CrossRef CAS.
- C. A. Ward and J. Wu, Effect of adsorption on the surface tensions of solid–fluid interfaces, J. Phys. Chem. B, 2007, 111, 3685–3694 CrossRef CAS PubMed.
- M. Caurie, The derivation of the GAB adsorption isotherm from the BDDT adsorption theory, Int. J. Food Sci. Technol., 2006, 41, 173–179 CrossRef CAS.
- R. B. Anderson, Modification of the Brunauer, Emmett and Teller equation, J. Am. Chem. Soc., 1946, 68, 686–691 CrossRef CAS.
- W. Rudzinski and D. H. Everett. Adsorption of Gases on Heterogeneous Surfaces, Academic Press, San Diego, 1992, pp. 391–392 Search PubMed.
- C. Wu, S. H. Zandavi and C. A. Ward, Prediction of wetting condition from the zeta adsorption isotherm, Phys. Chem. Chem. Phys., 2014, 16, 25564–25572 RSC.
- S. Brunauer, L. S. Deming, W. S. Deming and E. Teller, On a theory of van der Waals adsorption of gases, J. Am. Chem. Soc., 1940, 62, 1723–1732 CrossRef CAS.
- S. Furmaniak, P. A. Gauden, A. Terzyk, G. Rychlicki, R. P. Wesolowski and P. Kowalcyk, Heterogeneous Do-Do model of water adsorption on carbons, J. Colloid Interface Sci., 2005, 290, 1–13 CrossRef CAS PubMed.
- B. Sun and A. Chakraborty, Thermodynamic formalism of water uptakes on solid porous adsorbents for adsorption cooling applications, Appl. Phys. Lett., 2014, 104, 201901 CrossRef.
- L. Cossarutto, T. Zimny, J. Kaczmarczyk, T. Siemieniewska, J. Bimer and J. V. Weber, Transport and sorption of water vapor in activated carbons, Carbon, 2001, 39, 2339–2346 CrossRef CAS.
- C. Nguyen and D. D. Do, The Dubinin-Radushkevich equation and the underlying microscopic adsorption description, Carbon, 2001, 39, 1327–1336 CrossRef CAS.
- K. W. S. Sing, F. Rouquerol, P. Llewellyn and J. Rouquerol, Assessment of microporosity, in Adsorption by Powders and Porous Solids, ed. F. Rouquerol, J. Rouquerol, K. W. S. Sing, P. Llewellyn and G. Maurin, Academic Press, 2014, pp. 303–320 Search PubMed.
- Ref. 40, Chapter 4.
- R. Sips, On the structure of catalyst surface II, J. Chem. Phys., 1950, 18, 1024–1026 CrossRef CAS.
- K. C. Ng, M. Burhan, M. W. Shahzad and A. B. Ismail, A universal isotherm model to capture adsorption uptake and energy distribution of porous heterogeneous surface, Sci. Rep., 2017, 7, 10634 CrossRef PubMed.
- I. Langmuir, The adsorption of gases on plane surfaces of glass, mica, and platinum, J. Am. Chem. Soc., 1918, 40, 1361–1403 CrossRef CAS.
- R. Alfonso, L. Gales and A. Mendes, Kinetic derivation of common isotherm equations for surface and micropore adsorption, Adsorption, 2016, 22, 963–971 CrossRef.
- M. Llano-Restrepo and M. Mosquera, Accurate correlation, thermo-chemistry, and structural interpretation of equilibrium adsorption isotherms of water vapor in zeolite 3A by means of a general statistical thermodynamic adsorption model, Fluid Phase Equilib., 2009, 283, 73–88 CrossRef CAS.
- R. Fowler and E. A. Guggenheim, Statistical thermodynamics, Cambridge University Press, 1955, p. 433 Search PubMed.
- T. L. Hill, An Introduction to statistical thermodynamics, Addison Wesley, 1960, p. 134 Search PubMed.
- M. Khalaoui, S. Knani, M. A. Hachida and A. Ben Lamine, New theoretical expressions for the five adsorption type isotherms classified by BET based on statistical thermodynamics, J. Colloid Interface Sci., 2003, 263, 350–356 CrossRef.
- W. H. Press, B. P. Flannery, S. A. Teukolsky and W. T. Vetterling, Numerical recipes, Cambridge University Press, 1986 Search PubMed.
- I. N. Bronshtein, K. A. Semendyayev and G. Musiol, Handbook of Mathematics, Springer, 2015 Search PubMed.
- The Transforms and Applications Handbook, ed. A. D. Poularikas, CRC-Press, 1996, p. 1022 Search PubMed.
- M. Neitsch, W. Heschel and M. Suckow, Water vapor sorption by activated carbon: a modification of the isotherm model of Do and Do, Carbon, 2001, 39, 1421–1446 CrossRef.
- S. W. Rutherford, Probing the mechanism of water adsorption in carbon micropores with multi-temperature isotherms and water pre-adsorption experiments, Langmuir, 2006, 22, 9967–9975 CrossRef CAS PubMed.
- J. Alcañiz-Monge and D. Lozano-Castelló, Assessment of ultra-microporosity on carbon molecular sieves by water adsorption, Adv. Sci. Technol., 2003, 21, 841–848 Search PubMed.
- J. Alcañiz-Monge, A. Linares-Solano and B. Rand, Water adsorption on activated carbons: study of water adsorption in micro- and mesopores, J. Phys. Chem. B, 2001, 105, 7998–8006 CrossRef.
- N. Naono, M. Hakuman, M. Shimoda, K. Nakai and S. Kondo, Separation of water and ethanol by the adsorption technique: Selective desorption of water from micropores of activated carbon, J. Colloid Interface Sci., 1996, 182, 230–238 CrossRef.
- L. Sarkisov, A. Centineo and S. Brandani, Molecular simulation and experiments of water adsorption in a high surface area activated carbon. Hysteresis, scanning curves and spatial organization of water clusters, Carbon, 2017, 118, 127–138 CrossRef CAS.
- K. Lászlo, O. Czakkel, G. Dobos, P. Lodewyckx, C. Rochas and E. Geissler, Water vapor adsorption in highly porous carbons as seen by small and wide angle X-ray scattering, Carbon, 2010, 48, 1038–1048 CrossRef.
- E. O. Wiig and A. J. Juhola, The adsorption of water vapor on activated charcoal, J. Am. Chem. Soc., 1949, 71, 561–568 CrossRef CAS.
- M. C. Campo, S. Largosse, F. D. Magalhães and A. Mendes, Comparative study between a CMC membrane and a CMS adsorbent. Water vapor adsorption and surface chemistry, J. Membr. Sci., 2010, 346, 26–36 CrossRef CAS.
- H. Ito, T. Iiyama and S. Ozeki, Kinetics of cluster-mediated filling of water molecules into carbon micropores, J. Phys. Chem. C, 2015, 119, 4118–4124 CrossRef CAS.
- F. Carrasco-Marin, A. Mueden, T. A. Centeno, F. Stoeckli and C. Moreno-Castilla, Water adsorption on activated carbon with different degrees of oxidation, J. Chem. Soc., Faraday Trans., 1997, 93, 2211–2215 RSC.
- M. G. Plaza, A. S. González, C. Pevida and F. Rubiera, Influence of water vapor on CO2 adsorption using a biomass-based carbon, Ind. Eng. Chem. Res., 2014, 53, 15488–15499 CrossRef CAS.
- M. Nakamura, T. Ohba, P. Branton, H. Kanoh and K. Kaneko, Equilibrium-time and pore with dependent hysteresis of water adsorption isotherm on hydrophobic microporous carbon, Carbon, 2010, 48, 305–312 CrossRef CAS.
- F. Stoeckli, T. Jakubov and A. Lavanchi, Water adsorption in active carbons described by the Dubinin–Astakhov equation, J. Chem. Soc., Faraday Trans., 1994, 90, 783–786 RSC.
- S. Junpirom, C. Tangsathikulchai, M. Tangsathikulchai and Y. Ngernyen, Water adsorption in activated carbons with different burn-offs and its analysis using a cluster model, Korean J. Chem. Eng., 2008, 25, 825–832 CrossRef CAS.
- A. Li, Experimental and theoretical studies on the heat transfer enhancement of adsorbent coated heat exchangers, PhD thesis, National University of Singapore, 2014, pp. 268–269 Search PubMed.
- N. Sugiura, Further analysis of the data by Akaike's information criterion and the finite correction, Comm. Statist. A., 1978, 7, 13–26 CrossRef.
- K. P. Burnham and D. D. Anderson, Model selection and multimodal interference: A practical information-theoretic approach, Springer, 2002, p. 63 Search PubMed.
- K. S. W. Sing, Assessment of surface area by gas adsorption, in Adsorption by Powders and Porous Solids, ed. F. Rouquerol, J. Rouquerol, K. S. W. Sing, P. Llewellyn and G. Murin, Elsevier, 2014, ch. 7 Search PubMed.
- U. Buck, C. C. Pradzynski, T. Zeuch, J. M. Dieterich and B. Hartke, A size resolved investigation of large water clusters, Phys. Chem. Chem. Phys., 2014, 16, 6859–6871 RSC.
- M. Nishi, T. Ohkubo, K. Urita, I. Moriguchi and Y. Kuroda, Experimental information on the adsorbed phase of water formed in the inner pore of single-walled carbon nano-tube itself, Langmuir, 2016, 32, 1058–1064 CrossRef CAS PubMed.
- J. Hernández-Rojas, F. Calvo, J. Bretón and J. M. Gomez Llorente, Confinement effects on water clusters inside carbon nano-tubes, J. Phys. Chem. C, 2012, 116, 17019–17028 CrossRef.
- J. Bahadur, C. I. Contescu, D. K. Rai, N. C. Gallego and Y. B. Melnichenko, Clustering of water molecules in ultra-microporous carbon: In-situ small-angle neutron scattering, Carbon, 2017, 111, 681–688 CrossRef CAS.
- M. Donohue and G. L. Aranovich, Adsorption hysteresis in porous solids, J. Colloid Interface Sci., 1998, 205, 121–130 CrossRef CAS PubMed.
- A. Wongkoblap and D. D. Do, The effects of curvature and surface heterogeneity on the adsorption of water in finite length carbon nanopores: a computer simulation study, J. Mol. Phys., 2008, 106, 627–641 CrossRef CAS.
- T. Ohba, S. Yamamoto, T. Kodaira and K. Hata, Changing water affinity from hydrophobic to hydrophilic in hydrophobic channels, Langmuir, 2015, 31, 1058–1063 CrossRef CAS PubMed.
- Structure commission of the International zeolite Association. Database of zeolite structures, 2017, http://europe.iza-structure.org/IZA-SC/ftc_table.php.
Footnote |
| † Electronic supplementary information (ESI) available. See DOI: 10.1039/c8cp07751g |
| This journal is © the Owner Societies 2019 |


