
 Open Access Article
 This Open Access Article is licensed under a
 Creative Commons Attribution 3.0 Unported Licence
Stability of metallo-porphyrin networks under oxygen reduction and evolution conditions in alkaline media†
Diana
Hötger
a,
Markus
Etzkorn‡
a,
Claudius
Morchutt
ab,
Benjamin
Wurster
a,
Jan
Dreiser
 c,
Sebastian
Stepanow
d,
Doris
Grumelli
e,
Rico
Gutzler
*a and
Klaus
Kern
ab
c,
Sebastian
Stepanow
d,
Doris
Grumelli
e,
Rico
Gutzler
*a and
Klaus
Kern
ab
aMax Planck Institute for Solid State Research, 70569 Stuttgart, Germany. E-mail: r.gutzler@fkf.mpg.de
bInstitute de Physique, Ecole Polytechnique Fédérale de Lausanne, 1015 Lausanne, Switzerland
cSwiss Light Source, Paul Scherrer Institute, 5232 Villigen PSI, Switzerland
dDepartment of Materials, ETH Zürich, 8093 Zürich, Switzerland
eInstituto de Investigaciones Fisicoquímicas Teóricas y Aplicadas (INIFTA), Facultad de Ciencias Exactas, Universidad Nacional de La Plata, CONICET, 1900, La Plata, Argentina
First published on 11th January 2019
Abstract
Transition metal atoms stabilised by organic ligands or as oxides exhibit promising catalytic activity for the electrocatalytic reduction and evolution of oxygen. Built-up from earth-abundant elements, they offer affordable alternatives to precious-metal based catalysts for application in fuel cells and electrolysers. For the understanding of a catalyst's activity, insight into its structure on the atomic scale is of highest importance, yet commonly challenging to experimentally access. Here, the structural integrity of a bimetallic iron tetrapyridylporphyrin with co-adsorbed cobalt electrocatalyst on Au(111) is investigated using scanning tunneling microscopy and X-ray absorption spectroscopy. Topographic and spectroscopic characterization reveals structural changes of the molecular coordination network after oxygen reduction, and its decomposition and transformation into catalytically active Co/Fe (oxyhydr)oxide during oxygen evolution. The data establishes a structure–property relationship for the catalyst as a function of electrochemical potential and, in addition, highlights how the reaction direction of electrochemical interconversion between molecular oxygen and hydroxyl anions can have very different effects on the catalyst's structure.
Introduction
Oxygen reduction and oxygen evolution reaction (ORR and OER) are two crucial chemical processes in devices like fuel cells, electrolysers and metal–air batteries. They are accompanied by sluggish reaction kinetics and optimizing catalysts for OXR (X = R, E) remains a highly topical research subject. In particular a catalytic material for rechargeable metal–air batteries needs to be bifunctional for both ORR and OER, as charging and discharging occur at the same electrode.1,2 Starting with the work of Jasinski,3 macrocyclic molecules such as metallo-porphyrins and phthalocyanines have been investigated for ORR4–7 and OER,8–13 see e.g.ref. 14 for a review. For these molecules, catalytic activity is driven to a large degree by the metal centre embedded in the organic macrocycle, whereas the organic part helps to stabilise single (transition metal) cations and prevent their clustering into larger aggregates. Most of these studies use molecules as homogenous catalysts yet few address the structural integrity of the macrocycle under reaction conditions. Improving the stability of molecular water oxidation catalysts remains a highly topical research field.15 In the case of heterogeneous catalysts, it can be shown by using in situ scanning tunnelling microscopy (STM) under electrochemical (EC) potential control that the macrocycles persist intact during ORR, although no unambiguous information on the fate of the catalytically active metal centre is provided.7,16–20 Further studies address the adsorption of molecular oxygen on the metal centres on the molecular scale17,18,20 to achieve a deeper understanding of metal–organic structures as heterogeneous catalysts.21 However, stable catalytic performance and structural stability of the catalyst are not always correlated. In the following, we will show that catalytic activity can persist while the catalyst itself undergoes major structural modification during OXR. The reaction direction of the redox process O2 + 2H2O + 4e− ⇌ 4OH−, where the left pointing arrow is OER and the right pointing arrow is ORR, has a marked effect on the stability of the catalyst, i.e. the reaction direction governs whether the catalyst is stable or not. We approach the issue of catalyst stability of a heterogeneous electrocatalyst consisting of an iron porphyrin decorated Au(111) surface in presence of co-adsorbed cobalt using topographic characterization through scanning tunnelling microscopy and spectroscopic characterization through X-ray absorption spectroscopy (XAS). Real-space imaging using STM grants insight into the catalyst's morphology at the molecular scale as a function of catalytic performance. Spectroscopic data provides complementary chemical information in particular on the chemical environment of the transition metal atoms. This OXR active material13 is investigated before and after several cycles of ORR and OER, allowing insight into the structural integrity of the catalyst pre and post electrocatalysis.Methods
STM images and corresponding EC data were recorded using a home-built ultra-high vacuum (UHV) chamber with an integrated STM and a transfer system to the electrochemical cell.22 Sample preparation was carried out entirely in UHV. The Au(111) single crystal was cleaned by repeating cycles of Ar+ sputtering and thermal annealing at 825 K for 10 min to achieve clean and flat terraces with the typical herringbone reconstruction. The self-assembled molecular network was prepared by subliming 5,10,15,20-tetra(4-pyridyl)-21H,23H-porphyrin iron(III) chloride (FeTPyP) (Frontier Scientific) at 744 K from a Knudsen cell on the clean Au(111) substrate for 35 min to achieve monolayer coverage. During deposition the substrate was held at room temperature. For the bimetallic network cobalt (Goodfellow, purity 99.9%) was deposited onto FeTPyP/Au(111) held at 523 K using an electron beam evaporator. The Au(111) single crystal surface with the bimetallic metal–organic monolayer served as working electrode in electrocatalysis experiments in a hanging meniscus configuration, whereby only the {111} facet of the crystal is exposed to the electrolyte. Additional details on the experimental set-up can be found elsewhere.22 After establishing a 1 bar Ar atmosphere in a transfer chamber, the sample is transferred to the electrochemical cell likewise pressurized to 1 bar with Ar. ORR and OER were performed in 0.1 M NaOH solution, either O2 or Ar saturated; an Ag/AgCl (3 M KCl) electrode served as reference electrode and a Pt wire as counter electrode. All electrochemical potentials are referred to Ag/AgCl (3 M KCl). Sample preparation and EC measurements are akin to those reported in ref. 13.The FeTPyP + Co layer on Au(111) served as ORR catalyst (working electrode). Characterization of the stability was investigated after ten linear sweep voltammograms (LSV) from +0.1 V to −0.5 V with a scan rate of 50 mV s−1. For OER, a new sample of FeTPyP + Co on Au(111) served as working electrode for ten full range cyclic voltammograms (CVs) from −1.2 V to +0.7 V, also at a scan rate of 50 mV s−1. Prior to the electrochemical experiments the sample surface is characterized by STM at room temperature for real-space information on the catalyst structure, and with XAS for chemical characterization. After EC, samples were rinsed with milliQ water (R = 18.2 MΩ) to wash off most of the remaining electrolyte residues, and were then transferred back to the STM. Images were analysed using WsXM.23 In a second step, the samples were transported in a vacuum suitcase to the X-Treme beamline24 (Swiss Light Source, Paul Scherrer Institute, Villigen, Switzerland) for characterization by XAS. X-ray absorption spectra were recorded at 300 K with linear horizontal (σh) or linear vertical (σv) polarization and background subtraction was performed. The XAS were normalized to the integral of the corresponding spectrum. X-ray linear dichroism (XLD) spectra are calculated by taking the difference between two linearly polarized spectra (σv–σh) and normalized to the integral of the corresponding XAS  . The experimental incidence geometry of the X-rays was 60° from the surface normal and the spectra were recorded in total electron yield. A negligibly small magnetic field of 50 mT was applied, assisting the electrons in leaving the surface and thereby increasing the signal-to-noise ratio of the measured drain current. The Fe/Co ratio was estimated comparing the area of the Fe and Co XAS weighted by the respective number of holes in the d-shell; other parameters such as differences in X-ray absorption cross-section were not taken into account. Chemical and structural integrity of the FeTPyP + Co catalyst was investigated after ten linear sweep voltammograms (LSVs) driving ORR (+0.1 V to −0.5 V, scan rate 50 mV s−1) and ten full range cyclic voltammograms (CVs) (−1.2 V to +0.7 V, scan rate 50 mV s−1) driving OER.
X-ray photoelectron spectroscopy (XPS) was performed using a SPECS Phoibos 150 analyzer with a non-monochromatic Mg Kα source (hν = 1253.6 eV). Signals were fitted using a Gaussian after subtracting the measured background of the clean sample.
Results and discussion
FeTPyP + Co assembles spontaneously into ordered monolayers with a distance of ∼1.5 nm between two molecules on a square grid (Fig. 1). The porphyrin molecules lie flat on the surface with their central Fe atom exposed to the surface. The Cl− anion binding to the Fe centre in the solid state powder desorbs during sample preparation.13 This leaves the Fe centre undercoordinated and accessible as catalytically active site for OXR. The deposition of Co to the FeTPyP layer leads to a partial exchange of the Fe in the macrocycle with Co,25 yielding a mixed bimetallic network with Fe and Co coordinated within the macrocycle as well as coordinated to the peripheral pyridyl groups on the molecule.13 The transmetalation occurs as a spontaneous process at room temperature during the deposition of Co onto FeTPyP. Co impinging onto the porphyrin macrocycle replaces Fe in its coordination environment driven by a lower final energy of CoTPyP with Fe resting between molecule and Au(111) substrate. This redox transmetalation is described in detail in ref. 25 and has been reported for porphyrins,26 phthalocyanines,27 and pyrphyrins.28 | ||
| Fig. 1 (a) STM image of FeTPyP + Co monolayer, Itunnel = 0.29 nA, Ubias = −708.7 mV; (b) STM image with higher magnification and superimposed model. Color code: Fe/Co (green), C (black), N (blue), H (white). | ||
The polarization curve of FeTPyP + Co/Au(111) catalysing ORR is depicted in Fig. 2a. The on-set potential of ORR is −0.08 V resulting in a peak potential Ep of about −0.19 V. Similar overpotentials for the same current densities are reported for Fe/Co conjugated microporous porphyrin polymer electrocatalysts for ORR in acidic media.29 After 10 LSVs in 0.1 M NaOH O2 saturated electrolyte, STM images depict major structural changes of the FeTPyP + Co network after ORR (Fig. 2b). The order of the monolayer is largely disrupted leading to a disordered appearance in the STM image. The molecules remain adsorbed on the Au(111) surface under reaction conditions, but reassemble in non-crystalline monolayers. Only a few small domains retain the squared structure typical for preEC FeTPyP + Co (yellow circle in Fig. 2b). Moreover, initial cluster formation with a size of about (6 ± 2) nm is visible (orange arrow). Additional 100 LSVs leave the catalytic activity unaltered but lead to more apparent disorder in STM images (Fig. S1, ESI†) and increased cluster formation.
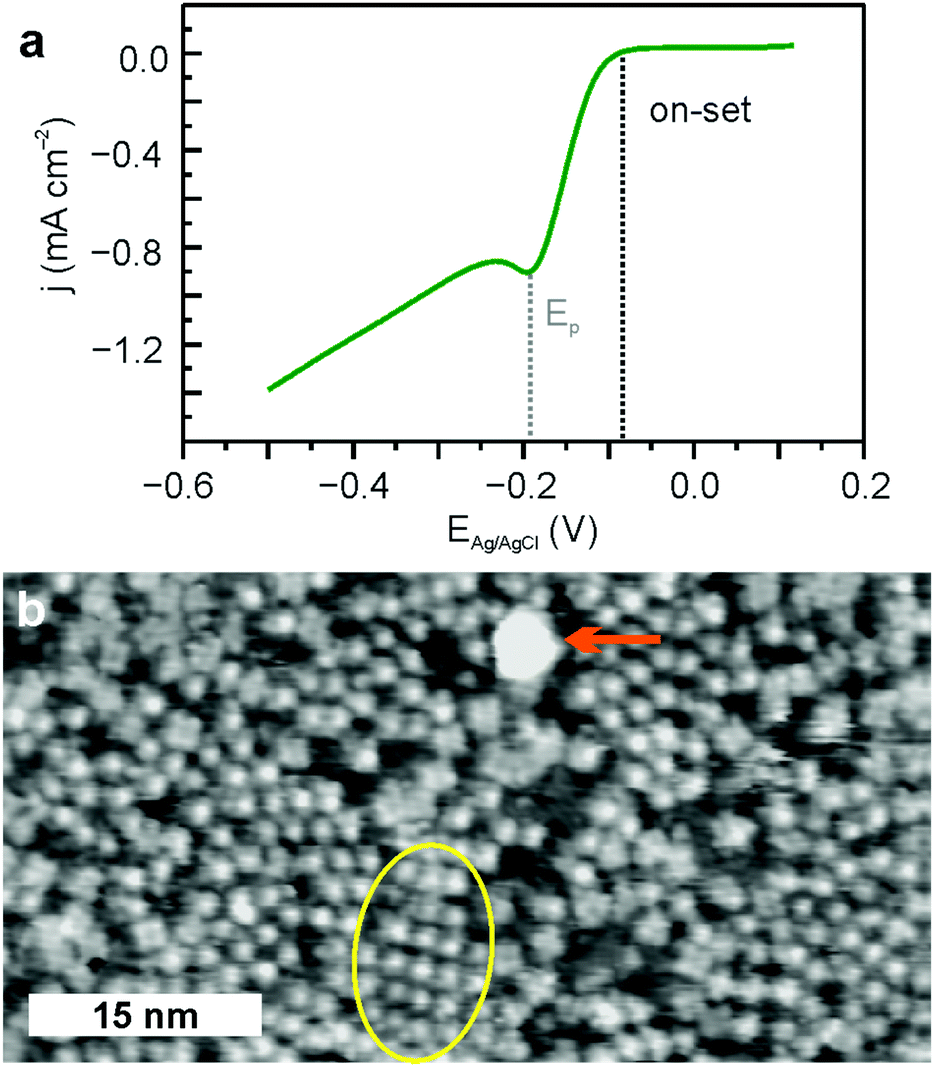 | ||
| Fig. 2 (a) LSV of FeTPyP + Co for ORR; 0.1 V to −0.5 V; 50 mV s−1 in 0.1 M NaOH, O2 saturated solution; (b) STM image postORR, Itunnel = 0.23 nA, Ubias = 1.2 V. Yellow oval: remains of the square molecular structure surrounded by a disordered arrangement of molecules, orange arrow: cluster. | ||
A completely different picture arises during the anodic branch of OER. The on-set potential of OER is ∼0.6 V and unlike the oxygen reduction the process is not diffusion limited (Fig. 3a). The cathodic cycle demonstrates ORR onset at −0.10 V with a peak position of −0.22 V. Both the on-set potential and the peak position are slightly more negative compared to the experiment focusing exclusively on ORR. Whereas the catalytic activity of FeTPyP + Co persists for >10 CVs,13 the FeTPyP + Co/Au(111) surface structure changes considerably during OER (Fig. 3b, see Fig. S2 in ESI,† for a non-3D version of the STM topograph). After 10 CVs, no molecules can be resolved and part of the surface is covered with islands with a lateral extension of the order of tens of nanometres and an average height of about 4 Å (Fig. 3c). These islands exhibit a rather rough basal plane and appear structurally similar to the (oxyhydr)oxide nanoislands formed during OER with CoO nanoislands on Au(111),30 which agrees well with the almost identical on-set potential of ∼0.6 V for OER for both structures. The remaining surface shows the typical reconstruction of the clean Au(111) surface (Fig. 3b).
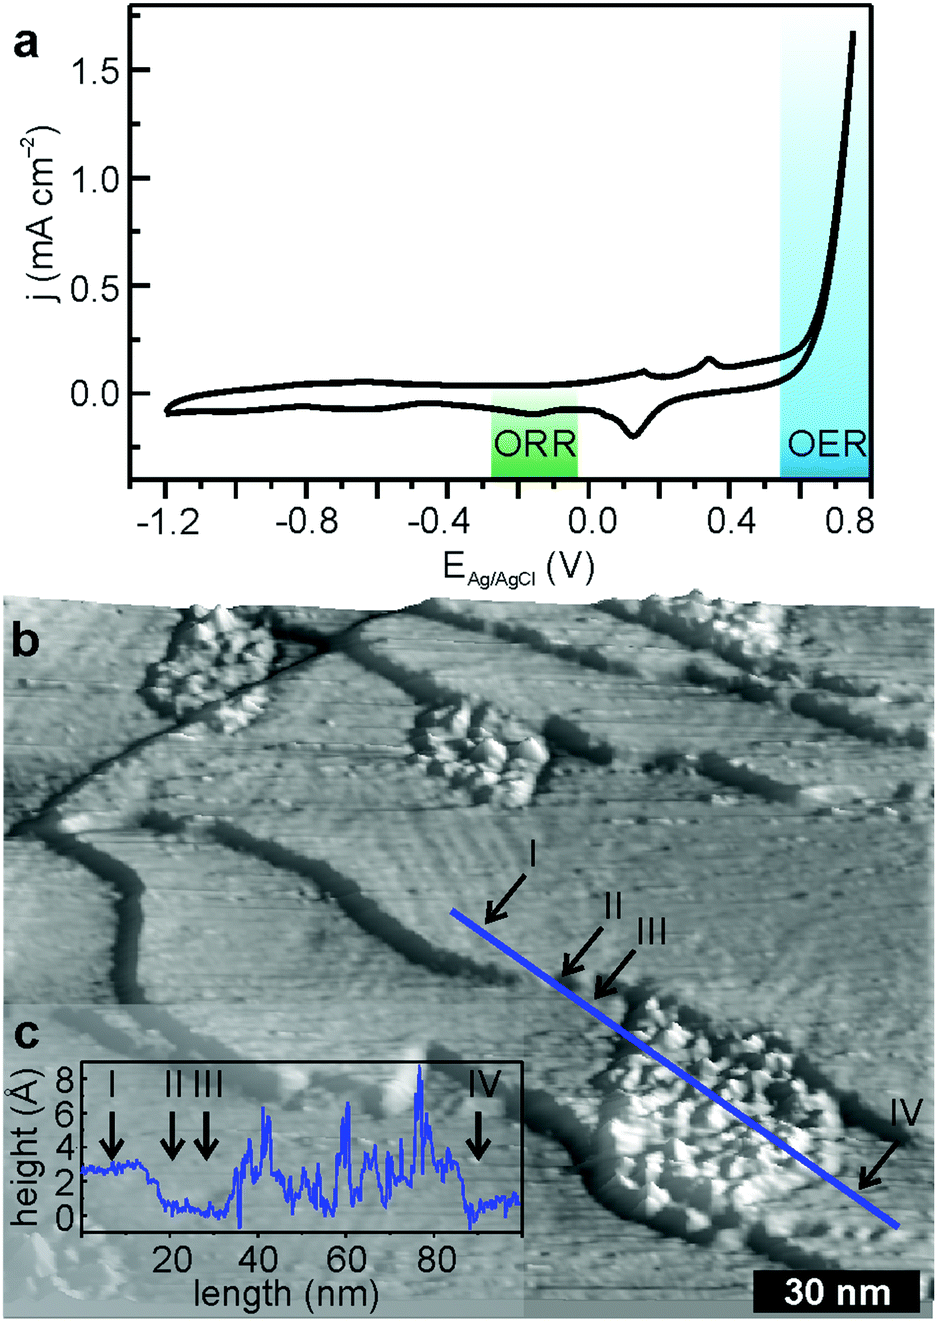 | ||
| Fig. 3 Potential induced changes of FeTPyP + Co after 10 full CVs. (a) CV driving OER of FeTPyP + Co; −1.2 V to 0.75 V; 50 mV s−1 in 0.1 M NaOH, Ar saturated solution; (b) STM image postOER, Itunnel = 0.23 nA, Ubias = 1.3 V; (c) height profile of the blue line across an oxide island in (b). | ||
In order to disentangle the contributions to catalytic performance we studied OXR for the separate systems FeTPyP, CoTPyP and Co, always with a clean Au(111) surface as support. The ORR voltammetry is shown in Fig. 4a, where the grey dashed curves are clean Au(111) and free-base porphyrin (H2TPyP) are depicted as reference. Au(111) shows a higher ORR activity compared to the H2TPyP monolayer, possibly because the ORR inactive molecules block catalytically active sites of the clean gold surfaces such as step edges and other defects. ORR activity is increased by the presence FeTPyP, CoTPyP and by Co, which clusters at the elbow sites of the Au(111) herringbone reconstruction. The turquoise polarization curve of CoTPyP shows the highest ORR activity in particular in the reduction peak around ∼−0.2 eV. FeTPyP compares slightly worse and show a much broader reduction signal. The same is observed for Co. This observation is in accord with expected higher ORR activity of Co-porphyrins compared to Fe-porphyrins.31,32 However, O2 is expected to be reduced using two electrons to peroxide on Co-porphyrin and using four electrons to water on Fe-porphyrin.32,33 By comparison of these curves to the ORR curve of FeTPyP + Co in Fig. 2a it becomes apparent that ORR activity of FeTPyP + Co resembles that of CoTPyP, created during Co deposition. The characteristic curve shape of CoTPyP with the pronounced reduction peak masks the broad contributions of FeTPyP and Co, which nevertheless contribute to overall catalytic activity.
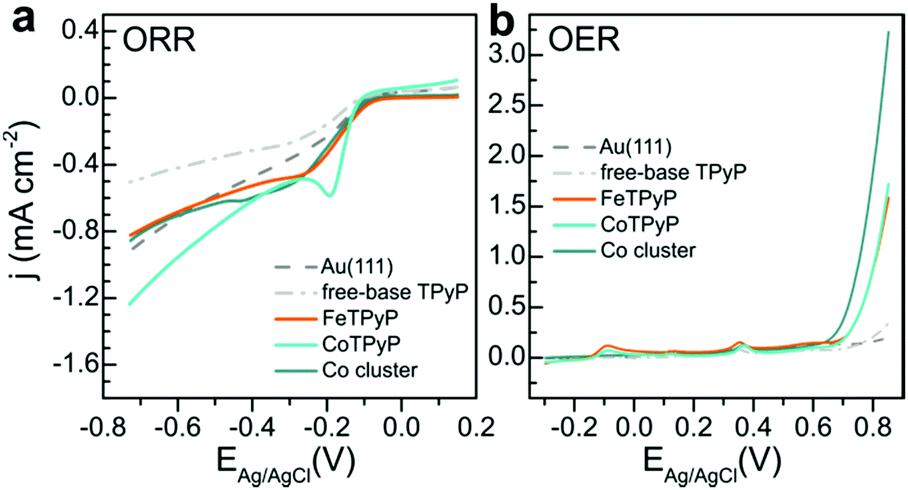 | ||
| Fig. 4 OXR activity of the single constituents of the FeTPyP + Co catalyst. (a) ORR, 50 mV s−1 in 0.1 M NaOH, O2 saturated solution, (b) OER, 50 mV s−1 in 0.1 M NaOH, Ar saturated solution. | ||
The OER voltammetry in Fig. 4b provides a somewhat different picture and was studied in detail in ref. 13. Again, clean Au(111) and the H2TPyP covered surface exhibit the smallest catalytic activity. FeTPyP and CoTPyP are much more OER active above 0.6 V, with very similar activity.13 Co is the more active catalyst.
The structural changes during OXR observed in STM are chemically further analysed using XAS. Just like the Fe L2,3-edge preEC FeTPyP + Co (Fig. 5a, grey), the postORR FeTPyP + Co signal lacks a clear multiplet structure (red), indicative of the metallic state of Fe.34 The predominantly metallic Fe L2,3-edge is traced back to a partial exchange of the central Fe atom by co-deposited Co: the coordinated Fe in the macrocycle shows a somewhat more defined XAS with a shoulder at lower energy. This is masked by the Fe that is expulsed from the porphyrin macrocycle, which sits between molecule and Au(111) substrate and exhibits a featureless XAS signal due to the missing ligand field provided by the pyrrolic nitrogen.25 The resulting weak XLD signal is further reduced after ORR (Fig. 5b), presumably due to the reorganisation into disordered structures that do not allow Fe or Co coordination at the peripheral pyridyl groups. In contrast, the XAS Co L2,3-edge shows a multiplet structure both preEC (Fig. 5c, grey) and postEC (blue), which clearly demonstrates the exposure of Co to a coordinative environment,25,35 provided either within the porphyrin macrocycle or by the pyridyl nitrogen. The main peak is located at 776.6 eV, the second peak lies at 778.5 eV, whereas a spectrum lacking a multiple structure with one maximum at ∼777.9 eV is expected for metallic Co.36 The signal does change slightly postORR, however, the XLD remains unchanged (Fig. 5d). The minor differences can be explained by the use of different samples with ratios of Co/Fe ≈ 4.1 preORR and Co/Fe ≈ 1.2 postORR. The larger abundance of Co gives rise to a larger fraction of Co in a metallic environment. Therefore, the metallic contribution to the XAS spectrum that lacks a fine structure is enhanced, which explains the modified ratio of the double peak. XLD at the N K-edge (Fig. S3, ESI†) confirms that the organic backbone of the molecules is intact. The shape of the XLD of monometallic TPyP and the sample exposed to ORR are similar, confirming that the molecules are lying planar on the surface. The obvious structural changes between the pristine and postORR network observed in STM are accompanied by only minor changes in XAS. The absence of major changes in XAS together with the appearance of porphyrin molecules in STM confirms that the catalyst for ORR is indeed the intact FeTPyP/CoTPyP molecule with possible contributions from Co. The absence of order observed in STM of postEC FeTPyP + Co results from perturbed intermolecular interactions between porphyrin molecules during ORR and also from the rupture of metal–pyridyl coordination bonds, which otherwise stabilise the square structure. Increasing the number of LSVs (Fig. S1, ESI†) shows further reorganisation of the catalyst. While STM images after 1 and 11 LSVs are comparable, the catalyst surface changes significantly after 111 LSVs. Although the amount of molecules appears significantly reduced and clusters are forming, the electrocatalytic current density varies only slightly over the number of repetitions, leaving on-set and peak potentials (−0.08 V and −0.19 V) unchanged. The appearance of larger clusters in STM could be a consequence of agglomeration of the molecules and Co centres, but might as well be residues from the electrolyte which might not have been removed completely during the rinsing procedure. These clusters could hence incorporate sodium atoms and hydroxyl groups (see discussion of XPS data further down).
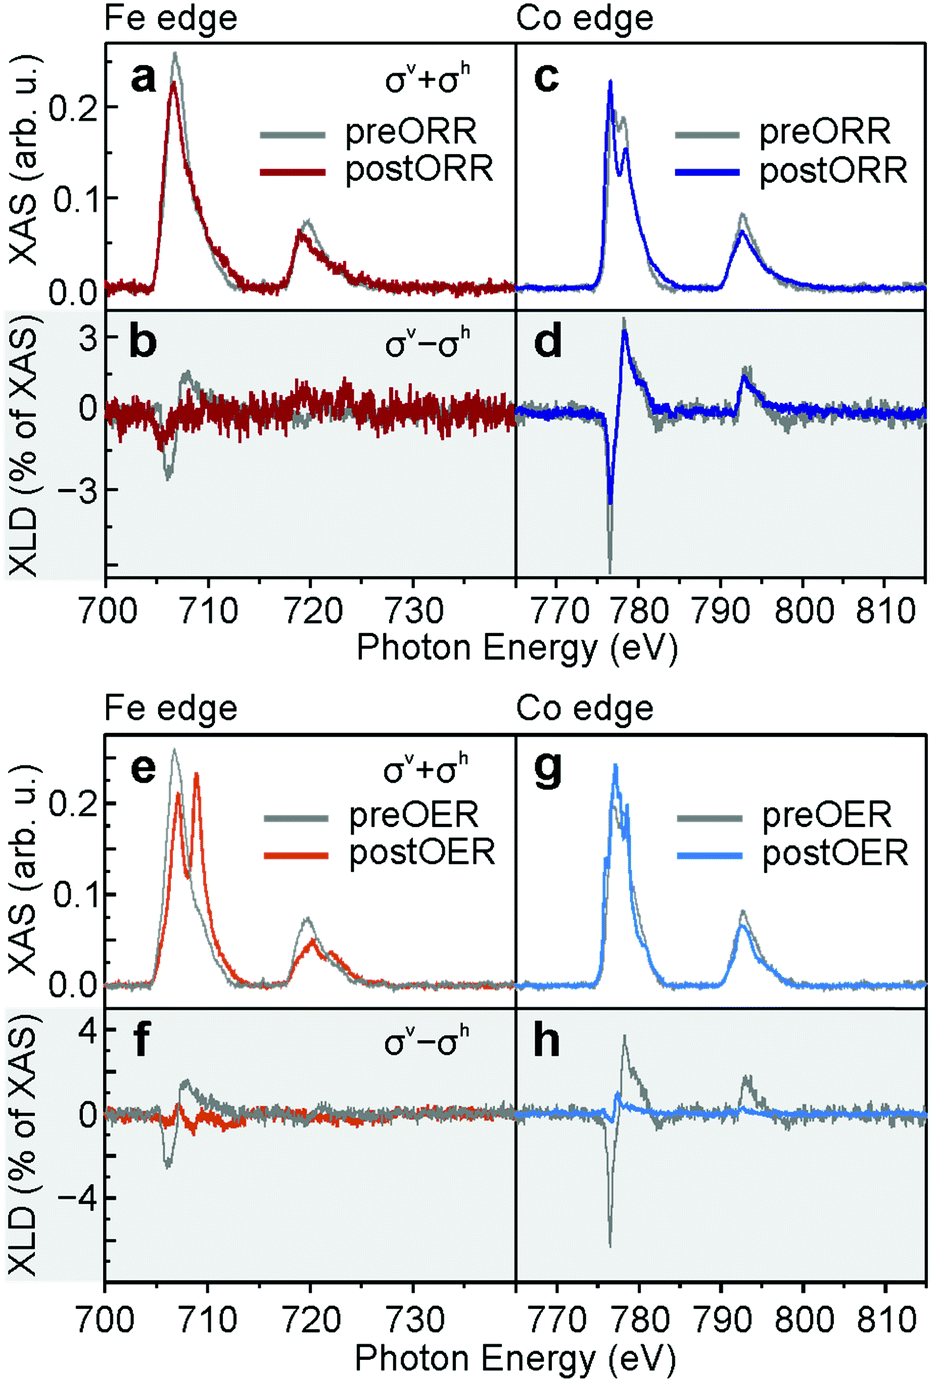 | ||
| Fig. 5 (a) Fe L2,3-edges of FeTPyP + Co before ORR (grey) and after ORR (red) and (b) corresponding XLD; (c) Co L2,3-edges of FeTPyP + Co before ORR (grey) and after ORR (blue) and (d) corresponding XLD; (e) Fe L2,3-edges of FeTPyP + Co before OER (grey) and after OER (light red); (f) corresponding XLD; (g) Co L2,3-edges of FeTPyP + Co before OER (grey) and after OER (light blue) and (h) corresponding XLD. | ||
XAS provides a different picture for the fate of the molecular catalyst after OER (Co to Fe ratio ≈ 2.3). In contrast to the Fe L2,3-edges of pristine FeTPyP + Co and postORR, the Fe L2,3-edge postOER consists of two peaks at L3 almost equal in intensity at 707.1 eV and 708.9 eV (Fig. 5e, light red). The multiplet structure is clearly replicated in the L2 peak at 720.2 eV and 722.0 eV. This multiplet structure is quite similar to spectra typically reported for Fe oxide,37–39 with a rather large first peak that can be explained by the presence of metallic Fe, for example as edge atoms in the island which are not fully oxidized. The exact nature of the oxide is difficult to extract from XAS: the spectra of hematite (α-Fe2O3), goethite (α-FeO(OH)) and akaganeite (β-FeO(OH)) are very similar and difficult to differentiate from maghemite (γ-Fe2O3) or ferrihydrite.40 Since they are in qualitative agreement with the here measured XAS, any of these phases or a combination there of can explain the XAS. We can exclude, however, the formation of magnetite (Fe3O4) and wüstite (FeO), which are characterized by an absence of the defined multiplet splitting.40 The very small XLD is a result of an isotropic chemical environment or a result of randomly oriented Fe oxide clusters (Fig. 5f, light red). Moreover, three peaks can be identified in the XAS L3 Co absorption edge at 776.0 eV, 777.2 eV and 778.6 eV (Fig. 5g, light blue). This multiplet structure is typically assigned to oxidized Co in CoO.36 A minor XLD signal is present but shifted with respect to the pristine network (Fig. 5h, light blue). The multiplet structure of both Co and Fe edges deviate from the XAS of preEC (grey) and postORR and show oxidized Fe and Co, which confirms the interpretation of the 2D islands observed in STM postOER (Fig. 3b) as mixed cobalt/iron (oxyhydr)oxide. The absence of an N K-edge XLD postOER (Fig. S3, ESI†) evidences the chemical decomposition of the molecular structure, but alternatively could also be the result of a random orientation of the porphyrin plane with respect to the surface. The stable electrocatalytic current over several CVs implies that the morphological and chemical change from bimetallic-organic network into oxide islands occurs before actually driving OER. Morphological changes in STM are observable already after applying moderate positive potentials at which OER is just setting in (Fig. S4, ESI†). Untangling the connection between catalytic activity and morphology of the catalyst is thus straight forward: it is Co/FeOx, possibly in the form of (oxyhydr)oxides incorporating minor parts of carbon and nitrogen from the porphyrin core, which serves as catalyst for OER in the anodic branch. This is confirmed by the recently observed conversion of different Co-porphyrins into CoOx on an FTO glass electrode during OER.41 ORR in the cathodic branch is likewise catalysed by the oxide islands and not like in the pure ORR experiment by the molecular network. The small differences in on-set and peak potential of ORR show that the molecular network is the slightly better catalyst. The mechanism by which Fe and Co atoms are extracted from the porphyrin remains elusive. The TPyP molecules possibly decompose due to oxidative cleavage during OER, possibly through the interaction with highly reactive singlet oxygen,42 and organic fragments partially leach into the electrolyte. Interestingly, nature found ways to protect photosystem II from singlet oxygen generated during photochemical water oxidation with the help of sacrificial reductants,43 and rational catalyst design tackles the task of improving singlet oxygen resistance.42 Alternatively, gold oxidation, which sets in at around at 0.3 V, might induce molecular decomposition. The metal centres remain on the surface and cluster into catalytically active possibly (oxyhydr)oxide nanoislands.
As described above, STM evidences the appearance of clusters on the surface after ORR (Fig. 2b and Fig. S1d, ESI,† orange arrows) and also after OER (Fig. S4c, ESI,† orange arrows, and ref. 13). These are speculated to originate from residues of the electrolyte, which despite thorough rinsing after EC with pure water are not completely removed. XPS of the O 1s and Na 1s core levels shows pronounced peaks with binding energy maxima at 531.9 eV and 1071.8 eV for O 1s and Na 1s, respectively (Fig. 6). These signals have been observed for samples after EC in NaOH irrespective of electrocatalytic process (ORR, OER, also hydrogen evolution) and for different catalysts on Au(111). The O 1s peak at ∼532 eV can be attributed to adsorbed hydroxyls.44,45 The peak position of 1071.8 eV of Na 1s sits just between the expected values of metallic Na at 1071.76 eV and NaOH at 1072.59 eV.46 Submonolayer coverage of Na on Ru places the 1s signal at ∼1072 eV,47 which agrees well with the binding energy found here. The presence of electrolyte residues on the surface is confirmed by XPS and can explain the appearance of the cluster in STM. Whether they sit on top of the FeTPyP + Co catalyst, or displaced the molecules and sit directly on the bare gold surface, escapes the resolution of our STM images due to the challenging imaging conditions after electrochemistry.
 | ||
| Fig. 6 (a) O 1s core level energy of FeTPyP + Co before (grey) and after EC (blue). Inset: Fitted peak after background subtraction. (b) Na 1s core level energy of FeTPyP + Co before (grey) and after EC (orange). Inset: Fitted peak after background subtraction. | ||
Conclusions
The structural stability of macrocyclic molecules with embedded metal centres differs between ORR and OER. Positive potentials during OER lead to the rapid decomposition of the organic backbone, while negative potentials during ORR leave the molecules intact for several LSVs. In the latter case, the metal centres in the porphyrin are the catalytically active sites, while during OER nanoislands of Co/Fe (oxy)hydroxide are formed, serving as the new catalyst. Indeed, iron–cobalt (oxy)hydroxide is known to be a very efficient OER catalyst.48 The observed structural and chemical changes during electrocatalysis could not be inferred from electrocatalytic experiments alone and only real-space imaging together with spectroscopic techniques allows for a comprehensive picture by comparing catalyst structure before and after reaction conditions. These findings highlight how catalyst material preparation and actual catalytically active structure/morphology might be substantially different and that a careful structural examination of catalysts during or after its use is essential to understand active sites and to study contingent morphological and thus chemical changes. Future studies could address in addition the role of the electrolyte and/or pH on catalyst stability or the effect of the supporting (gold) substrate.Conflicts of interest
There are no conflicts to declare.Acknowledgements
Open Access funding provided by the Max Planck Society.References
- J.-S. Lee, S. Tai Kim, R. Cao, N.-S. Choi, M. Liu, K. T. Lee and J. Cho, Metal–Air Batteries with High Energy Density: Li–Air versus Zn–Air, Adv. Energy Mater., 2011, 1, 34–50 CrossRef CAS.
- J. Christensen, P. Albertus, R. S. Sanchez-Carrera, T. Lohmann, B. Kozinsky, R. Liedtke, J. Ahmed and A. Kojic, A Critical Review of Li/Air Batteries, J. Electrochem. Soc., 2012, 159, R1–R30 CrossRef CAS.
- R. Jasinski, A New Fuel Cell Cathode Catalyst, Nature, 1964, 201, 1212–1213 CrossRef CAS.
- S. Yoshimoto, Molecular Assemblies of Functional Molecules on Gold Electrode Surfaces Studied by Electrochemical Scanning Tunneling Microscopy: Relationship between Function and Adlayer Structures, Bull. Chem. Soc. Jpn., 2006, 79, 1167–1190 CrossRef CAS.
- D. J. Wasylenko, C. Rodríguez, M. L. Pegis and J. M. Mayer, Direct comparison of electrochemical and spectrochemical kinetics for catalytic oxygen reduction, J. Am. Chem. Soc., 2014, 136, 12544–12547 CrossRef CAS PubMed.
- J. Maruyama, C. Baier, H. Wolfschmidt, P. Bele and U. Stimming, Enhancement of oxygen reduction at Fe tetrapyridyl porphyrin by pyridyl-N coordination to transition metal ions, Electrochim. Acta, 2012, 63, 16–21 CrossRef CAS.
- F. Sedona, M. Di Marino, D. Forrer, A. Vittadini, M. Casarin, A. Cossaro, L. Floreano, A. Verdini and M. Sambi, Tuning the catalytic activity of Ag(110)-supported Fe phthalocyanine in the oxygen reduction reaction, Nat. Mater., 2012, 11, 970–977 CrossRef CAS PubMed.
- Y. Gao, J. Liu, M. Wang, Y. Na, B. Åkermark and L. Sun, Synthesis and characterization of manganese and copper corrole xanthene complexes as catalysts for water oxidation, Tetrahedron, 2007, 63, 1987–1994 CrossRef CAS.
- D. K. Dogutan, R. McGuire and D. G. Nocera, Electocatalytic Water Oxidation by Cobalt(III) Hangman β-Octafluoro Corroles, J. Am. Chem. Soc., 2011, 133, 9178–9180 CrossRef CAS PubMed.
- H. Lei, A. Han, F. Li, M. Zhang, Y. Han, P. Du, W. Lai and R. Cao, Electrochemical, spectroscopic and theoretical studies of a simple bifunctional cobalt corrole catalyst for oxygen evolution and hydrogen production, Phys. Chem. Chem. Phys., 2014, 16, 1883–1893 RSC.
- D. Wang and J. T. Groves, Efficient water oxidation catalyzed by homogeneous cationic cobalt porphyrins with critical roles for the buffer base, Proc. Natl. Acad. Sci. U. S. A., 2013, 110, 15579–15584 CrossRef CAS PubMed.
- T. Nakazono, A. R. Parent and K. Sakai, Cobalt porphyrins as homogeneous catalysts for water oxidation, Chem. Commun., 2013, 49, 6325–6327 RSC.
- B. Wurster, D. Grumelli, D. Hötger, R. Gutzler and K. Kern, Driving the Oxygen Evolution Reaction by Nonlinear Cooperativity in Bimetallic Coordination Catalysts, J. Am. Chem. Soc., 2016, 138, 3623–3626 CrossRef CAS PubMed.
- W. Zhang, W. Lai and R. Cao, Energy-Related Small Molecule Activation Reactions: Oxygen Reduction and Hydrogen and Oxygen Evolution Reactions Catalyzed by Porphyrin- and Corrole-Based Systems, Chem. Rev., 2016, 117, 3717–3797 CrossRef PubMed.
- P. Garrido-Barros, C. Gimbert-Suriñach, R. Matheu, X. Sala and A. Llobet, How to make an efficient and robust molecular catalyst for water oxidation, Chem. Soc. Rev., 2017, 46, 6088–6098 RSC.
- S. Yoshimoto, A. Tada and K. Itaya, In Situ Scanning Tunneling Microscopy Study of the Effect of Iron Octaethylporphyrin Adlayer on the Electrocatalytic Reduction of O2 on Au(111), J. Phys. Chem. B, 2004, 108, 5171–5174 CrossRef CAS.
- J.-Y. Gu, Z.-F. Cai, D. Wang and L.-J. Wan, Single-Molecule Imaging of Iron-Phthalocyanine-Catalyzed Oxygen Reduction Reaction by in Situ Scanning Tunneling Microscopy, ACS Nano, 2016, 10, 8746–8750 CrossRef CAS PubMed.
- B. A. Friesen, A. Bhattarai, U. Mazur and K. W. Hipps, Single Molecule Imaging of Oxygenation of Cobalt Octaethylporphyrin at the Solution/Solid Interface: Thermodynamics from Microscopy, J. Am. Chem. Soc., 2012, 134, 14897–14904 CrossRef CAS PubMed.
- B. Hulsken, R. Van Hameren, J. W. Gerritsen, T. Khoury, P. Thordarson, M. J. Crossley, A. E. Rowan, R. J. M. Nolte, J. A. A. W. Elemans and S. Speller, Real-time single-molecule imaging of oxidation catalysis at a liquid–solid interface, Nat. Nanotechnol., 2007, 2, 285–289 CrossRef CAS PubMed.
- D. den Boer, M. Li, T. Habets, P. Iavicoli, A. E. Rowan, R. J. M. Nolte, S. Speller, D. B. Amabilino, S. De Feyter and J. A. A. W. Elemans, Detection of different oxidation states of individual manganese porphyrins during their reaction with oxygen at a solid/liquid interface, Nat. Chem., 2013, 5, 621–627 CrossRef CAS PubMed.
- R. Gutzler, S. Stepanow, D. Grumelli, M. Lingenfelder and K. Kern, Mimicking Enzymatic Active Sites on Surfaces for Energy Conversion Chemistry, Acc. Chem. Res., 2015, 48, 2132–2139 CrossRef CAS PubMed.
- D. Grumelli, B. Wurster, S. Stepanow and K. Kern, Bio-inspired nanocatalysts for the oxygen reduction reaction, Nat. Commun., 2013, 4, 2904 CrossRef PubMed.
- I. Horcas, R. Fernández, J. M. Gómez-Rodríguez, J. Colchero, J. Gómez-Herrero and A. M. Baro, WSXM: a software for scanning probe microscopy and a tool for nanotechnology, Rev. Sci. Instrum., 2007, 78, 013705 CrossRef CAS PubMed.
- C. Piamonteze, U. Flechsig, S. Rusponi, J. Dreiser, J. Heidler, M. Schmidt, R. Wetter, M. Calvi, T. Schmidt, H. Pruchova, J. Krempasky, C. Quitmann, H. Brune and F. Nolting, X-Treme beamline at SLS: X-ray magnetic circular and linear dichroism at high field and low temperature, J. Synchrotron Radiat., 2012, 19, 661–674 CrossRef CAS PubMed.
- D. Hötger, P. Abufager, C. Morchutt, P. Alexa, D. Grumelli, J. Dreiser, S. Stepanow, P. Gambardella, H. F. Busnengo, M. Etzkorn, R. Gutzler and K. Kern, On-surface transmetalation of metalloporphyrins, Nanoscale, 2018, 10, 21116–21122 RSC.
- C. M. Doyle, J. P. Cunniffe, S. A. Krasnikov, A. B. Preobrajenski, Z. Li, N. N. Sergeeva, M. O. Senge and A. A. Cafolla, Ni-Cu ion exchange observed for Ni(II)-porphyrins on Cu(111), Chem. Commun., 2014, 50, 3447–3449 RSC.
- K. Shen, B. Narsu, G. Ji, H. Sun, J. Hu, Z. Liang, X. Gao, H. Li, Z. Li, B. Song, Z. Jiang, H. Huang, J. W. Wells and F. Song, On-surface manipulation of atom substitution between cobalt phthalocyanine and the Cu(111) substrate, RSC Adv., 2017, 7, 13827–13835 RSC.
- A. Rieger, S. Schnidrig, B. Probst, K. H. Ernst and C. Wäckerlin, Ranking the Stability of Transition-Metal Complexes by On-Surface Atom Exchange, J. Phys. Chem. Lett., 2017, 8, 6193–6198 CrossRef CAS PubMed.
- S. Brüller, H.-W. Liang, U. I. Kramm, J. W. Krumpfer, X. Feng and K. Müllen, Bimetallic porous porphyrin polymer-derived non-precious metal electrocatalysts for oxygen reduction reactions, J. Mater. Chem. A, 2015, 3, 23799–23808 RSC.
- J. Fester, A. Makoveev, D. Grumelli, R. Gutzler, Z. Sun, J. Rodríguez-Fernandez, K. Kern and J. V. Lauritsen, The Structure of the Cobalt Oxide/Au Catalyst Interface in Electrochemical Water Splitting, Angew. Chem., Int. Ed., 2018, 130, 12069–12073 CrossRef.
- Z. Shi and J. Zhang, Density Functional Theory Study of Transitional Metal Macrocyclic Complexes’ Dioxygen-Binding Abilities and Their Catalytic Activities toward Oxygen Reduction Reaction, J. Phys. Chem. C, 2007, 111, 7084–7090 CrossRef CAS.
- J. H. Zagal, S. Griveau, J. F. Silva, T. Nyokong and F. Bedioui, Metallophthalocyanine-based molecular materials as catalysts for electrochemical reactions, Coord. Chem. Rev., 2010, 254, 2755–2791 CrossRef CAS.
- K. Liu, Y. Lei, R. Chen and G. Wang, in Electrochemistry of N4 Macrocyclic Metal Complexes, Volume 1: Energy, ed. J. H. Zagal and F. Bedioui, Springer International Publishing, Switzerland, 2nd edn, 2016, pp. 1–39 Search PubMed.
- K. Hirsch, V. Zamudio-Bayer, J. Rittmann, A. Langenberg, M. Vogel, T. Möller, B. v. Issendorff and J. T. Lau, Initial- and final-state effects on screening and branching ratio in 2p X-ray absorption of size-selected free 3d transition metal clusters, Phys. Rev. B: Condens. Matter Mater. Phys., 2012, 86, 165402 CrossRef.
- S. Vijayaraghavan, W. Auwärter, D. Ecija, K. Seufert, S. Rusponi, T. Houwaart, P. Sautet, M. L. Bocquet, P. Thakur, S. Stepanow, U. Schlickum, M. Etzkorn, H. Brune and J. V. Barth, Restoring the Co magnetic moments at interfacial co-porphyrin arrays by site-selective uptake of iron, ACS Nano, 2015, 9, 3605–3616 CrossRef CAS PubMed.
- T. Regan, H. Ohldag, C. Stamm, F. Nolting, J. Lüning, J. Stöhr and R. White, Chemical effects at metal/oxide interfaces studied by X-ray-absorption spectroscopy, Phys. Rev. B: Condens. Matter Mater. Phys., 2001, 64, 1–11 CrossRef.
- P. Kuiper, B. G. Searle, L. C. Duda, R. M. Wolf and P. J. VanderZaag, Fe L2,3 linear and circular magnetic dichroism of Fe3O4, J. Electron Spectrosc. Relat. Phenom., 1997, 86, 107–113 CrossRef CAS.
- S. Brice-Profeta, M.-A. Arrio, E. Tronc, N. Menguy, I. Letard, C. Cartier dit Moulin, M. Noguès, C. Chanéac, J.-P. Jolivet and P. Sainctavit, Magnetic order in – nanoparticles: a XMCD study, J. Magn. Magn. Mater., 2005, 288, 354–365 CrossRef CAS.
- P. S. Miedema and F. M. F. de Groot, The iron L edges: Fe 2p X-ray absorption and electron energy loss spectroscopy, J. Electron Spectrosc. Relat. Phenom., 2013, 187, 32–48 CrossRef CAS.
- D. Peak and T. Regier, Direct Observation of Tetrahedrally Coordinated Fe(III) in Ferrihydrite, Environ. Sci. Technol., 2012, 46, 3163–3168 CrossRef CAS PubMed.
- Q. Daniel, R. B. Ambre, B. Zhang, B. Philippe, H. Chen, F. Li, K. Fan, S. Ahmadi, H. Rensmo and L. Sun, Re-Investigation of Cobalt Porphyrin for Electrochemical Water Oxidation on FTO Surface: Formation of CoOx as Active Species, ACS Catal., 2017, 7, 1143–1149 CrossRef CAS.
- T. Nakazono, A. R. Parent and K. Sakai, Improving Singlet Oxygen Resistance during Photochemical Water Oxidation by Cobalt Porphyrin Catalysts, Chem. – Eur. J., 2015, 21, 6723–6726 CrossRef CAS PubMed.
- P. Pospíšil and A. Prasad, Formation of singlet oxygen and protection against its oxidative damage in Photosystem II under abiotic stress, J. Photochem. Photobiol., B, 2014, 137, 39–48 CrossRef PubMed.
- J. Fester, M. García-Melchor, A. S. Walton, M. Bajdich, Z. Li, L. Lammich, A. Vojvodic and J. V. Lauritsen, Edge reactivity and water-assisted dissociation on cobalt oxide nanoislands, Nat. Commun., 2017, 8, 14169 CrossRef CAS PubMed.
- M. A. Henderson, The interaction of water with solid surfaces: fundamental aspects revisited, Surf. Sci. Rep., 2002, 46, 1–308 CrossRef CAS.
- P. H. Citrin, High-Resolution X-Ray Photoemission from Sodium Metal and Its Hydroxide, Phys. Rev. B: Solid State, 1973, 8, 5545–5556 CrossRef CAS.
- G. Pirug, C. Ritke and H. P. Bonzel, Adsorption of H2O on Ru(001): II. Effect of coadsorbed alkali metals (Na, K, Cs), Surf. Sci., 1991, 257, 50–62 CrossRef CAS.
- M. S. Burke, M. G. Kast, L. Trotochaud, A. M. Smith and S. W. Boettcher, Cobalt–Iron (Oxy)hydroxide Oxygen Evolution Electrocatalysts: The Role of Structure and Composition on Activity, Stability, and Mechanism, J. Am. Chem. Soc., 2015, 137, 3638–3648 CrossRef CAS PubMed.
Footnotes |
| † Electronic supplementary information (ESI) available: Additional STM, EC, and XAS data. See DOI: 10.1039/c8cp07463a |
| ‡ Present address: Institut für Angewandte Physik, TU Braunschweig, 38106 Braunschweig, Germany. |
| This journal is © the Owner Societies 2019 |