
 Open Access Article
 This Open Access Article is licensed under a
 Creative Commons Attribution 3.0 Unported Licence
Field modified spin–orbit potential curves of IBr. Preliminary dynamical results†
Cristina
Sanz-Sanz
 a and
Graham A.
Worth
*b
a and
Graham A.
Worth
*b
aDepartamento de Química Física Aplicada, Módulo 14, Universidad Autónoma de Madrid, 28049 Madrid, Spain. E-mail: cristina.sanz@uam.es; Tel: +34 91 497 3922
bDepartment of Chemistry, University College London, 20 Gordon Street, London WC1H 0AJ, UK. E-mail: g.a.worth@ucl.ac.uk
First published on 14th March 2019
Abstract
In a seminal work the photodissociation of IBr has been controlled using a strong non-resonant IR pulse [Sussman et al., Science, 2006, 314, 274], changing the branching ratio of products in different final states via the relative timing of pump and control pulses. In this paper, we revisit the control of this molecule. Potential surfaces for the complete spin–orbit manifold of IBr states dissociating into the ground and first excited states of the constituent atoms have been calculated at the multi-reference configuration interaction (MRCI) level of theory as a function of applied field. Both the strength and direction of field have been taken into account and it is seen how the avoided crossing between the states thought to be key in the control mechanism shift as a function of field strength. These surfaces will enable full calculations of the molecule in the pump-control field. Preliminary dynamics calculations with the field placed along the molecular axis show that a Hamiltonian including all 36-states agrees with earlier results and is able to model the basic features of the control. However, just like earlier results, this restricted model is not able to reproduce the timescale of the control.
1 Introduction
The strong-field control of the photodissociation of IBr by Stolow and co-workers1,2 is a classic example of affecting the outcome of a chemical reaction by modifying the potential curves near a curve crossing using the non-resonant dynamic Stark effect. The crossing modified by the pulse appears between two excited spin–orbit states that dissociate to two different dissociation channels. The control pulse separates the states avoiding the dissociation in the lower channel, producing an inversion of the dissociation ratio. Computer simulations using a simple model for the coupled potentials have supported the interpretation of the mechanism, but questions remain. In particular, the time-scale for the control is much shorter in the simulations, with the simulations showing that the photodissociation reaction is over in around 100 fs while the experiments show a control effect out to 500 fs.1,3 To understand the origin of this discrepancy it is first necessary to build a complete and accurate theoretical description of IBr able to reproduce the experimental data. Comparison of this full description and the models used previously will provide the missing link.The IBr system has received much attention in the last three decades mainly because of the crossing excited-states which dissociate to two different dissociation channels. The initial studies,4–6 more than 80 years ago, were focused on the interpretation of the absorption spectrum by vibrational analysis. The first theoretical studies,7 a decade later, started a series of papers dedicated to the electronic description of the potential energy curves8–11 with special attention to the crossing of the excited states. The description of the halogen atoms used relativistic effective core potentials (ECP) including spin–orbit interactions. The description of the dissociation energies using ECP's was deficient, and a later study12 used an optimised basis-set to described correctly all the states and crossings of the states dissociating to the ground and first excited spin–orbit states of I and Br atoms.12 These optimised basis sets are the basis sets used in this paper. With the first descriptions of the potential energy curves the first spectroscopic theoretical studies also appeared13 focusing on the adiabatic and diabatic effects of the excited states crossings.
The first photodissociation study13 used several coupling regimes to explain the predominance of excited state of Br in the photodissociation products. The application of laser pulses provided several extra studies in vibration-rotation excitation,14 wavepacket absorption spectra,15,16 and wavepacket predissociation.17 In addition to the use of the laser pulse as a method to promote the system from lower to excited vibro-rotational or electronic states, pulses were used to control the photofragmentation of IBr. The first studies to control the photodissociation used coherent control18,19 and optimal control theory.20 The dynamic Stark control experiments mentioned above, in which an intermediate strength control pulse is used after the excitation to shift the curves involved in the crossing, appeared one decade later: first with a theoretical study using a three-state model1 and a year later, the experimental evidence2 of the curve shifting of the excited electronic states controlling the photodissociation channel. The influence of the parameters of the control pulse (width, intensity, duration of the pulse and delay of the control pulse) using a three-states model with calculated potential curves, dipole moments and polarizabilities was subsequently published.3
The theoretical simulation of a time-resolved spectroscopic study takes place in two-steps. First, potential surfaces and couplings between them must be calculated using ab initio quantum chemistry calculations. Then, quantum dynamics simulations solving the time-dependent Schrödinger equation is performed including the light pulse and obtaining the measured signal, in this case the branching ratio of products as a function of control pulse delay time. Most simulations including a light pulse are in the weak-field limit, adding the pulse as an extra time-dependent term in the Hamiltonian. In this case the field is in the Stark-shift intermediate regime and is strong enough to shift the potential surfaces, but not strong enough to lead to ionisation. To model this, the potential curves can be computed adding a static electric field in the ab initio calculations and potential energy curves produced that depend on the electric field strength and the orientation angles in which the field is applied. The potential energy curves for the diatomic IBr are then three dimensional surfaces depending on inter-atomic distance, field strength and orientation angle. The light pulses can then be modeled as a time dependent function of field intensity, modifying the potentials accordingly. This is an extension of the electric-nuclear Born–Oppenheimer approximation of Balint-Kurti and co-workers.21
The electric-field dependent potential calculations are computationally challenging. The number of distinct states dissociating to Br(2P) and I(2P) when spin–orbit (SO) coupling is not considered is a twelve. We refer to these pure spin states as spin-free states. The atoms of Br and I have, however, strong SO coupling, being 3685 cm−1 for Br and 7603 cm−1 for I. These values are not negligible and if they are ignored no curve crossing is found between excited states. The ground state of halogen atoms is 2P, which splits to 2P3/2 and 2P1/2 when SO is considered, giving rise to four dissociation channels for long inter-atomic distances. When SO coupling is included the total number of distinct mixed-spin states rises to 23. We refer to these as spin–orbit, or SO states. A scheme of the SO splitting defining the dissociation asymptotes is given in Fig. 1.
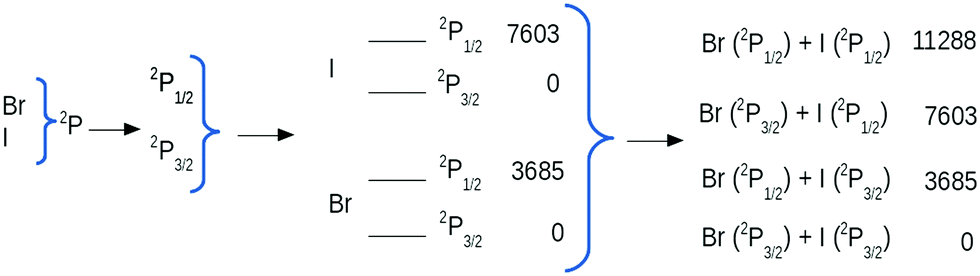 | ||
| Fig. 1 Spin–orbit splitting (in cm−1) of the ground states of Br and I which produce four possible dissociation channels. Experimental data.22 | ||
The details of the ab initio calculations are given in Section 2.1. The calculation of the SO coupling unfortunately provides a problem, as random phases in the state wavefunctions lead to sign changes and swapping of states between neighbouring points on the PES, even when each point is computed using the reference wavefunction of the previous point. These discontinuities have to be corrected to produce smooth curves for the energies, dipole moments and SO couplings. The calculation of the potential curves affected by an external field complicates the smoothing process, which otherwise could be easily made by computing the overlap between two consecutive points. The method that we use to create smooth curves will be presented in Section 2.2 of this paper. The PE curves obtained are described in Section 3.1.
The aim of the computation of the potential curves under the influence of an static electric field, is the simulation of the experiments2 of the dynamic Stark control of the photodissociation of IBr. In Section 3.2 of this paper we present preliminary results of the dynamical simulation of the photodissociation of IBr, using a control pulse oriented along the intermolecular axis of the molecule, considering all the electronic states. The light field is also coupled to the molecule using only the dipoles and polarisabilities rather than the full 3D field-dependent surfaces. The final section, Section 4, presents the conclusions.
2 Methods
2.1 Ab initio calculations
The states required for the simulation of the control of the photodissociation of IBr must include all those dissociating to the four SO states of the ground states of I and Br. For the computation of these states, the MOLPRO quantum chemistry package23 was used. Because MOLPRO can only compute SO couplings from the configuration interaction (CI) wavefunction, all the electronic structure results are computed at CI level of calculation.A first attempt using pseudopotentials in both atoms failed, probably due to the large number of states needed. An extensive study of the 23 SO states of IBr was presented in 2006 by Patchkovskii12 using basis sets optimised for I and Br to better describe the full set of SO states dissociating to the I + Br channels. The author provided us with the optimised basis sets and all our calculations are made using these which are relativistic Gaussian basis sets adapted to the third-order Douglas-Kroll Hamiltonian derived from ref. 24. The resulting contraction of the basis sets are (21s 16p 11d 2f)/[9s 7p 5d 2f] for Br and (24s 20p 14d 2f)/[10s 8p 6d 2f] for I. A more detailed explanation about the basis set optimisation is presented in the original paper.12
The active space used for our calculations included a total of 33A′ and 13A′′ orbitals using Cs symmetry, from which 28A′ and 11A′′ orbitals remained closed. This active space accommodates 10 active electrons in a total of 7 orbitals. The number of singlet and triplet states from both symmetries which dissociate to the ground states of I and Br are 51A′, 51A′′, 43A′ and 43A′′. The Multi-Configurational Self Consistent Field (MCSCF) provides the set of 18 potential curves when the SO couplings are not considered, all degenerate at long distances, dissociating to the ground electronic states of I and Br. The MCSCF wavefunction was then used as reference for the CI calculations, which provide better potential curves, and allow the calculation of the SO couplings. The same active space was considered for the CI calculations and the optimised wavefunction saved and used in the SO matrix calculation. Due to the symmetry adopted, Cs, the SO matrix is composed of 36 states as the Π and Δ states appear in both irreducible representations. With respect to the Σ states the + states appear in the A′ representation and the – states appear in the A′′. The calculation of the SO matrix needed to include all the states dissociating to the ground states of I and Br, because otherwise the SO states do not give the correct four dissociation channels.
Patchkovskii used this basis set with a similar active space and the GAMESS package.12 As our calculations are obtained using MOLPRO, we present the comparison of the SO splitting for free I and Br in Table 1. The SO splittings are of the same order, but the values obtained using MOLPRO have smaller differences from the experimental values. The spin–orbit splitting for Br is underestimated by 159 cm−1 (226 cm−1 in the previous calculations) and is overestimated for I by 443 cm−1 (underestimated by 570 cm−1 in previous calculations).
2.2 Fitting of the field-coupled potentials
For grid-based quantum dynamics simulations, the potential energy curves under the effect of the electric field need to be provided as a global function. This can either be in the form of an analytical function, or using an interpolation method to provide a description of the curves without the effort of fitting to an analytical function. Considering that in this system we have to describe the potential surfaces of 36 states, all their couplings, and the full dipole moment matrix, an automatic spline interpolation procedure is the obvious option. Furthermore, the interpolation gives a good description of the properties of this system because the potential curves vary smoothly with variation of the electric field strength and molecule orientation. A standard 3-dimensional spline interpolation was used for the description of all electronic properties in this paper.For the quantum dynamics simulations, we require diagonal electronic properties (potential energy and dipole moments) and off-diagonal elements (transition dipole moments and spin–orbit couplings) in the basis of the spin-free states, in which the kinetic energy operator can be taken to be diagonal, all under the influence of an electric field. It is well known that quantum calculations do not maintain the relative phase of the wavefunction from one point to the next, so that off-diagonal properties can have changes of sign. In addition, states that are degenerate or very close to each other can appear in the wrong order and states can swap along a coordinate. Therefore, the first step before we can fit any of these properties is to produce smooth curves.
The correction of the sudden changes in off-diagonal matrix elements can be obtained, in principle, using the overlap between two consecutive points, but with the electric field on the overlaps were often not evidently near to 1 or −1, i.e. mixing occurred. Even in the field free case the off-diagonal elements mixed significantly and were not smooth functions of the nuclear distance. Thus, we developed a procedure that makes use of the fact that transformation between the spin-free and spin–orbit bases is local and is not affected by the changes of the relative phase of the wavefunctions. At each value of the bond length, R, the spin-free potential matrix, W, is related to the spin–orbit potentials in the diagonal matrix, V by a unitary transformation
| W(R) = U†V(R)U | (1) |
1. An initial point was chosen at a long internuclear distance in which the properties are well defined. Here the full W(0) matrix is taken from quantum chemistry calculations.
2. Move to the next internuclear distance (shorter bond), and take the off-diagonal elements of W(0) from the previous point as a guess.
3. The off-diagonal terms are optimised using a conjugate gradient optimiser to ensure the eigenvalues of W(0) are identical to the corresponding values of V(0).
4. The optimised values are used as the reference for the next point.
This procedure thus gives functions of both the non-adiabatic and spin–orbit coupling elements, assuming that they change slowly as the bond length changes. It ensures a field-free spin-free potential matrix with the correct spin–orbit eigenvalues.
A slightly modified version of this procedure was then used to provide the off-diagonal elements of the potential matrix as a function of field-strength. Starting with the optimised field-free potential matrix at a particular bond length, W(0)(R), a guess for the off-diagonal elements at field strength E was taken as
| W(R,E) = W(0)(R) + D(R,E) | (2) |
2. At each inter-atomic distance, move to the next field strength, and sum the potential matrix (W) elements with D(E), the field-free dipole moment matrix multiplied by the field strength.
This initial guess matrix was then optimised so that the eigenvalues of the optimised W(R,E) are constructed to be the spin–orbit eigenvalues at that field strength.
In order to see if the procedure has worked the optimised Hamiltonian matrix eigenvalues can be compared with the eigenvalues obtained from MOLPRO for each R, E and θ values. In Fig. 2 this comparison is shown for a selection of cuts through the surfaces, where the optimised points are plotted with green empty circles and the eigenvalues from MOLPRO are the purple lines. The field strength and angle of the electric field are specified in each plot. For every field strength and angle selected, the lines pass through all the points, evidence that the optimisation procedure provides the same eigenvalues. The optimised off-diagonal elements are smooth and can be spline interpolated to be used in the quantum dynamics calculations.
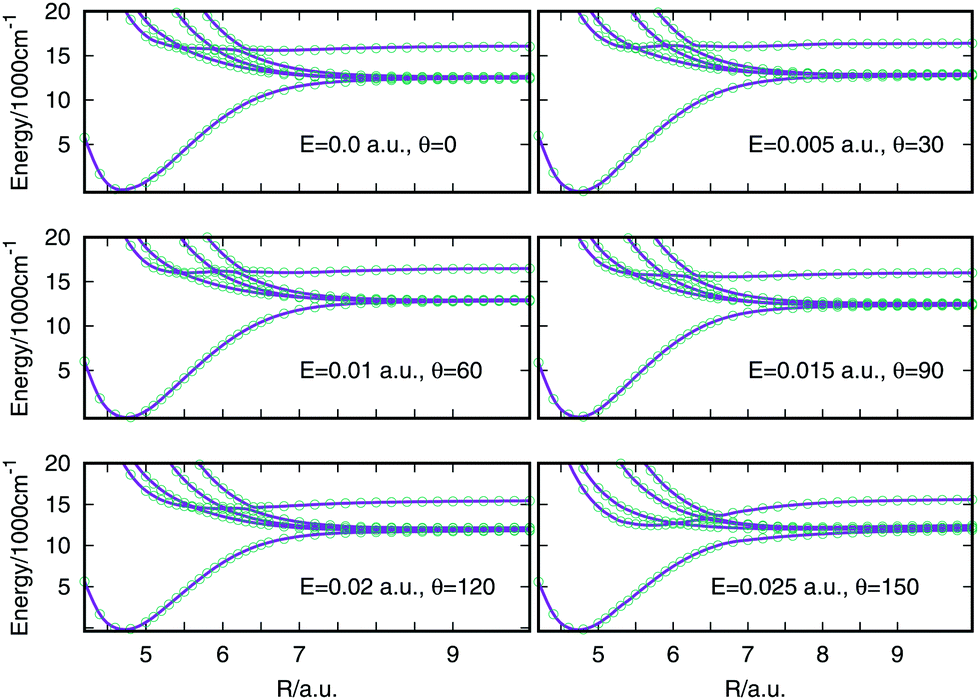 | ||
| Fig. 2 Comparison between the spin–orbit coupled states (eigenvalues of the spin–orbit matrix) obtained from the optimised procedure (empty circles) and the spin–orbit coupled states obtained from MOLPRO (lines). The states plotted are 11Σ+0, 13Π0+, 11Π1, 23Π1, 21Π1. | ||
2.3 Dynamics calculations
After calculating the potential energy surfaces, the system dynamics is obtained by solving the time-dependent Schrödinger equation using numerically exact wavepacket propagation as implemented in the QUANTICS25 set of programs.The grid used for all propagations presented in this paper is a Fast Fourier Transform (FFT) collocation, with a total of 256 points running from interatomic distances between 4.0 and 12.00 Bohr. The propagation used an Adam–Bashforth–Moulton predictor corrector (ABM) integration scheme. To avoid the use of long grids the wavepacket is absorbed before it reaches the end of the grid using a complex absorbing potential (CAP). The CAP has the form −iW(Q) = −iη(Q − Qc)bθ(Q − Qc), where θ(x) denotes the Heaviside's step function and Qc is the point where the CAP is switched on. The optimised CAP used in this study has an exponent set to b = 2, a strength η = 0.00116 Hartree and is placed at R = 10.0 Bohr. The study of the branching ratio requires the study of the portion of the wavepacket that reaches this CAP, assuming that at this point the dissociation has occurred. QUANTICS provides the flux through the absorbing potential in either representation, spin–orbit coupled and non-coupled.
The initial wavepacket was formed using energy relaxation, propagating an initial guess in imaginary time until convergence is reached. The imaginary propagation used the complete set of states and couplings so the initial propagation starts with a non-negligible population of the wavepacket in some of the spin-free excited states, i.e. the ground-state function includes a mix of both singlet and triplet character.
3 Results
3.1 Potential energy curves
The experiment of the control of the photodissociation of IBr is based on modifying the potential energy curves near an avoided crossing between states dissociating to two different spin–orbit states of Br atom. The system is first excited to an energy region above the first spin–orbit excited state (I(3P3/2) + Br(3P1/2)). It then evolves and reaches the avoided crossing where it has the possibility to dissociate in either channel. The control is produced by a pulse, non-resonant with the states near the avoided crossing, so that no excitation is produced within the states, but the curves are modified so that the system is forced to dissociate in the spin–orbit excited state. The theoretical complication that arises when spin–orbit coupling is included is that all states dissociating to the ground electronic states of I and Br have to be considered in the calculations and the spin–orbit matrix needs all states and all couplings to produce the correct spin–orbit eigenvalues.The total number of distinct states dissociating to the ground states of I and Br are 12 and these states split into 23 states when spin–orbit is included: (1Σ−0−, 1Σ+0+(×2), 1Π1(×2), 1Δ2, 3Σ−0+, 3Σ−1, 3Σ+0−(×2), 3Σ+1(×2), 3Π1(×2), 3Π0+(×2), 3Π0−(×2), 3Π2(×2), 3Δ2, 3Δ1 and 3Δ3). Ten of these states correlate to the ground state atoms (2P3/2), five states each correlate to the SO excited state to one of the atoms (5 states to Br(2P1/2) + I(2P3/2) and 5 states to Br(2P3/2) + I(2P1/2)) and the last three correlate to both atoms in their SO excited state.
In Table 2 the spin free (uncoupled) and the spin–orbit coupled states are listed, sorted in increasing order of energy of the spin-free states. The table presents the labeling of states for both representations and the energy (in cm−1) at the equilibrium distance (Frank–Condon point) of the ground state. The zero of energies considered for the values in this table is at the dissociation energy of the spin-free states. The labeling of the states is obtained using the eigenvectors of the full matrix and the expectation value of the Lz2, both provided by MOLPRO. Because our calculations are made using Cs symmetry, the labeling of the states is tedious but is reliable since we can simultaneously use the expectation value of Lz2 and the fact that spin–orbit coupling components appear in different irreducible representation. Most states in the spin–orbit representation have a clear major component and can be related to a spin-free state. Two states, however, have a mixed character and are composed of approximately equal amounts of the 11Δ2 and 13Δ2 spin-free states. The colours denote the SO states dissociating to the four different channels. The avoided crossing controlled to produce the dissociation in the first excited channel is created by 13Π0+ and 13Σ−0+. By symmetry, these two states are not coupled by non-adiabatic coupling and the avoided crossing is due to spin–orbit coupling of about 120 cm−1.
| Spin-free states | Spin–orbit states | |||
|---|---|---|---|---|
| Symbol | Energy | Symbol | Energy | Channel |
| 11Σ+ | −15![[thin space (1/6-em)]](https://www.rsc.org/images/entities/char_2009.gif) 750 750 |
1Σ+0+ | −15750 |
1 |
| 13Π | 3456 | 3Π2 | 1463 | 1 |
| 3Π1 | 2781 | 1 | ||
| 3Π0− | 5846 | 1 | ||
| 3Π0+ | 6607 | 1 | ||
| 11Π | 8324 | 1Π1 | 9188 | 1 |
| 23Π | 22428 |
3Π2 | 21156 |
1 |
| 3Π1 | 21986 |
1 | ||
| 3Π0− | 24390 |
1 | ||
| 3Π0+ | 24696 |
1 | ||
| 2 1Π | 25450 |
1Π1 | 26320 |
2 |
| 13Σ− | 28151 |
3Σ−0+ | 26512 |
2 |
| 3Σ−1 | 29016 |
2 | ||
| 13Σ+ | 29143 |
3Σ+0− | 30285 |
2 |
| 3Σ+1 | 30471 |
2 | ||
| 11Δ | 31424 |
1Δ2 + 13Δ2 | 32010 |
3 |
| 11Σ− | 33939 |
1Σ−0− | 36580 |
4 |
| 21Σ+ | 39238 |
1Σ+0+ | 37287 |
3 |
| 13Δ | 39965 |
3Δ3 | 36651 |
3 |
| 3Δ2 + 11Δ2 | 41040 |
3 | ||
| 3Δ1 | 44929 |
4 | ||
| 23Σ+ | 40618 |
3Σ+1 | 41605 |
3 |
| 3Σ+0− | 44909 |
4 | ||
The potential energy curves are presented in Fig. 3. The left panel shows the 12 spin-free states. They are all degenerate for long internuclear distances and dissociate to I and Br in their ground electronic state. The right panel shows the 23 states dissociating to the spin–orbit electronic states of I and Br (3P3/2 and 3P1/2). The states dissociate to four channels, which can be related to the states in Table 2 by the given channel number. The avoided crossing is highlighted by a black arrow. An expanded version of the potential curves including spin–orbit coupling is provide in Fig. S1 of the ESI,† along with the assignment of the states at the Franck–Condon point. It should be noted that the curves differ slightly from those presented in our earlier paper ref. 3. The earlier potentials were calculated at the same level of theory but used a constant value of 150 cm−1 for the spin–orbit coupling in contrast to the complete coordinate dependent coupling used here.
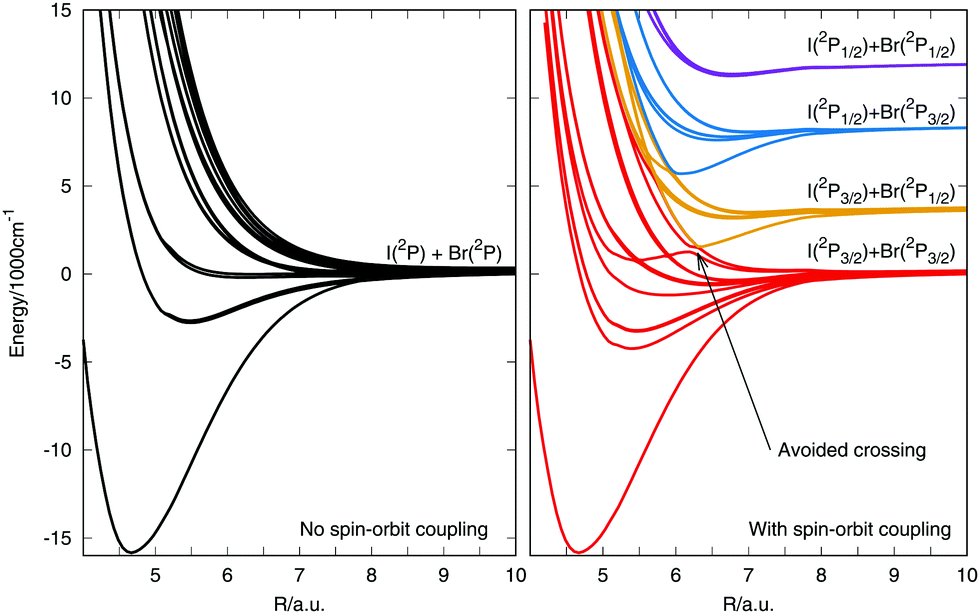 | ||
| Fig. 3 Potential energy curves of the IBr system. The left panel presents the 12 spin-free states dissociating to the ground states of I and Br. The right panel shows the 23 states when the spin–orbit coupling is considered. | ||
To assess the quality of the new potential surfaces, a comparison with known experimental and calculated data is given in Table 3. Experimental data are taken from high resolution spectroscopy studies.27–31 In addition, Vrakking and coworkers26 performed pump–probe experiments on IBr using a range of experimental excitation energies from 547 nm (18282 cm−1) to 590 nm (16949 cm−1), corresponding to the first excited dissociation channel and the curve crossing, respectively. In our calculations the values obtained are 18999 cm−1 for the first excited dissociation channel and 16781 cm−1 for the curves crossing point. Both values are in good agreements with the experimental values.
A comparison has also been made to the detailed theoretical analysis of the potential surfaces made by Li et al.32 using multi-reference configuration interaction (MRCI) based on a 10 electron, 11 orbital active space and a natural orbital basis set. A plot of our spin-coupled surfaces compared to their surfaces is given in Fig. S2 of the ESI† for the states with total angular momentum Ω = 0+ and Ω = 0−, in which the crossings occur. The surfaces have same shape, but in our calculations the avoided crossings have wider gaps and the minima are deeper.
The reaction we are studying is started by an excitation pulse promoting the system to the excited states with energies near 20000 cm−1. All the states in this energy region dissociate to the lowest dissociation channel, but the avoided crossing connects one state to the first excited channel, allowing branching of a dissociating wavepacket. The control pulse aims to modify the curves so that when the system reaches the avoided crossing region the curves separate and dissociation in the first excited channel is enhanced.
By including a static field in the quantum chemistry calculations, the potential energy curves were also obtained as a function of the field strength and the orientation of the electric field with respect to the molecular axis. The internuclear distances in the computation of the potential energy curves were varied from 4.0 to 10 a.u. in intervals of 0.2 a.u., except from 5.0 to 6.6 where the intervals were reduced to 0.1 a.u., to describe better the Frank Condon region. The field strength was varied from 0.005 to 0.025 a.u. in intervals of 0.005 a.u. at different angles of orientation with respect to the axis of the molecule. The molecule lies along the Z axis with Br in the positive direction and the electric field is oriented in the YZ plane. The electric field components are defined as εy = E × sinθ and εz = E × cosθ, where E is the field strength and θ is the angle formed between the molecular axis and the electric field vector.
The electric field distorts the potential energy and the effect on the curves near the avoided crossing is shown in Fig. 4. All the panels present the effect of the application of the electric field parallel to the internuclear axis and the field strength is specified in each panel. A black box frames the avoided crossing. The curves get visually distorted and the states producing the crossing separate from each other. At a field strength of 0.025 a.u. a marked shift in the curves is seen which is probably due to errors in the quantum chemistry at this high field. The effect in the potential curves of the angle between the molecular axis and the electric field vector is presented in Fig. 5 for an electric field strength of 0.02 a.u. The black box is maintained in place to mark the position of the field-free avoided crossing. At 0° the avoided crossing with an electric field of 0.02 a.u. is moved to longer distances and the minimum becomes deeper. The minimum disappears as the angle increases but is seen to return for larger angles approaching 180°.
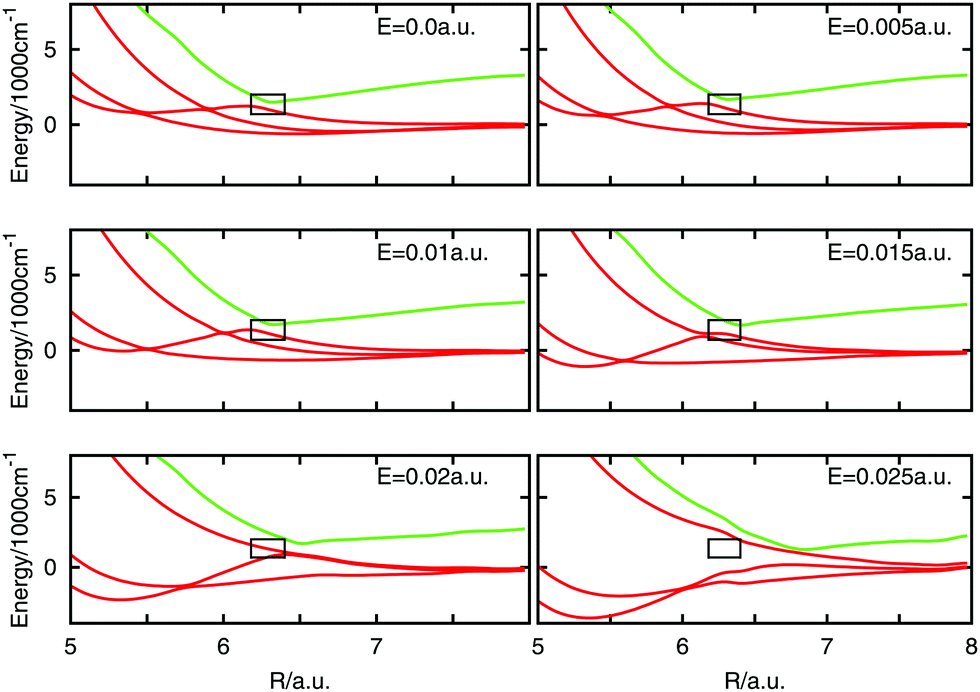 | ||
| Fig. 4 Potential energy curves for different values of the electric field strength for θ = 0 of some states near the avoided crossing. The black box frame the position of the avoided crossing. | ||
 | ||
| Fig. 5 Potential energy curves for different values of the angle between the electric field vector and the molecular axis of some states near the avoided crossing. The field strength is fixed in 0.02 a.u. | ||
3.2 Dynamical calculations
The best evidence that all the states, couplings and dipole moment elements are accurate is their use in quantum dynamics calculations to simulate experimental results. In this paper we present preliminary results, similar in spirit to the earlier three-state model study,3 but this time using the full set of states and couplings involved in the system. This means that rather than using the surfaces as a function of field strength and angle, the field-free potential curves and couplings are used with dipole and polarisability matrices to couple the system to the field.The Hamiltonian used for the time propagation of the system is thus written as follows
Ĥjk = ![[T with combining circumflex]](https://www.rsc.org/images/entities/i_char_0054_0302.gif) δjk + W(0)jk(R) + Veffjk(R,E,t) δjk + W(0)jk(R) + Veffjk(R,E,t) | (3) |
| Vdjk(R,E,t) = −djk(R)·e(E1(t)cos(ω1t) + E2(t)cos(ω2t)) | (4) |
 | (5) |
V d jk (R,E,t) is the multiplication of the dipole matrix elements (djk(R)) with the field envelope and oscillating function in the direction of the field. VSjk(E,t) is the Stark control term, i.e., the interaction of the polarizability with the square of the electric field. This term modifies the potential curves following the envelope of the pulse. The dipole matrix, x, y, z components and modulus, are obtained from MOLPRO calculations.
For these preliminary calculations we only use the z component of the transition dipole moment, considering this component as parallel to the internuclear axis. For light polarisation along the z-axis, only the 21Σ+0 state is bright, i.e. has a significant transition dipole from the ground-state. All other states will be populated due to higher order couplings to the field, or by intensity borrowing from this state. It is interesting to note that the 11Δ2 has such high spin–orbit coupling with the 13Δ2 that they cannot be separated in the spin–orbit states. Thus the triplet manifold can be directly accessed from the ground-state.
In these first simulations, the polarizability is kept fixed in value. It is calculated from the derivative of the dipole moment, dz with respect to an electric field parallel to the internuclear axis at the internuclear distance where the avoided crossing is, R = 6.5 a.u. This is the reason why in eqn (5) the polarizability is not dependent on internuclear distance but the dipole moments and transition dipole moments are. In Fig. 6 the two biggest transition dipole moments are shown along the internuclear distance. The rest of transition dipole moments are lower than 0.2 Debyes for all distances. In Table 4 the constant polarizabilities used in the dynamical calculations are listed.
 | ||
| Fig. 6 The z component of the two largest transition dipole moments between the states, as specified in the plot. All other transition dipoles are lower that 0.2 Debyes along all the values of R. | ||
| Polarizability (αjj)/a.u. | Polarizability (αjk)/a.u. |
|---|---|
| 11Σ+0 = −95.1 | 11Σ+0 − 11Δ2 = 0.3 |
| 11Σ+0 − 21Σ+0 = 1.0 | |
| 11Π1 = −103.5 | 11Π1 − 21Π1 = 9.7 |
| 21Π1 = −48.0 | |
| 11Δ2 = −68.0 | 11Δ2 − 21Σ+0 = 0.6 |
| 21Σ+0 = −65.2 | |
| 13Π2 = −124.4 | 13Π2 − 23Π2 = 8.7 |
| 13Π1 | |
| 13Π0 | |
| 23Π2 = −46.4 | |
| 23Π1 | |
| 23Π0 | |
| 13Σ+1 = −57.2 | 13Σ+1,0 − 13Δ3,2,1 = 0.6 |
| 13Σ+0 | 13Σ+1,0 − 23Σ+1,0 = 3.0 |
| 13Δ3 = −62.5 | 13Δ3,2,1 − 23Σ+1,0 = 0.3 |
| 13Δ2 | |
| 13Δ1 | |
| 23Σ+1 = −62.1 | |
| 23Σ+0 | |
| 11Σ−0 = −62.8 | 11Δ2 − 11Σ−0 = 1.0 |
| 13Σ−0 = −74.9 | 13Σ−1,0 − 13Δ3,2,1 = 1.1 |
| 13Σ−1 |
In order to understand the natural behaviour of the wavepacket, the vertical excitation to each of the excited states was analysed. After exciting the ground state wavepacket to each spin-free excited state in turn, we conclude that only the excitation to the ms components, in both symmetries A′ and A′′, of the 11Π and 13Π can be considered as dissociative excitations. By this we mean that after the excitation, at least 97% of the wavepacket reaches the dissociation region. In the spin–orbit states we can assign the population to each state and more importantly in this study, to the different dissociation channels. In the ESI† the populations of each spin free state, summed over the z-components of the total angular (J = L + S), are plotted for the excitation to each of the components of the 13Π (Fig. S3, ESI†) and 11Π (Fig. S4, ESI†). For all propagations the population in the initially excited state starts decreasing after 50 fs, therefore it seems that this is the time that it takes for the wavepacket to reach the crossing region.
Due to the many states and spin–orbit couplings a detailed study of the state populations is tedious and not very illuminating. However, the strong SO coupling between the 11Π and 13Π is noticeable, with fast oscillatory population transfer between these states seen in many of the simulations. The complicated details can be exemplified by looking at the populations after starting in the two components of the 1Π state. The A′ component population flows into a number of states, including the ground 1Σ+ state. In contrast, the A′′ component population ends predominantly in the 23Π state.
In Fig. 7 the state populations for these excitations are plotted summed up into the IBr dissociation channels of the spin-coupled states. These are listed on the right hand side of Fig. 1 and seen in the potential curves of Fig. 3. There are four, defined with channel 1 as the lowest energy channel. In these figures it is even clearer to see that the first sudden change in population occurs around 50 fs, after this time population oscillates for certain time until the wavepacket reaches the dissociation region and it starts being absorbed by the complex absorbing potential (CAP). In both cases the population is initially in channel 1, but population transfer to channels 2 and 3 occurs. A difference is the time that takes the wavepacket to reach the dissociation region. It seems that the excitation to the 1ΠJ states runs slightly faster, with the CAP starting to absorb the wavepacket before 200 fs, while for the excitation to the 3ΠJ the wavepacket starts being absorbed around 200 fs as well but the absorption in channel 1 is slower and the population decreases to below 10% after 300 fs, instead of 230–250 fs in the other cases.
 | ||
| Fig. 7 Average population of spin–orbit coupled states summed up into the four spin-coupled dissociation channels after vertical excitation to all components of (a) 13Π and (b) 11Π. | ||
The flux ending up in the different channels for all the different excitations is given in Table S1 in the ESI.† A representative result for propagation starting in the non-dissociative states is shown for the 1Σ−0− state in Fig. 8. The state populations, shown summed into the different channels in Fig. 8(a), oscillates along the whole propagation, and the wavepacket never reaches the crossing or the dissociation region. The expectation value of the bond length is shown in Fig. 8(b). It is seen to initially stretch, but the motion is then damped after 100 fs, ending at a slightly elongated value compared to the equilibrium bond length. This is a surprising result as the system energy is above the dissociation threshold. It seems that a highly excited electronic wavepacket has formed, with fast population transfer between the states taking the energy out of the nuclear motion. Further analysis is required to understand this behaviour.
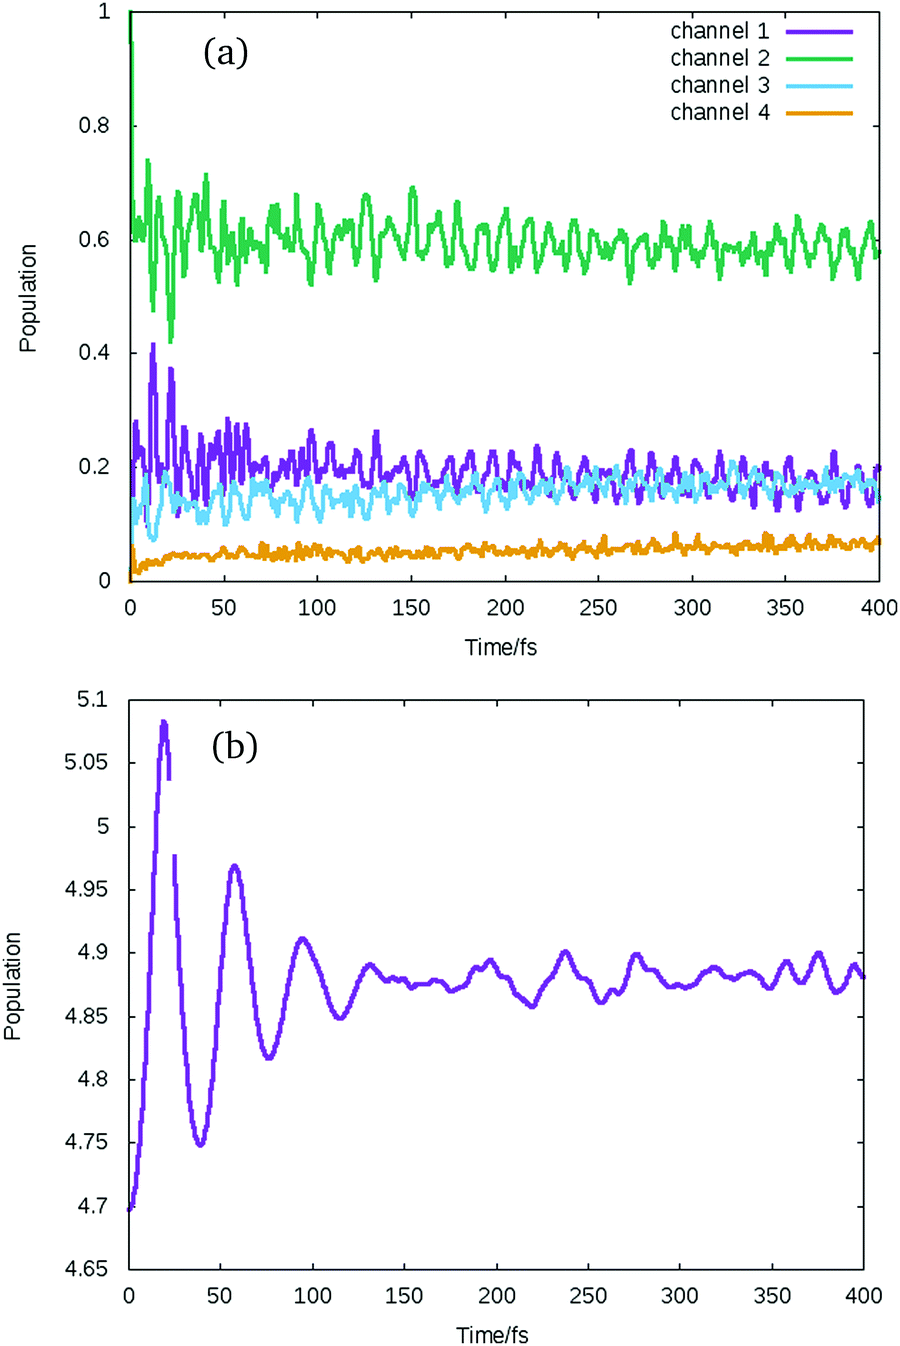 | ||
| Fig. 8 (a) Average population of spin–orbit coupled states sum up over all the states dissociating to each dissociation channel when the wavepacket is excited to the high lying dark state (11Σ−). (b) The expectation value of the bond length after the excitation. | ||
The vertical excitation simulations provide the natural time-scale for the IBr photo-dissociation when described by a one-dimensional model. The next step is to simulate the non-resonant Stark shifting excitation, including laser pulses that follow the scheme used in the experiment. Two pulses are used: the first is to promote the system to the excited states, with an energy slightly above the dissociation limit of the two first dissociation channels (100 fs and 520 nm), and the second, the control pulse (150 fs, 1.7 μm with intensity below 10−13 W cm−2). The control pulse is applied at a series of time delays before, during and after the excitation pulse.
In this way the wavepacket is promoted to the excited state using a pump pulse, shown by the purple curves in the upper panels of Fig. 9 and 10. The control of the dissociation channel is produced using the non-resonant Stark effect, which theoretically does not interact with the dipole moment, so that the shift of the potential curves follows the electric field given by the envelope of the pulse. For this reason we employ two different kinds of control pulses, one which oscillates with a certain frequency, green line in the upper panel of Fig. 9 and one which is only the Gaussian pulse envelope, green line in the upper panel of Fig. 10. The branching ratio is then obtained by calculating the flux going into each dissociation channel. With just the excitation pulse (i.e. no control pulse applied), only 36.21% of the wavepacket reaches the dissociation channels after 1650 fs. Of this, 99.42% is the lowest energy channel with I and Br in their ground-states, and 0.57% is in the next channel with Br in its excited-state. A negligible amount exits in the upper channels.
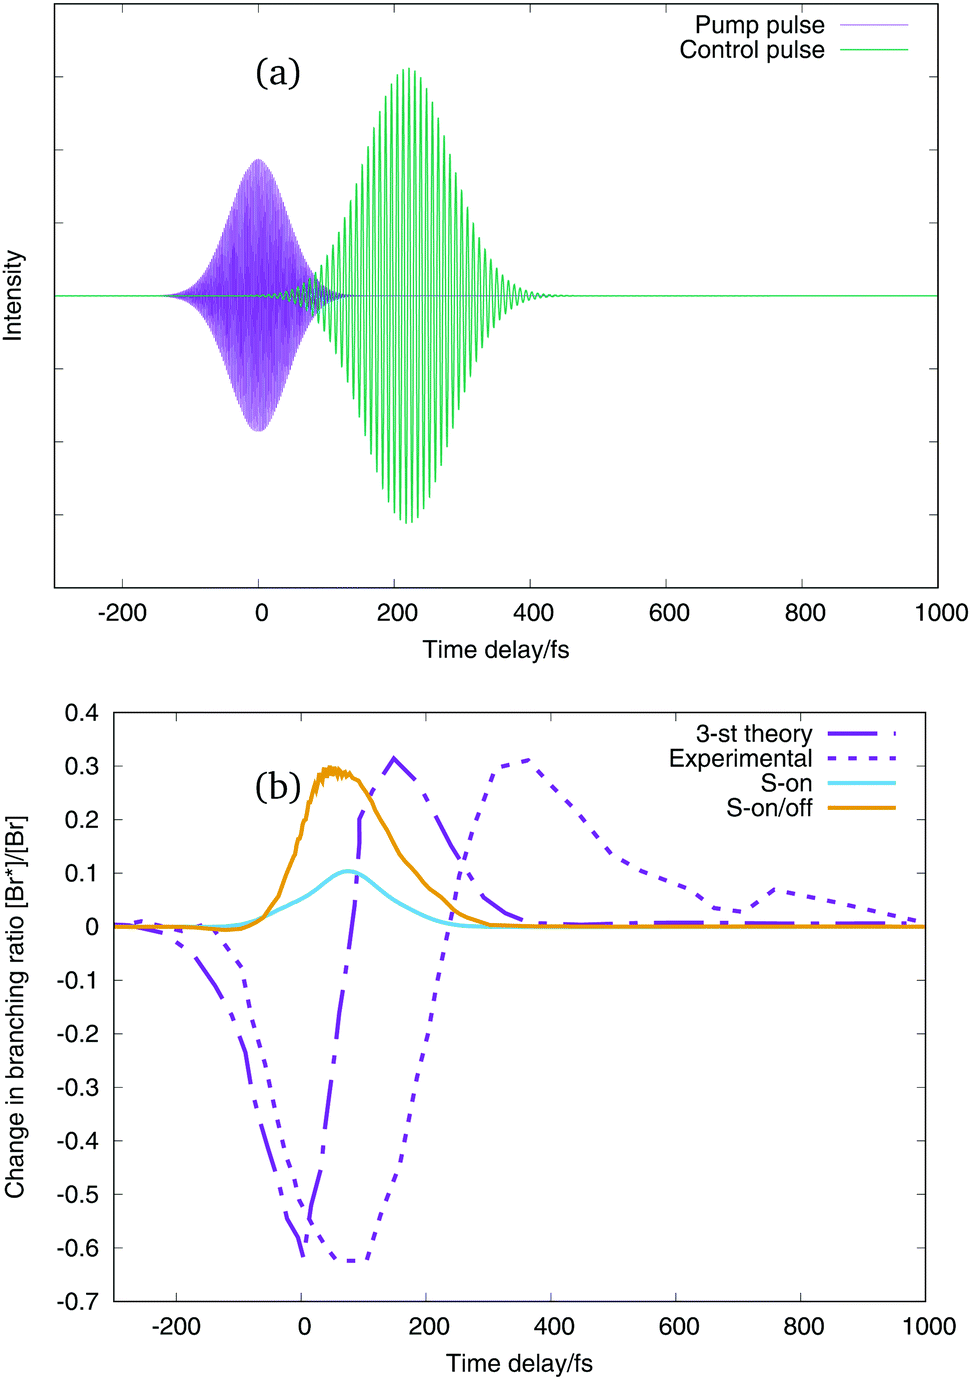 | ||
| Fig. 9 (a) Excitation and control pulses for a time delay of the control pulse of 220 fs. (b) Change in branching ratio Br*/Br with respect to the time delay of the control pulse. Purple dot-line curve: three-state theoretical simulation,2 purple dashed-line curve: experimental values ratio,2 light blue line: our results when control pulse only interacts with on-diagonal potential energy term, orange line: our results when control pulse interacts with on and off diagonal potential energy terms. | ||
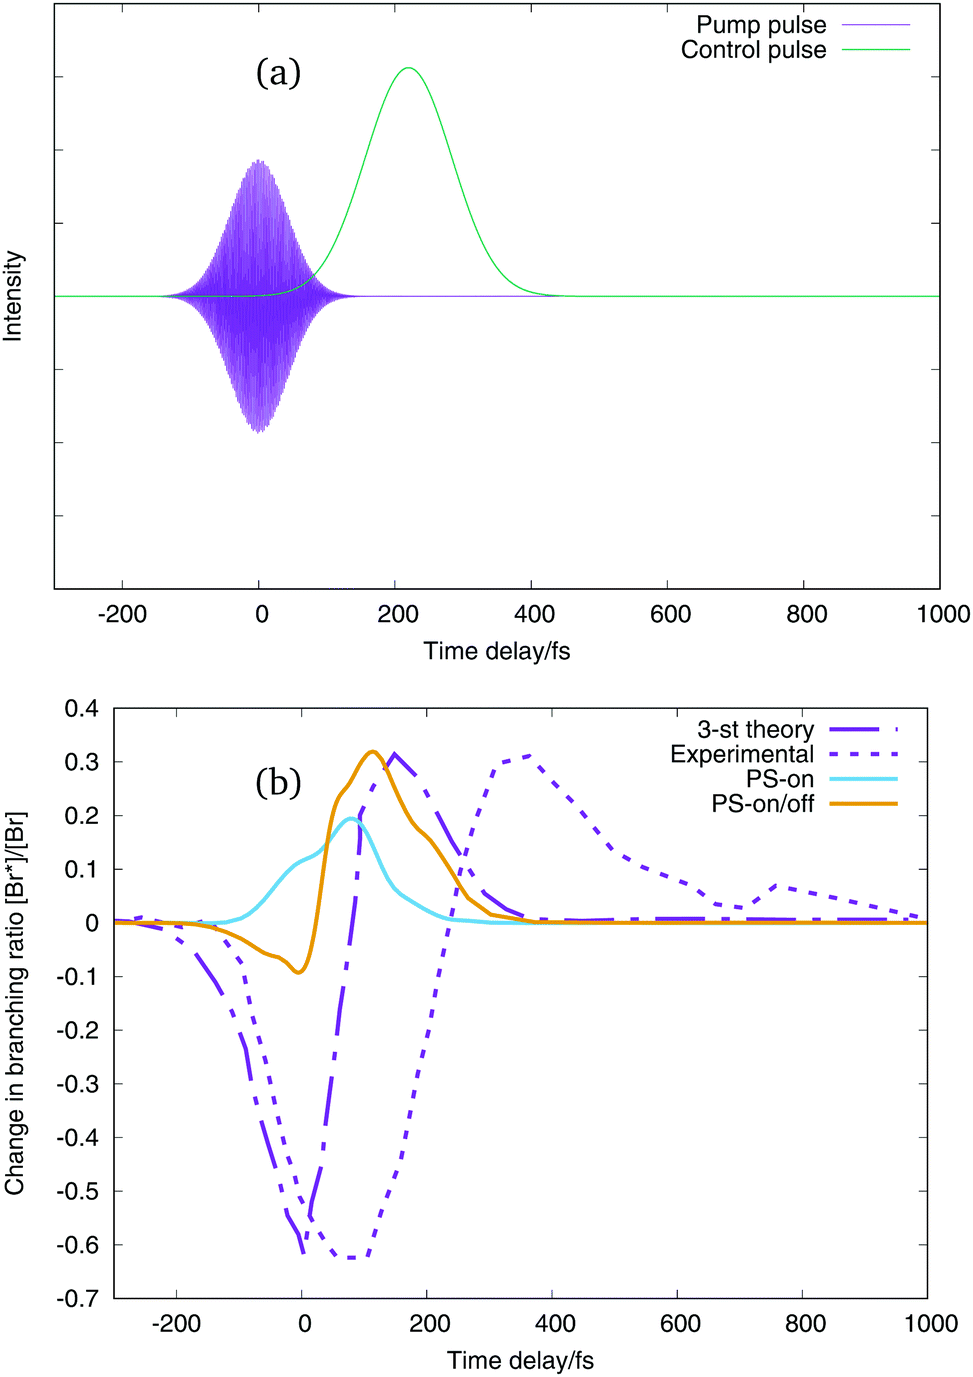 | ||
| Fig. 10 (a) Excitation pulse and the envelope control pulse for a time delay of the control pulse of 220 fs. (b) Change in branching ratio Br*/Br with respect to the time delay of the control pulse. Purple dot-line curve: three-state theoretical simulation,2 purple dashed-line curve: experimental values ratio,2 light blue line: our results when control pulse only interacts with on-diagonal potential energy term, orange line: our results when control pulse interacts with on and off diagonal potential energy terms. | ||
The change in branching ratio of IBr in the two lower dissociation channels obtained using the two pulses is shown in the lower panels of Fig. 9 and 10. This is defined as the fractional change relative to the branching ratio calculated without a control pulse being applied. Negative values of the ratio means that the dissociation into the Br(2P3/2) + I(2P3/2) channel is enhanced (lowest dissociation channel), and positive values of the change in branching ratios means that the dissociation into the Br(2P1/2) + I(2P3/2) channel is enhanced (first excited dissociation channel). The purple dot-line curve is the theoretical 3-state model change in branching ratio, and the purple dashed curve the experimental result from Sussman et al.2 The other two curves, in light blue and orange are the change in branching ratio of our simulation using the 36 potential energy states and the z-component of the transition dipole moments between all the states with non-negligible values. The difference between the light blue and orange curve is the interaction of the control pulse. The light blue curve presents the change in branching ratio when both control pulses only interacts with the on-diagonal terms of the dipole matrix and polarisabilities (on-diagonal interaction), and the orange curve presents the change in branching ratio when the control pulse interacts with the on and the off-diagonal terms of the dipole matrix and polarizabilities (on/off-diagonal interaction), see eqn (4) and (5). It is worth pointing out here that the effect of the control pulse comes from the interaction with the fixed dipole moments and polarizabilities. The simulations in this work do not include the dependency of the potential energy curves with the field strength.
Considering first the results shown in Fig. 9, the on-diagonal interaction and the on/off-diagonal interaction give very similar results: in both cases only the dissociation in the Br* channel is significantly enhanced. The on-diagonal interaction, light blue line, enhancement of the Br* channel is however, lower than the full on/off-diagonal interaction. The orange line shows a very little enhancement of the Br channel for small negative time delays. In both simulations the enhancement of the excited dissociation channel does not agree with either the theoretical 3-state (purple dot-line curve) or experimental (purple dashed curve) results with the enhancement of the Br* channel appearing at shorter times delays.
In Fig. 10 the change in branching ratio calculated when the control pulse consists only of a Gaussian envelope are shown. Again, both the on-diagonal interaction and on/off diagonal interaction calculations show a significant enhancement of the Br* channel. Now, the change in branching ratio for the on/off-diagonal interaction behaves like the 3-state model simulation,2 with an initial enhancement of the Br channel before the Br* enhancement. It is, however, much lower in our results than either the earlier model or experiment. Probably the fact that in our results the enhancement of the lower dissociation channel is smaller could come from the resonant interaction of the pump pulse with the dipole moment. The laser excitation in our simulation can populate higher excited states which could produce dissociation in higher channels (Br + I* and Br* + I*). It can also be noted that the result from the new 36-state model has more structure in the branching ratio profile than the simple 3-state model. This is in line with our earlier study using an extended 3-state model that identified other control mechanisms to be present in addition to the moving of the avoided crossing. These included enhancement to the lower channel due to the changed excitation process at t = 0 fs due to the overlapping excitation and control pulses.3
The 3-state model simulation and the on/off-diagonal pulse–potential interaction of the Gaussian envelope thus present the same behaviour, with an enhancement of the lower dissociation channel, Br, when the delay of the control pulse is at short negative times, and an enhancement of the excited dissociation channel, Br*, for positive values of time delays. It is evident, however, that none of the theoretical simulations have the same time scales as the experimental results. The Br channel peak in the simulations peaks at around 0 fs and the Br* channel peak around 100 fs, whereas in the experiment the first peak is around 100 fs and the second 350 fs.
4 Conclusions
In this work are presented the calculations of the potential energy curves of all the states dissociating in the ground state of IBr. This includes the calculations of the spin–orbit couplings within all states which dissociate into the four spin–orbit states of I(2P3/2, 2P1/2) and Br(2P3/2, 2P1/2). The full set of potential curves and spin–orbit couplings are calculated under the influence of several electric-field strengths and angle orientations. The field strength runs from 0 to 0.025 a.u. and the angle orientation from 0 to 180 degrees. A procedure to smooth the spin–orbit couplings along the intermolecular distance is presented and probed to provide the right results after the diagonalisation of the spin–orbit matrix. The three-dimensional curves (r,E,θ) are fitted using spline interpolation.Preliminary results of dynamical calculations using the whole set of states are also presented. The wavepacket propagation runs in the field-free potential curves and is excited and controlled using the pulse–dipole and pulse–polarisability interactions. It is found that the results obtained for the change in dissociation branching ratio follow the same behaviour as the previous 3-states theoretical results as well as the experimental results as long as all interactions are included and the oscillating field in the control pulse is ignored. The dissociation into the lowest channel is mainly enhanced when the pump and control pulses starts to overlap in time. Looking at the potential curves as a function of field strength, this can be explained by the fact that the control pulse separates the curves before the excitation, causing a decreasing on the excitation into states above the first excited dissociation channel. However, when the control pulse is applied at times delays in which the wavepacket is approaching the crossing, the separation of the states helps the dissociation into the first excited channel.
The propagation time scale seen in the simulations is, however, still far from the experimental result and the relative magnitude of the branching ratio peaks is incorrect. The time scale is a particular issue, seen in all simulations to date. In the experiments the first, negative, peak in the change in branching ratio occurs around 100 fs and the second, positive, peak around 350 fs. In contrast, the simulations provide the first peak at 0 fs and the second at 100 fs. These differences must arise from the approximations made in the simulations. In line with earlier work, the model is only one-dimensional, with the molecule oriented along the z-axis. In fact, the main difference in the present model compared to the earlier 3-state model is the addition of more states. In this fixed orientation the excited molecule has an intrinsically fast dynamics: the avoided crossing is reached within 50 fs and the molecule has fully dissociated by 200 fs making it a mystery as to how in the experiments control is seen up to 500 fs. In addition to this fixed geometry, again following earlier work, only the transition dipole along the z-axis and a static polarisability were included as these usually provide the dominant interaction with the field.
The next step will be to include the full interaction of the field with all the states and all the transition dipole moments to see the effect of the angle dependency and strength. The present simulations indicate that it must be the interplay of all factors that slows the observed dynamics significantly and will lead to a full understanding of the experimental data.
Conflicts of interest
There are no conflicts to declare.Acknowledgements
This paper is dedicated to Mike Ashfold on the occasion of his 65th birthday in recognition of his pioneering work in time-resolved spectroscopy and molecular reaction dynamics.References
- B. J. Sussman, M. Y. Ivanov and A. Stolow, Phys. Rev. A: At., Mol., Opt. Phys., 2005, 71, 051401 CrossRef.
- B. J. Sussman, D. Townsend, M. Y. Ivanov and A. Stolow, Science, 2006, 314, 278–281 CrossRef CAS PubMed.
- C. Sanz-Sanz, G. W. Richings and G. A. Worth, Faraday Discuss., 2011, 153, 275–291 RSC.
- H. Cordes, Z. Phys., 1932, 74, 34 CrossRef CAS.
- W. Brown and G. E. Gibson, Phys. Rev., 1932, 40, 529 CrossRef CAS.
- W. Brown, Phys. Rev., 1932, 42, 355 CrossRef CAS.
- R. S. Mulliken, Phys. Rev., 1942, 61, 277 CrossRef CAS.
- S. Y. Lee and Y. S. Lee, Chem. Phys., 1991, 187, 302 Search PubMed.
- W. A. Jong, J. Styszynski, L. Visscher and W. C. Nieuwpoort, J. Chem. Phys., 1998, 108, 5177 CrossRef.
- J. Pittner and P. Jungwirth, Chem. Phys. Lett., 2000, 321, 281 CrossRef CAS.
- H. S. Lee, W. K. Cho, Y. J. Choi and Y. S. Lee, Chem. Phys., 2005, 311, 121 CrossRef CAS.
- S. Patchkovskii, Phys. Chem. Chem. Phys., 2006, 8, 926–940 RSC.
- M. S. Child, Mol. Phys., 1976, 32, 1495 CrossRef CAS.
- S. C. Leasure, K. F. Milfeld and R. E. Wyatt, J. Chem. Phys., 1981, 74, 6197 CrossRef CAS.
- M. Shapiro and H. Bony, J. Chem. Phys., 1985, 83, 1588 CrossRef CAS.
- H. Guo, J. Chem. Phys., 1993, 99, 1685 CrossRef CAS.
- A. N. Hussain and G. Roberts, J. Chem. Phys., 1999, 110, 2474 CrossRef CAS.
- I. Levy, M. Shapiro and P. Brumer, J. Chem. Phys., 1990, 93, 2493 CrossRef CAS.
- C. K. Chan, P. Brumer and M. Shapiro, J. Chem. Phys., 1991, 94, 2688 CrossRef CAS.
- P. Gross, D. B. Bairagi, M. K. Misha and H. Rabitz, Chem. Phys. Lett., 1994, 223, 263 CrossRef CAS.
- S. Zou, G. G. Balint-Kurti and F. R. Manby, J. Chem. Phys., 2007, 127, 44107 CrossRef PubMed.
- NIST Atomic Spectra Database, NIST Standard Reference Database 78.
- H.-J. Werner, P. J. Knowles, G. Knizia, M. F. R. Manby, et al., MOLPRO, version 2008.1, a package of ab initio programs, 2008 Search PubMed.
- T. Tsuchiya, M. Abe, T. Nakajima and K. Hirao, J. Chem. Phys., 2001, 115, 4463–4472 CrossRef CAS.
- G. A. Worth, K. Giri, G. W. Richings, I. Burghardt, M. H. Beck, A. Jäckle and H.-D. Meyer, QUANTICS, a suite of programs for molecular QUANTum dynamICS simulations, Version 1.1, 2015 Search PubMed.
- M. Vrakking and D. M. V. A. Stolow, J. Chem. Phys., 1996, 106, 5647–5650 CrossRef.
- D. R. T. Appadoo, P. F. Bernath and J. L. Roy, Can. J. Phys., 1994, 21, 1265–1272 CrossRef.
- L. E. Selin and B. Soderborg, Ark. Fys., 1962, 21, 515 CAS.
- T. Yukiya, N. Nishimiya and M. Suzuki, J. Mol. Spectrosc., 2002, 214, 132 CrossRef CAS.
- M. Macler, M. Erickson, H. Lin and M. C. Heaven, J. Phys. Chem., 1992, 96, 4301 CrossRef CAS.
- J. O. Clevenger, E. P. Ray, J. Tellinghuisen, X. Zheng and M. C. Heaven, Can. J. Phys., 1994, 72, 1294 CrossRef CAS.
- R. Li, C. Wei, Q. Sun, E. Sun, M. Jin and H. Xu, J. Quant. Spectrosc. Radiat. Transfer, 2014, 133, 271 CrossRef CAS.
- R. E. Willis Jr and W. W. Clark III, J. Chem. Phys., 1980, 72, 4946 CrossRef.
Footnote |
| † Electronic supplementary information (ESI) available: Further results from simulations. See DOI: 10.1039/c8cp07248e |
| This journal is © the Owner Societies 2019 |