 Open Access Article
High hydrogen evolution activity and suppressed H2O2 production on Pt-skin/PtFe alloy nanocatalysts for proton exchange membrane water electrolysis†
Guoyu
Shi
a,
Hiroshi
Yano
b,
Donald A.
Tryk
 b,
Shinji
Nohara
a and
Hiroyuki
Uchida
 *ab
*ab
aClean Energy Research Center, University of Yamanashi, Takeda 4, Kofu, 400-8510, Japan. E-mail: h-uchida@yamanashi.ac.jp
bFuel Cell Nanomaterials Center, University of Yamanashi, Takeda 4, Kofu, 400-8510, Japan
First published on 25th January 2019
Abstract
We, for the first time, demonstrate high electrocatalytic activity for the hydrogen evolution reaction (HER) on PtFe alloy nanoparticles with stabilized Pt-skin layers supported on carbon black (PtxAL–PtFe/C), which allows the reduction of Pt loading to be lowered to 1/20 compared with a conventional Pt black cathode in proton exchange membrane water electrolysis (PEMWE). The area-specific HER activity of PtxAL–PtFe/C was found to be ca. 2 times higher than that of commercial Pt/C at 80 °C and −0.02 V vs. RHE. PtxAL–PtFe/C exhibited the additional important advantage of suppressed H2O2 production during the HER in the presence of O2, which inevitably diffuses from the anode in PEMWE. Both the excellent HER performance and low H2O2 production are attributed to the lower adsorption energies of atomic hydrogen on Pt-skin surfaces, as revealed by DFT calculations.
High purity hydrogen is produced by water electrolysis with renewable electric power (such as photovoltaics or wind power systems), which levels the output fluctuations when combined with stationary fuel cells. Proton exchange membrane water electrolyzers (PEMWEs) show advantages such as high energy conversion efficiency at high current densities, as well as a compact system with easy maintenance and start-up/shut-down. However, one of the disadvantages of conventional PEMWEs is the use of large amounts of noble metal catalysts such as (Pt + Ir) black at the oxygen-evolving anode (≥2 mgPt+Ir mg cm−2) and Pt black at the hydrogen-evolving cathode (≥2 mgPt cm−2).1–6
Our recent research has aimed to develop new electrocatalysts that can reduce the amount of noble metals down to 1/10 while maintaining high voltage efficiency εV exceeding 90%. We have recently succeeded in preparing new anode catalysts, IrOx nanoparticles on doped SnO2 supports with a fused-aggregate structure, having the potential of decreasing the Ir loading to 0.1 mg cm−2, while maintaining εV = 90% at 1 A cm−2 and 80 °C.7
At the cathode side, Pt catalysts have been commonly used which have high activity for the hydrogen evolution reaction (HER) in acidic media. The use of Pt nanoparticles supported on carbon black (Pt/C) can reduce the Pt loading markedly, compared with Pt black,8 but Pt black has still been predominantly employed in practical PEMWEs in order to ensure a long lifetime of the membrane-electrode assembly (MEA). During water electrolysis, O2 generated at the anode diffuses (“crosses over”) through the PEM to the cathode, resulting in the production of H2O2via a two-electron oxygen reduction reaction (ORR), as well as possibly via a chemical reaction of O2 with adsorbed H atoms (or H2 molecules). H2O2 can diffuse into both the PEM and the catalyst layer. Most of the H2O2 can be decomposed by Pt cathode catalysts. However, OH radicals are formed in the presence of impurities such as Fe2+.9 The HO˙ attacks the PEM, as evidenced by decreases in the thickness of the PEM after long-term operation.8,10,11 It is essential to clarify whether Pt/C may intrinsically produce more H2O2, or it may produce more HO˙ since carbon supports might take part in the radical formation.12 Therefore, we have focused on developing highly active, highly durable catalysts for the HER with suppressed production of H2O2 in the presence of crossover O2.
Recently, we have found that Pt–M (M = Fe, Co, Ni) alloy catalysts, having a stabilized Pt skin (PtxAL, one to two atomic layers), supported on carbon black (PtxAL–Pt–M/C) exhibited higher activity for the hydrogen oxidation reaction (HOR) in 0.1 M HClO4 solution at 70 to 90 °C than that of commercial Pt/C (c-Pt/C). Both the kinetically-controlled area-specific activity jk and mass activity MAk for the HOR on the PtxAL–PtFe/C at 20 mV vs. reversible hydrogen electrode (RHE) were about 2 times higher than those of c-Pt/C.13 In the present research, considering the general trend that Pt-based catalysts that display high activity for the HOR also display high activity for the HER,14 we examine the activity for the HER on PtxAL–PtFe/C, together with clarifying the H2O2 formation rate during the HER in the presence of dissolved O2, compared with those on c-Pt/C and Pt black.
The PtxAL–PtFe/C catalyst was prepared in the same manner as that described previously.15 The specific surface area of the carbon black support was 780 m2 g−1. Two commercial catalysts, c-Pt/C (46.1 mass% Pt, TEC10E50E, TKK) and Pt black (TPT-200, Tokuriki Honten Co., Ltd), were used for comparison. XRD patterns, elemental distributions, and TEM images of the catalysts are shown in Fig. S1–S3 (ESI†). Electrochemical experiments were performed using a channel flow double electrode (CFDE) cell in 0.1 M HClO4 at 80 °C,16 while the working electrode (WE) employed herein was a glassy carbon (GC) substrate in order to minimize the H2O2 production. The reference electrode used was a reversible hydrogen electrode (RHE), and all of the electrode potentials in this paper were given versus the RHE.
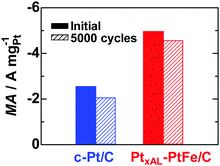
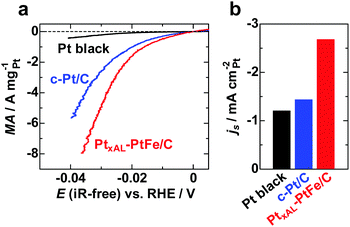
Fig. 1a shows iR-free polarization curves for the HER on PtxAL–PtFe/C, c-Pt/C, and Pt black in H2-saturated 0.1 M HClO4 at 80 °C, in which the current is shown as the apparent mass activity (MA). The value of MA at all potentials increased in the order Pt black < c-Pt/C < PtxAL–PtFe/C. The apparent area-specific activities (js, based on the electrochemically active area, ECA) at −0.02 V on these catalysts are shown in Fig. 1b. Since the value of js on c-Pt/C is comparable to that of Pt black, the higher MA on c-Pt/C than that of Pt black is well explained by its larger ECA (69.7 m2 gPt−1vs. 6.8 m2 gPt−1). Notably, the value of js on PtxAL–PtFe/C was about 2 times higher than that of c-Pt/C, providing high MA, e.g., the MA of PtxAL–PtFe/C at −0.02 V was −1.62 A mgPt−1, which is about 1.6 times higher and 20 times higher than that of c-Pt/C (−1.01 A mgPt−1) and Pt black (−0.08 A mgPt−1), respectively. In addition, an accelerated durability test of the catalysts was conducted by potential cycling between −0.03 and 0.95 V at 80 °C in N2-purged 0.1 M HClO4, which simulates the start–stop cycles for PEMWEs (see Fig. S4, ESI†). As shown in Fig. 2, the HER MA loss of PtxAL–PtFe/C at −0.03 V after 5000 cycles was only 8%, whereas c-Pt/C showed a larger loss of 20%. The increased durability of PtxAL–PtFe/C was attributed to the uniform particle size of PtxAL–PtFe, as well as the increased rigidity of the Pt skin/alloy structure.13,17 Such superior properties (HER activity and durability) of PtxAL–PtFe/C at the practical operating temperature would make it possible to reduce the Pt loading for the PEMWE.
 | ||
| Fig. 2 Changes in MA values for the HER at −0.03 V and 80 °C measured after 5000 potential cycles (hatched bars) between −0.03 and 0.95 V in N2-purged 0.1 M HClO4 with the scan rate of 0.1 V s−1 (see Fig. S4, ESI†). | ||
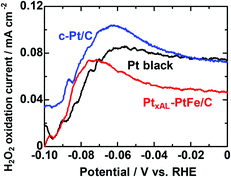
Next, we have measured the H2O2 production rates at these catalysts during the HER. H2O2 emitted from the WE of the CFDE was detected as the oxidation currents at the collecting electrode (CE) while hydrogen was also being generated at the WE. We note that the H2 generated at the WE would also, in principle, be detected as HOR current at the CE, but, at the high potential (1.4 V) of the CE, the HOR is experimentally found to be suppressed.18 Raw data are shown in Fig. S5 (ESI†). In any case, the small background current is subtracted. Fig. 3 shows the potential dependence of the H2O2 oxidation current density at the CE (a measure of H2O2 production rate, r(H2O2) at the three catalysts during the HER) measured in O2-saturated 0.1 M HClO4 solution. A general trend for all catalysts is that the r(H2O2) increases gradually from 0 to ca. −0.06 V. The r(H2O2) on Pt black was nearly identical with that of Pt/C between 0 to −0.03 V, but it became lower at increasingly negative potentials, which may be the reason for the use of Pt black so far. The r(H2O2) on PtxAL–PtFe/C was clearly lower than those on Pt black or Pt/C. Below −0.06 V, the r(H2O2) steeply decreased for Pt black and Pt/C. Such trend was also seen for PtxAL–PtFe/C, but the peak potential shifted negatively (−0.07 V). The H2O2 yields P(H2O2), i.e., the percentage of H2O2 production versus the total current at the WE, are also shown in Fig. S6 (ESI†). The values of P(H2O2) on these catalysts decreased monotonically with decreasing potential. PtxAL–PtFe/C exhibited substantially lower r(H2O2) than those of Pt black and Pt/C, especially in the potential range from 0 to −0.06 V. The suppression of H2O2 production at the cathode, as seen for the lower values of P(H2O2) and r(H2O2), can contribute with certainty to mitigating the chemical degradation of membranes or MEAs.
 | ||
| Fig. 3 Potential-dependent H2O2 oxidation current density for various catalysts measured in O2-saturated 0.1 M HClO4 solution at 80 °C. | ||
Here, we propose that both the increase and decrease of r(H2O2) are due to reactions involving adsorbed hydrogen, specifically, involving O2 to produce H2O2, and, in turn, its further reduction. It is well known for Pt single crystal electrodes that H2O2 can be produced quantitatively on the Pt(111) surface in the low-potential region where the coverage of underpotentially deposited hydrogen atoms θ(HUPD) is high.19 This effect also can operate with Pt/C catalysts.20,21 Thus, H2O2 is produced predominantly on (111) facets of the Pt nanoparticles due to end-on adsorption of O2, with the neighboring sites blocked by HUPD. It has been clarified that the adsorption of HUPD on the (111) face of Pt–Ni or Pt–Co alloy is weaker and the θ(HUPD) is lower than that of Pt(111).22,23 From the cyclic voltammograms for the three catalysts in N2-saturated solution (Fig. S7, ESI†), it is clear that the HUPD adsorption on PtxAL–PtFe/C is shifted toward less positive potentials, suggesting that the surface sites for O2 adsorption would be less blocked by HUPD, reducing the end-on adsorption of O2 and subsequent H2O2 production.
In order to understand the details of the increased rate for the HER and suppressed rate of H2O2 production on Pt skin–PtFe/C, density functional theory (DFT) calculations were carried out based on the stepped (221) surface, which includes (110) steps and (111) terraces, similar to those adopted in our previous work.13 In the present work, we consider that the steps are active sites for the coupled association of hydrogen atoms and desorption of H2, commonly referred to as the Tafel step, as described by Santana et al. in their DFT study of the HOR and HER on Pt(110).24 As shown in Table 1, the H adsorption energy at the (110) step edge of Pt skin/PtFe(221) is smaller than that of Pt(221). The activation energy for the Tafel step calculated is closely related to the H adsorption energy: Pt skin/PtFe(221) exhibited a smaller activation energy by 0.42 eV, compared with Pt(221) (see Fig. S8, ESI†). Thus, the higher rate for the HER on PtxAL–PtFe/C is reasonably explained by the decreased H adsorption energy.
| Adsorption site | Pt(221) | Pt skin/PtFe(221) |
|---|---|---|
| (110) step edge-2H | −1.37 | −0.94 |
| (110) step edge-O2 | −1.71 | −1.10 |
| (111) terrace-2H | −0.91 | −0.08 |
Interestingly, on the (111) terraces of Pt skin/PtFe(221), the H adsorption energy was found to be even more significantly decreased, being smaller by 0.83 eV than that for Pt(221). This is consistent with lower θ(HUPD) on the Pt skin/PtFe than those of Pt/C or Pt black, as shown in Fig. S7 (ESI†). In order to calculate the adsorption energy of HUPD as a function of coverage, we have used flat (111) models. As shown in Fig. S9 (ESI†), a honeycomb structure of the bridging H could be simulated at potentials below 0 V.25,26 As summarized in Table 2, the adsorption energies are similar to those for the (111) terraces on the (221) surfaces (see Table 1), especially for Pt(111). Irrespective of θ(HUPD), Pt skin/PtFe(111) showed significantly lowered H adsorption energies than those for Pt(111).
| θ(HUPD) | Pt(111) | Pt skin/PtFe(111) |
|---|---|---|
| 1/9 | −1.05 | −0.38 |
| 1 | −0.99 | −0.36 |
| 4/3 | −0.86 | −0.17 |
It is also important to discuss the role of the overpotentially deposited hydrogen HOPD in these reactions. The HOPD has been proposed to form below 0.1 V and to be involved in the HER. However, it differs from the H adsorbed at (110) steps discussed above, which is associated with a CV peak often observed at ca. 0.1 V.27 Specifically, we have reported that an intermediate of the HER on Pt is atomic H in the atop configuration, based on the in situ FTIR study, i.e., a peak of 2080–2090 cm−1 observed at potentials less positive than ca. 0.1 V was assigned to the HOPD on a polycrystalline Pt film electrode.28 Such an assignment has been validated by DFT studies on Pt(111).25,26 The adsorption energies of the HOPD are smaller than those of HUPD, resulting in lower average adsorption energy (Table 2 and Fig. S10, ESI†). The very weak adsorption of H means that, after its formation, it is very reactive, as discussed below.
The HOPD could chemically reduce O2 to form H2O2 (step 1 in Fig. S11, ESI†), and subsequently reduce H2O2 further to H2O (step 2 in Fig. S8 and S11, ESI†). The gradual increase of r(H2O2) at potentials between 0 to −0.06 V, and rapid decreases in r(H2O2) at less positive potentials on all three catalysts (Fig. 3) can be explained well by the stepwise reduction of O2, based on our FTIR result that the coverage of HOPD increases gradually below 0.1 V and increases steeply with further increase in the cathodic overpotential.28 Thus far, we have explained the potential-dependence of H2O2 formation shown in Fig. 3. Further, the DFT calculations suggests a more facile reduction of H2O2 with HOPD on Pt skin/PtFe(111) in comparison with Pt(111) (Fig. S12, ESI†), by 0.8 eV more exothermic, which can delay or slower the formation of H2O2, as seen for the less positive peak potential in Fig. 3. Thus, based on both indirect experimental and DFT results, we conclude that the weaker adsorption of both HUPD and HOPD, affording reduced end-on adsorption of O2, as well as easier H2O2 reduction by HOPD on the PtxAL–PtFe surface, is responsible for the smaller H2O2 production rate. However, obtaining direct experimental evidence addressing this point is challenging and will be the subject of ongoing research.
In addition, it was found that the HER rates on all catalysts were suppressed by the presence of O2 (Fig. S5, ESI†). The suppression was comparable for PtxAL–PtFe/C and c-Pt/C (by 13%) and somewhat larger for Pt black (by 20%) at −0.1 V in 0.1 M HClO4 solution saturated with O2 (1 atm). This is consistent with the strong adsorption of O2 at the HER-active step sites (Table 1). However, such a high O2 concentration would not normally exist at the cathode catalyst layer/PEM interface, and thus, the depression of the HER current would be much lower. In any case, it is necessary to examine the actual oxygen concentration in the operating cell and its effects.
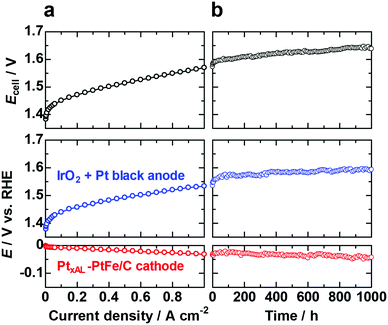
We have also examined the performance and durability of the PtxAL–PtFe/C cathode catalyst (0.2 mgPt cm−2, 1/10 that of standard Pt black) and a conventional anode (IrO2 + Pt black) in a PEMWE single cell with a reference electrode (RHE). The polarization curves recorded for cell potential and the electrode potentials vs. RHE are shown in Fig. 4a. The cell potential Ecell was 1.57 V (voltage efficiency of 94.3%) at 1 A cm−2 and 80 °C. The PtxAL–PtFe/C cathode was found to operate stably for continuous operation at 1 A cm−2 and 80 °C for 1000 h (Fig. 4b). In particular, we found that the membrane thickness was virtually unchanged (about 50 μm) after the durability test for 1000 h (Fig. S13, ESI†), suggesting that the formation of H2O2 near the Pt skin–PtFe/C cathode was possibly suppressed, which would be consistent with the CFDE results presented above. To further confirm that decreased H2O2 production results in increased cell stability, a cell stability test with a cathode consisting of a commercial Pt/C catalyst will be carried out and reported elsewhere.
In conclusion, we report herein a new hydrogen evolution electrocatalyst having a Pt-skin surface on PtFe alloy nanoparticles dispersed on a carbon support (PtxAL–PtFe/C). It exhibited ca. 2-times higher HER specific activity than commercial Pt catalysts, together with lower H2O2 production during the HER in the presence of O2. DFT results suggest that weak H adsorption on the Pt skin/PtFe surface boosts the HER while suppressing H2O2 production. This work contributes to expanding the understanding of HER electrocatalysis with accompanying H2O2 formation, as well as the cost reduction of PEM electrolysis devices, which should promote larger scale application.
Conflicts of interest
There are no conflicts to declare.Acknowledgements
This work was supported by “Fundamental Research on Highly Efficient Polymer Electrolyte Water Electrolyzers with Low Noble Metal Electrocatalysts” from Grant-in-Aid No. 17H01229 for Scientific Research (A) from the Japan Society for the Promotion of Science.Notes and references
- A. Jain and A. Ramasubramaniam, Phys. Chem. Chem. Phys., 2018, 20, 23262–23271 RSC.
- K. Ojha, S. Saha, P. Dagar and A. K. Ganguli, Phys. Chem. Chem. Phys., 2018, 20, 6777–6799 RSC.
- G. Zhang, K. Ming, J. Kang, Q. Huang, Z. Zhang, X. Zheng and X. Bi, Electrochim. Acta, 2018, 279, 19–23 CrossRef CAS.
- Q. Feng, G. Liu, B. Wei, Z. Zhang, H. Li and H. Wang, J. Power Sources, 2017, 366, 33–55 CrossRef CAS.
- M. Carmo, D. L. Fritz, J. Mergel and D. Stolten, Int. J. Hydrogen Energy, 2013, 38, 4901–4934 CrossRef CAS.
- M. K. Debe, S. M. Hendricks, G. D. Vernstrom, M. Meyers, M. Brostrom, M. Stephens, Q. Chan, J. Willey, M. Hamden, C. K. Mittelsteadt, C. B. Capuano, K. E. Ayers and E. B. Anderson, J. Electrochem. Soc., 2012, 159, K165–K176 CrossRef CAS.
- H. Ohno, S. Nohara, K. Kakinuma, M. Uchida, A. Miyake, S. Deki and H. Uchida, J. Electrochem. Soc., 2017, 164, F944–F947 CrossRef CAS.
- S. A. Grigoriev, K. A. Dzhus, D. G. Bessarabov and P. Millet, Int. J. Hydrogen Energy, 2014, 39, 20440–20446 CrossRef CAS.
- M. Aoki, H. Uchida and M. Watanabe, Electrochem. Commun., 2006, 8, 1509–1513 CrossRef CAS.
- M. Chandesris, V. Médeau, N. Guillet, S. Chelghoum, D. Thoby and F. Fouda-Onana, Int. J. Hydrogen Energy, 2015, 40, 1353–1366 CrossRef CAS.
- F. Fouda-Onana, M. Chandesris, V. Médeau, S. Chelghoum, D. Thoby and N. Guillet, Int. J. Hydrogen Energy, 2016, 41, 16627–16636 CrossRef CAS.
- E. Endoh, S. Terazono and H. Widjaja, Electrochem. Solid-State Lett., 2004, 7, A209–A211 CrossRef CAS.
- G. Shi, H. Yano, D. A. Tryk, A. Iiyama and H. Uchida, ACS Catal., 2016, 7, 267–274 CrossRef.
- N. M. Marković, B. N. Grgur and P. N. Ross, J. Phys. Chem. B, 1997, 101, 5405–5413 CrossRef.
- M. Watanabe, H. Yano, D. A. Tryk and H. Uchida, J. Electrochem. Soc., 2016, 163, F455–F463 CrossRef CAS.
- H. Yano, E. Higuch, H. Uchida and M. Watanabe, J. Phys. Chem. B, 2006, 110, 16544–16549 CrossRef CAS PubMed.
- G. Shi, H. Yano, D. A. Tryk, M. Matsumoto, H. Tanida, M. Arao, H. Imai, J. Inukai, A. Iiyama and H. Uchida, Catal. Sci. Technol., 2017, 7, 6124–6131 RSC.
- C. M. Zalitis, J. Sharman, E. Wright and A. R. Kucernak, Electrochim. Acta, 2015, 176, 763–776 CrossRef CAS.
- N. Markovic, H. Gasteiger and P. N. Ross, J. Electrochem. Soc., 1997, 144, 1591–1597 CrossRef CAS.
- M. Neergat, V. Gunasekar and R. K. Singh, J. Electrochem. Soc., 2011, 158, B1060–B1066 CrossRef CAS.
- M. Inaba, H. Yamada, J. Tokunaga and A. Tasaka, Electrochem. Solid-State Lett., 2004, 7, A474–A476 CrossRef CAS.
- V. R. Stamenkovic, B. Fowler, B. S. Mun, G. F. Wang, P. N. Ross, A. Lucas and N. M. Markovic, Science, 2007, 315, 493 CrossRef CAS PubMed.
- M. Wakisaka, S. Morishima, Y. Hyuga, H. Uchida and M. Watanabe, Electrochem. Commun., 2012, 18, 55–57 CrossRef CAS.
- J. A. Santana, J. J. Mateo and Y. Ishikawa, J. Phys. Chem. C, 2010, 114, 4995–5002 CrossRef CAS.
- J. J. Mateo, D. A. Tryk, C. R. Cabrera and Y. Ishikawa, Mol. Simul., 2008, 34, 1065–1072 CrossRef CAS.
- Y. Ishikawa, J. J. Mateo, D. A. Tryk and C. R. Cabrera, J. Electroanal. Chem., 2007, 607, 37–46 CrossRef CAS.
- Q. S. Chen, F. J. Vidal-Iglesias, J. Solla-Gullon, S. G. Sun and J. M. Feliu, Chem. Sci., 2012, 3, 136–147 RSC.
- K. Kunimatsu, H. Uchida, M. Osawa and M. Watanabe, J. Electroanal. Chem., 2006, 587, 299–307 CrossRef CAS.
Footnote |
| † Electronic supplementary information (ESI) available: Experimental details and supplementary figures. See DOI: 10.1039/c8cp06825a |
| This journal is © the Owner Societies 2019 |


