
 Open Access Article
 This Open Access Article is licensed under a
 Creative Commons Attribution 3.0 Unported Licence
Collision-induced absorption between O2–CO2 for the a1Δg (v = 1) ← X3Σ−g (v = 0) transition of molecular oxygen at 1060 nm
Agniva
Banerjee
 ,
Julien
Mandon
,
Frans
Harren
and
David H.
Parker
*
,
Julien
Mandon
,
Frans
Harren
and
David H.
Parker
*
Radboud University Nijmegen, Institute for Molecules and Materials, Heyendaalseweg 135, Nijmegen, 6525 AJ, The Netherlands. E-mail: parker@science.ru.nl; Tel: +31 243653423
First published on 17th December 2018
Abstract
Collision-induced absorption between O2 and CO2 molecules associated with the a1Δg (v = 1) ← X3Σ−g (v = 0) band of oxygen around 1060 nm was measured using cavity ring-down spectroscopy. The lineshape for this transition is measured for the first time, and the integrated cross-section is found to be smaller than the only previous report. For pure oxygen, we find an integrated absorption value of (2.10 ± 0.31) × 10−4 cm−2 amg−2 which is in good agreement with the previous reported values. For O2–CO2 collisions we report an integrated value of (6.37 ± 1.09) × 10−5 cm−2 amg−2 which is small but still significant and not accounted for by theory.
1. Introduction
Absorption of sunlight by atmospheric constituents is a complex phenomenon where the efficiency depends on the quantum nature of the molecules together with the details of collisions taking place among them. Collision-induced phenomena1 can be considered as resulting from a transient complex formed during collision where the absorption efficiency differs from those of the individual constituents. Due to the very short complex lifetime (≈10−13 s), collision-induced absorption (CIA) is small compared to normal line absorption, and relevant only at atmospheric pressures or higher.Carbon dioxide, CO2, is the most abundant greenhouse gas on Earth2 and industrial progress has resulted in a significant rise in CO2 concentration3 which causes increased surface warming, affecting Earth's climate. Reports of local yearly average CO2 concentrations at Mauna Loa Observatory, Hawaii, for example, indicated values of 407.98 ppm in January 2018, 406.13 ppm in January 2017 and 402.52 ppm in January 2016.4 A better understanding of the sources and sinks of carbon cycles is thus important. High precision satellite measurements of the local concentration of CO2 by ESA's Environmental Satellite (ENVISAT), and NASA's Orbiting Carbon Observatory (OCO-2) provide important new data for this quest.5–7 However, clouds and aerosols complicate accurate determination of CO2 concentration,8 and for these satellites, calibration methods are also needed.9,10
Molecular oxygen, O2, is often used for calibration as it is abundant and has a well-known spectrum.11–13 O2 is unusual in having many bound electronic states below the first dissociation limit, but all of the transitions from the ground electronic state in the infrared, visible, and ultraviolet region below the allowed VUV Schumann–Runge transition are optically forbidden. Very weak magnetic dipole and/or electric quadrupole transitions from the ground state to the lower excited electronic states are possible, along with transitions induced by weak spin–orbit coupling, which can increase significantly during a collision. Under Earth's atmospheric conditions, light absorption is often governed by collision-induced absorption. When one oxygen molecule collides with other atmospheric species such as O2, N2, or CO2, a transition moment can be induced, therefore lifting up the symmetry restrictions slightly,14 the efficiency of this phenomenon depends on the quantum character of the collision partner. The probability of CIA is also strongly dependent on the vibrational level of the O2 excited electronic state reached by CIA, where vertical excitation (Δv = 0) should be favoured for the lower vibrational states of oxygen.
In this paper, we study the O2 transition from X3Σ−g (v = 0) to a1Δg (v = 1), which lies around 1060 nm. Mixing by spin–orbit coupling of the X3Σ−g ground state with the higher lying d1Πg and/or C3Πg Rydberg state gives this transition magnetic dipole allowed character.15 While a strong decrease in the magnetic dipole transition for vibrational levels a (v > 0) due to unfavourable Frank–Condon factors is predicted,16 the collision induced absorption coefficient was found to be surprisingly large.17,18 Literature values for integrated O2–O2 CIA cross sections in cm−2 amg−2 for the near infrared bands of oxygen are listed in Table 1.19–22
| O2 | O2–O2 | O2–CO2 | ||
|---|---|---|---|---|
| X3Σ−g (v = 0) → | a1Δg (v = 0) | a1Δg (v = 1) | a1Δg (v = 0) | a1Δg (v = 1) |
a For a given pressure P (atm) and temperature T (K), the density D in amagat (amg) is expressed as 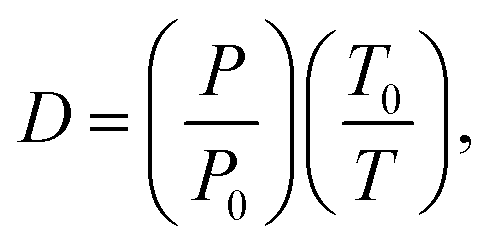 where P0 and T0 are at STP conditions and one amagat equals to 2.69 × 1025 molecule m−3 or 44.61 mol m−3. where P0 and T0 are at STP conditions and one amagat equals to 2.69 × 1025 molecule m−3 or 44.61 mol m−3.
|
||||
| Chagas et al.17 | 3.34 × 10⁻⁴ | 2.27 × 10⁻⁴ | ||
| Tran et al.19 | 2.74 × 10⁻⁴ | |||
| Tabisz et al.18 | 3.00 × 10⁻⁴ | 2.30 × 10⁻⁴ | ||
| Hermans et al.20 | 2.97 × 10⁻⁴ | 2.14 × 10⁻⁴ | ||
| Fraser et al.21 | 2.13 × 10⁻⁴ | |||
| Vangvichith et al.22 | 7.80 × 10⁻⁵ | 1.85 × 10⁻⁴ | ||
In a recent paper, Karman et al.23 reported ab initio calculations and experimental measurements of CIA between O2–O2 and O2–N2 for the X3Σ−g (v = 0) → a1Δg (v′ = 0, 1, 2) and b1Σ+g (v = 0, 1) transitions in details. Two mechanisms were found to be important: spin–orbit coupling which enhances only the Δv = 0 transition, and for O2–O2 (two paramagnetic molecules) an exchange mechanism involving the total electron spin of the collision complex in which total spin remains conserved while one O2 monomer changes its spin state.24 The spin exchange mechanism was found to also enhance Δv > 0 transitions. Near quantitative agreement was found between ab initio theory and experiment for these two collision pairs.
From fundamental interest, but also due to the importance of CO2 in exoplanet atmospheres,25,26 it is useful to compare CIA of O2–O2 and O2–N2 with that of O2–CO2. Vangvichith et al.22 reported an integrated CIA strength for O2–CO2 for the X (v = 0) → a (v = 0) and a (v = 1) transition. Fraser21 obtained a value of 2.13 × 10⁻⁴ cm−2 amg−2, significantly higher than the value from Vangvichith for the (v = 0) transition. We also note that Hidemori and co-workers27 reported a 2–3 times increase in emission intensity with the addition of a heavy atom/molecule for the a (v = 0) to X (v = 0) O2–O2 collision-induced emission transition, which they suggested as being due to an increase in the spin–orbit mixing of the O2 molecule. The only measurement of the CIA for the O2–CO2 X3Σ−g (v = 0) to a1Δg (v = 1) transition, ref. 22, reported only the integrated cross section, i.e., without line-shape information. The limited availability of data, together with the discrepancy in cross section values motivated the present study of the X (v = 0) → a (v = 1) transition for O2–CO2.
2. Experimental section
Fig. 1 shows a schematic overview of our cavity ringdown28,29 set-up used for measurement, which is similar to that of Spiering et al.,30 with some modifications. An optical cavity was created by placing two highly reflecting cavity mirrors (Layertec, reflectivity 99.993% between 9100–9900 cm−1, the radius of curvature 8000 mm) separated at 350 mm distance in between a high-pressure cell (max. pressure 10 bar). This creates an effective path length of ∼5 km. A continuous wave grating-stabilized diode laser (Toptica DL100) which consists of AR coated diode with the power of 170 mW in 9200–9500 cm−1 spectral region was used as the light source. The laser includes an optical isolator to prevent any reflection feedback. The line-width of the laser is much smaller than the free spectral range of cavity (0.0143 cm−1). A small portion (2%) of light was reflected through a glass plate to a wavelength meter (Ångström HighFinesse WS/6). The rest of the light was guided through silver mirrors, a convex lens (f = 25 cm) placed with a distance of 13 cm from the cavity cell and finally to the cavity cell respectively. Mode matching between the laser and cavity was obtained by tuning the mirror positions with an external controller and also by small adjustment of diode current. The addition of the lens helped in mode matching of the cavity as well as to excite only the lowest transverse mode. This procedure incorporates an uncertainty in the wavelength measurement of about half the free spectral range of the cavity (0.007 cm−1). The light leaking out of the cavity was detected using a Si-avalanche photodiode (Licel, 500–1100 nm). The pressure inside the cell was monitored with a diaphragm pressure gauge (Pfeiffer Vacuum D-35614, accuracy 0.3%). The controlled flow (200–250 ml min−1) of high purity oxygen (Linde gas, 99.9999% purity) and high purity carbon dioxide (Linde gas, 99.9993% purity) were passed to the cell using two different digital thermal mass flow controllers (El-Flow, Bronkhorst high tech). The flow rate set in the controllers determine the percentage of the resultant gas mixture in the pressure cell. Each measurement started with emptying out the cell using a membrane pump before gas filling. The signals of the pressure gauge and photodiode were sent to NI-5133 data acquisition device (National Instruments, 50 MHz Bandwidth, 100 MS/s, 2-Channel, 8-Bit), and the photodiode signal was sent to a home-built switch controller. When the light intensity of the photodiode reaches a pre-defined threshold value, a pulse (4 V, 200 μs) is used shut the laser off which occurs in the timescale of ns, so that the light in the cavity can decay exponentially. The decay time of an empty cavity was about 28–29 μs. For actual measurements, both pressure and decay signal were recorded simultaneously and the signals are sent to a computer for further analysis using a LabVIEW routine. The rate of measurement was kept constant at ∼3 decay signals per second either by changing the threshold value or increasing the sensitivity by changing the detector gain. This process was repeated for other wavelengths as well. Rayleigh Scattering (RS)31 contributes also to our extinction values. Measuring extinction as a function of pressure allowed us to differentiate RS from CIA due to different scaling in absorption with density. All the measurements were performed at 293 K. From the HITRAN database,34 it is clear that there are absorptions in our wavelength range due to O2, H2O, and CO2. To reduce their effect, the gas tubing along with the pressure cell were heated and the chamber was flushed with pure N2 or Ar for a long time. Wavelengths without line absorption of carbon dioxide and water were selected as much as possible. | ||
| Fig. 1 Experimental setup used for this study. | ||
3. Analysis
Collision-induced absorption (CIA) in an O2–CO2 mixture can be expressed by the following empirical formula (1), | (1) |
The constant value C was obtained from the empty cavity ring-down time at the measured laser wavelength. The Rayleigh scattering values for O2 were taken from Bates32 and for CO2 were taken from Bideau-Mehu33 (which produce values within the error bar) and subtracted from our measured extinction values. The resultant absorption values were fitted with a quadratic equation in order to extract the CIA coefficients at different wavenumbers. The fitting procedure with resultant absorption values for different gas mixtures is shown below in Fig. 2.
 | ||
Fig. 2 Density ramps for different mixtures of O2–CO2 used in this study at 9380.685 cm−1. (1) Green: 100% O2, 0% CO2, (2) pink: 60% O2–40% CO2, (3) blue: 50% O2–50% CO2, (4) red: 30% O2–70% CO2, (5) yellow: 100% CO2. **![[thin space (1/6-em)]](https://www.rsc.org/images/entities/char_2009.gif) For most of our measurements we used 100% O2 & 50% O2–50% CO2 mixtures, mixtures correspond to the pink, red and yellow lines were used only for confirmation. For most of our measurements we used 100% O2 & 50% O2–50% CO2 mixtures, mixtures correspond to the pink, red and yellow lines were used only for confirmation. | ||
This whole procedure was repeated for both pure O2 and O2/CO2 (1:1 mixture) for all wavelengths. The CIA coefficient values obtained for pure O2 were lowered with a factor of (0.502) or 0.25 because in the mixture only 50% O2 is present and CIA is quadratic in nature. The resultant scaled coefficient values originating from O2–O2 collisions were subtracted from the CIA coefficient values obtained from a (1:1) O2–CO2 mixture, which contains all contributions according to their relative partial pressures, so that this correction results in a CIA coefficient originating only due to O2–CO2 collisions.
In order to extract the CIA contribution arising from pure CO2–CO2 collisions (if this is measurable), the same procedure was carried out for pure CO2 gas. Line absorption of CO2 was taken from the HITRAN database,34 corrected for the corresponding pressure values and subtracted from the measured extinction values. The remaining CO2–CO2 absorption signal was very low as was the magnitude of its CIA coefficient when fit with a quadratic equation. Our system may not be sensitive enough to quantify such very low CIA values, as discussed later in this article. In the following analysis, we neglected the contribution arising from CO2–CO2 collisions.
4. Results and discussions
Quadratic fitting (y = ax2 + bx + c) of the measured extinction values with density results in two coefficients, one which depends on the square of density (a), one which linearly depends on density (b) and (c) being the intercept. The first coefficient corresponds to CIA and the second to Rayleigh Scattering (RS). For pure O2, we see a quadratic dependence on density and from simple fitting it was possible to extract the RS coefficients, although the values obtained from measurements had large error (≥50%) and deviated from the theoretical values provided by Bates.32 For CO2, the very weak extinction values did not show a clear quadratic or linear dependence and it was difficult to use for a proper fitting in order to extract coefficients. This can be due to very low absorption or scattering by CO2 in this wavelength region, or to a limitation within our system itself. Theoretical RS values were used instead of obtained values.The HITRAN database allows us to identify the most prominent H2O line absorption between 9150–9350 cm−1. To avoid these absorptions, experimental wavelengths were chosen which fall between water line absorptions. Gases with very high purity and heating of the tubes ensured a water absorption value <10−8 cm−1. From Fig. 3, it is clear that line absorptions of CO2 are much more pronounced than those of O2. Although the strongest absorptions for CO2 occur around 9500 cm−1, our diode could measure only until 9480 cm−1. The CO2 lines were so dense, it was very difficult to set the laser at a wavelength without line absorption. In addition, when the molecules collide, due to inelastic collisions, there will be a transfer of intensity. Our line mixing program41 takes into account molecular inelastic collisions towards the line shape which results in the intensity transfer between two adjacent rotational lines following an expression by Fano for this effect.35 Later Tonkov36 introduced one more parameter previously defined by Fano, to allow line mixing between transitions between two different branches, called the ABC model. This model was applied for O2, CO, CO2, CH3F, and CH4 successfully.36–40 Our line mixing model uses a Voigt convolution of line mixing spectra and Gaussian contributions arising from Doppler effect as described by Spiering and co-workers.41 The computational program determines the line mixing correction on the sum of Voigt line shape spectrums based on the collisional parameters, which includes pressure shifts, for each transition value reported in the HITRAN database.34 Due to molecular collisions, the Lorentzian lines need to be modified with a Gaussian function, which resulted in a Voigt shape profile. The corrected line absorption values for both O2 and CO2 were subtracted from the measured extinction. Resulting absorption values when fitted with the square of density, yield the final CIA coefficient values, which are presented in Fig. 4.
 | ||
| Fig. 3 Line absorptions from the HITRAN database.34 The region of interested in this study is marked in the red box. Note the different scales for CO2versus O2 absorptivity. | ||
 | ||
| Fig. 4 Collision-induced absorption measured spectrum; black squares: CIA total (using 50–50% O2–CO2 mixture); red circles: O2–O2 CIA (considering 50% contribution). | ||
It is clear from Fig. 4 that the total collision-induced absorption coefficient values from a 1:1 O2–CO2 mixture is higher than the O2–O2 component (considering its 50% contribution), with a maximum value around 9380 cm−1. Since pure CO2 showed a very weak and noisy absorption profile, another approach was used to evaluate any CO2–CO2 contribution which could underlie the O2–CO2 collisional effect. Different O2–CO2 mixture ratios, as shown in Fig. 2, were used to re-calculate collision coefficients of the different possible interactions included in eqn (1). The wavelength of 9380.685 cm-1 (near the O2–O2 CIA peak) was studied, considering the fact that both O2–CO2 and CO2–CO2 (if contributing at all) components contribute the most at this photon energy. For the five different mixtures used in this study, eqn (1) was transformed into five different expressions and by solving these equations, the normalized values obtained for O2–O2, O2–CO2 and CO2–CO2 were (9.65 ± 0.18) × 10−7 cm−1 amg−2, (3.83 ± 0.21) × 10−7 cm−1 amg−2, (6.50 ± 0.95) × 10−9 cm−1 amg−2 respectively. CIA values for O2–O2 and O2–CO2 obtained from (1:1) O2:CO2 mixture around 9380 cm−1, plotted in Fig. 5, match quite well with the one obtained in this process performed with different mixtures of O2–CO2 at 9380.685 cm−1 and these lie within the error limit. Owing to its low value, we neglected pure CO2–CO2 collision effects for the rest of our calculation. We assume similar behaviour from CO2 for other wavelengths for this band as well. Fig. 5 shows both the normalized O2–O2 and O2–CO2 CIA spectrum. The integrated CIA cross section value obtained from an extrapolated Lorentzian fit with FWHM of (97 ± 2) cm−1 was (6.37 ± 1.09) × 10−5 cm−2 amg−2. The error in the integrated absorption strength originates from the choice of fitting method, and from statistical fluctuations of the measured data points and also from the extrapolation. The peak was observed at (9384 ± 2) cm−1. Uncertainties in temperature and pressure are smaller than statistical error.
 | ||
| Fig. 5 Collision-induced absorption spectrum, O2–CO2: black diamonds – measured data points; red line – Lorentzian fit with (necessary) extrapolation: O2–O2: green circles – measured data points; blue line – fit with extrapolation, wine triangle and Cyan solid filled circle shapes belong to O2–O2 and O2–CO2 CIA values respectively obtained from calculation based on different mixtures of O2–CO2. | ||
No sharp features were observed in the CIA spectrum. The O2–CO2 CIA spectrum is much narrower than the O2–O2 CIA spectrum, as is clearly visible in Fig. 5, and its integrated intensity is about 3.3 times lower. The efficiency, which is a measure of the probability for a transition to occur based purely on Frank–Condon (FC) factors, can be expressed with the following expression
 | (2) |
| O2–O2 | O2–CO2 | |
|---|---|---|
| η | η | |
| v a = 0 | 1 | 1 |
| v a = 1 | 0.76 ± 0.10 | 0.85 ± 0.50 |
The large error associated with ηva = 1 for O2–CO2 is due to uncertainty (46%) associated with the determination of the integrated CIA values. Our cross section for the X (v = 0) → a (v = 1) transition is a factor of almost three smaller than the only previous literature value for this process.22 A possible reason for this discrepancy could arise from the extrapolation method and the accuracy of our line-mixing model, which excludes all the line-absorptions arising due to H2O, O2 and CO2. Among these, the CO2 monomer makes the most significant contribution to the light absorption process at high pressure.
The relatively large O2–CO2 CIA cross section we find for the X (v = 0) → a (v = 1) compared to X (v = 0) → a (v = 0) is not consistent with a recent model of CIA by Karman et al.23 which predicts a very low cross section since CO2 (as well as N2 as discussed in ref. 23) is diamagnetic and cannot follow the favoured total spin exchange mechanism. This disagreement is not surprising considering that the isotropic potentials used in ref. 23 will be less applicable to CO2. Further analysis is necessary to better understand this effect.
The efficiency values for the optical transition are comparable between O2–CO2 & O2–O2 for the above-mentioned transition, considering the error bar. The efficiencies based on the FC factor for this transition is 0.013.17 A change in the internuclear distance in the excited a-state from 1.2156 Å to 1.1152 Å is necessary to modify the FC factors in a way that it agrees with the integrated intensity values, within the error bar, for O2–O2 collisions.30 Comparing the measured efficiency values we can suggest that CO2 deforms the excited a-state to some extent. Despite having a ground state configuration of 1Σ+g, a large electric quadrupole moment and polarizability anisotropy of CO2 could cause more penetration during a collision with the O2 molecule, producing a compression in the excited state bond length of O2.22 Being a larger molecule, CO2 could further increase spin–orbit coupling between the X3Σ−g and higher electronic d1Πg state compared to O2.27 We note that this is an oversimplification of the complex processes occur during collisions.
Chagas et al.17 have reported the effect of CIA on the 1060 nm band in the total absorption in our atmosphere. For a mid-latitude summer atmospheric profile with a solar zenith angle of 60%, a surface albedo of 0.1, and a total incoming solar irradiation of 1368 W m−2, they found that the CIA of O2–O2 at 1060 nm band contributed for 0.30 W m−2. This value was recalculated for our CIA contributions of O2–O2 and O2–CO2 collisions and we see that the CIA at 1060 nm band adds 0.22% to the short wavelength absorption in our atmosphere. About 0.000118% of this is caused by collisions between CO2 and O2 (Table 3).
| CIA contributors | O2–O2 | O2–CO2 | Total |
|---|---|---|---|
| CIA contribution (10−5 cm−2 amg−2) | 1.01 ± 0.04 | (5.30 ± 0.90) × 10−4 | ≈1.01 ± 0.04 |
| Sunlight absorption (W m−2) | 0.30 ± 0.03 | (1.58 ± 0.29) × 10−4 | ≈0.30 ± 0.03 |
| Short-wave absorption (%) | 0.22 ± 0.05 | (1.18 ± 0.14) × 10−4 | ≈0.22 ± 0.05 |
At sunrise or sunset when longest path lengths are present the absorption process should become most significant. Due to the very low absolute concentration of CO2 gas present in our atmosphere, the O2–CO2 CIA coefficients are very small and it is probably not possible to measure this induced absorption process in Earth's atmosphere.
5. Conclusion
By the use of cavity ring-down spectroscopy, we have characterized collision-induced absorption of two important atmospheric gas molecules, CO2 collisions with O2, for the O2 a1Δg ← X3Σ−g transition. The very small amount of CO2 present in the air makes this CIA process less significant, although the amount of CO2 is increasing at present. Collisional effects between O2–CO2 have not been studied in detail so far for this O2 transition. Assuming the profile to be Lorentzian, we were able to determine an integrated CIA cross section for O2–O2 and O2–CO2 collisions, which were (2.10 ± 0.31) × 10−4 cm−2 amg−2 and (6.37 ± 1.09) × 10−5 cm−2 amg−2, respectively. The greater polarizability of CO2 might induce a larger collisional effect compared to N2 although O2–O2 still remains the most dominant. A proper accounting for this small but significant CIA contribution remains a challenge for theory.Conflicts of interest
There are no conflicts to declare.Acknowledgements
The authors would like to thank Frans Spiering and Mark Koenis for providing computational programme, and EU H2020 ITN-EID project “PUFF” (grant no. 642820) for financial support.References
- M. F. Crawford, H. L. Welsh and J. L. Locke, Phys. Rev., 1949, 75, 1607 CrossRef CAS.
- K. L. Denman, G. Brasseur, A. Chidthaisong, P. Ciais, P. M. Cox, R. E. Dickinson, D. Hauglustaine, C. Heinze, E. Holland, D. Jacob, U. Lohmann, S. Ramachandran, P. L. da Silva Dias, S. C. Wofsy and X. Zhang, Couplings Between Changes in the Climate System and Biogeochemistry, in Climate Change, The Physical Science Basis, Contribution of Working Group I to the Fourth Assessment Report of the Intergovernmental Panel on Climate Change, ed. S. Solomon, D. Qin, M. Manning, Z. Chen, M. Marquis, K. B. Averyt, M. Tignor and H. L. Miller, Cambridge University Press, Cambridge, United Kingdom and New York, NY, USA, 2007 Search PubMed.
- J. G. Canadell, C. Le Quéré, M. R. Raupach, C. B. Field, E. T. Buitenhuis, P. Ciais, T. J. Conway, N. P. Gillett, R. A. Houghton and G. Marland, Proc. Natl. Acad. Sci. U. S. A., 2007, 104, 18866–18870 CrossRef CAS PubMed.
- CO2. Earth, Accessed March 2018, Last updated September 20, 2018, https://www.co2.earth/daily-co2.
- S. B. A. Eldering, B. Solish, D. Crisp, P. Kahn and M. Gunson, IEEE, 2012, 1–10 Search PubMed.
- D. Crisp, R. M. Atlas, F. M. Breon, L. R. Brown, J. P. Burrows, P. Ciais, B. J. Connor, S. C. Doney, I. Y. Fung, D. J. Jacob, C. E. Miller, D. O'Brien, S. Pawson, J. T. Randerson, P. Rayner, R. J. Salawitch, S. P. Sander, B. Sen, G. L. Stephens, P. P. Tans, G. C. Toon, P. O. Wennberg, S. C. Wofsy, Y. L. Yung, Z. Kuang, B. Chudasama, G. Sprague, B. Weiss, R. Pollock, D. Kenyon and S. Schroll, Adv. Space Res., 2004, 34, 700–709 CrossRef CAS.
- M. Buchwitz, R. de Beek, J. P. Burrows, H. Bovensmann, T. Warneke, J. Notholt, J. F. Meirink, A. P. H. Goede, P. Bergamaschi, S. Körner, M. Heimann and A. Schulz, Atmos. Chem. Phys., 2005, 5, 941–962 CrossRef CAS.
- J. Mao and S. R. Kawa, Appl. Opt., 2004, 43, 914–927 CrossRef CAS PubMed.
- Z. Kuang, J. Margolis, G. Toon, D. Crisp and Y. Yung, Geophys. Res. Lett., 2002, 29, 11–14 CrossRef.
- D. A. Long and J. T. Hodges, J. Geophys. Res.: Atmos., 2012, 117, D12309 CrossRef.
- J. M. Hartmann, C. Boulet and D. Robert, Collisional effects on molecular spectra: laboratory experiments and models, consequences for applications, Elsevier, 2008 Search PubMed.
- D. M. O’Brien, R. M. Mitchell, S. A. English and G. A. D. Costa, J. Atmos. Ocean. Technol., 1998, 15, 1272–1286 CrossRef.
- B. van Diedenhoven, O. P. Hasekamp and I. Aben, Atmos. Chem. Phys., 2005, 5, 2109–2120 CrossRef CAS.
- L. Frommhold, Collision-induced Absorption in Gasses, Cambridge University Press, 1st edn, 1993 Search PubMed.
- K. Kayama and J. C. Baird, J. Chem. Phys., 1967, 46, 2604–2618 CrossRef CAS.
- R. W. Nicholls, J. Res. Natl. Bur. Stand., Sect. A, 1965, 69A, 369–373 CrossRef CAS.
- J. C. S. Chagas, D. A. Newnham, K. M. Smith and K. P. Shine, Q. J. R. Meteorol. Soc., 2002, 128, 2377–2396 CrossRef.
- G. C. Tabisz, E. J. Allin and H. L. Welsh, Can. J. Phys., 1969, 47, 2859–2871 CrossRef CAS.
- H. Tran, C. Boulet and J.-M. Hartmann, J. Geophys. Res.: Atmos., 2006, 111 Search PubMed.
- C. Hermans, A. C. Vandaele, S. Fally, M. Carleer, R. Colin, B. Coquart, A. Jenouvrier and M.-F. Merienne, Absorption Cross-section of the Collision-Induced Bands of Oxygen from the UV to the NIR, Dordrecht, 2003 Search PubMed.
- G. T. Fraser and W. J. Lafferty, J. Geophys. Res.: Atmos., 2001, 106, 31749–31753 CrossRef CAS.
- M. Vangvichith, H. Tran and J. M. Hartmann, J. Quant. Spectrosc. Radiat. Transfer, 2009, 110, 2212–2216 CrossRef CAS.
- T. Karman, M. A. J. Koenis, A. Banerjee, D. H. Parker, I. E. Gordon, A. van der Avoird, W. J. van der Zande and G. C. Groenenboom, Nat. Chem., 2018, 10, 549–554 CrossRef CAS PubMed.
- G. W. Robinson, J. Chem. Phys., 1967, 46, 572–585 CrossRef CAS.
- H. S. Telescope, Hubble Finds Carbon Dioxide on an Extrasolar Planet, Accessed 27.09.2028, https://www.nasa.gov/mission_pages/hubble/news/CO2.html.
- M. M. Abbas, A. LeClair, E. Woodard, M. Young, M. Stanbro, F. M. Flasar, V. G. Kunde, R. K. Achterberg, G. Bjoraker, J. Brasunas, D. E. Jennings (and the Cassini/CIRS team), Astrophys. J., 2013, 776, 73 Search PubMed.
- T. Hidemori, N. Akai, A. Kawai and K. Shibuya, J. Phys. Chem. A, 2012, 116, 2032–2038 CrossRef CAS PubMed.
- A. O’Keefe and D. A. G. Deacon, Rev. Sci. Instrum., 1988, 59, 2544–2551 CrossRef.
- G. Berden and R. Engeln, Cavity Ring-Down Spectroscopy: Techniques and Applications, Wiley, 2009 Search PubMed.
- F. R. Spiering and W. J. van der Zande, Phys. Chem. Chem. Phys., 2012, 14, 9923–9928 RSC.
- L. Rayleigh, London, Edinburgh Dublin Philos. Mag. J. Sci., 1899, 47, 375–384 CrossRef.
- D. R. Bates, Planet. Space Sci., 1984, 32, 785–790 CrossRef.
- A. Bideau-Mehu, Y. Guern, R. Abjean and A. Johannin-Gilles, Opt. Commun., 1973, 9, 432–434 CrossRef CAS.
- I. E. Gordon, L. S. Rothman, C. Hill, R. V. Kochanov, Y. Tan, P. F. Bernath, M. Birk, V. Boudon, A. Campargue, K. V. Chance, B. J. Drouin, J. M. Flaud, R. R. Gamache, J. T. Hodges, D. Jacquemart, V. I. Perevalov, A. Perrin, K. P. Shine, M. A. H. Smith, J. Tennyson, G. C. Toon, H. Tran, V. G. Tyuterev, A. Barbe, A. G. Császár, V. M. Devi, T. Furtenbacher, J. J. Harrison, J. M. Hartmann, A. Jolly, T. J. Johnson, T. Karman, I. Kleiner, A. A. Kyuberis, J. Loos, O. M. Lyulin, S. T. Massie, S. N. Mikhailenko, N. Moazzen-Ahmadi, H. S. P. Müller, O. V. Naumenko, A. V. Nikitin, O. L. Polyansky, M. Rey, M. Rotger, S. W. Sharpe, K. Sung, E. Starikova, S. A. Tashkun, J. V. Auwera, G. Wagner, J. Wilzewski, P. Wcisło, S. Yu and E. J. Zak, J. Quant. Spectrosc. Radiat. Transfer, 2017, 203, 3–69 CrossRef CAS.
- U. Fano, Phys. Rev., 1963, 131, 259–268 CrossRef.
- M. V. Tonkov, N. N. Filippov, Y. M. Timofeyev and A. V. Polyakov, J. Quant. Spectrosc. Radiat. Transfer, 1996, 56, 783–795 CrossRef CAS.
- M. O. Bulanin, A. B. Dokuchaev, M. V. Tonkov and N. N. Filippov, J. Quant. Spectrosc. Radiat. Transfer, 1984, 31, 521–543 CrossRef CAS.
- N. N. Filippov and M. V. Tonkov, Spectrochim. Acta, Part A, 1996, 52, 901–918 CrossRef.
- I. M. Grigoriev, R. Le Doucen, A. Benidar, N. N. Filippov and M. V. Tonkov, J. Quant. Spectrosc. Radiat. Transfer, 1997, 58, 287–299 CrossRef CAS.
- Y. M. T. A. V. Polyakov, M. V. Tonkov and N. N. Filippov, Izvestiya Atmos. Ocean Phys., 1998, 34, 328–333 Search PubMed.
- F. R. Spiering, M. B. Kiseleva, N. N. Filippov, H. Naus, B. v. Lieshout, C. Weijenborg and W. J. v. d. Zande, J. Chem. Phys., 2010, 133, 114305 CrossRef PubMed.
| This journal is © the Owner Societies 2019 |