Magnetic-field-tuned phase transition of a molecular material from the isolated-spin to the coupled-spin regime†
Received
29th October 2018
, Accepted 22nd January 2019
First published on 7th February 2019
Abstract
We report the preparation, X-ray structure, chemical properties, and electron paramagnetic resonance (EPR) studies at Q and X-bands and temperature (mainly) T = 293 K of powder and oriented single crystal samples of the new compound [Cu(N′,N′-dimethyl-N′-benzoylthiourea)(2,2′-bipyridine)Cl], called CuBMB. The EPR spectra of single crystal samples at the Q-band display abrupt merging and narrowing of the peaks corresponding to two rotated copper sites as a function of magnetic field (B0) orientation. This behaviour indicates a quantum transition from an array of quasi-isolated spins to a quantum-entangled spin array associated with exchange narrowing processes and produced by weak intermolecular exchange interactions Ji between neighbour copper spins. This transition occurs when the magnitudes of the anisotropic contributions to the Zeeman couplings, tuned with the direction of B0, approach these |Ji| and produce level crossings. The exchange couplings between neighbour spins are estimated from the angular variation of the single crystal EPR results at the Q-band. We analyse the quantum behaviour and phase transitions of the spin system and discuss the magnitudes of the exchange couplings in terms of the structure of the chemical paths connecting Cu neighbours. The single crystal data at the Q-band indicates an uncommon ground electronic state of CuII which is discussed and compared with the results of DFT calculations. The spectrum of polycrystalline (powder) samples at the Q-band is a sum of contributions of microcrystals in each phase, and the fraction F of the entangled phase depends on the microwave frequency. The X-band spectrum is compatible with the Q-band results, but does not display a transition, and the spin system is in the quantum-entangled phase for all field orientations. This behaviour is further studied with a simple geometric model giving basic predictions. The crystal structure of CuBMB is monoclinic, space group P21/n, with a = 11.9790(3) Å, b = 14.0236(5) Å, c = 12.1193(3) Å, β = 104.952(2)° and Z = 4, and the copper ions are equatorially bonded to the benzoylthiourea and bipyridine ligands in a heavily distorted square pyramidal structure.
1 Introduction
Molecular materials are part of a multidisciplinary research field involving physicists, chemists, biochemists and technologists aiming to prepare, to characterize, and to use materials obtained by assembling together simpler inorganic and/or organic compounds. They are useful for basic and for technical applications (electrical, magnetic, optical, etc.),1,2 and also for biological purposes (e.g., pharmacological applications3,4). The study of new compounds in connection with their applications promoted progress in coordination chemistry, and understanding the relationships between the molecular structure and the properties provides important tools to aid the design of new compounds to be applied for specific purposes. The number and complex nature of the interactions between molecules challenge devising quantitative relationships between structure and behaviour. Collecting data for convenient compounds, it may be possible to understand the roles of particular structural features in the properties of the molecule. In this way, new qualitative and quantitative correlations between a parameter and its particular effects may be found.
Within the domain of molecular materials with specific magnetic properties, single-molecule magnets5,6 provide a 1![[thin space (1/6-em)]](https://www.rsc.org/images/entities/char_2009.gif) :1 ratio between quasi-static switchable magnetic moments and molecules in the sample. An important property is the bridges between metal ions or molecules that mediate magnetic interactions between the magnetic centres they interlink.7 By molecular-programmed synthetic routes, different ligands are used as spacers acting as the bridges that build nuclearity-controlled metal assemblies. The great variety of obtained materials instigated a lot of research effort in an attempt to model thermodynamic, biological, and quantum mechanical problems.
:1 ratio between quasi-static switchable magnetic moments and molecules in the sample. An important property is the bridges between metal ions or molecules that mediate magnetic interactions between the magnetic centres they interlink.7 By molecular-programmed synthetic routes, different ligands are used as spacers acting as the bridges that build nuclearity-controlled metal assemblies. The great variety of obtained materials instigated a lot of research effort in an attempt to model thermodynamic, biological, and quantum mechanical problems.
Following investigations that started more than a century ago,8 we prepared new Cu-acylthiourea compounds relevant for their pharmacological properties.9,10 We measured their crystal structures and collected electron paramagnetic resonance (EPR) spectra in powder and oriented single crystal samples. Here we report results for the compound [Cu(N′,N′-dimethyl-N′-benzoylthiourea)(2,2′-bipyridine)Cl] (to be called CuBMB), which proved to be very appropriate for studying quantum and magnetic behaviour of materials with weak intermolecular exchange interactions (Ji) between metal ions. CuBMB is paramagnetic, with long non-covalent chemical paths supporting very weak interactions between neighbour copper spins. Thermodynamic variables such as susceptibility, magnetization, and specific heat depend on the energies of the levels which are related to the Ji and contribute information only in the rarely achieved range of extremely low T ≤ |Ji|/kB. The temperature of our experiments also precludes the possibility of thermodynamic phase transitions. On the other hand, weak interactions generate traveling spin excitations related to the spin dynamics that strongly modify the EPR spectra.
Gorter and Van Vleck11 introduced the concept of exchange narrowing to explain EPR results in metal compounds. Their idea was developed by Anderson12,13 and Kubo14 into the classic theory of exchange narrowing15,16 explaining the changes of the line widths and the merging of the EPR spectra of a spin system produced by the exchange couplings. Yokota and Koide17 applied these ideas to compounds containing magnetically non-equivalent metal sites with anisotropic g-matrices. In those early times, detailed EPR results were scarce because of instrumental limitations, and restrained detection of fine aspects of the process. More recently, data collected from single crystals allowed evaluating selectively weak magnitudes of Ji which may be correlated to the electronic structure of the paths connecting metal ions.18–27 In a few cases where thermodynamic data at very low T also existed, good agreement was obtained between the values of Ji obtained by both methods.28,29
The merging phenomenon in EPR was treated by Hoffmann et al.18–20 from the point of view of classical Bloch equations.30 They collected data on small exchange coupling between metal ions at distances up to 25 Å and proposed an empirical formula20 that allows estimation of the small exchange coupling between metal spins at long distances, complementing earlier results of Coffman and Buettner,31 and providing new ideas and useful bibliographic support.
The EPR results reported here reveal novel properties of the exchange narrowing processes that manifest as a quantum phase transition between phases characterized by split and by fully merged EPR spectra of rotated copper ions in the lattice. This condition is related to the quantum entanglement of the spins, which in our experiments is tuned with the magnitude and orientation of the applied magnetic field B0 = μ0H (μ0 is the permeability of a vacuum). The collective state of the spin system changes between that for an array of uncoupled Cu ions, to that for a quantum-entangled spin array using the anisotropy of the g-matrix of the copper ions and varying the orientation of B0. Following the spectral changes we cross a magnetic phase transition relevant to problems such as avoided level crossings,32–37 Bose-Einstein condensation,38 interacting metal-dimeric arrays,39–43 and quantum dynamical phase transitions,44,45 where small interactions between magnetic molecules play relevant roles,46 and EPR experiments provide useful information. CuBMB has unprecedented advantages to study experimentally these effects and update the understanding of the exchange narrowing and spectral collapse phenomena of EPR lines. Our results provide a new approach to interpret the problem and, in addition, we estimate isotropic spin–spin interactions |Ji| ∼ 0.03–0.1 cm−1 between coppers in CuBMB and discuss their relation with the structure of the chemical paths connecting them. Regarding the individual behaviour of CuBMB molecules, our EPR studies of single crystal samples at the Q-band show that, as a consequence of the structural distortion of the copper site, the electronic wave function displays unusual characteristics that are further investigated with DFT calculations. In a future paper we will treat the pharmacological properties of CuBMB and of several other similar Cu derivatives of acylthiourea, which are mostly related to intramolecular (instead of intermolecular) interactions.
2 Materials and methods
2.1 Material preparation
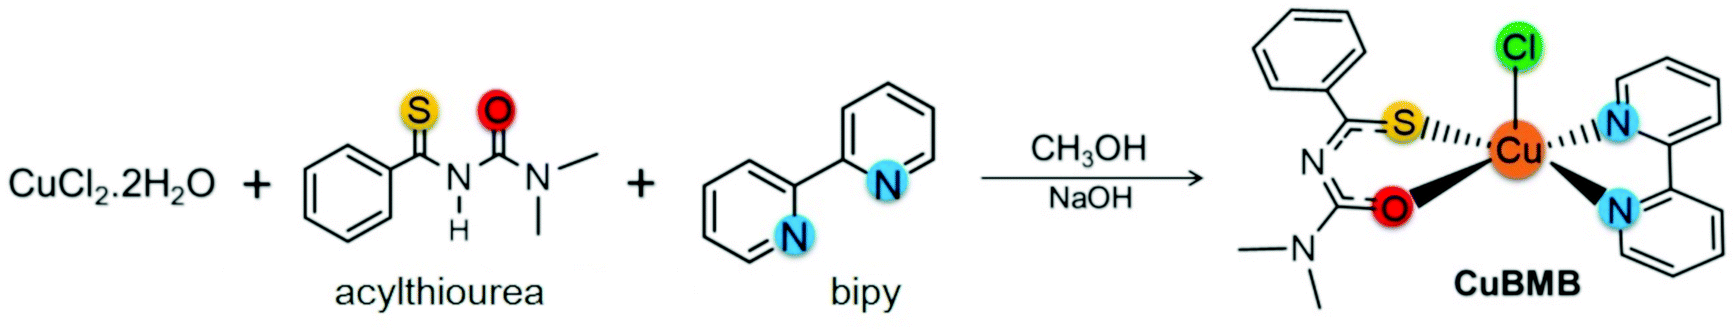
The solvents used in the reactions were purified by standard methods. IR spectra were recorded on a FT-IR Bomem-Michelson 102 spectrometer in the range 4000–250 cm−1 at 293 K, using KBr pellets. Elemental analyses were carried out by the micro analytical laboratory at the Chemistry Department of the Federal University of São Carlos using an EA 1108 CHNS microanalyser (Fisons Instruments). Conductivity analyses were performed using a Micronal model B-330 connected to a Pt electrode with a cell constant equal to 0.089 cm−1, using 1.0 mM solutions of the complex in acetone. The molar conductance measurements were carried out in dichloromethane and the result 2.25 S cm2 mol−1 is consistent with a neutral type of compounds. The acylthiourea ligand (L = N′,N′-dimethyl-N′-benzoylthiourea) was synthesized following a previous report.47 The complex [Cu(bipy)(L)Cl], (bipy = 2,2′-bipyridine) was prepared in good yield (77%) at room T (see Scheme 1). The ligand L (0.13 g, 0.64 mmol) and NaOH (0.03 g, 0.64 mmol) dissolved in 5 mL of methanol were added to a methanolic solution (15 mL) of CuCl2·2H2O (0.10 g, 0.59 mmol) and stirred for 0.5 h. Afterwards, the bipyridine ligand (0.10 g, 0.64 mmol), previously dissolved in methanol (5 mL), was added and the resulting solution was stirred for 5 h. The product was filtered off, washed with diethyl ether (10 mL) and dried under a vacuum. Emerald-green color crystals were obtained by slow evaporation of dichloromethane/methanol solution. The complex is air-stable, exhibiting satisfactory elemental analysis data.‡
 |
| | Scheme 1 Synthesis of the complex CuBMB from the ligands L = N′,N′-dimethyl-N′-benzoylthiourea and 2,2′-bipyridine. | |
2.2 X-ray diffractometer and software
Single crystal X-ray diffraction measurements were performed on an Enraf-Nonius Kappa-CCD and Apex II Duo diffractometer with graphite monochromated MoKα radiation (λ = 0.71073 Å). Data collection was carried out using the Collect software48 and the structure was obtained by the direct method using SHELXS-97.49 The Gaussian absorption correction was applied,50 and tables and structure representations were generated by WinGX51 and Mercury,52 respectively.
2.3 EPR methods
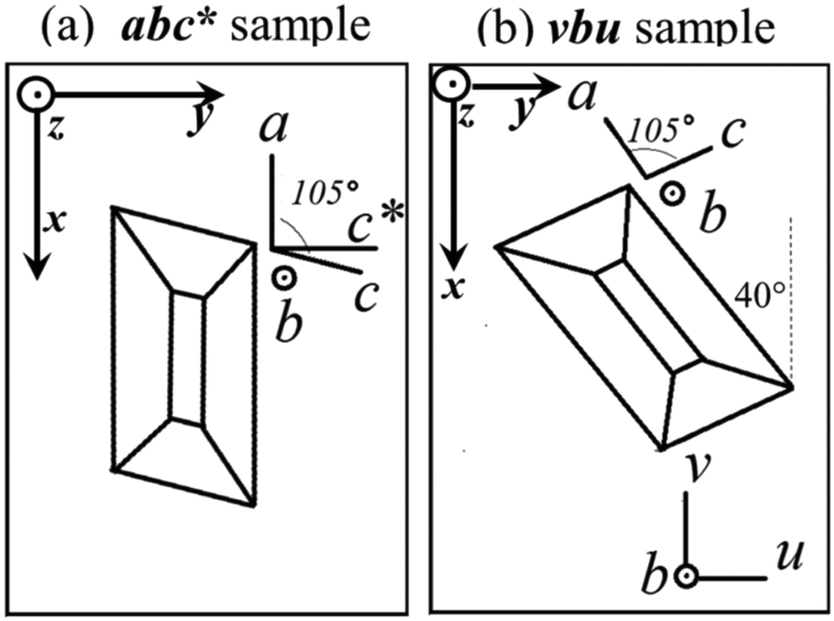
We used a Varian EPR spectrometer working at ∼35.2 GHz (Q-band) and at ∼9.52 GHz (X-band). A single crystal of ∼2 × 1.5 × 1 mm3 was mounted with the ac plane glued with vacuum grease on top of a cubic sample holder made of cleaved KCl, as displayed in Fig. 1 (sample montage abc*). After collecting the EPR data for this sample, the crystal was rotated 40° as shown in Fig. 1b (sample montage vbu), so the ac* plane in sample abc*, and the uv plane in sample vbu, differ by a shift of 40° in the angular coordinate. In each case, the sample-holder was glued with different faces in the horizontal plane on top of a pedestal inside the microwave cavity in order to collect spectra with B0 in the planes parallel to the faces of the holder, rotating the magnet (Q-band), or the holder with a goniometer (X-band). Most measurements were performed at T = 293 K, with ∼0.1 mT amplitude of 100 kHz field modulation, and 10 mW microwave power, precluding spectral saturation. We calibrated B0/ν measuring the position of the signal of a paramagnetic CrIII:MgO spin marker next to the sample (g = 1.9797). Powder spectra are labeled by the microwave frequency. Single crystals also require for each spectrum three Euler angles of a laboratory frame XYZ, in which B0 is along the Z axis, the microwave field B1 (normal to the rotation plane of B0) is along the X axis, and Y = Z × X, expressed in the xyz ≡ abc* or xyz ≡ vbu “sample” orthogonal frames (see Fig. 1a and b). These angles are needed to analyze the data because the orientation X of B1 determines the line intensities of single crystals. The central field B0 and the full width at half height (FWHM) Ω of the resonances were obtained from least squares fits of Lorentzian derivative line shapes to the observed single crystal spectra. We evaluated the g-values of the peaks of each spectrum from the distances in magnetic field to a field marker, whose g-value is well known. These distances, obtained from fits of spectra having a very high signal-to-noise ratio, are in general accurate within 0.1 mT, and better in the axes displaying minimum widths. Thus, due to the anisotropy of the spectra, the field orientation (or sample orientation) is the main source of the g-uncertainties in the values proposed in the single crystal measurements. We used EasySpin (v. 5.15),53 a package of programs working under Matlab,54 which together allow simulating and fitting a given Hamiltonian to spectral line shapes dχ′′/dB0vs.B0 from powder and single crystal samples.
 |
| | Fig. 1 Orientations of the single crystal sample in the holder: (a) Sample abc* (c* = a × b); (b) sample vbu. Sample abc* allows collecting spectra with B0 in the ba, bc* and ac* planes. Sample vbu allows collecting spectra in the bu, bv and uv planes. The planes uv and ac* are the same, except for a shift of 40° in the angular coordinate. The laboratory axes x, y, and z are used as a reference for the data for each sample. | |
2.4 DFT calculations
For the DFT calculations we used the software Orca version 4.0.1,55 with the B3LYP hybrid functional, 6-31G basis set, and spin unrestricted SCF (UKS). Hybrid functionals have been proved to provide good performance for d9 complexes.56 The calculated exchange interaction Jc was obtained via the DFT-“broken symmetry” (DFT-BS) approach following the methodology discussed by Levchenkov et al. for intermolecular exchange via N–H⋯O bonds in copper complexes.57 The coupling constant was obtained with a spin-Hamiltonian analysis based on 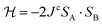 and Jc = −(EHS − EBS)/[Smax(Smax + 1)].58 The input files are included with the ESI.†
3 Experimental results
3.1 Crystal structure
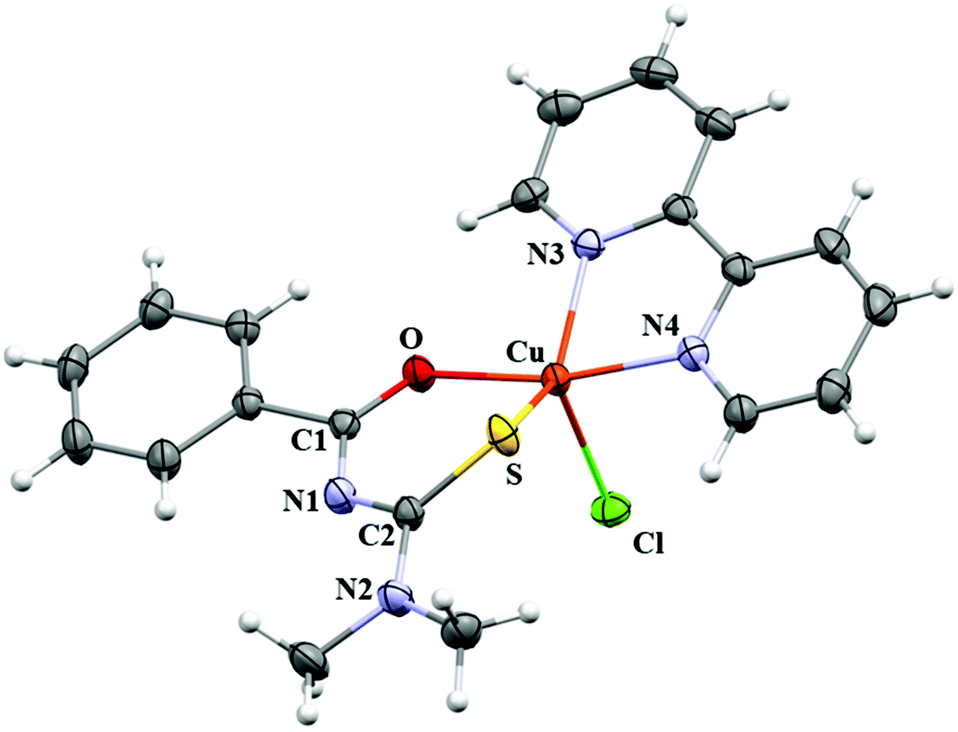
Crystallographic data and selected bond distances and angles for CuBMB are listed in Tables 1 and 2. The compound crystallizes in the monoclinic space group P21/n with a = 11.9790(3) Å, b = 14.0236(5) Å, c = 12.1193(3) Å and β = 104.952(2)°, with Z = 4. The copper ions are in five-coordinated sites (Fig. 2) and, according to the value 0.49 calculated for the parameter τ = (β − α)/60 (β and α are the two largest basal angles of a five coordinate metal, with τ = 0 for ideal square pyramidal coordination and τ = 1 for ideal trigonal pyramidal59), in a heavily distorted square pyramidal structure, with the chlorine atom in an axial position, and the chelated ligands bipyridine and acylthiourea (Scheme 1) in equatorial positions of the coordination sphere (Fig. 2). From this structural point of view, acylthiourea acts as an anionic ligand with bidentate equatorial coordination (S,O) and bipyridine through the equatorial nitrogens N3 and N4 to the CuII ion. This view will be somewhat changed later by our results on the electronic structure. Upon metal coordination, the average bond lengths of thiocarbonyl and carbonyl moieties are longer than those for the free acylthiourea ligands.60,61 However, the C–N distances (N1–C1/N1′–C1′; N1–C8/N1′–C8′) are shorter. The changes of the bond lengths of the thiocarbonyl fragment (SCNCO) favour π-delocalization over the six-membered chelate ring,62,63 and the observed Cu–N and Cu–Cl bond lengths agree with reported values.64 Intermolecular interactions supporting the crystalline structure are maintained by weak hydrogen bonds C–H⋯O (2.68 Å), C–H⋯Cl (2.95–3.11 Å), and C–H⋯N (3.69 Å), and by π–π-stacking between the bipy and benzoyl rings with C–C distances ranging between 3.29 Å and 3.61 Å (centroid-to-centroid average distances ∼3.56 Å). A more detailed analysis of intermolecular interactions is presented later in the context of the magnetic properties of the compound.
Table 1 Crystal data and structure refinement parameters for CuBMB
| Empirical formula |
[CuC20H19N4OSCl] |
| Formula weight |
462.44 |
| Crystal system |
Monoclinic |
| Space group |
P21/n |
| Unit cell dimensions |
|
|
a (Å) |
11.9790(3) |
|
b (Å) |
14.0236(5) |
|
c (Å) |
12.1193(3) |
|
α (°) |
90 |
|
β (°) |
104.952(2) |
|
γ (°) |
90 |
| Volume (Å3) |
1966.97(10) |
|
Z
|
4 |
| Density calculated (Mg m−3) |
1.562 |
|
μ (mm−1) |
1.371 |
|
F(000) |
948 |
| Crystal size (mm3) |
0.325 0.310 0.260 |
|
θ-range (°) |
2.579 to 25.999 |
| Index ranges |
−12 ≤ h ≤ 14, −15 ≤ k ≤ 17, −14 ≤ l ≤ 14 |
| Reflections collected |
16840 |
| Independent reflections |
3856 [R(int) = 0.0931] |
| Completeness to θ (%) |
99.9 |
| Refinement method |
Full-matrix least-squares on F2 |
| Data/restraints/parameters |
3856/0/256 |
| Goodness-of-fit on F2 |
1.104 |
| Final R indices [I > 2sigma(I)] |
R
1 = 0.0656, wR2 = 0.1888 |
|
R indices (all data) |
R
1 = 0.0791, wR2 = 0.1973 |
| Δρmax and Δρmin (e Å−3) |
1.023 and −0.657 |
Table 2 Selected interatomic distances [Å] and bond angles [°] for CuBMB
| Bond lengths [Å] |
| Cu–S1 |
2.3088(15) |
| Cu–O1 |
1.948(4) |
| Cu–N3 |
2.081(5) |
| Cu–N4 |
2.013(4) |
| Cu–Cl |
2.4215(16) |
| O1–C1 |
1.264(6) |
| S1–C8 |
1.727(6) |
| N1–C1 |
1.323(7) |
| N1–C8 |
1.337(7) |
| N2–C8 |
1.339(7) |
|
|
| Bond angles [°] |
| O1–Cu–S1 |
90.59(12) |
| N3–Cu–N4 |
79.38(18) |
| O1–Cu–S1 |
90.59(12) |
| Cl–Cu–O1 |
96.83(13) |
| Cl–Cu–S1 |
114.18(6) |
| Cl–Cu–N3 |
107.34(13) |
| Cl–Cu–N4 |
93.75(14) |
| N3–Cu–N4 |
79.38(18) |
 |
| | Fig. 2 Molecule of [Cu(N′,N′-dimethyl-N′-benzoylthiourea)(2,2′-bipyridine)Cl], [CuC20H19N4OSCl], called CuBMB. | |
3.2 Infrared bands
The characteristic IR bands (KBr, in cm−1) of the free ligand N′,N′-dimethyl-N′-benzoylthiourea are: νN–H = 3200, νC![[double bond, length as m-dash]](https://www.rsc.org/images/entities/char_e001.gif) O = 1690, νCS = 1286, and νC–S = 875. The N–H band is absent in the IR of the complex, demonstrating the anionic nature of acylthiourea upon coordination to Cu. The other bands shift to negative wavenumbers, νCO = 1595, νCS = 1244 and νC–S = 784, when compared with free ligands, indicating the π-electron delocalization induced by deprotonation of the nitrogen atom of the amide group, expected for the bidentate coordination (S, O) of acylthiourea to a metal.65,66 Weak vibrations at νCu–O = 630, νCu–N = 500, νCu–S = 412 and νCu–Cl = 271 cm−1 in the spectrum describing stretching frequencies are observed.67
O = 1690, νCS = 1286, and νC–S = 875. The N–H band is absent in the IR of the complex, demonstrating the anionic nature of acylthiourea upon coordination to Cu. The other bands shift to negative wavenumbers, νCO = 1595, νCS = 1244 and νC–S = 784, when compared with free ligands, indicating the π-electron delocalization induced by deprotonation of the nitrogen atom of the amide group, expected for the bidentate coordination (S, O) of acylthiourea to a metal.65,66 Weak vibrations at νCu–O = 630, νCu–N = 500, νCu–S = 412 and νCu–Cl = 271 cm−1 in the spectrum describing stretching frequencies are observed.67
3.3 EPR spectra
EPR spectra of single crystal and polycrystalline (powder) samples were collected at the Q- and the X-band and actual values of the microwave frequency were used to calculate the g-factors of each spectrum. In order to improve the quality of our experimental results we found it useful to collect Q-band data in two different sets of orientations of the single crystal sample as described in the experimental section. Although it was tempting to discard the powder data after collecting such an exhaustive single crystal set of data, we found that they contain highly clarifying findings, and we included these results. No hyperfine structure of the spectra is observed for any orientation of the sample in the magnetic field.
3.3.1 Single-crystal samples.
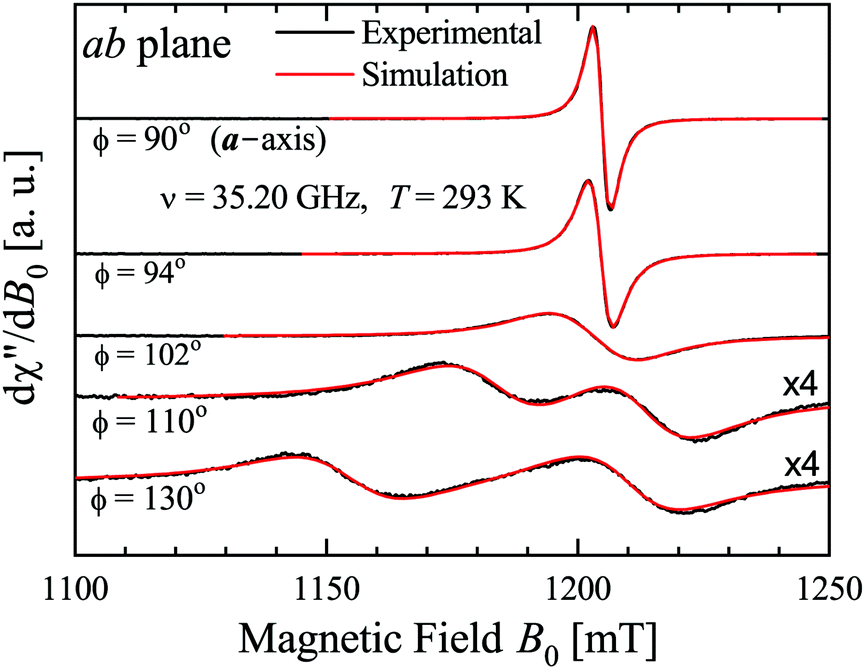
The spectra were collected at intervals of 5° (or smaller in some angular ranges) over 180° of each of the three main planes of samples abc* and vbu at the Q-band, and abc* at the X-band. At the Q-band two EPR peaks are observed for a general orientation of B0 (see the example in Fig. 3, collected at 293 K) and they merge to one peak for B0 along the b-axis or perpendicular to it (ac* and uv planes), where the coppers are magnetically equivalent. Besides, the two peaks also merge abruptly within angular ranges around these symmetry orientations. The collected spectra were fit by Lorentzian derivative line shapes dχ′′/dB0 in order to calculate the line positions and peak-to-peak widths Ω of the two (or one) peaks, as a function of field orientation.
 |
| | Fig. 3 EPR spectra with B0 in the ba plane. Two peaks merge and narrow when approaching the a-axis. Experimental result (black lines), and fit (red lines) with two Lorentzian derivative line shapes are indistinguishable. | |
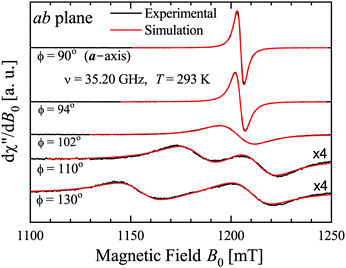
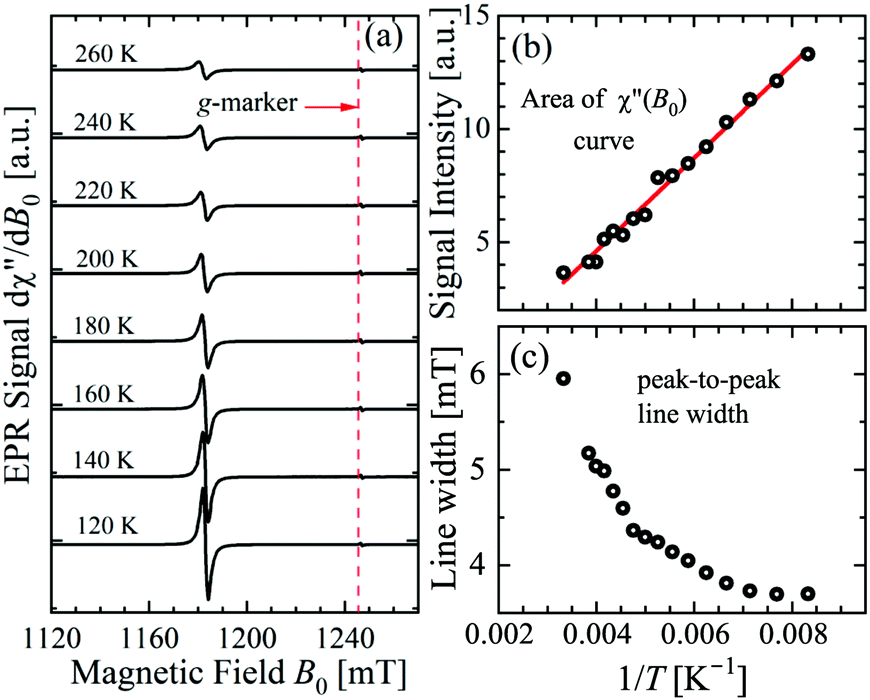
Most of the data reported in this work were collected at 293 K with the idea that the important information for our purpose is independent of T. This hypothesis was verified by collecting some single crystal data in the range 120 K < T < 300 K. Fig. 4a–c display spectra obtained for B0 along the a-axis, the temperature dependences of the area of the integrated signal (χ′′(B0)), and the peak-to-peak width of the signal. The 1/T dependence of the area clearly points to a paramagnetic behaviour. The broadening with increasing T of the width of the peak may be attributed to the expected shortening of the relaxation time of the copper ions. We also measured as a function of T the spectra observed in the neighborhood of the a-axis, as in Fig. 3. The broadening at these angles is the same as at the a-axis, but due to the larger width of the signal, its fractional contribution to the total width is negligible.
 |
| | Fig. 4 Temperature dependence of the (a) EPR spectra, (b) integrated area, and (c) peak-to-peak line width measured with the magnetic field along the a axis direction in the ba plane of the single crystal. | |
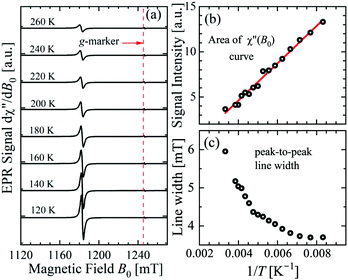
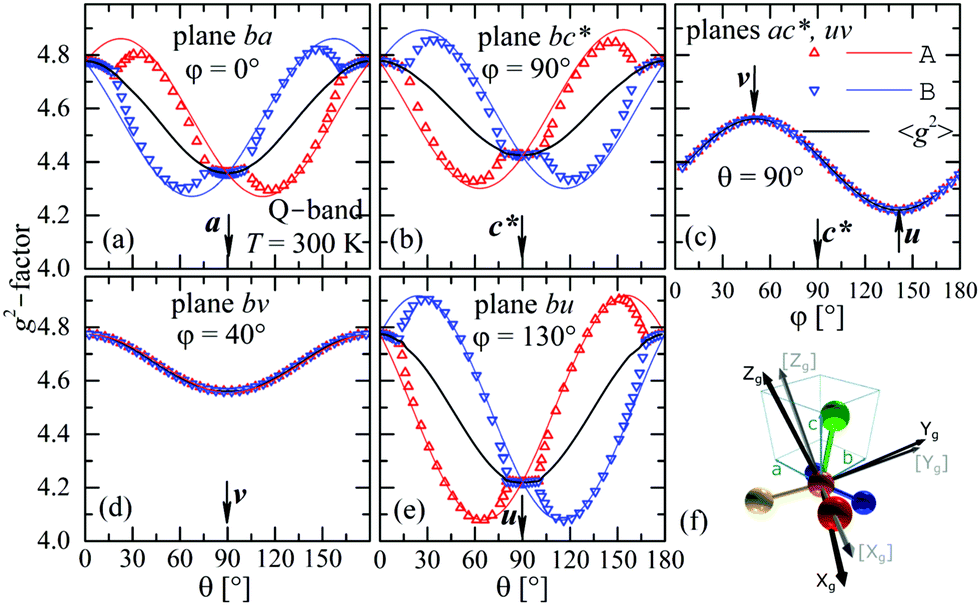
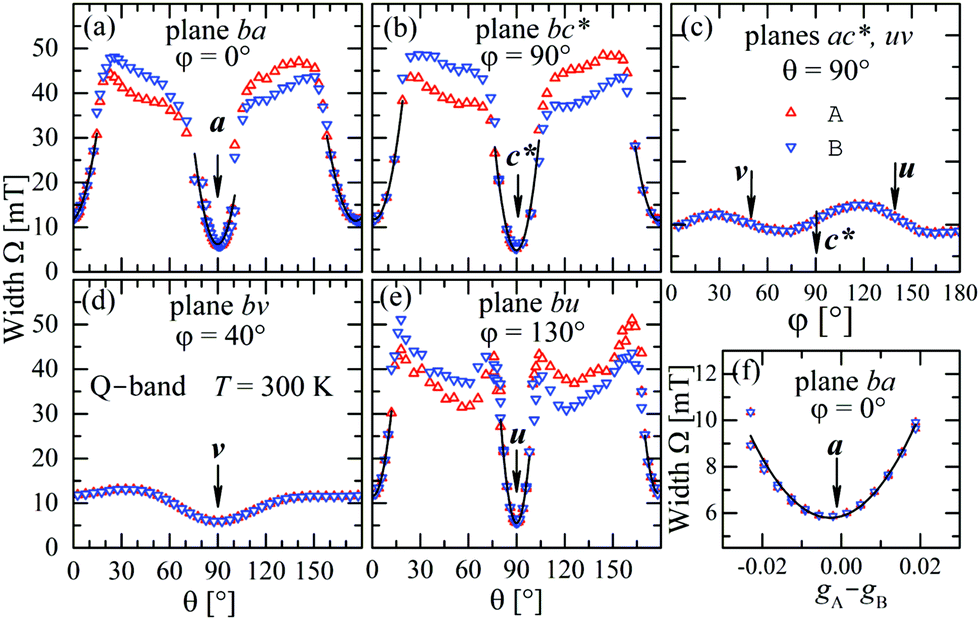
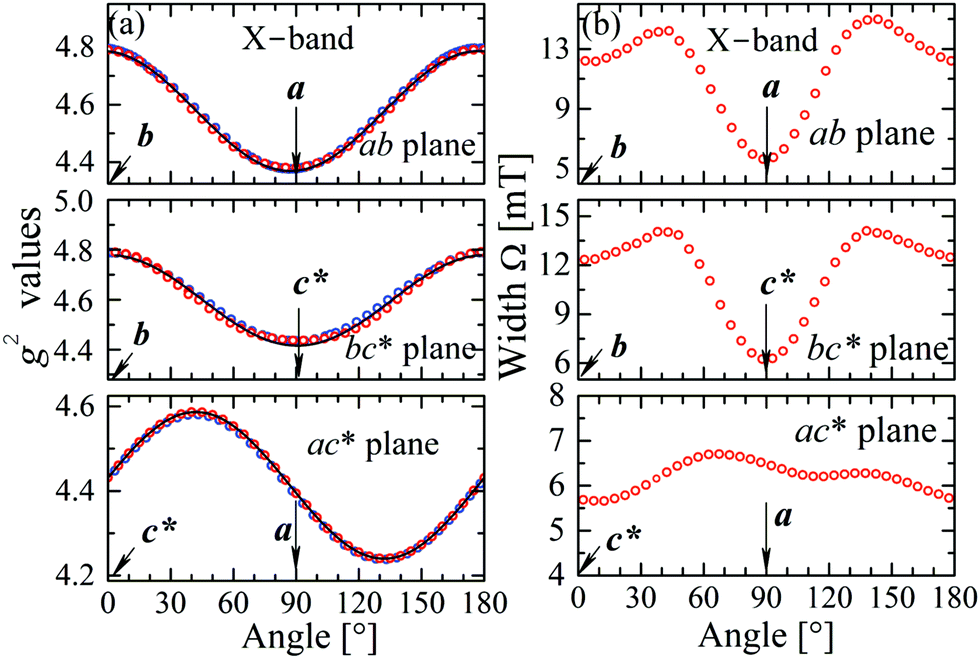
The experimental values for the g2-factor and the line width Ω of the peaks at the Q-band are given by symbols in Fig. 5 and 6, where the results in all studied planes are included. They depict a merging of the resonances and a simultaneous important narrowing around the crossing points (a factor of 8 between specific field orientations), respectively. According to our discussion in the experimental section, any effect of the temperature is negligible when compared with the effect of angular variation in the line width (Fig. 6). The spectra of a single crystal obtained at the X-band from sample abc* show only one peak for all orientations of B0. The g2-factor and width Ω obtained as for the Q-band spectra, but with one peak, are displayed in Fig. 7a and b.
 |
| | Fig. 5 Angular variation of the g2-factor in the crystal planes ba (a), bc* (b) and ac* (c) (sample abc*), and bv (d) and bu (e) (sample vbu), see Fig. 1 and text. Plane uv is included with ac*. Symbols are experimental results and solid lines are obtained from global fits of eqn (3) to the data for gA2 and gB2 and g2-matrices whose matrix elements are given in Table 3. Symbols and lines with red and blue color correspond to A and B copper sites. The black lines correspond to the average g2-matrix (eqn (3)) and the calculated elements of g2, gA2, and gB2-matrices are given in Table 3. In (f) the principal directions (Xg, Yg, Zg) of the g-matrix are shown together with the copper ligands in CuBMB with the Zg axis approximately in the plane between the Cu–Cl and Cu–S bonds. | |
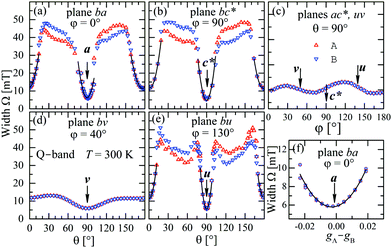 |
| | Fig. 6 Angular variation of the line width Ω for B0 in the crystal planes ba, bc* and ac* of sample abc* and uv, bv and bu of sample vbu, at the Q-band. Data in the ac* and bu planes are drawn together. Red and blue colors distinguish sites A and B. The solid lines are obtained with a fit of eqn (6) to the data, which is amplified in (f) for the case of the field along the a direction in the ba plane. | |
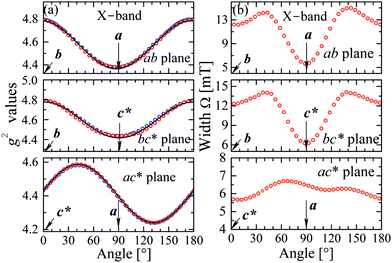 |
| | Fig. 7 Angular variation of (a) the g2 factor and (b) the line width Γ for B0 in the crystal planes ba, bc* and ac* of sample abc*, at the X-band. The solid lines are obtained from a fit of a g2-matrix (eqn (3)) to these data and the matrix elements of g2 are given in Table 3. | |
3.3.2 Powder samples.
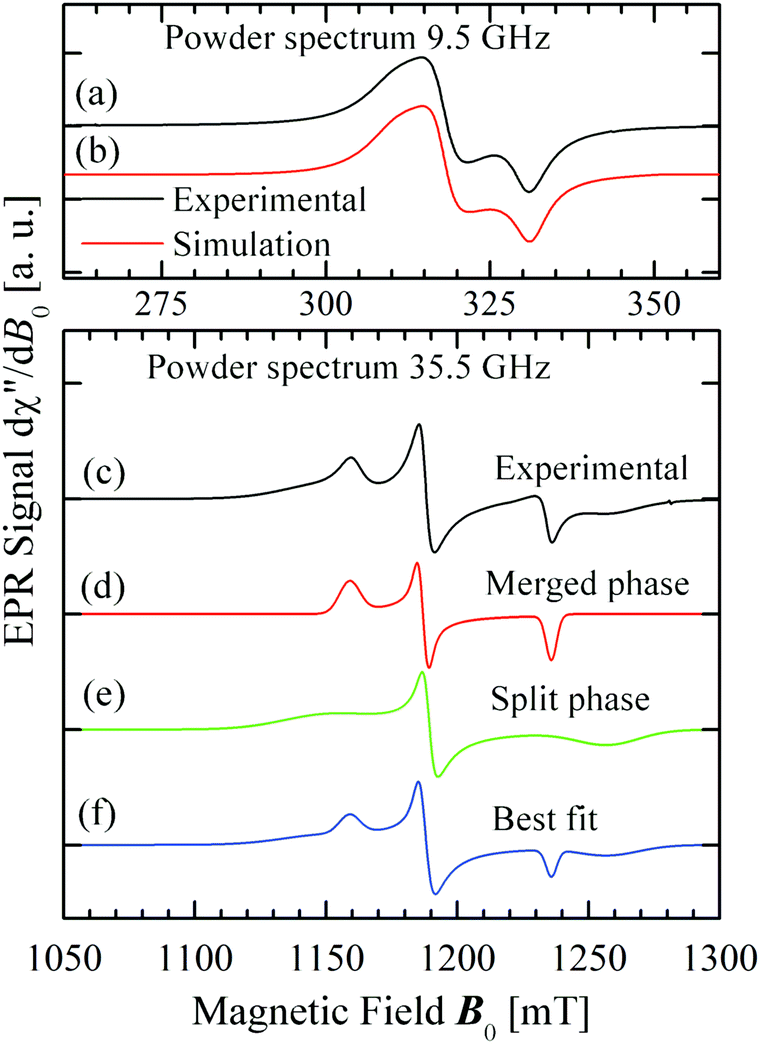
Fig. 8 displays the spectra observed from powder samples at X- (a), and Q-bands (c). Fig. 8d–f display simulations performed as described below.
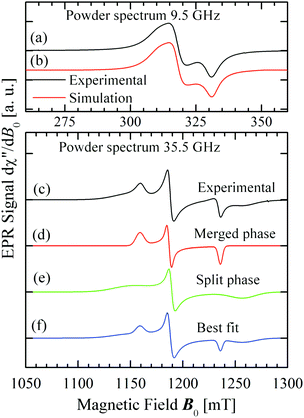 |
| | Fig. 8 (a) Observed spectrum of a powder sample at the X-band. (b) Best fit to the powder spectrum at the X-band (parameters in Table 3). (c) Observed spectrum of a powder sample at the Q-band. (d) and (e) Display simulations of the spectrum corresponding to each of the two phases. (f) Is the linear combination of the weighed components of (d) and (e) that best fit the experimental result. | |
4 Exchange-coupled spins in a crystal lattice
4.1 Superexchange interactions
Anderson68,69 explained formally the “superexchange” interaction between pairs of spins connected by a non-magnetic path introduced by Kramers.70 His theory was enriched by Goodenough71 and Kanamori,72 who reported useful rules to calculate the magnitudes of these couplings. Years later, Hay et al.73 and Kahn74 added new theoretical concepts which are frequently used nowadays. Satisfactory agreement is obtained with these procedures between experimental and calculated exchange parameters in structures where the chemical paths supporting the superexchange are simple covalent bonds.74 Great difficulties appear, however, in cases where the paths are very long, non-covalent or a combination of various segments which may interfere or contribute differently to the actual magnitude of the coupling. These weak couplings connecting metal ions or strongly coupled polymetallic molecules introduce spin dynamics and important quantum effects in molecular magnets6,75 and for quantum information processing76,77 that can be studied empirically in structurally characterized materials, and EPR is very appropriate for this purpose.
4.2 Chemical paths for superexchange in CuBMB
The space group P21/c of CuBMB contains four symmetry related molecules M1 to M4 ≡ C20H19ClCuN4OS (shown in Fig. 2) per unit cell, with atoms at (x, y, z), (1/2 − x, 1/2 + y, 1/2 − z), (−x, −y, −z) and (1/2 − x, 1/2 + y, 1/2 − z). M2 is obtained from M1 by a 180° rotation around b; M3 from M1 by an inversion, and M4 from M1 by a 180° rotation plus an inversion. There are many long paths for superexchange interactions between copper ions but, considering the short range of the coupling, it is appropriate to consider only the shortest ones connecting nearest neighbours. Fig. 9 (central) displays a projection of the central molecular core CuSON3N4Cl of M1 plus those corresponding to the six nearest molecules with copper–copper distances shorter than 10 Å, which may be grouped by pairs of molecules Mi containing coppers Cui, as the shortest paths between copper neighbours. Each Cu1 atom is equally connected to two Cu2 atoms at 8.575 Å along equatorial–equatorial uniform zig-zag chains –Cu1–Cu2–Cu1–Cu2– running in the b-direction with uniform coupling J2, connected by chemical paths having six diamagnetic atoms  (Fig. 9(I–a)) with total length 12.97 Å along paths including H-bonds C–H⋯N (underlined) between a methyl carbon of the L ligand to one copper, and a N of the bipy ligand of the following copper. There are two closest Cu3 neighbours to a Cu1 related by inversion centres at 6.321 Å (Cu3a) and 6.636 Å (Cu3b) in Fig. 9(I–c). They give rise to chains –Cu1–Cu3–Cu1–Cu3– along the a-direction, connected with alternate paths
  , with total length 9.88 Å, and
  , with total length 9.67 Å, both containing four similar diamagnetic atoms and including hydrogen bonds C–H⋯Cl connecting apical Cl atoms of one Cu with bipy carbons of the other. Alternate couplings J3a and J3b are different because P1–3,a includes an important stacking of bipy rings of Cu1 and Cu3 at ∼3.5 Å, and none appears in P1–3,b. A third pair of connections of Cu1 (see Fig. 9(I–b)) is with two Cu4 at 8.810 Å (Cu1 and Cu4 are related by a 180° rotation plus an inversion), giving rise to zig-zag chains. These equatorial–equatorial paths
  involve 6 diamagnetic atoms including a bipy ring and a C–H⋯O bond, with total length 11.68 Å along the bond (Fig. 9(I–b)). Copper neighbours of the same type (as Cu1–Cu1) at distances equal to or longer than a = 11.979 Å are ignored, as are also ignored the interactions with second Cu neighbours of all types that generate distributions of the couplings around the central values. The couplings J2 and J4 occur with two symmetrical neighbours (z2 = z4 = 2). Obviously, each of the four symmetry related coppers in the lattice has the same neighbourhood described for Cu1. In summary, the paths connecting copper ions in CuBMB are long and complex including both H-bonds and π-stacking.
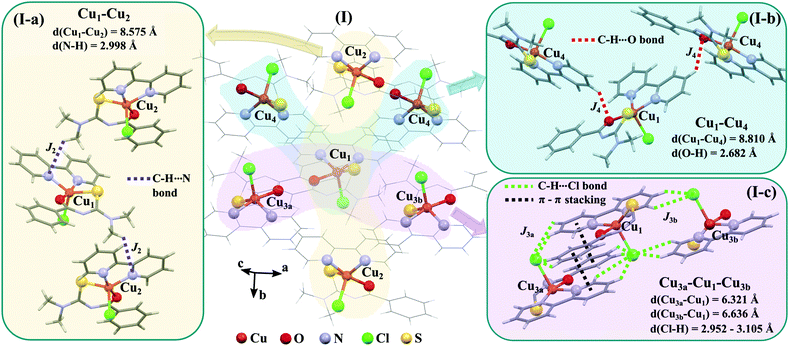 |
| | Fig. 9 (I) Three-dimensional array of a central molecule of CuBMB and the six neighbour molecules with Cu–Cu distances shorter than 10 Å. For clarity, the central molecular cores CuOSN3N4Cl are described with balls and sticks, and the remaining bonds as sticks. The subscripts of the Cu ions indicate the asymmetric units described in the text. (I-a) Chemical paths connecting Cu1 and Cu2, supporting exchange couplings J2 (z2 = 2). (I-b) Chemical paths connecting Cu1 and Cu4 supporting J4 (z4 = 2). (I-c) Chemical paths connecting Cu1 with Cu3a (z3a = 1) and Cu3b (z3b = 1), supporting J3a and J3b, respectively. | |
4.3 Lattice symmetry and spin Hamiltonian description
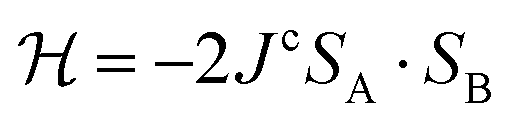
Each Cu type in CuBMB gives rise to a spin-sublattice and to an EPR spectrum which depends on the properties of the site. Since coppers differing by an inversion operation are magnetically equal, we consider only two different sublattices, A, containing Cu1 and Cu3, and B, containing Cu2 and Cu4, whose spectra differ by a C2 rotation around b. The main contributions to the spin Hamiltonian  are the Zeeman interaction with the field B0, and the isotropic intrasublattice and intersublattice exchange interactions Jαβij (|Ji| ≪ hν) between Cu neighbours in the same or in different sublattices, written as:
| |  | (1) |
where gα is the g-matrix of Cu ions in the sublattice α and Siα is the spin of the Cuα in the unit cell i. The sums of exchange terms are over the six closest neighbours.  also includes anisotropic spin–spin terms
  (mainly dipole–dipole interactions which are not detailed in eqn (1)) and hyperfine couplings
  with the copper nuclei (not observed). At each field orientation η = B0/|B0| = (sinθcosϕ,sinθsinϕ,cosθ), where θ and ϕ are the equatorial and azimuthal angles in the laboratory coordinate system xyz of Fig. 1, the sublattices A and B give rise to EPR peaks at gα = (η·gα·gα·η)1/2,30 and the spectrum of a single crystal is the sum of the spectra of the sublattices modified by the exchange coupling. To analyse these modifications, we write the Zeeman contributions to eqn (1) for α = A and B as:
| |  | (2) |
where g = 1/2(gA + gB) and G = 1/2(gA − gB). For magnetically equal neighbour pairs as occurs for Cu1–Cu3 (see Fig. 9c), G = 0 and the second Zeeman contribution to eqn (2) cancels. Since intrasublattice exchange interactions with magnitudes J3a and J3b commute with the total spin of the sublattice, they do with the Zeeman interaction, and do not change the positions of the resonances. However, these terms do not commute with the anisotropic spin–spin interaction  , and modify the widths of the peaks. Intersublattice exchange interactions such as J2 and J4 arising from the contacts shown in Fig. 9(I–a) and (I–b) modulate and average out terms proportional to G ≠ 0, producing additional changes to the widths and modifying the positions of the peaks.17 So, different sources of narrowing and shifting the resonances provide complementary information. Both coupling pairs J3a and J3b, and J2 and J4 produce equal effects and cannot be distinguished experimentally. The two EPR peaks merge to one peak when the intersublattice exchange coupling becomes equal to the anisotropic Zeeman contribution to eqn (2) proportional to G = 1/2(gA − gB). So, when the intersublattice exchange coupling is negligible compared with the anisotropic Zeeman contribution proportional to G for a particular orientation of B0, the full Zeeman interaction of eqn (1) applies, and we observe as a function of angle two resonances with g-factors gA and gB, allowing us to calculate from these data the matrices gA2 and gB2. Instead, if the exchange coupling between sublattices A and B is larger than the Zeeman splitting this is averaged out and we observe a single resonance with an angle dependent g-factor g = 1/2(gA + gB) that allows us to evaluate the components of the matrix g2 = 1/2(gA2 + gB2). There are field orientations where the resonances are merged, and others where they are split, and a transition between these situations is produced by varying the orientation of B0, as shown in Fig. 5. In addition, strong changes of the line width Ω are observed in the merged ranges (Fig. 6).
5 Calculated results
5.1 Evaluation of the g2-matrices of the CuII ions
From the full set of data in each of the two regimes we calculate the components of the matrices g2, or gA2 and gB2 by global least-squares fits of the function:78| | | g2(θ,ϕ) = η·g·g·η = (g2)xxsin2θcos2ϕ + (g2)yysin2θsin2ϕ + (g2)zzcos2θ + 2(g2)xysin2θsinϕcosϕ + 2(g2)xzsinθcosθcosϕ + 2(g2)yzsinθcosθsinϕ | (3) |
to data in each regime. It has to be noted that the exchange couplings average out the g-values of the two peaks but the experimental results are the values of g2, a condition that has to be considered in the calculations.79,80 The matrix elements of gA2 and gB2 were obtained by fitting data at the Q-band in angular regions of Fig. 5 where the peaks are well split or the collapse is due to symmetry conditions.26 As the spectra collected in fully-split angular ranges are few, we obtained the components of gA2 and gB2 as those producing lines tangent to the experimental results in Fig. 5. Besides, the data in the bv plane (see Fig. 5), where the peaks A and B are fully collapsed, not as a consequence of a symmetry condition as in the ac plane, but because two contributions cancel out, were particularly useful to gain accuracy in these fits, and provided an important contribution of the data for sample ubv of Fig. 1. The fit of the data in Fig. 5 in angular regions where the peaks are fully collapsed allows obtaining the matrix elements of g2 = 1/2(gA2 + gB2), according to the justification given before. Equal results for the matrix elements of g2 were obtained by averaging the experimental values of gA2 and gB2 at the Q-band and fitting them with eqn (3). Another set of components of the g2-matrix was obtained by fitting eqn (3) to the results in Fig. 7 at the X-band, where the resonances are merged for all field orientations. The components of g2, gA2 and gB2 are given in Table 3 and the calculated values are shown with solid lines in Fig. 5 and 7a. The good agreement between the values obtained from the different sources of data confirms the hypotheses made. The FWHM line widths Ω observed in the six studied crystal planes at the Q-band and the three planes at the X-band (Fig. 6 and 7b) are the other piece of experimental information. There is a nearly isotropic residual width of ∼5.8 mT (weakly dependent on temperature) similar at both bands, and strong angular variations in the ba, bc* and bv planes, with widths that narrow by a factor of up to ∼8 at the Q-band with minima (residual width) in the axes a, b, c* and u in the planes ba, bc* and bu, analysed below. The relations of the eigenvalues and eigenvectors of g2, gA2 and gB2 with the structure and the electronic wave functions of the copper ions in CuBMB are modelled below.
Table 3 Components of the g2-matrices obtained from EPR data for single crystal and powder samples at Q and X-bands shown in Fig. 5–8
| Matrix elements |
|
(g2)xx |
(g2)yy |
(g2)zz |
(g2)xy |
(g2)xz |
(g2)yz |
| Single crystal Q-band (global fit of split-phase) |
g
A
2
|
4.357(1) |
4.421(1) |
4.774(1) |
0.175(1) |
0.210(1) |
−0.240(1) |
|
g
B
2
|
4.357(1) |
4.421(1) |
4.774(1) |
0.175(1) |
−0.210(1) |
0.240(1) |
| Single crystal Q-band (global fit of merged-phase) |
g
A, gB eigenvalues |
2.017 |
2.103 |
2.218 |
|
|
|
|
g
2
|
4.357(1) |
4.421(1) |
4.774(1) |
0.175(1) |
0 |
0 |
|
g
eigenvalues |
2.052 |
2.137 |
2.185 |
|
|
|
| Single crystal X-band |
g
2
|
4.358(1) |
4.424(1) |
4.775(1) |
0.168(1) |
0 |
0 |
|
g
eigenvalues |
2.052 |
2.137 |
2.185 |
|
|
|
| Matrix elements |
|
g
1
|
g
2
|
g
3
|
| Powder, X-band |
Merged-phase |
2.052 |
2.136 |
2.189 |
| Powder, Q-bandi |
Merged-phase |
2.052 |
2.136 |
2.189 |
| Powder, Q-bandii |
Split-phase |
2.020 |
2.135 |
2.218 |
| DFT prediction |
Single molecule |
2.022 |
2.152 |
2.194 |
5.2 Evaluation of the exchange parameters
5.2.1 Single-crystal data.
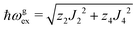
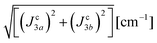
We evaluate here the exchange interactions Ji from the data in Fig. 5 and 6 using basic results of Anderson's theory.12,13 We do that by plotting in Fig. 10a–f the ratio R = δB/|δB0| between the observed and calculated (from the values of G) field distances δB and δB0 between the two split peaks, as a function of the modulus of the calculated distances for B0 in the neighbourhood of the a and b axes in the ba plane, the b and c* axes in the bc* plane and the b and u axis in the bu plane. R = 0 corresponds to fully merged peaks, and R = 1 to fully split peaks. The observed curves display transition points between two and one peaks where the merging becomes complete. The results in Fig. 10 are explained21,26 in terms of the exchange frequency ωgex, associated with spin correlation functions related to the merging process, and thus with the exchange couplings Ji connecting rotated spins as,12,26| | 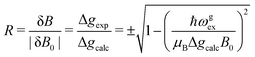 | (4) |
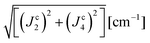
in agreement with the result in Fig. 10, and allowing us to obtain ħωgex from the merging condition as:| |  | (5) |
where  ,
,  and the calculated values of ħωgex along the directions η where the full mergings are reached in Fig. 5 are given in Table 4.
 |
| | Fig. 10 Ratio R = δB/|δB0| in which δB are the observed field distances and |δB0| are the field distances calculated without merging as a function of |δB0| measured with the field B0 around the axes in the ba, bc and bu planes. Solid lines are obtained from the fit of eqn (5) to the data. | |
Table 4 Exchange frequencies ωex obtained from EPR data at the Q-band considering the collapse observed in Fig. 10a–f (ωgex), and widths of the resonances in Fig. 11a–f (ωΩex), using eqn (5) and (6). Combinations of exchange parameters Ji calculated using eqn (9). The experimental uncertainties are ∼10%
| Field orientation → |
b
-axis ba plane |
a
-axis ba plane |
b
-axis bc* plane |
c
*-axis bc* plane |
b
-axis bu plane |
u
-axis bu plane |
|
ω
gex [cm−1] |
0.030 |
0.024 |
0.031 |
0.029 |
0.031 |
0.028 |
|
ω
Ω
ex [cm−1] |
0.12 |
0.095 |
0.11 |
0.083 |
0.14 |
0.099 |
|
0.12 |
0.092 |
0.11 |
0.078 |
0.13 |
0.095 |
|
0.021 |
0.017 |
0.022 |
0.021 |
0.022 |
0.020 |
In Fig. 11a–f we plot the FWHM width Ω as a function of the calculated distance |δB0| to the central position, for each central direction. Following Anderson,12,13 Passeggi and Calvo21 proposed that in the merged phase, the FWHM is given by the relation:
| | 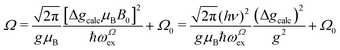 | (6) |
where
ωΩex is associated with spin correlation functions related to the narrowing process and
Ω0 considers contributions to
Ω arising from other mechanisms that are nearly isotropic, as shown in the
ac and
uv planes of
Fig. 6c and d.
Eqn (6) predicts a width proportional to the square of the microwave frequency
ν and the factor

considers that we measure FWHM widths of Lorentzian derivative signals.
21 The data were fitted to the quadratic dependence on Δ
gcalc (solid lines in
Fig. 6a, b and e, enlarged in
Fig. 6f and
Fig. 11a–f), and the calculated values of
ωΩex are collected in
Table 4.
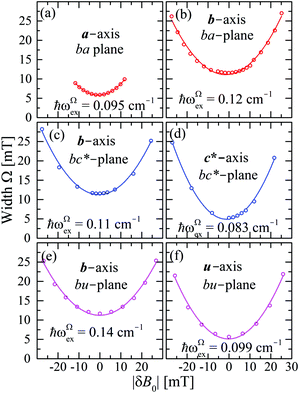 |
| | Fig. 11 FWHM width Ω as a function of |δB0|, measured with the field B0 around the axes in the ba, bc and bu planes. Lines are obtained from fits of eqn (8) to the data. | |
The relations between ωgex and ωΩex, and the intra- and intersublattice exchange parameters are:
| |  | (7) |
| | 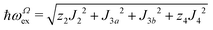 | (8) |
where
z2 =
z4 = 2 are the numbers of Cu
2 and Cu
4 neighbours of a Cu
1.
Eqn (7) and (8) allow estimating the magnitudes of the exchange couplings included in
Table 4 from the measured exchange frequencies,
| | | J22 + J42 = 1/2(ħωgex)2 and J3a2 + J3b2 = (ħωΩex)2 − (ħωgex)2 | (9) |
where no information about the signs of the exchange couplings
Ji is obtained.
5.2.2 Powder data.
The spectrum dχ′′/dB0 of a powder sample at the X-band (Fig. 8a) was simulated using EasySpin53 with the g-factors calculated from the single crystal study given in Fig. 8a and Table 3. We assumed that the widths of the peaks vary with angle as an ellipsoid with the same principal axes as the g-matrix, and optimised their principal values with a fit to the powder spectrum keeping fixed the g-factors obtained in the single crystal measurements. Clearly, the small differences between experimental (Fig. 7) and simulated X-band powder spectra (Fig. 8b) arise from the assumption about the angular dependence of the widths of the peaks. The spectrum at the Q-band (Fig. 8c) displays a novel result which to our knowledge has not been reported before. At this microwave frequency, the spectrum of a powder sample of spins 12 with a non-axially symmetric g-matrix is expected to display three resolved peaks at the three eigenvalues of the g-matrix, g1 < g2 < g3.30 Instead, we observe (Fig. 8c) the sum of two spectra like this, with different intensities, values of g1 and g3 and widths. This is equivalent to having a sample containing two different spin species, as represented with the cartoon in Fig. 12, where green microcrystals and spectra are in the split-peak phase (having a larger field span and widths) and blue crystals and spectra are in the merged-peak phase (entangled-spins with smaller line widths, see inset (a) of Fig. 12). We proved that hypothesis by integrating the experimental result dχ′′/dB0 to calculate the absorption powder spectrum χ′′(B0), and simulating it as the sum of absorption spectra of the merged and split phases with coefficients F and (1 − F),| | | χ′′(sim.) = C[Fχ′′(merged-phase) + (1 − F)χ′′(split-phase)] | (10) |
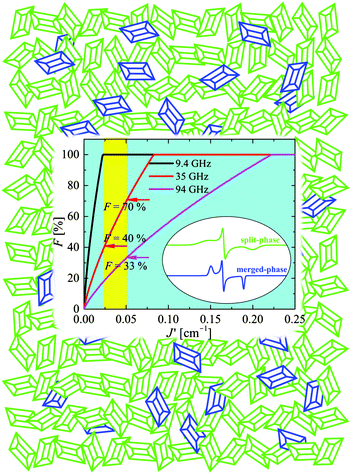 |
| | Fig. 12 Cartoon explaining the EPR spectrum of the powder (polycrystalline) sample of CuBMB at the Q-band with contributions arising from crystallites in two phases. Green microcrystals and spectra are in the split-signal phase; blue microcrystals and spectra are in the collapsed-signal phase. The sum of the integrated spectra (eqn (10)) fits the observed powder spectrum with F ≈ 0.28 with a relatively large uncertainty due to background correction issues. | |
We used the spin Hamiltonian parameters obtained from the powder spectrum at the X-band to simulate the merged phase spectrum, and parameters of the single crystal spectrum at the Q-band for the split phase (in this case the widths were obtained by optimizing the simulation of the spectrum in Fig. 8c). The factor C in eqn (10) depends on the total mass of the powder sample, but the factor F is the portion of the sample in the entangled phase, which depends on the couplings |Ji| and on the microwave frequency, and is a consequence of the transition displayed in Fig. 10 and 11. The calculated spectra in the two phases are displayed in Fig. 8d and e and F was obtained from a least squares fit of eqn (10) to the data. This fit indicates that at the Q-band F = 28% of the micro crystals are in the “merged-signal” phase, and 72% in the “split-signal” phase, and the spectrum simulated is shown in Fig. 8f. Instead, at the X-band, ∼100% of the micro crystals are in the merged-signal phase (F ≈ 100%), and at higher microwave frequencies (e.g., ν ∼ 94 GHz), the powder sample is expected to contain most micro crystals in the split-signal phase. This behaviour is displayed in the inset of Fig. 12, where we plot F as a function of the average intersublattice exchange interactions at three microwave frequencies. We obtained these curves with a geometric model assuming that the microcrystals in the powder in which the distance between the resonance peaks is smaller than the average exchange coupling, |gA(θ,ϕ) − gB(θ,ϕ)|μBB0 ≤ |Ji|, are in the merged (“blue”) phase. We summed over a sphere the number of microcrystals in the merged phase for the case of CuBMB using the values of gA(θ,ϕ) and gB(θ,ϕ) calculated from the matrices in Table 3 over a large set (10000) of equally spaced orientations (θ,ϕ) obtained with the program Repulsion.81 Our result supports the added convenience of powder spectra to estimate exchange couplings in weakly coupled compounds. One should note that the experimental uncertainty is large because of baseline problems.
5.3 DFT calculations
The molecular reference system based on the electronic configuration is given by the axes (Xg, Yg, Zg) corresponding to the principal directions of the g-matrix. The angles between the principal directions of the g-matrix and the Cu–ligand directions calculated both from EPR and DFT are in reasonable agreement and shown in Table 6. The directions (Xg, Yg, Zg) obtained experimentally (black) and ([Xg], [Yg], [Zg]) (gray) obtained numerically are depicted in Fig. 5f, where Xg ([Xg]) is pointing close to the direction of the Cu–O bond, Yg ([Yg]) is close to the Cu–S bond, and Zg ([Zg]) lies between the directions of the Cu–Cl and Cu–S bonds. The experimental and calculated principal values of the g-matrix are in good agreement as shown in Table 4. The Zg direction is canted from the Cu–Cl bond direction and limits the description of the electronic structure based on square planar symmetry for the so called equatorial direction of the crystal structure. The calculated exchange parameters are shown in Table 5 and are in good agreement with the experimental values. The spin density plot is shown in Fig. 13 and supports the depicted exchange pathways with non-zero spin-densities on the ligands. The output file is included with the ESI.†
Table 5 Exchange frequencies obtained via DFT-BS modeling for individual pairs of molecules according to the exchange pathways depicted in Fig. 9. Combinations of exchange parameters for comparison with the experimental values in Table 4
|
J
c3a [cm−1] |
−0.06 |
|
J
c3b [cm−1] |
0.10 |
|
J
c2 [cm−1] |
−0.02 |
|
J
c4 [cm−1] |
−0.03 |
|
0.12 |
|
0.04 |
Table 6 Calculated angles (°) between the copper–ligand directions and the molecular orientations (Xg, Yg, Zg) as determined by the direction of the g-matrix from experiments and from numerical DFT calculations (indicated in square brackets). The directions are depicted in Fig. 5f
|
|
X
g
|
Y
g
|
Z
g
|
| Cu–Cl |
76 [87] |
55 [60] |
39 [30] |
| Cu–S |
85 [91] |
166 [174] |
77 [84] |
| Cu–O |
8 [6] |
83 [89] |
86 [84] |
| Cu–N1 |
88 [84] |
55 [48] |
145 [137] |
| Cu–N2 |
162 [173] |
98 [91] |
106 [97] |
 |
| | Fig. 13 (a) Spin density plot as calculated by DFT, viewed (a) perpendicular and (b) parallel to the plane of the rings. The electronic distribution is concentrated around the Cu ion, the bipy and the Cl ligands. | |
6 Discussion
6.1 Electronic structure of isolated molecules
Detailed EPR experiments in six crystal planes allowed us to evaluate the g2-matrix for CuII sites in CuBMB which is related to the electronic wavefunctions. The calculated eigenvectors (Xg, Yg, Zg) show a molecular frame oriented in an uncommon orientation for a square pyramidal structure, indicating a highly distorted electronic structure which recalls the situation of the so-called blue proteins, in which a back donation effect is caused by the sulfur ligand,82,83 a situation rarely reported for small copper organic complexes like CuBMB. Further evidence of this uncommon result is offered by our DFT calculations that show relevant electron density around the Cl ligand. This result contrasts with that expected for an apical ligand in a more standard CuII ion with a dx2−y2 ground orbital state and the Cl atom in an apical position.
6.2 Intermolecular superexchange couplings
We observe a dispersion of ∼20% for ωg,Ωex along rows of Table 4. This comes from simplifications of our approximate model for the |Ji|, that do not take into account the distribution of spin–spin interactions of each individual superexchange path (Fig. 9) but their averaged effect in the EPR spectra. Despite the dispersion, our proposed model for calculating |Ji| is corroborated by the DFT results in Table 5 that were obtained considering the individual superexchange paths.
The values of the averages  given in Table 4 are the outcomes of the paths P1–2 and P1–4 described in Section 4.2. They contain 6 diamagnetic atoms and include H-bonds C–H⋯N and C–H⋯O,84,85 respectively. The other important difference is the replacement of a sulfur in the path P1–2 by a nitrogen in P1–4. Since the C–H⋯O bond is shorter than the C–H⋯N bond, J4 may have a more significant contribution than J2. We do not have experimental evidence to assess the specific roles of these differences in the supported exchange couplings J2 and J4, but the DFT results from Table 5 confirm that they are similar with Jc4 slightly greater than Jc2.
The larger values of the averages  compared to
  are supported by the chemical paths P1–3a and P1–3b that contain only 4 diamagnetic atoms with a contribution of eight (for J3a) and four (for J3b) similar hydrogen bonds C–H⋯Cl as observed in Fig. 9(I-c). We noted before that an important difference between these paths is the contribution of π–π-stacking of bipyridine-benzoyl rings to J3a.86 In fact, from the exchange frequencies modeled by DFT-BS, the P1–3a path has an overall antiferromagnetic behaviour while P1–3b is ferromagnetic with |Jc3b| > |Jc3a|. It suggests that the stacking contribution is antiferromagnetic, since the C–H⋯Cl bridges are similar in both paths. The work of Venegas et al. assigned to a similar coupling of bipyridine molecules in lamellar [Cu(bipy)(en)Cu(bipy)(H2O)VO34]n a coupling more than one order of magnitude smaller than in CuBMB.87 Thus, we conclude that our results indicate that the largest exchange couplings in CuBMB are between Cu1 and Cu3 ions, related by inversion operations at distances of ∼6.5 Å. The DFT calculation confirms these experimental results with Jc3a,b > Jc2,4. Although the relevant point of this work is to learn about the roles of the interactions in the behaviour of the compound, a more detailed quantitative analysis of the superexchange interactions from the structural data remains to be done.
6.3 Collective spin-behaviour
Quantum entanglement occurs when pairs or groups of particles interact in such ways that the quantum state of each spin cannot be described independently of the state of the others, but it has to be described for the whole system. Under circumstances described before, this occurs for the Cu spins in CuBMB as a consequence of the small superexchange couplings, which are evaluated and discussed. EPR measurements allow us to characterize this quantum state of the material, and differentiate it from the uncoupled state, in a case where the small magnitudes of the interactions would make it hard to observe effects in the thermodynamic properties. The phenomenon occurs as a consequence of an avoided crossing32,33 of the levels of interacting neighbour coppers, produced by these couplings for a range of orientations of B0. It is related to exchange narrowing processes12–14 and shows up as a sudden transition produced by the short range of the exchange couplings. In polycrystalline samples where all orientations of B0 in the crystal axes occur, the two phases coexist in a range of couplings, as in first order phase transitions, and in a single crystal they can be tuned with the orientation of B0. The influence of intermolecular interactions on the magnetic observables has been studied in recent years in connection with interactions that may be unwanted in quantum computing.46,76,88 Our approach to the problem uses discoveries made in the beginning of EPR, which are now observed with much greater detail. Our EPR results for single crystal samples at the Q-band are also detected in powder samples where we observe simultaneously the two quantum phases of the spins in the material. The presence of two quantum phases for a system of anisotropic 12 spins can be compared with our previous results for systems of dinuclear copper compounds,41–43 where an entangled-spin phase was detected as an unexpected “U-peak” in the powder EPR spectra.
7 Conclusions
This work reports the preparation, characterization and structure determination of the new copper compound Cu(N′,N′-dimethyl-N′-benzoylthiourea)(2,2′-bipyridine)Cl, called CuBMB, and its study with EPR at two microwave frequencies. Its monoclinic crystal structure has two magnetically different (rotated) copper sites with the spin–spin exchange interactions much smaller than the average Zeeman couplings, but comparable with the Zeeman anisotropy of the spin sites. The structural and EPR results allow us to model the electronic properties with a DFT procedure, and characterize the ground state of the CuII ions. The EPR results at room T display a magnetic phase transition between two collective quantum states of the paramagnetic spin system with specific properties and different EPR spectra that can be tuned with the orientation of the magnetic field B0 and is characterized by the EPR spectra of a single crystal sample. In one state (“split state”) the spins are independent, giving two different EPR peaks; in the other (“merged state”) the spins are entangled by the exchange and display a single collective EPR response with line widths showing the exchange narrowing behaviour described by Anderson13 and Kubo.14 This occurs because the energy levels of each randomly exchange-coupled pair of spins cross at an appropriate applied magnetic field, giving rise to a quantum transition tuned by the field orientation. In powder samples with randomly oriented single crystals one observes a mixture of microcrystals in each phase, with proportions depending on the relative magnitudes of the exchange couplings, and anisotropic Zeeman interactions. Our results display a new view of the classical exchange narrowing problem and are deeply related to present-day advances in problems such as the collective consequences of avoided level crossings produced by exchange couplings,34,35,37 Bose–Einstein condensation,38 and quantum dynamical phase transitions,44,45 where small interactions between magnetic molecules play relevant roles.46,76,88 The energy levels of individual pairs of spins which depend on the Zeeman and exchange contributions have avoided crossings that, as in the other mentioned cases, produce the observed transitions. The widths of these transitions in angular coordinates displayed in Fig. 5 and 6 depend on the distribution of magnitudes of the exchange interactions within the lattice. The transition is T independent and could in principle be studied in many appropriate paramagnetic crystalline spin arrays. EPR allows studying the characteristics of these phases and following the dynamical properties of the transition. They are also related to transitions of interacting metal-dimeric arrays,39,41–43 displaying changes in the EPR spectra which in this case are strongly dependent on T as a consequence of changes in the population of the levels.43 We are presently studying other cases of these transitions that, as described by Pastawski,89 are ubiquitous in nature, showing up in multiple contexts. For simplicity we did not discuss the effects of the hyperfine couplings provided that they are suppressed by comparatively larger exchange interactions playing a role in the EPR spectra of CuBMB.
Conflicts of interest
There are no conflicts to declare.
Acknowledgements
The compound described here was synthesized by BNC as part of her doctoral thesis work. This work was supported by CNPq in Brazil and by the European Social Fund (ESF) under the project CZ.02.2.69/0.0/0.0/18_070/0009469. RC is a member of CONICET, Argentina. We would like to thank Dr Victor Deflon from the Instituto de Química de São Carlos, Universidade de São Paulo, USP, for the crystallographic orientation of the sample used in the EPR measurements.
References
-
J. Fraxedas, Molecular Organic Materials: From Molecules to Crystalline Solids, Cambridge University Press, Cambridge, 2006 Search PubMed.
-
J. Fraxedas, S. V. Malhotra and B. L. V. Prasad, Molecular Materials: Preparation, Characterization, and Applications, CRS Press, Taylor & Francis, Boca Raton, 2017 Search PubMed.
- V. Ščasnár and J. E. Van Lier, Nucl. Med. Biol., 1993, 20, 257–262 CrossRef.
- K. Ariga, Q. Ji, M. J. Mcshane, Y. M. Lvov, A. Vinu and J. P. Hill, Chem. Mater., 2012, 24, 728–737 CrossRef CAS.
-
D. Gatteschi, R. Sessoli and J. Villain, Molecular Nanomagnets, Oxford University Press, Oxford, 2006 Search PubMed.
-
C. Benelli and D. Gatteschi, Introduction to Molecular Magnetism. From Transition Metals to Lanthanides, Wiley-VCH, Weinheim, 2015 Search PubMed.
- J. Ferrando-Soria, J. Vallejo, M. Castellano, J. Martínez-Lillo, E. Pardo, J. Cano, I. Castro, F. Lloret, R. Ruiz-García and M. Julve, Coord. Chem. Rev., 2017, 339, 17–103 CrossRef CAS.
- E. Nencki, Ber. Dtsch. Chem. Ges., 1873, 6, 598–600 CrossRef.
- A. Bielenica, J. Stefańska, K. Stepień, A. Napiórkowska, E. Augustynowicz-Kopeć, G. Sanna, S. Madeddu, S. Boi, G. Giliberti, M. Wrzosek and M. Struga, Eur. J. Med. Chem., 2015, 101, 111–125 CrossRef CAS PubMed.
- A. Bielenica, K. Stepień, A. Napiórkowska, E. Augustynowicz-Kopeć, S. Krukowski, M. Włodarczyk and M. Struga, Chem. Biol. Drug Des., 2016, 87, 905–917 CrossRef CAS PubMed.
- C. J. Gorter and J. H. Van Vleck, Phys. Rev., 1947, 72, 1128–1129 CrossRef CAS.
- P. W. Anderson and P. R. Weiss, Rev. Mod. Phys., 1953, 25, 269–276 CrossRef CAS.
- P. W. Anderson, J. Phys. Soc. Jpn., 1954, 9, 316–339 CrossRef.
- R. Kubo and K. Tomita, J. Phys. Soc. Jpn., 1954, 9, 888–919 CrossRef CAS.
-
G. E. Pake, Paramagnetic Resonance. An Introductory Monograph, Benjamin, Inc., New York, 1st edn, ch. 7, 1962 Search PubMed.
-
A. Abragam, Principles of Nuclear Magnetism, Clarendon Press, Oxford, 1961 Search PubMed.
- M. Yokota and S. Koide, J. Phys. Soc. Jpn., 1954, 9, 953–960 CrossRef CAS.
- S. K. Hoffmann and L. S. Szczepaniak, J. Magn. Reson., 1983, 52, 182–192 CAS.
- S. K. Hoffmann, J. Goslar and L. S. Szczepaniak, Phys. Rev. B: Condens. Matter Mater. Phys., 1988, 37, 7331–7336 CrossRef CAS.
- S. K. Hoffmann, W. Hilczer and J. Goslar, Appl. Magn. Reson., 1994, 7, 289–321 CrossRef CAS.
- M. C. G. Passeggi and R. Calvo, J. Magn. Reson., Ser. A, 1995, 114, 1–11 CrossRef CAS.
- A. J. Costa-Filho, C. E. Munte, C. Barberato, E. E. Castellano, M. P. D. Mattioli, R. Calvo and O. R. Nascimento, Inorg. Chem., 1999, 38, 4413–4421 CrossRef CAS PubMed.
- A. J. Costa-Filho, O. R. Nascimento, L. Ghivelder and R. Calvo, J. Phys. Chem. B, 2001, 105, 5039–5047 CrossRef CAS.
- A. J. Costa-Filho, O. R. Nascimento and R. Calvo, J. Phys. Chem. B, 2004, 108, 9549–9555 CrossRef CAS.
- E. D. Vieira, N. M. C. Casado, G. Facchin, M. H. Torre, A. J. Costa-Filho and R. Calvo, Inorg. Chem., 2006, 45, 2942–2947 CrossRef CAS PubMed.
- R. Calvo, Appl. Magn. Reson., 2007, 31, 271–299 CrossRef CAS.
- H. Liu and W. Zheng, J. Appl. Phys., 2018, 123, 025105 CrossRef.
- R. C. Santana, R. O. Cunha, J. F. Carvalho, I. Vencato and R. Calvo, J. Inorg. Biochem., 2005, 99, 415–423 CrossRef CAS PubMed.
- E. F. Chagas, R. E. Rapp, D. E. Rodrigues, N. M. C. Casado and R. Calvo, J. Phys. Chem. B, 2006, 110, 8052–8063 CrossRef CAS PubMed.
-
J. A. Weil and J. R. Bolton, Electron Paramagnetic Resonance, Elementary Theory and Practical Applications, Wiley-Interscience, Hoboken NJ, 2nd edn, 2007 Search PubMed.
- R. E. Coffman and G. R. Buettner, J. Phys. Chem., 1979, 83, 2387–2392 CrossRef CAS.
- C. Zener, Proc. R. Soc. London, Ser. A, 1932, 137, 696–702 CrossRef.
- L. D. Landau, Phys. Z. Sowjetunion, 1932, 2, 46–51 CAS.
- M. Tachiki and T. Yamada, J. Phys. Soc. Jpn., 1970, 28, 1413–1425 CrossRef CAS.
- M. Tachiki, T. Yamada and S. Maekawa, J. Phys. Soc. Jpn., 1970, 29, 656–663 CrossRef CAS.
- M. Tachiki and T. Yamada, Prog. Theor. Phys. Suppl., 1970, 46, 291–309 CrossRef.
- H. Eleuch and I. Rotter, Fortschr. Phys., 2013, 61, 194–204 CrossRef.
- V. Zapf, M. Jaime and C. D. Batista, Rev. Mod. Phys., 2014, 86, 563–614 CrossRef CAS.
- S. E. Sebastian, P. Tanedo, P. A. Goddard, S.-C. Lee, A. Wilson, S. Kim, S. Cox, R. D. McDonald, S. Hill, N. Harrison, C. D. Batista and I. R. Fisher, Phys. Rev. B: Condens. Matter Mater. Phys., 2006, 74, 180401 CrossRef.
- L. M. B. Napolitano, O. R. Nascimento, S. Cabaleiro, J. Castro and R. Calvo, Phys. Rev. B: Condens. Matter Mater. Phys., 2008, 77, 214423 CrossRef.
- M. Perec, R. Baggio, R. P. Sartoris, R. C. Santana, O. Peña and R. Calvo, Inorg. Chem., 2010, 49, 695–703 CrossRef CAS PubMed.
- R. Calvo, J. E. Abud, R. P. Sartoris and R. C. Santana, Phys. Rev. B: Condens. Matter Mater. Phys., 2011, 84, 104433 CrossRef.
- R. Calvo, V. T. Santana and O. R. Nascimento, Phys. Rev. B: Condens. Matter Mater. Phys., 2017, 96, 064424 CrossRef.
-
S. Sachdev, Quantum Phase Transitions, Cambridge University Press, Cambridge, 2nd edn, 1999 Search PubMed.
- A. A. Zvyagin, Low Temp. Phys., 2016, 42, 971–994 CrossRef.
- J. Schnack, Phys. Rev. B: Condens. Matter Mater. Phys., 2016, 93, 054421 CrossRef.
- A. Mohamadou, I. Déchamps-Olivier and J. Barbier, Polyhedron, 1994, 13, 1363–1370 CrossRef CAS.
- Nonius [or Hooft, R. W. W.], COLLECT, Nonius BV, Delft, The Netherlands, 1998.
- G. M. Sheldrick, Acta Crystallogr., Sect. A: Found. Crystallogr., 2007, 64, 112–122 CrossRef PubMed.
- P. Coppens, L. Leiserowitz and D. Rabinovich, Acta Crystallogr., Sect. A: Cryst. Phys., Diffr., Theor. Gen. Crystallogr., 1965, 18, 1035–1038 CrossRef CAS.
- L. J. Farrugia, J. Appl. Crystallogr., 1999, 32, 837–838 CrossRef CAS.
- C. F. Macrae, I. J. Bruno, J. A. Chisholm, P. R. Edgington, P. McCabe, E. Pidcock, L. Rodriguez-Monge, R. Taylor, J. Van de Streek and P. A. Wood, J. Appl. Crystallogr., 2008, 41, 466–470 CrossRef CAS.
- S. Stoll and A. Schweiger, J. Magn. Reson., 2006, 178, 42–55 CrossRef CAS PubMed.
- Matlab, The Mathworks Inc.: Natick, MA, USA.
- F. Neese, Wiley Interdiscip. Rev.: Comput. Mol. Sci., 2017, 8, e1327 Search PubMed.
- S. K. Singh, M. Atanasov and F. Neese, J. Chem. Theory Comput., 2018, 14, 4662–4677 CrossRef CAS PubMed.
- S. I. Levchenkov, I. N. Shcherbakov, L. D. Popov, V. V. Lukov, V. V. Minin, Z. A. Starikova, E. V. Ivannikova, A. A. Tsaturyan and V. A. Kogan, Inorg. Chim. Acta, 2013, 405, 169–175 CrossRef CAS.
- A. Bencini and D. Gatteschi, J. Am. Chem. Soc., 1986, 108, 5763–5771 CrossRef CAS PubMed.
- A. W. Addison, T. N. Rao, J. Reedijk, J. van Rijn and G. C. Verschoor, J. Chem. Soc., Dalton Trans., 1984, 1349–1356 RSC.
- H. Pérez, R. S. Corrêa, A. M. Plutín, A. Álvarez and Y. Mascarenhas, Acta Crystallogr., Sect. E: Struct. Rep. Online, 2011, 67, o647 CrossRef PubMed.
- N. Gunasekaran, R. Karvembu, S. W. Ng and E. R. T. Tiekink, Acta Crystallogr., Sect. E: Struct. Rep. Online, 2010, 66, o2601 CrossRef CAS PubMed.
- Z. Weiqun, Y. Wen, X. Liqun and C. Xianchen, J. Inorg. Biochem., 2005, 99, 1314–1319 CrossRef PubMed.
- C. Sacht, M. S. Datt, S. Otto and A. Roodt, J. Chem. Soc., Dalton Trans., 2000, 727–733 RSC.
- E. Chalkidou, F. Perdih, I. Turel, D. P. Kessissoglou and G. Psomas, J. Inorg. Biochem., 2012, 113, 55–65 CrossRef CAS PubMed.
- H. Pérez, B. O'Reilly, A. M. Plutín, R. Martínez, R. Durán, I. G. Collado and Y. P. Mascarenhas, J. Coord. Chem., 2011, 64, 2890–2898 CrossRef.
- S. Yaseen, M. K. Rauf, S. Zaib, A. Badshah, M. N. Tahir, M. I. Ali, I. ud Din, M. Shahid and J. Iqbal, Inorg. Chim. Acta, 2016, 443, 69–77 CrossRef CAS.
-
K. Nakamoto, Infrared and Raman Spectra of Inorganic and Coordination Compounds, Wiley, New York, 1986 Search PubMed.
- P. W. Anderson, Phys. Rev., 1950, 79, 350–356 CrossRef.
- P. W. Anderson, Phys. Rev., 1959, 115, 2–13 CrossRef CAS.
- H. A. Kramers, Physica, 1934, 1, 182–192 CrossRef CAS.
- J. B. Goodenough, Phys. Rev., 1955, 100, 564–573 CrossRef CAS.
- J. Kanamori, J. Phys. Chem. Solids, 1959, 10, 87–98 CrossRef CAS.
- P. J. Hay, J. C. Thibeault and R. Hoffmann, J. Am. Chem. Soc., 1975, 97, 4884–4899 CrossRef CAS.
-
O. Kahn, Molecular Magnetism, Wiley VCH, New York, 1993 Search PubMed.
- W. Wernsdorfer, N. Aliaga-Alcalde, D. N. Hendrickson and G. Christou, Nature, 2002, 416, 406–409 CrossRef PubMed.
- G. A. Timco, S. Carretta, F. Troiani, F. Tuna, R. J. Pritchard, C. A. Muryn, E. J. L. McInnes, A. Ghirri, A. Candini, P. Santini, G. Amoretti, M. Affronte and R. E. P. Winpenny, Nat. Nanotechnol., 2009, 4, 173–178 CrossRef CAS PubMed.
- V. V. Dobrovitski, A. E. Feiguin, D. D. Awschalom and R. Hanson, Phys. Rev. B: Condens. Matter Mater. Phys., 2008, 77, 245212 CrossRef.
- A. M. Gennaro, P. R. Levstein, C. A. Steren and R. Calvo, Chem. Phys., 1987, 111, 431–438 CrossRef CAS.
- Y. Servant, J.-C. Bissey and M. Maini, Physica B, 1981, 106, 343–350 CrossRef CAS.
- R. Calvo and M. A. Mesa, Phys. Rev. B: Condens. Matter Mater. Phys., 1983, 28, 1244–1248 CrossRef CAS.
- M. Bak and N. C. Nielsen, J. Magn. Reson., 1997, 125, 132–139 CrossRef CAS PubMed.
-
A. S. Brill, Transition Metals in Biochemistry, Springer, Heidelberg, 1977 Search PubMed.
- E. I. Solomon, D. E. Heppner, E. M. Johnston, J. W. Ginsbach, J. Cirera, M. Qayyum, M. T. Kieber-Emmons, C. H. Kjaergaard, R. G. Hadt and L. Tian, Chem. Rev., 2014, 114, 3659–3853 CrossRef CAS PubMed.
- R. Taylor and O. Kennard, J. Am. Chem. Soc., 1982, 104, 5063–5070 CrossRef CAS.
-
G. A. Jeffrey, An Introduction to Hydrogen Bonding, Oxford University Press, Oxford, 1997 Search PubMed.
- R. Zhao and R.-Q. Zhang, Phys. Chem. Chem. Phys., 2016, 18, 25452–25457 RSC.
- D. Venegas-Yazigi, K. A. Brown, A. Vega, R. Calvo, C. Aliaga, R. C. Santana, R. Cardoso-Gil, R. Kniep, W. Schnelle and E. Spodine, Inorg. Chem., 2011, 50, 11461–11471 CrossRef CAS PubMed.
- A. Ardavan, A. M. Bowen, A. Fernandez, A. J. Fielding, D. Kaminski, F. Moro, C. A. Muryn, M. D. Wise, A. Ruggi, E. J. McInnes, K. Severin, G. A. Timco, C. R. Timmel, F. Tuna, G. F. Whitehead and R. E. Winpenny, npj Quantum Information, 2015, 1, 15012 CrossRef.
- H. M. Pastawski, Physica B, 2007, 398, 278–286 CrossRef CAS.
Footnotes |
| † Electronic supplementary information (ESI) available. CCDC 1866815. For ESI and crystallographic data in CIF or other electronic format see DOI: 10.1039/c8cp06719h |
| ‡ Elemental analysis (%) for C20H19ClCuN4OS: exp. (calc.) C, 51.95 (51.94); H, 4.31 (4.14); N, 12.15 (12.12); S 7.09 (6.93). |
|
| This journal is © the Owner Societies 2019 |
Click here to see how this site uses Cookies. View our privacy policy here. 
 Open Access Article
 This Open Access Article is licensed under a
  *ab,
Beatriz N.
Cunha
*ab,
Beatriz N.
Cunha
 and Jc = −(EHS − EBS)/[Smax(Smax + 1)].58 The input files are included with the ESI.†
 (Fig. 9(I–a)) with total length 12.97 Å along paths including H-bonds C–H⋯N (underlined) between a methyl carbon of the L ligand to one copper, and a N of the bipy ligand of the following copper. There are two closest Cu3 neighbours to a Cu1 related by inversion centres at 6.321 Å (Cu3a) and 6.636 Å (Cu3b) in Fig. 9(I–c). They give rise to chains –Cu1–Cu3–Cu1–Cu3– along the a-direction, connected with alternate paths
 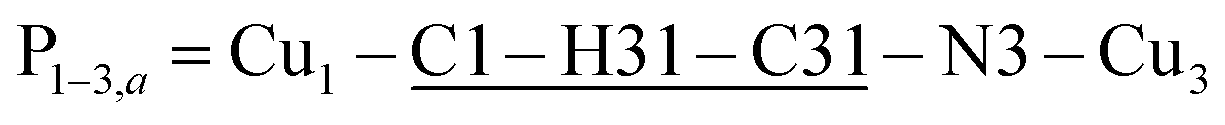 , with total length 9.88 Å, and
 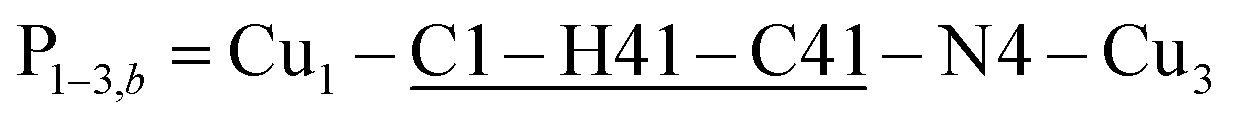 , with total length 9.67 Å, both containing four similar diamagnetic atoms and including hydrogen bonds C–H⋯Cl connecting apical Cl atoms of one Cu with bipy carbons of the other. Alternate couplings J3a and J3b are different because P1–3,a includes an important stacking of bipy rings of Cu1 and Cu3 at ∼3.5 Å, and none appears in P1–3,b. A third pair of connections of Cu1 (see Fig. 9(I–b)) is with two Cu4 at 8.810 Å (Cu1 and Cu4 are related by a 180° rotation plus an inversion), giving rise to zig-zag chains. These equatorial–equatorial paths
  involve 6 diamagnetic atoms including a bipy ring and a C–H⋯O bond, with total length 11.68 Å along the bond (Fig. 9(I–b)). Copper neighbours of the same type (as Cu1–Cu1) at distances equal to or longer than a = 11.979 Å are ignored, as are also ignored the interactions with second Cu neighbours of all types that generate distributions of the couplings around the central values. The couplings J2 and J4 occur with two symmetrical neighbours (z2 = z4 = 2). Obviously, each of the four symmetry related coppers in the lattice has the same neighbourhood described for Cu1. In summary, the paths connecting copper ions in CuBMB are long and complex including both H-bonds and π-stacking.
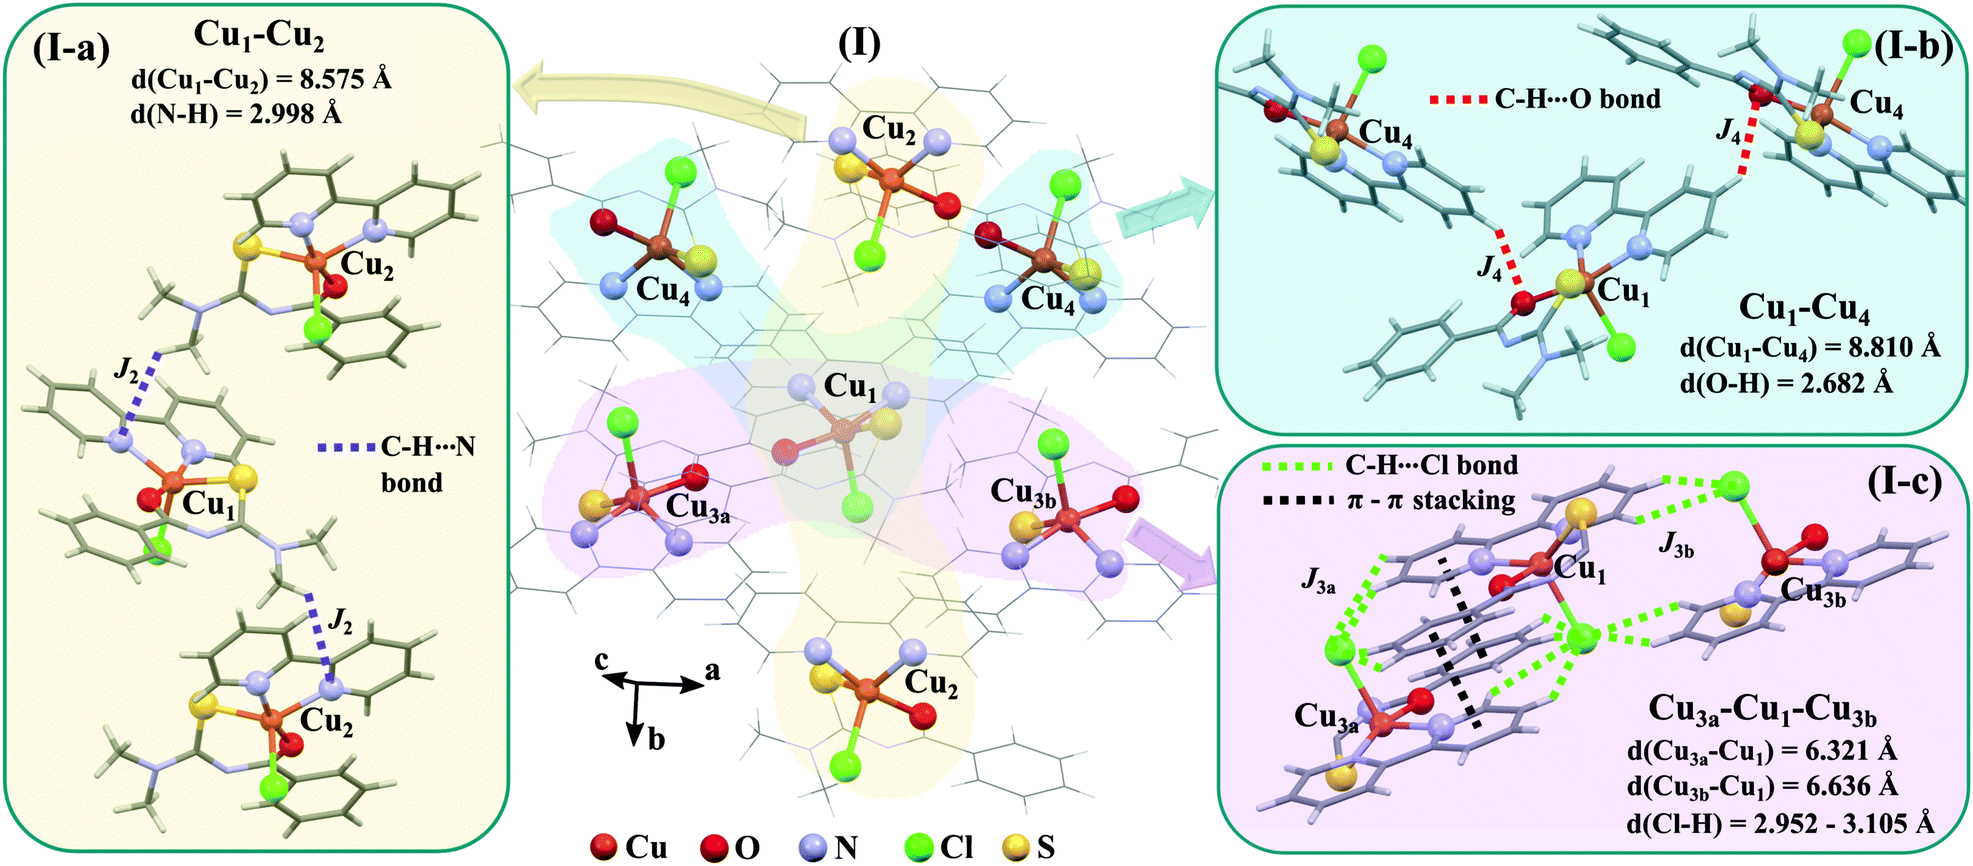
 are the Zeeman interaction with the field B0, and the isotropic intrasublattice and intersublattice exchange interactions Jαβij (|Ji| ≪ hν) between Cu neighbours in the same or in different sublattices, written as:
 also includes anisotropic spin–spin terms
  (mainly dipole–dipole interactions which are not detailed in eqn (1)) and hyperfine couplings
  with the copper nuclei (not observed). At each field orientation η = B0/|B0| = (sin
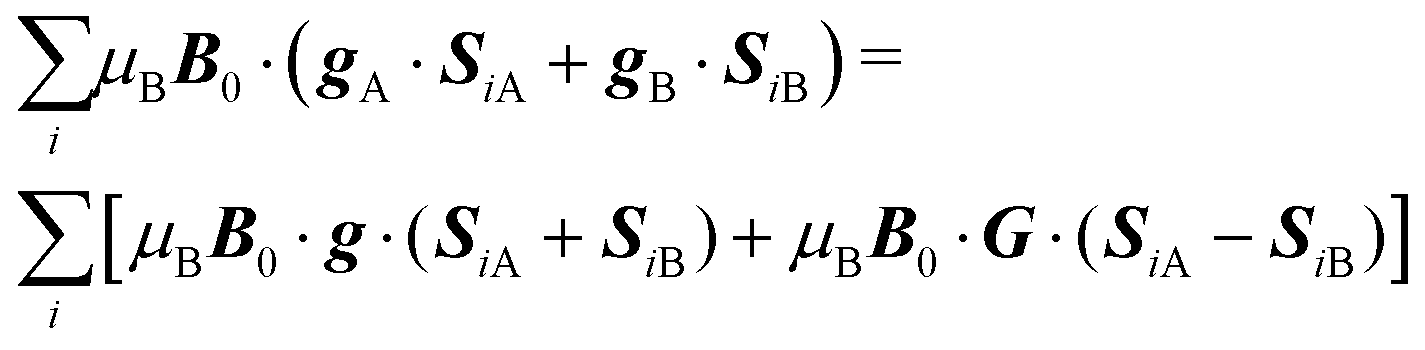
 , and modify the widths of the peaks. Intersublattice exchange interactions such as J2 and J4 arising from the contacts shown in Fig. 9(I–a) and (I–b) modulate and average out terms proportional to G ≠ 0, producing additional changes to the widths and modifying the positions of the peaks.17 So, different sources of narrowing and shifting the resonances provide complementary information. Both coupling pairs J3a and J3b, and J2 and J4 produce equal effects and cannot be distinguished experimentally. The two EPR peaks merge to one peak when the intersublattice exchange coupling becomes equal to the anisotropic Zeeman contribution to eqn (2) proportional to G = 1/2(gA − gB). So, when the intersublattice exchange coupling is negligible compared with the anisotropic Zeeman contribution proportional to G for a particular orientation of B0, the full Zeeman interaction of eqn (1) applies, and we observe as a function of angle two resonances with g-factors gA and gB, allowing us to calculate from these data the matrices gA2 and gB2. Instead, if the exchange coupling between sublattices A and B is larger than the Zeeman splitting this is averaged out and we observe a single resonance with an angle dependent g-factor g = 1/2(gA + gB) that allows us to evaluate the components of the matrix g2 = 1/2(gA2 + gB2). There are field orientations where the resonances are merged, and others where they are split, and a transition between these situations is produced by varying the orientation of B0, as shown in Fig. 5. In addition, strong changes of the line width Ω are observed in the merged ranges (Fig. 6).
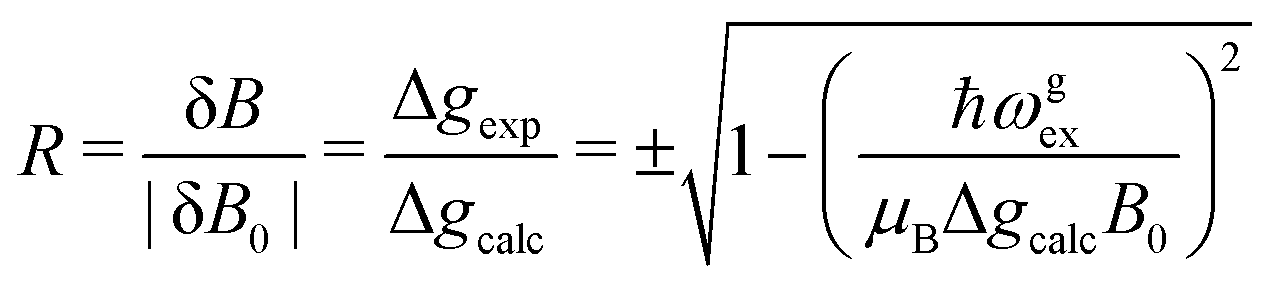
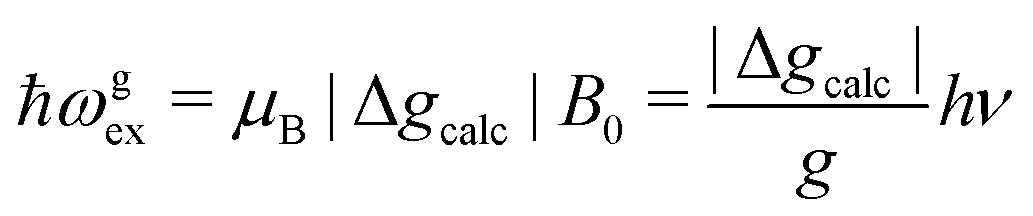
 ,
, 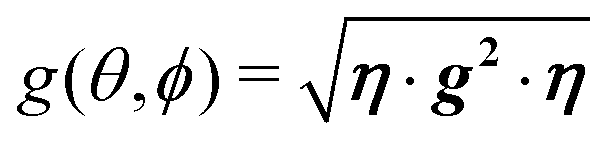 and the calculated values of ħωgex along the directions η where the full mergings are reached in Fig. 5 are given in Table 4.
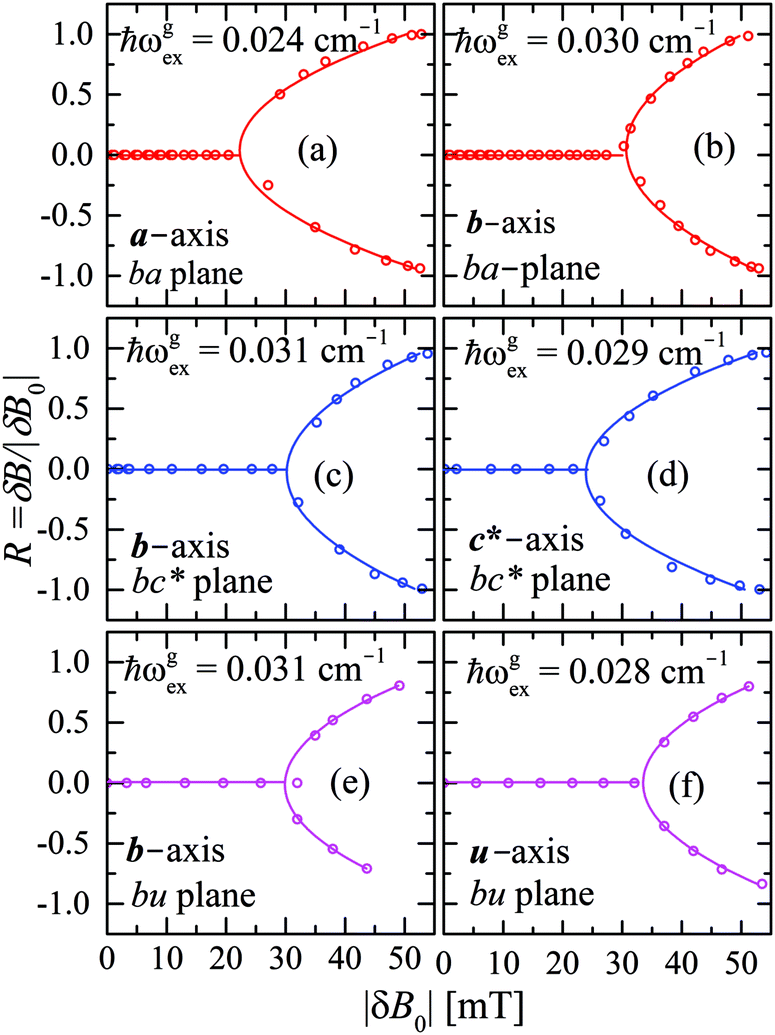
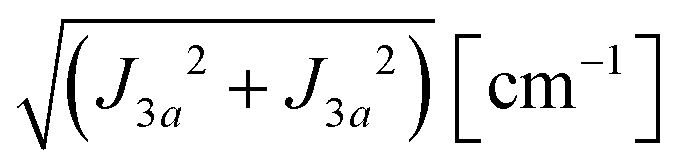
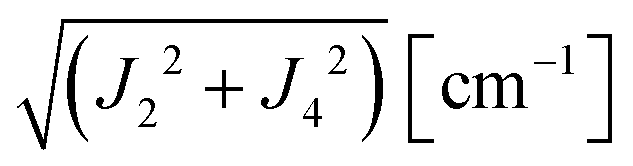
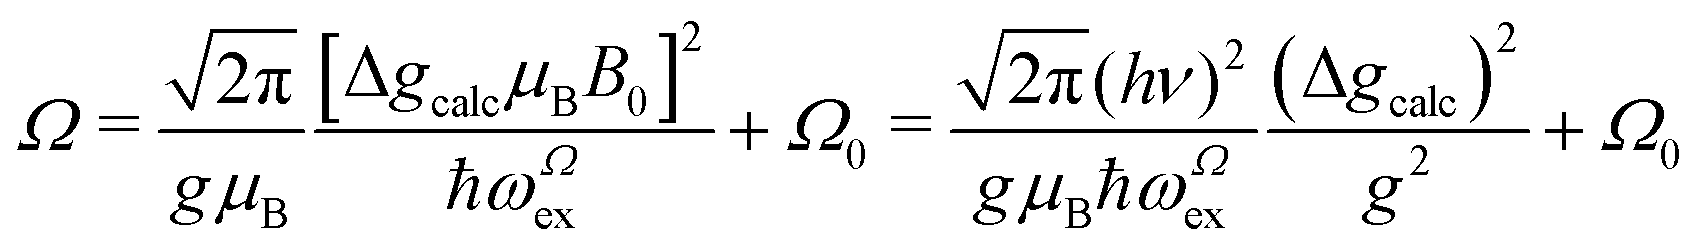
 considers that we measure FWHM widths of Lorentzian derivative signals.21 The data were fitted to the quadratic dependence on Δgcalc (solid lines in Fig. 6a, b and e, enlarged in Fig. 6f and Fig. 11a–f), and the calculated values of ωΩex are collected in Table 4.

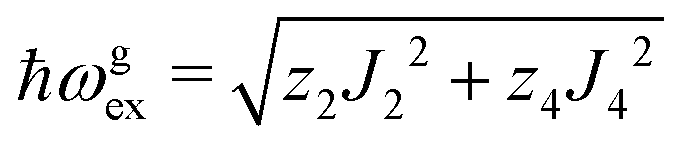
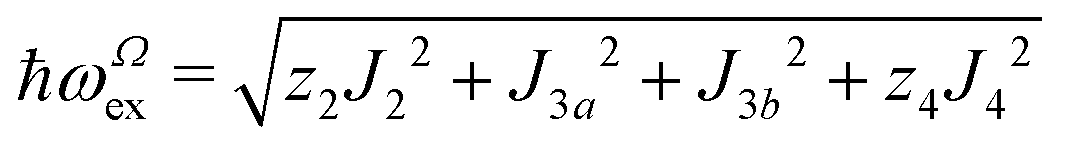
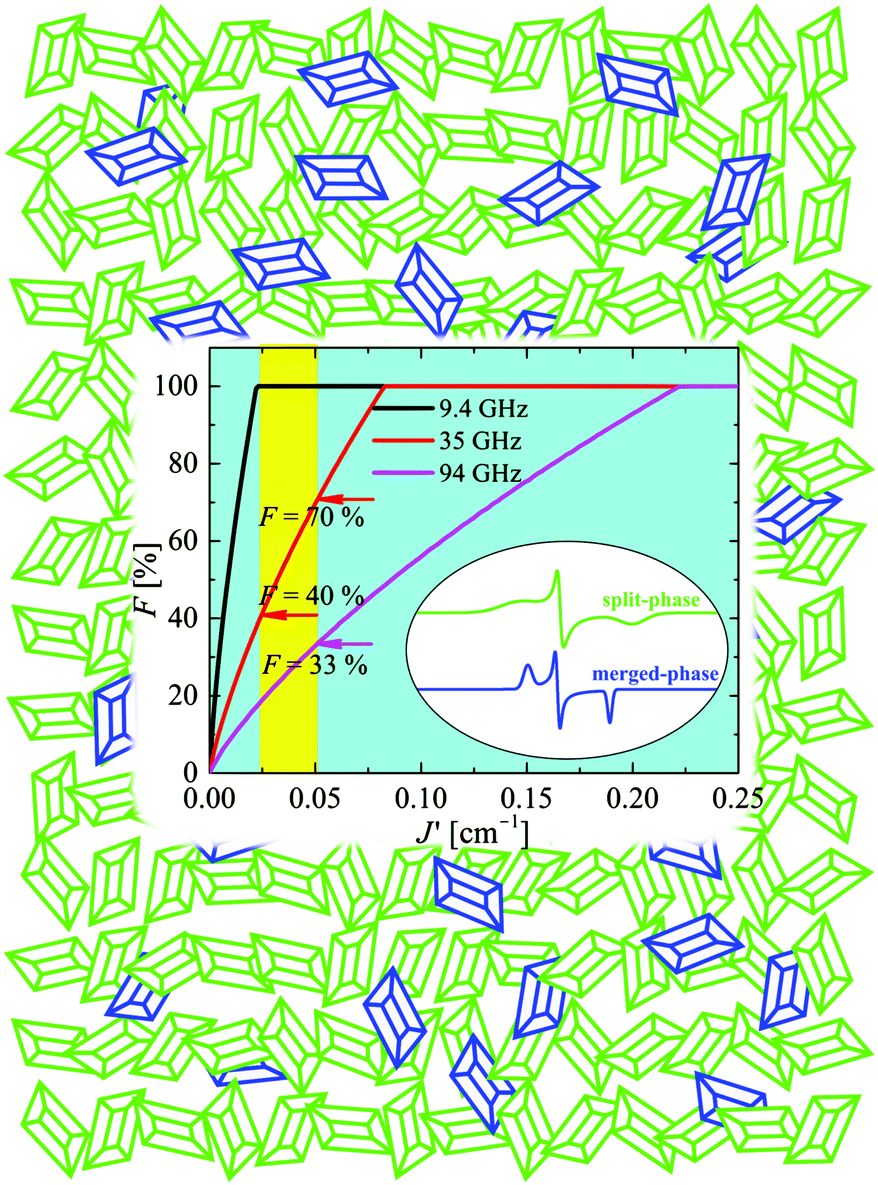
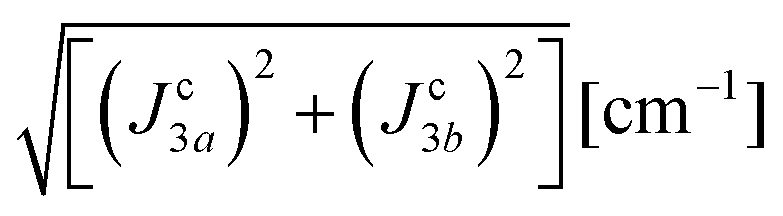
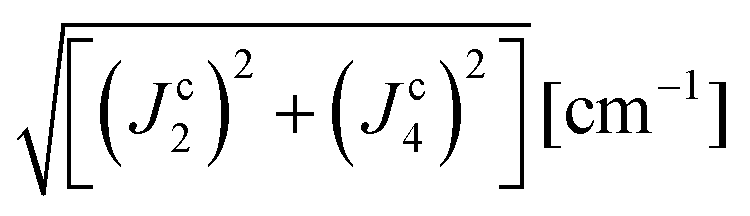
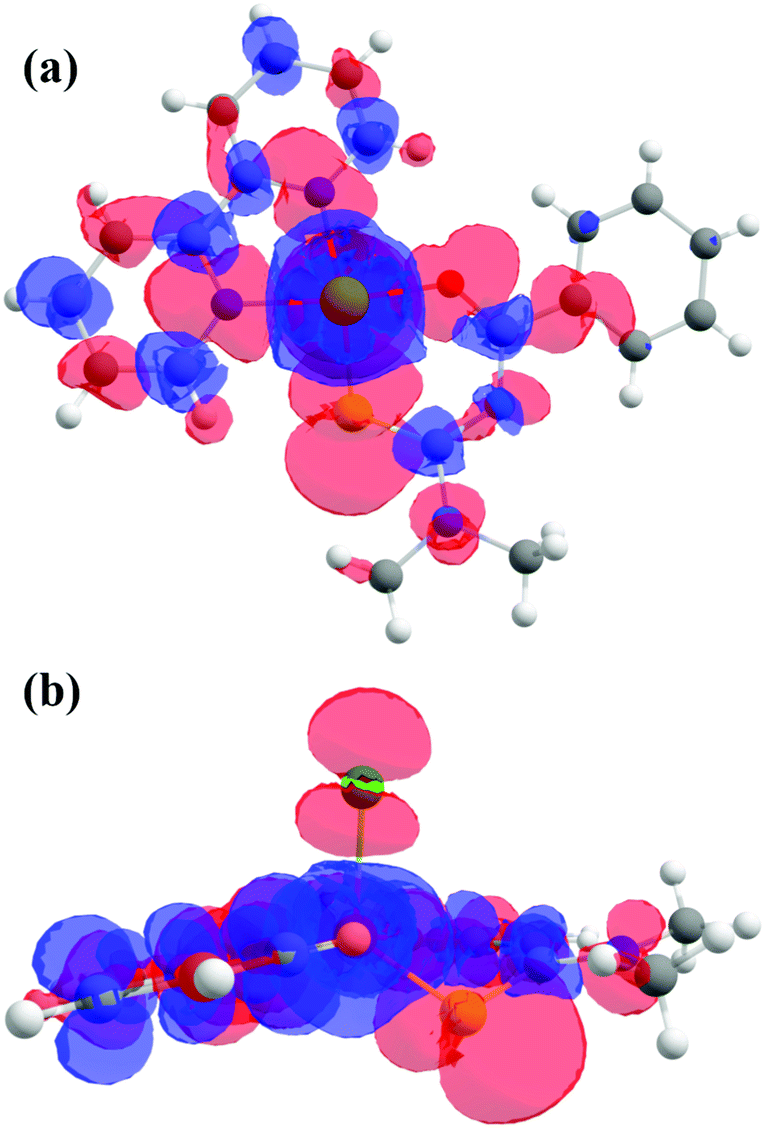
 given in Table 4 are the outcomes of the paths P1–2 and P1–4 described in Section 4.2. They contain 6 diamagnetic atoms and include H-bonds C–H⋯N and C–H⋯O,84,85 respectively. The other important difference is the replacement of a sulfur in the path P1–2 by a nitrogen in P1–4. Since the C–H⋯O bond is shorter than the C–H⋯N bond, J4 may have a more significant contribution than J2. We do not have experimental evidence to assess the specific roles of these differences in the supported exchange couplings J2 and J4, but the DFT results from Table 5 confirm that they are similar with Jc4 slightly greater than Jc2.
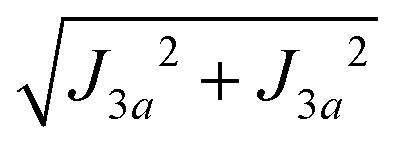 compared to
 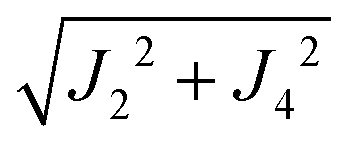 are supported by the chemical paths P1–3a and P1–3b that contain only 4 diamagnetic atoms with a contribution of eight (for J3a) and four (for J3b) similar hydrogen bonds C–H⋯Cl as observed in Fig. 9(I-c). We noted before that an important difference between these paths is the contribution of π–π-stacking of bipyridine-benzoyl rings to J3a.86 In fact, from the exchange frequencies modeled by DFT-BS, the P1–3a path has an overall antiferromagnetic behaviour while P1–3b is ferromagnetic with |Jc3b| > |Jc3a|. It suggests that the stacking contribution is antiferromagnetic, since the C–H⋯Cl bridges are similar in both paths. The work of Venegas et al. assigned to a similar coupling of bipyridine molecules in lamellar [Cu(bipy)(en)Cu(bipy)(H2O)VO34]n a coupling more than one order of magnitude smaller than in CuBMB.87 Thus, we conclude that our results indicate that the largest exchange couplings in CuBMB are between Cu1 and Cu3 ions, related by inversion operations at distances of ∼6.5 Å. The DFT calculation confirms these experimental results with Jc3a,b > Jc2,4. Although the relevant point of this work is to learn about the roles of the interactions in the behaviour of the compound, a more detailed quantitative analysis of the superexchange interactions from the structural data remains to be done.