Aggregation-caused quenching versus crystallization induced emission in thiazolo[5,4-b]thieno[3,2-e]pyridine (TTP) derivatives: theoretical insights†
Laura
Le Bras
 a,
Karen
Chaitou
a,
Stéphane
Aloïse
b,
Carlo
Adamo
a,
Karen
Chaitou
a,
Stéphane
Aloïse
b,
Carlo
Adamo
 ac and
Aurélie
Perrier
 *ad
*ad
aChimie ParisTech, PSL Research University, CNRS, Institut de Recherche de Chimie Paris (IRCP), F-75005 Paris, France
bUniv. Lille, CNRS, UMR 8516, LASIR, Laboratoire de Spectrochimie Infrarouge et Raman, F59 000 Lille, France
cInstitut Universitaire de France, 103 Boulevard Saint Michel, F-75005 Paris, France
dUniversité Paris Diderot, Sorbonne Paris Cité, 5 rue Thomas Mann, F-75205 Paris Cedex 13, France. E-mail: aurelie.perrier-pineau@univ-paris-diderot.fr
First published on 10th October 2018
Abstract
We report a QM (TD-DFT) and QM/QM′ (ONIOM) study of the modulation of emission in a series of thiazolo[5,4,b]thieno[3,2-e]pyridine (TTP) derivatives [Huang et al., J. Mater. Chem. C, 2017, 14, 3456]. By computing the excitation energy transfer couplings and the Huang–Rhys (HR) factors, we rationalize the aggregation-caused quenching (ACQ) observed for the parent molecule and the crystallization-induced emission (CIE) observed for the derivatives presenting intra-molecular H-bonding. We also show that the CIE strategy relying on the rigidification of the arch-bridge-like stator should be considered with caution since it can promote the energy dissipation through vibrational motions.
1 Introduction
The large variety of luminescent molecules and materials that can emit light along with the possibility of covering all the visible spectrum and beyond (UV-Vis and IR) makes this field of research particularly attractive for a large number of applications such as chemosensors, bioprobes and organic light-emitting devices (OLEDs).1–3 To incorporate these luminophores into such optoelectronic devices, the molecules should be assembled into thin films or in aggregates.4 Nevertheless, it is now well-known that molecules that are emissive in solution can undergo a problematic emission quenching after aggregation or crystallization, this is the so-called aggregation-caused quenching (ACQ) phenomenon.5 The ACQ mechanism generally arises from short-range molecular interactions, such as π–π stacking, originating from the planarity of the molecular skeleton and leading to non-radiative relaxation pathways.5–7 Interestingly, in 2001, Tang et al. found that a silole compound, composed of a central silole surrounded by five phenyl rings and a methyl moiety, is not emissive in solution but can luminesce when aggregated.8 In opposition to ACQ, this phenomenon, known as aggregation induced emission (AIE) or crystallization-induced emission (CIE), can be explained by the restriction of intramolecular rotations (RIR).9–11 As a matter of fact, the quasi free rotations of the phenyl rings in solution lead to non-radiative relaxations after excitation while, upon aggregation or crystallization, the RIR block these relaxation pathways and thus induce an enhancement of the photoluminescence (PL) efficiency.In combination with experimental works, theoretical studies have been undertaken to provide a better comprehension of the ACQ and AIE/CIE phenomena. Due to the necessity to describe diverse environments (solution, amorphous phases, aggregates, and crystals), different approaches have been considered ranging from quantum mechanics (QM) calculations relying on Density Functional Theory (DFT) and its Time-Dependent counterpart (TD-DFT) in molecular or crystalline environments, to molecular dynamics (MD). Some recent works have shown that aggregation effects can block the low-frequency movements and thus hinder non-radiative decay channels.12–14 The non-radiative decay of isolated molecules was also attributed to the existence of a conical intersection between the ground and the first excited states, as demonstrated by excited state dynamics combined with QM calculations.15 In a recent work, we have investigated the modulation of the emission behavior of a dipyrrolyldiphenylethene molecule in three different phases (solution, crystals, and aggregates) with the help of MD, (TD-)DFT and hybrid QM/QM′ calculation. We have demonstrated that in crystals and within the aggregates, the steric hindrance effect strongly modifies the topology of the first excited-state potential energy surface and this results in a restriction of the vibrational modes involved in the energy dissipation.16
In this work, we are interested in the properties of a new family of CIE luminogens. A fluorophore family based on the same core, namely a thiazolo[5,4-b]thieno[3,2-e]pyridine (TTP) stator (Fig. 1), has been found to exhibit interesting luminescent properties.17 The parent molecule 0 shows weak PL efficiency in benzene (Φf = 10%, see Table 1) and a very weak solid PL efficiency (only 1%). An intramolecular H bond between the stator and the rotor (molecule 1, Fig. 1) was introduced to rigidify the structure, restrict the intramolecular rotation and thus increase the solution PL efficiency. However, Huang et al. have shown that the rigidification of the structure leads to a decrease of the PL efficiency in a non-polar solvent (benzene). At the same time, an enhancement of the emission properties in the solid state was observed. While the relative PL efficiency of 0 and 1 in solution has not be rationalized, the particular arrangement of the molecules in the condensed phase is a possible explanation for the ACQ for molecule 0 and for the CIE behavior observed for 1. Based on this first study, Wan and coworkers have synthesized a large number of molecules which are able to emit all along the visible spectra (403 nm ≤ λem ≤ 655 nm).18 The molecules present subtle different structures thanks to various substitutions on the rotor (the A-ring in Fig. 1). Among the pool of synthesized compounds, molecules 2–5, displayed in Fig. 1, exhibit much stronger PL efficiencies in the solid phase than in solution. One can also notice that for compounds 1 to 5, a large Stokes shift is observed and can be attributed to an excited state intramolecular proton transfer (ESIPT) phenomenon.
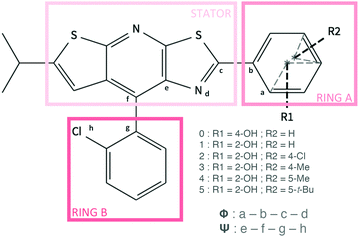 | ||
| Fig. 1 Representation of the structures and selected atom numbering for molecules 0 to 5. The dihedral angles ϕ and ψ are also defined. | ||
| Solution | Solid state | |||||
|---|---|---|---|---|---|---|
| λ abs | λ em | Φ f | λ abs | λ em | Φ f | |
| 0 | 360 | 387 | 10 | 394 | 452 | 1 |
| 1 | 373 | 545 | 2 | 374 | 550 | 26 |
| 2 | 375 | 530 | 12 | 393 | 530 | 55 |
| 3 | 373 | 545 | 4 | 400 | 532 | 60 |
| 4 | 377 | 570 | 4 | 400 | 550 | 60 |
| 5 | 376 | 565 | 4 | 402 | 555 | 62 |
In their experimental work, to rationalize the ACQ or CIE effects, Huang et al. provide some hypotheses based on the mechanisms described in the literature19 as well as the molecular packing in the crystalline phase. However, the behavior of molecule 1 in benzene solution is not discussed and the relationship between the minor structural modifications and the solid state properties could not be fully assessed. In this work, we thus propose to rely on (TD-)DFT calculations combined with the QM/QM′ approach to investigate the structural and optical properties of molecules 0–5 both in solution and in their crystalline environment. We aim at understanding (i) the ACQ phenomenon for 0, (ii) the decrease of the solution PL efficiency of 1 compared to 0 and the moderate CIE effect for the former system and (iii) the larger CIE phenomenon observed for compounds 2–5, in order to formulate structure–photoproperty relationships for this family of luminogens. Our goal is to identify the different processes that can contribute to the non-radiative decay rate and to describe the competition between these effects for the six different molecules in two different phases (solution and crystals). For this purpose, the absorption and emission properties of the different molecules will first be theoretically investigated in solution, with an implicit solvent model, and then used as a reference to rationalize the modulation of emission in the crystalline phase.
2 Computational details
Calculations were performed using a development version of Gaussian code20 (optimizations of ground and excited states, TD-DFT and QM/QM′ calculations) and Gaussian 16 software21 (frequencies, HR factors and excitation energy transfer calculations).2.1 Solvated molecules
The ground-state (GS, state S0) and excited-state (ES, S1) properties were investigated with the help of DFT and TD-DFT methods. In the course of both the geometry optimizations and the calculation of the optical properties, three different exchange–correlation (XC) functionals were tested: two global hybrids, PBE022 and B3LYP,23 and one range-separated hybrid (RSH) CAM-B3LYP.24 We used these three functionals in combination with the extended 6-311+G(d,p) basis set. For all the GS and ES optimized structures, frequency calculations were performed to ensure that the structures correspond to true minima of the potential energy surface. Transition states (TS) were localized with the Synchronous Transit-Guided Quasi-Newton (STQN) method and more specifically the QST325 approach. All the geometry optimizations have been carried out in benzene, relying on the Polarizable Continuum Model (IEF-PCM) to quantify the impact of the environment.26 The GS and ES geometry optimizations as well as the computation of the absorption and emission properties were performed in the equilibrium limit using the linear-response (LR) PCM scheme.A benchmark study of the geometry and absorption properties of molecules 0 and 1 is provided in the ESI.† The absorption properties were calculated with the TDi//optimizationj protocol (i and j corresponding to PBE0, B3LYP or CAM-B3LYP), that is to say 9 different computational strategies. As discussed in the ESI,† while the GS optimized structures are globally not impacted by the choice of the functional, the value of the calculated maximum absorption wavelength depends on the choice of the XC functional. The energy differences between the experimental and calculated excitation energies (ΔEcalc–exp) are gathered in Fig. S1 (ESI†) for the different computational strategies. These results show that both the TD-B3LYP//B3LYP and TD-PBE0//B3LYP computational schemes provide an accurate reproduction of the experimental data with a |ΔEcalc–exp| equal to 0.12 eV for both 0 and 1. For the sake of simplicity, we have thus decided to investigate the structural and optical properties of 0 to 5 with the same XC functional, namely B3LYP.
Huang–Rhys (HR) factors, electron-vibration coupling constants, were also calculated. For an emission process, the dimensionless HR factor illustrates the variation of the jth vibrational mode in the course of the Sn (n = 1 in our case) → S0 deexcitation:
 | (1) |
 | (2) |
2.2 Crystalline phase
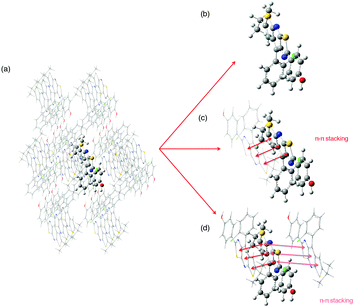
In order to describe the crystalline phase, the QM/QM′ ONIOM model was used. To set up this model one needs to define a sufficient number of molecules extracted from the experimental crystal supercell to mimic the crystalline structure,17,18 namely 26, 27, 21, 21, 25 and 21 molecules for 0, 1, 2, 3, 4 and 5 respectively. These large clusters will be treated at the QM/QM′ level: a central monomer, dimer or trimer, depending on the molecular packing, is defined as the model system and described with both the high level QM and the low level QM′ approaches whereas the complete system (the model and the surrounding molecules) is only treated with the QM′ strategy (see Fig. 2). In the course of geometry optimizations, for both the GS and ES, the central molecule(s) is(are) relaxed while the surrounding ones are kept frozen. For both the geometry optimizations and the calculation of absorption and emission properties, QM and QM′ strategies respectively rely on B3LYP/6-311+G(d,p) and HF/3-21G(d) calculation schemes within the charge embedding framework.28 This strategy has been successfully used in previous similar studies.16,29–31 For the GS and ES optimized structures, analytical frequencies were calculated with the Gaussian 16 code.21 One should note that it was not possible to calculate the HR factors within the ONIOM framework. We have also analyzed the electronic energy transfer (EET) within these assemblies relying on the model proposed in Gaussian 16.32,33 A TD-DFT excited-state calculation is performed on each chromophore at the B3LYP/6-311+G(d,p) level in the gas phase, and all the couplings among all the resulting states are computed. We provide the value of the largest exciton coupling Jij between two monomers i and j in a dimer.3 Results and discussion
3.1 Study of the solvated isolated molecules
| State | 0 | 1 | 2 | 3 | 4 | 5 |
|---|---|---|---|---|---|---|
| S0 | ||||||
| ϕ (°) | −19 | 0 | 0 | 0 | 0 | 1 |
| ψ (°) | −117 | −101 | −77 | −103 | −103 | −81 |
| Cb–Cc (Å) | 1.466 | 1.457 | 1.457 | 1.454 | 1.456 | 1.456 |
| Nd⋯HO (Å) | 1.761 | 1.754 | 1.764 | 1.766 | 1.767 | |
| State | 0 | 1 | 2 | 3 | 4 | 5 |
|---|---|---|---|---|---|---|
| S1*(E) | S1*(K) | |||||
| ϕ (°) | −8 | 4 | −21 | 3 | 2 | 11 |
| ψ (°) | −125 | −121 | −65 | −121 | −121 | −59 |
| Cb–Cc (Å) | 1.461 | 1.460 | 1.457 | 1.459 | 1.460 | 1.462 |
| Nd–H⋯O (Å) | 1.810 | 1.909 | 1.818 | 1.790 | 1.821 | |
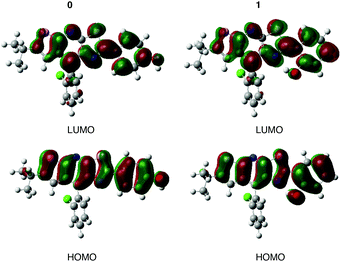
The value of the maximum absorption wavelength (λabs), given in Table 3, is a direct consequence of the electronic conjugation modulation. Indeed, there is a bathochromic shift from 0 (λabs = 349 nm) to 1–5 (360 nm ≤ λabs ≤ 368 nm). For all the molecules, Table 3 shows a good agreement between calculations and experimental data with the largest excitation energy difference, ΔEcalc–exp, obtained for molecule 3 (0.13 eV). The calculated λabs systematically corresponds to the S0 → S1 transition as shown for molecules 0 and 1 in Table SII (ESI†). This transition can be ascribed to an electronic excitation from the Highest Occupied Molecular Orbital (HOMO) to the Lowest Unoccupied Molecular Orbital (LUMO). Fig. 3 shows that there is no charge transfer for this electronic transition, the frontier orbitals being mainly located both on the stator and the A-ring. A representation of the HOMO and LUMO for molecules 2–5, given in the ESI† (Fig. S2), confirms this conclusion for the other systems.
| Molecule | λ (nm) | f | Δλcalc–exp (nm) | λ exp (nm) | |
|---|---|---|---|---|---|
| 0 | abs | 349 | 0.983 | −11 | 360 |
| em | 411 | 0.984 | +24 | 387 | |
| 1 | abs | 360 | 0.740 | −13 | 373 |
| em | 525 | 0.321 | −20 | 545 | |
| 2 | abs | 361 | 0.919 | −14 | 375 |
| em | 533 | 0.331 | +3 | 530 | |
| 3 | abs | 361 | 0.850 | −13 | 374 |
| em | 534 | 0.292 | −11 | 545 | |
| 4 | abs | 369 | 0.648 | −8 | 377 |
| em | 557 | 0.295 | −13 | 570 | |
| 5 | abs | 368 | 0.681 | −8 | 376 |
| em | 559 | 0.295 | −6 | 565 | |
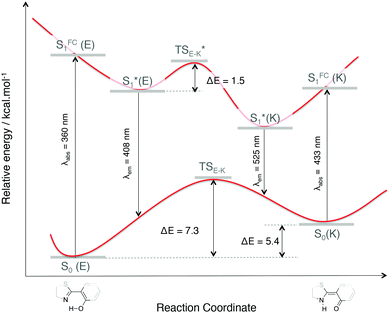 | ||
| Fig. 4 Impact of the proton transfer, from an enol to a keto form of 1, on the energetics and optical properties (absorption and emission wavelengths in nm). | ||
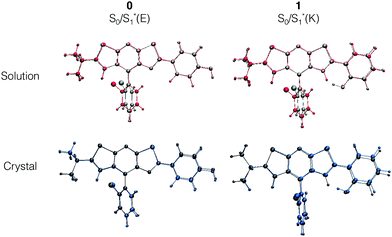
For molecule 0, due to the para position of the hydroxyl moiety, there is no ESIPT phenomenon. The emission signal arises from a relaxation from the enol form S1*(E), thus leading to a small Stokes shift (exp.: 27 nm, calculated: 62 nm). A superposition of the optimized ground S0(E) and first excited S1*(E) state geometries in Fig. 5 shows that the structure becomes more planar with a decrease of the dihedral angle Φ between the stator and the A-ring (−19° to −8°). Besides, there is a rotation around the Cf–Cg bond which leads to an orientation modification for the B-ring. This rotation is illustrated with the evolution of Ψ values in Table 2 (Ψ = −117° for S0 and −125° for S1*(E)). The latter conclusion holds for molecules 1 and 3–5. For these molecules, the rotation of the B-ring is accompanied by the proton transfer and the structure remains planar. On the opposite, for molecule 2, the relaxation on the ES also leads to a loss of planarity: the electron-withdrawing character of the 4-Cl substituent on the A-ring weakens the interaction between the NdH and the keto groups. This induces a rotation of the A-ring with respect to the stator and the ϕ dihedral angle reaches −21° (see Fig. S3, ESI†).
To explain the non-radiative behavior of 0 in solution, Huang et al. proposed (i) the formation of intermolecular hydrogen bonding and (ii) the participation of photo-induced proton transfer.17 However, the formation of intermolecular hydrogen bonds between the solvent and the solute is unlikely in an aprotic solvent. In the same vein, the concentration of the solution (2 × 10⁻⁵ M) should not promote the formation of H bonds between solute molecules. The same conclusions hold for the intermolecular photo-induced proton transfer: the concentration of the solution as well as the nature of the solvent should not favor this phenomenon. Hence, the existence of non-radiative energy-dissipating paths should not arise from intermolecular interactions, as originally stated in the experimental study, but from intramolecular-scale processes.
In this framework, recent works have proposed an interpretation of the origin of the non-emissive behavior of AIE/CIE molecules in solution.14,15,38 In some cases, the weak PL efficiency is due to the presence of an energetically accessible conical intersection (CI) leading to an ultrafast internal conversion from the excited state to the ground state. The identification of conical intersections for the considered systems is far from trivial since (i) the molecules are large, (ii) the electronic structure is thus described within the TD-DFT framework and (iii) the environment should be properly described to account for the emission modulation phenomena. At that stage, the partial characterization of the fundamental and first excited potential energy surfaces (minima and transition states as shown in Fig. 4 for 1) has not revealed the existence of S1/S0 crossing.
Finally, the role of photophysical energy dissipation caused by vibrational motions was investigated to rationalize the weak emission signal in solution. For this purpose, the HR factors were computed and used as an indicator of the contribution of vibrational modes in the non-radiative relaxation pathways. Indeed, the non-radiative decay rate is influenced by the internal conversion (IC) rate which directly relies on these factors.14,16 The calculated HR factors are presented in Fig. 6 for 0 and 1 and also in the ESI† for the four other molecules. For all the compounds, one vibrational mode is of major importance and is always associated with one of the lowest frequencies (ω = 20 cm−1 for 0 and 21 cm−1 for 1). A large HR factor is found for this mode, HR = 5 and 12 for 0 and 1 respectively (the complete list of HR factors and the corresponding reorganization energies is given in the ESI†). One can notice that for all the structures, this mode corresponds to the same motion (see Fig. 7 for a schematic representation of this vibration mode).
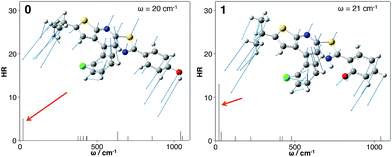 | ||
| Fig. 6 Calculated HR factors versus the normal-mode wave numbers (ω) in the S1 state for 0 (left) and 1 (right). Vibration modes yielding the largest HR factors are also represented. | ||
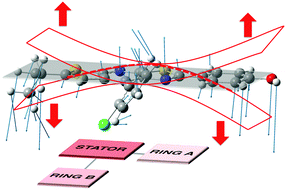 | ||
| Fig. 7 Schematic representation of the vibrational mode corresponding to the large HR value (ω = 20 cm−1, HR = 5 for molecule 0). | ||
One can notice that 0 is more emissive than 1, with a PL efficiency of 10% and 2% respectively. For 1, the intramolecular hydrogen bond was originally introduced to rigidify the molecular structure, activate the Restriction of Intramolecular Motion (RIR) and enhance PL efficiency. The counter-intuitive behaviour observed for 1 can be rationalized by the identification of the vibrational mode contributing to the energy dissipation: this mode implies bending of the conjugated core (stator and A-ring) above and under the molecular plane (Fig. 7). For molecule 1, the “A-ring–stator” moiety becomes more conjugated. The rigidification of the structure thus induces an enhancement of the HR factor and an increase of the reorganization energy (105 cm−1 for 0 and 275 cm−1 for 1). As a matter of fact, the intramolecular H-bond induces less structural reorganization while relaxing on the S1 potential energy surface and this should enhance the HR value according to eqn (1).
The same conclusion holds for molecules 3, 4 and 5. They exhibit a relatively small fluorescence quantum yield which is due to the participation of the same low-frequency vibration mode (Fig. S5, ESI†), with a high HR factor (HR = 12, 12 and 23 for 3, 4 and 5 respectively), to the IC and thus the non-radiative deexcitation processes. We can also deduce that for alkyl substituents, neither the substitution position (4-Me for 3 and 5-Me for 4) nor the bulkiness of the group (5-Me for 4 ad 5-t-Bu for 5) influence the emission properties. For compound 2 with a 4-Cl substituent, there is not only one low-frequency vibration mode with a high HR factor but two (HR = 7 and 6 for ω = 20 cm−1 and ω = 30 cm−1, see Table SII in the ESI†). One can notice that these frequencies correspond to the same nearly degenerate vibrational mode. One frequency mainly implies the stator (ω = 20 cm−1) while for the second one (ω = 30 cm−1), the A-ring is mainly involved (Fig. S5, ESI†). This different behavior and the decrease of the HR values compared to molecules 3–5 might be rationalized by the twist of the A-ring with respect to the stator for the S1*(K) structure of 2. Therefore, one can observe a slight modulation of PL efficiency between 2 (Φf = 12%) and 3, and 4 and 5 (Φf = 4% for the three molecules).
3.2 Study of the crystalline phase
Structural and electronic properties. The experimental crystalline structure is given in Fig. 8. The molecular packing is characterized by a π–π stacking with two dominant arrangements. On the one hand, for monomers A and B, the two stators are superimposed and present a head-to-tail arrangement. On the other hand, for monomers A and C, also arranged in an antiparallel configuration, there is an intermolecular π–π interaction between one ring of each stator (distance d4 in Fig. 8). Starting from a cluster of 26 molecules (see Fig S6, ESI,† for a representation of the complete system), we have considered three different ONIOM models that vary in the definition of the QM region: (i) 0-M: the central monomer A; (ii) 0-D: the dimer chromophore A–B; (iii) 0-T: the trimer chromophore C-A-B.
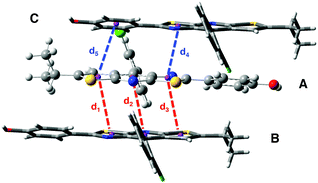 | ||
| Fig. 8 Crystal structure of compound 0 with the three monomers A, B and C represented. The intermolecular distances d1 to d5 are defined. | ||
In the course of the geometry optimizations, we have optimized the positions of respectively one, two and three molecules for the 0-M, 0-D and 0-T models, the positions of the other molecules (respectively 25, 24 and 23 molecules) being frozen.
In Table 4, selected optimized geometrical parameters obtained with the three models are compared to experiments. For the intramolecular structural parameters, namely the two dihedral angles and the Cb–Cc bond distance, one can conclude that (i) the three different models provide the same results and (ii) there is no major difference between the experimental and calculated values. The same conclusions hold for the intermolecular π–π interactions that are described by the distances between two ring centers (d1 to d5 in Fig. 8). The small intermolecular distances d1 to d3 (∼3.75 Å) show that the two monomers A and B are close enough to allow the emergence of short range interactions.39 The interaction between A and C is weaker with only one π-stacking distance (d4) shorter than 4 Å. We can also note that our computational strategy, that does not include dispersion corrections, provides intermolecular distances in agreement with experiments. The crystal packing is thus controlled by steric effects rather than dispersion.
| Exp. | 0-M | 0-D | 0-T | |
|---|---|---|---|---|
| ϕ (°) | −19 | −17 | −18, −18 | −18, −18, −19 |
| ψ (°) | −117 | −114 | −116, −115 | −114, −115, −114 |
| Cb–Cc (Å) | 1.465 | 1.468 | 1.467, 1.467 | 1.466, 1.467, 1.466 |
| d 1 (Å) | 3.784 | 3.782 | 3.779 | 3.781 |
| d 2 (Å) | 3.768 | 3.766 | 3.762 | 3.691 |
| d 3 (Å) | 3.690 | 3.778 | 3.606 | 3.667 |
| d 4 (Å) | 3.766 | 4.022 | 3.695 | 3.703 |
| d 5 (Å) | 4.424 | 4.256 | 4.091 | 4.054 |
To explore the possible excitonic coupling, we have computed the absorption spectra for the three different models (Table 5). For monomer 0-M, compared to the isolated molecule in solution (Table 2 and Table SII, ESI†), the maximum absorption band is also ascribed to a HOMO → LUMO electronic excitation, with the frontier orbitals provided in Fig. S8 (ESI†) identical to the solvated monomer ones. The crystal environment shifts this state to the blue (λ = 338 nm) compared to the absorption in solution (λ = 349 nm). This finding is in disagreement with experiments: a red-shift of the absorption band has been observed while going from the solution (λ = 360 nm) to the crystal (λ = 400 nm). For the 0-D model, the absorption spectrum is dominated by two transitions. The frontier orbitals involved in the corresponding electronic excitations are delocalized over the two chromophores (Fig. 9). Even if the brightest state is also blue-shifted compared to the solution (λ = 335 nm), the convoluted absorption spectrum shows an enlargement of the absorption band towards larger wavelengths compared to the 0-M model (Fig. 10). The same conclusions can be drawn for the 0-T model: (i) the frontier orbitals involved in the main transitions are delocalised over the three chromophores (Fig. S8, ESI†) and (ii) there is a global broadening of the spectrum for λ ≥ 350 nm that is due to numerous low-energetic transitions (with small f values) arising from the excitonic coupling.
| System | State | λ abs (nm) | f | Assignment |
|---|---|---|---|---|
| 0-M | S1 | 344 | 0.116 | HOMO−1 → LUMO |
| S2 | 338 | 0.557 | HOMO → LUMO | |
| 0-D | S3 | 351 | 0.221 | HOMO−1 → LUMO |
| S7 | 335 | 0.586 | HOMO−2 → LUMO+1 | |
| 0-T | S3 | 362 | 0.127 | HOMO−1 → LUMO |
| S6 | 349 | 0.553 | HOMO−2 → LUMO | |
| S11 | 338 | 0.508 | HOMO−3 → LUMO+1 | |
| 1-M | S1 | 360 | 0.312 | HOMO → LUMO |
| S2 | 355 | 0.225 | HOMO−1 → LUMO | |
| 1-D | S2 | 370 | 0.094 | HOMO → LUMO |
| S4 | 359 | 0.257 | HOMO → LUMO+1 | |
| S5 | 351 | 0.133 | HOMO−2 → LUMO | |
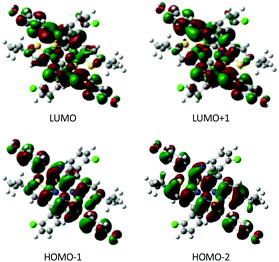 | ||
| Fig. 9 Molecular orbitals calculated for the 0-D model. Only chromophores A and B are represented (isodensity = 0.025 a.u.). | ||
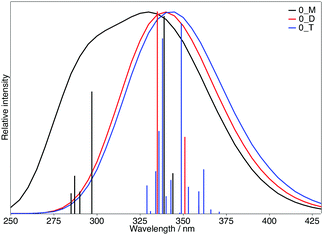 | ||
| Fig. 10 Calculated absorption spectra of the 0-M (black), 0-D (red) and 0-T (blue) models. The sticks have been convoluted with a Gaussian presenting a FWHM of 0.3 eV. | ||
Further understanding can be achieved by calculating the excitonic couplings between the three chromophores. In Table 6, the largest coupling, on the order of −100 meV, corresponds to the A–B interaction and the negative sign shows the existence of J-aggregates at the origin of the bathochromically shifted bands.40 The JA–C coupling is also negative and reaches ∼−60 meV. A recent work has demonstrated that excitonic coupling always enhances the non-radiative decay constants, regardless of the sign of J.41 Therefore, for 0, in going from the solution to the crystal environment, the complex molecular packing with two different π-stacking arrangements promotes a non-radiative relaxation pathway through excitonic couplings and this phenomenon is at the origin of the observed ACQ.
| Molecule | 0 | 1 | 2 | 3 | 4 | 5 |
|---|---|---|---|---|---|---|
| J A–B | 0.097 | −0.024 | −0.021 | 0.015 | 0.015 | 0.001 |
| J A–C | −0.057 | 0.017 |
Contribution of other non-radiative decay routes. To understand the origin of the low emission signal (λem = 452 nm, Φf = 1%), the geometry of the S1*(E) excited state has been determined for the 0-M model. The structural parameters are given in Table 7. The S1*(E) structure is more planar than the GS and the comparison with the solvated monomer shows that the rotation of the B-ring is restricted in the crystal.
| State | 0 | 1 | 2 | 3 | 4 | 5 | |
|---|---|---|---|---|---|---|---|
| S0 | |||||||
| ϕ (°) | Exp. | −19 | 6 | 1 | −5 | −1 | 4 |
| Cal. | −17 | 6 | −2 | −4 | −1 | 4 | |
| ψ (°) | Exp. | −117 | −116 | −63 | −116 | −112 | −63 |
| Calc. | −114 | −115 | −67 | −118 | −112 | −63 | |
| Cb–Cc (Å) | Exp. | 1.465 | 1.452 | 1.460 | 1.451 | 1.453 | 1.458 |
| Calc. | 1.468 | 1.455 | 1.457 | 1.449 | 1.452 | 1.451 | |
| Nd⋯HO (Å) | Exp. | 1.951 | 1.892 | 1.898 | 1.874 | 1.900 | |
| Calc. | 1.781 | 1.724 | 1.749 | 1.753 | 1.781 | ||
| State | 0 | 1 | 2 | 3 | 4 | 5 |
|---|---|---|---|---|---|---|
| S1*(E) | S1*(K) | |||||
| ϕ (°) | −11 | 6 | −1 | −6 | −8 | 4 |
| ψ (°) | −120 | −120 | −64 | −126 | −119 | −58 |
| Cb–Cc (Å) | 1.422 | 1.451 | 1.464 | 1.471 | 1.476 | 1.474 |
| Nd–H⋯O (Å) | 1.852 | 1.880 | 1.935 | 1.807 | 1.943 | |
The comparison of the calculated emission energy in Table 8 with experiments reveals a reasonable blue-shift deviation (−0.25 eV). After calculating the vibrational spectrum of the S1*(E) structure, we have carefully investigated the low-frequency vibrational modes and compared them with the ones obtained in solution. This comparison reveals that the mode contributing to the energy dissipation in solution (20 cm−1) can be retrieved in the crystalline environment. As illustrated in Fig. 11, despite the intermolecular interactions arising from the π–π stacking, the packing structure for 0 does not restrict this vibrational motion.
| Molecule | λ (nm) | f | ΔEcalc–exp (eV) | λ exp (nm) | |
|---|---|---|---|---|---|
| 0 | abs | 338 | 0.557 | −0.52 | 394 |
| em | 415 | 0.182 | −0.25 | 452 | |
| 1 | abs | 360 | 0.313 | −0.13 | 374 |
| em | 567 | 0.141 | 0.07 | 550 | |
| 2 | abs | 360 | 0.625 | −0.29 | 393 |
| em | 486 | 0.303 | −0.21 | 530 | |
| 3 | abs | 361 | 0.557 | −0.34 | 400 |
| em | 601 | 0.124 | 0.27 | 532 | |
| 4 | abs | 366 | 0.433 | −0.29 | 400 |
| em | 605 | 0.134 | 0.20 | 550 | |
| 5 | abs | 365 | 0.481 | −0.31 | 402 |
| em | 611 | 0.152 | 0.29 | 555 | |
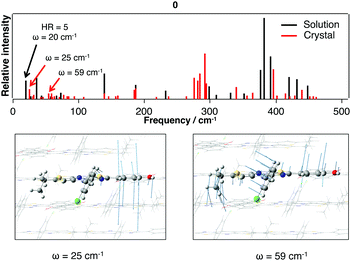 | ||
| Fig. 11 Low-frequency vibrational spectrum (0–500 cm−1) calculated for the S1*(E) structure for 0 in the crystalline phase. Vibrational modes presenting similarities to the mode with a large HR value in solution (Fig. 7 and 8) are given. | ||
We can thus conclude that the ACQ phenomenon arises from the combination of two processes: the energy loss through excitation energy transfers between the molecules in the crystal, as proposed by Huang et al. in their experimental work, and through vibrational motions (rather than intramolecular rotations).
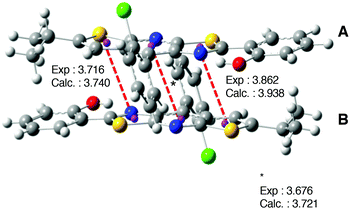 | ||
| Fig. 12 Representation of the packing structure of 1. Distances (in angstroms) between the two monomers are also indicated. The calculated values correspond to the 1-D model. | ||
In Table 7, the comparison of selected optimized geometrical parameters with X-ray crystallographic data shows that the methodology we have used is appropriate to mimic the crystalline structure. Globally, for all the molecules, there is no major difference between the experimental and calculated dihedral angles ϕ and ψ. Our calculation scheme also provides an accurate description of the Cb–Cc bond distance that accounts for the conjugation between the stator and the A-ring. There is small variation of the H-bonding between the Nd atom of the stator and the hydroxyl group: our calculated values are systematically shorter than the experimental ones, with an average underestimation of 0.15 Å. Besides, due to the relative rigidity of the conjugated core (stator and A-ring), the optimized structures in the crystalline phase are slightly modified compared to those in solution.
We have then investigated the absorption spectra of the different systems. For 1, we have considered both the 1-M and 1-D models with respectively the monomer A and the dimer A–B defining the QM region. In going from a monomer chromophore to a dimer system, the brightest state shifts from S1 to S4 as shown in Table 5 but there is no modification of the maximum absorption wavelength (∼360 nm). This finding is in agreement with the experimental data collected in Table 1. For the dimer, the last occupied molecular orbitals that are involved in the main electronic transitions are delocalized on the two chromophores whereas the first low-lying virtual orbitals are localized on the stator and the A-ring moieties of only one molecule (Fig. S9, ESI†). Calculations of the J coupling show that the excitonic coupling is four times smaller than the one calculated for 0. Therefore, one should expect an impact of the excitonic coupling on the non-radiative decay constant but this effect should be less significant than 0.
For the systems i = 3–5, the absorption energies calculated for the different model systems (monomers i-M and dimers i-M) are given in Table SX (ESI†). The value of the J coupling in Table 6 is positive, which might indicate the formation of H-aggregates. More importantly, these values are close to zero. As a consequence, the non-radiative decay constant should not be impacted by the intermolecular interactions for these systems.
For system 2, the excited-state properties of the trimer model 2-T in Table SX (ESI†) combined with the value of the J coupling reveal a more complicated situation with a larger modification of the spectrum compared to the 2-M model (there is a large decrease of the oscillator strength value) and two J coupling values, one positive and one negative.
Finally, the first excited state was optimized for all the molecules and the resulting structures were compared to those obtained in solution. There is no major difference between the ground state and S1*(K) structures except for the proton transfer. Compared to the solvated molecules, there is no rotation of the B-ring upon relaxation on the S1 state. Moreover, contrary to the solution, there is no loss of planarity for 2 upon relaxation on the S1 state.
Calculated emission energies for 1–5 are reported in Table 8. They exhibit either a blue (0.21 eV for 2) or a red (0.07, 0.27, 0.20 and 0.29 for 1, 3, 4, 5 respectively) shift compared to experiments. Even if the ΔEcalc–exp values in the crystal are globally larger than the ones calculated in solution, they remain in the range of values obtained with the approximation that has been made (a central molecule with a frozen crystalline environment) and that are reported in the literature for TD-DFT calculations in molecular crystals.42,43
The low-frequency vibrational mode of the S1*(K) structure has then been investigated. For 1, we have identified one vibrational mode potentially responsible for the non-emissive behavior in solution. However, in the crystalline environment, this vibrational mode could not be identified. As depicted in Fig. S8 (ESI†), the particular packing of 1 leads to strong restrictions of molecular motions previously allowed in solution. Therefore, for 1, there are two opposing phenomena: (i) the small but non-negligible value of the exciton coupling J that should enhance the non-radiative decay rate and (ii) the hindrance in the molecular plane bending motions that should lead to a decrease of the same non-radiative decay rate through reducing the IC rate. This competition is in favor of the second effect thus leading to an enhancement of the PL efficiency: experimentally, Φf increases from 2% to 26% and 1 presents a moderate CIE effect. This conclusion is in agreement with a recent study that has demonstrated that for CIE luminogens, the exciton coupling does not have a major effect on the non-radiative decay rate.14 It can enhance this rate by about 12–33% but does not modify the order of magnitudes of this constant. Finally, one should note that these two competitive effects both arise from the molecular packing of 1 in the crystalline phase. Contrary to the hypotheses of Huang et al.,18 the intramolecular H-bonding is not directly responsible for the increase of the PL efficiency.
In the same vein, we have calculated the vibrational spectrum of S1*(K) for 2–5 and inspected the low-frequency vibrational modes. Due to the crystal packing, the vibrational mode potentially contributing to the energy dissipation in solution is no longer present in the crystal phase. Since the exciton coupling effects are negligible for these systems, this finding can rationalize the observed emission modulation and should explain the strong increase of Φf.
4 Conclusions
We have relied on TD-DFT calculations combined with the QM/QM′ approach to investigate the absorption and emission properties of a series of TTP derivatives in solution and in the crystalline environment. First, by computing the Huang–Rhys factors, we have shown that for all the molecules, the weak PL efficiency in benzene solution is due to the photophysical energy dissipation caused by a low frequency vibrational mode assigned to a bending motion of the TTP stator. Unlike the expected effect, the introduction of intramolecular H-bonding between the stator and the A-ring leads to a stronger fluorescence quenching in benzene solution as observed for molecules 1 and 3–5. This finding can be rationalized by the relative stiffening of the molecular structure and the consecutive increase of the HR factors. Therefore, the strategy that involves rigidifying the arch-bridge-like stator with other rotors through intramolecular H-bonding should be considered with caution since it can promote the energy dissipation through a vibrational motion involving the rigidified stator. The introduction of an electron-withdrawing substituent on the A-ring (molecule 2) counterbalances this effect.In crystals, for molecule 0, the ACQ phenomenon arises from the combination of two processes contributing to the non-radiative decay: (i) the energy loss through excitonic couplings that is due to a particular π–π stacking arrangement and (ii) the energy dissipation during the internal conversion process through the low-frequency vibration mode identified in solution. On the opposite, for the other systems, the crystal environment results in the blocking of this bending vibrational mode. For molecule 1, the non-radiative relaxation pathway through excitonic coupling is also possible and the competition between these two antagonist effects finally leads to a moderate CIE effect. For the other systems, we have demonstrated that the excitonic coupling is negligible and thus rationalized the larger CIE phenomenon observed for 2–5.
Therefore, this study reveals that the combination of adequate theoretical strategies enables a careful investigation of the different photophysical processes at the origin of the ACQ/CIE effects and a qualitative understanding of the experimental observations. The appropriate modeling of the environmental effects is crucial to pave the way towards the development of novel CIE functional materials.
Conflicts of interest
There are no conflicts to declare.Acknowledgements
This work was granted access to the HPC resources of CINES and IDRIS under the allocation 2017-A0010810135 made by GENCI (Grand Equipement National de Calcul Intensif). Dr S. Di Tommaso is acknowledged for helpful scientific discussions.References
- J. Huang, J.-H. Su and H. Tian, J. Mater. Chem., 2012, 22, 10977–10989 RSC.
- Z. Zhao, S. Chen, C. Y. K. Chan, J. W. Y. Lam, C. K. W. Jim, P. Lu, Z. Chang, H. S. Kwok, H. Qiu and B. Z. Tang, Chem. – Asian J., 2012, 7, 484–488 CrossRef CAS.
- J. Huang, N. Sun, J. Yang, R. Tang, Q. Li, D. Ma and Z. Li, Adv. Funct. Mater., 2014, 24, 7645–7654 CrossRef CAS.
- C. Dimitrakopoulos and P. Malenfant, Adv. Mater., 2002, 14, 99–117 CrossRef CAS.
- J. B. Birks, Photophysics of aromatic molecules, Wiley, London, 1970, vol. 74 Search PubMed.
- B. Fu, J. Huang, D. Bai, Y. Xie, Y. Wang, S. Wang and X. Zhou, Chem. Commun., 2015, 51, 16960–16963 RSC.
- M. G. Mohamed, F.-H. Lu, J.-L. Hong and S.-W. Kuo, Polym. Chem., 2015, 6, 6340–6350 RSC.
- J. Luo, Z. Xie, J. W. Y. Lam, L. Cheng, H. Chen, C. Qiu, H. S. Kwok, X. Zhan, Y. Liu, D. Zhu and B. Z. Tang, Chem. Commun., 2001, 1740–1741 RSC.
- J. Mei, N. L. C. Leung, R. T. K. Kwok, J. W. Y. Lam and B. Z. Tang, Chem. Rev., 2015, 115, 11718–11940 CrossRef CAS.
- Y. Hong, J. W. Y. Lam and B. Z. Tang, Chem. Soc. Rev., 2011, 40, 5361–5388 RSC.
- J. Mei, Y. Hong, J. W. Y. Lam, A. Qin, Y. Tang and B. Z. Tang, Adv. Mater., 2014, 26, 5429–5479 CrossRef CAS.
- M.-C. Li, M. Hayashi and S.-H. Lin, J. Phys. Chem. A, 2011, 115, 14531–14538 CrossRef CAS.
- Q. Wu, Q. Peng, Y. Niu, X. Gao and Z. Shuai, J. Phys. Chem. A, 2012, 116, 3881–3888 CrossRef CAS.
- Y.-C. Duan, Y. Wu, J.-L. Jin, D.-M. Gu, Y. Geng, M. Zhang and Z.-M. Su, ChemPhysChem, 2017, 18, 755–762 CrossRef CAS.
- A. Prlj, N. Doslic and C. Corminboeuf, Phys. Chem. Chem. Phys., 2016, 18, 11606–11609 RSC.
- L. Le Bras, C. Adamo and A. Perrier, J. Phys. Chem. C, 2017, 121, 25603–25616 CrossRef CAS.
- M. Huang, R. Yu, K. Xu, S. Ye, S. Kuang, X. Zhu and Y. Wan, Chem. Sci., 2016, 7, 4485–4491 RSC.
- M. Huang, S. Ye, K. Xu, J. Zhou, J. Liu, X. Zhu and Y. Wan, J. Mater. Chem. C, 2017, 5, 3456–3460 RSC.
- H. Zhang and Y. Wang, in Supramolecular Structure and Aggregation-Induced Emission, ed. A. Quin and B. Z. Tang, Wiley-Blackwell, 2014, pp. 205–231 Search PubMed.
- M. J. Frisch, G. W. Trucks, H. B. Schlegel, G. E. Scuseria, M. A. Robb, J. R. Cheeseman, G. Scalmani, V. Barone, B. Mennucci, G. A. Petersson, H. Nakatsuji, M. Caricato, X. Li, H. P. Hratchian, A. F. Izmaylov, J. Bloino, G. Zheng, J. L. Sonnenberg, M. Hada, M. Ehara, K. Toyota, R. Fukuda, J. Hasegawa, M. Ishida, T. Nakajima, Y. Honda, O. Kitao, H. Nakai, T. Vreven, J. A. Montgomery, Jr., J. E. Peralta, F. Ogliaro, M. Bearpark, J. J. Heyd, E. Brothers, K. N. Kudin, V. N. Staroverov, R. Kobayashi, J. Normand, K. Raghavachari, A. Rendell, J. C. Burant, S. S. Iyengar, J. Tomasi, M. Cossi, N. Rega, J. M. Millam, M. Klene, J. E. Knox, J. B. Cross, V. Bakken, C. Adamo, J. Jaramillo, R. Gomperts, R. E. Stratmann, O. Yazyev, A. J. Austin, R. Cammi, C. Pomelli, J. W. Ochterski, R. L. Martin, K. Morokuma, V. G. Zakrzewski, G. A. Voth, P. Salvador, J. J. Dannenberg, S. Dapprich, A. D. Daniels, A. Farkas, J. B. Foresman, J. V. Ortiz, J. Cioslowski and D. J. Fox, Gaussian Development Version, Revision H.32, Gaussian, Inc., Wallingford CT, 2010 Search PubMed.
- M. J. Frisch, G. W. Trucks, H. B. Schlegel, G. E. Scuseria, M. A. Robb, J. R. Cheeseman, G. Scalmani, V. Barone, G. A. Petersson, H. Nakatsuji, X. Li, M. Caricato, A. V. Marenich, J. Bloino, B. G. Janesko, R. Gomperts, B. Mennucci, H. P. Hratchian, J. V. Ortiz, A. F. Izmaylov, J. L. Sonnenberg, D. Williams-Young, F. Ding, F. Lipparini, F. Egidi, J. Goings, B. Peng, A. Petrone, T. Henderson, D. Ranasinghe, V. G. Zakrzewski, J. Gao, N. Rega, G. Zheng, W. Liang, M. Hada, M. Ehara, K. Toyota, R. Fukuda, J. Hasegawa, M. Ishida, T. Nakajima, Y. Honda, O. Kitao, H. Nakai, T. Vreven, K. Throssell, J. A. Montgomery, Jr., J. E. Peralta, F. Ogliaro, M. J. Bearpark, J. J. Heyd, E. N. Brothers, K. N. Kudin, V. N. Staroverov, T. A. Keith, R. Kobayashi, J. Normand, K. Raghavachari, A. P. Rendell, J. C. Burant, S. S. Iyengar, J. Tomasi, M. Cossi, J. M. Millam, M. Klene, C. Adamo, R. Cammi, J. W. Ochterski, R. L. Martin, K. Morokuma, O. Farkas, J. B. Foresman and D. J. Fox, Gaussian 16 Revision A.03, Gaussian Inc., Wallingford CT, 2016 Search PubMed.
- C. Adamo and V. Barone, J. Chem. Phys., 1999, 110, 6158–6170 CrossRef CAS.
- P. J. Stephens, F. J. Devlin, C. F. Chabalowski and M. J. Frisch, J. Phys. Chem., 1994, 98, 11623–11627 CrossRef CAS.
- T. Yanai, D. P. Tew and N. C. Handy, Chem. Phys. Lett., 2004, 393, 51–57 CrossRef CAS.
- C. Peng, P. Y. Ayala, H. B. Schlegel and M. J. Frisch, J. Comput. Chem., 1996, 17, 49–56 CrossRef CAS.
- J. Tomasi, B. Mennucci and R. Cammi, Chem. Rev., 2005, 105, 2999–3094 CrossRef CAS PubMed.
- R. S. Sánchez-Carrera, M. C. R. Delgado, C. C. Ferrón, R. M. Osuna, V. Hernández, J. T. L. Navarrete and A. Aspuru-Guzik, Org. Electron., 2010, 11, 1701–1712 CrossRef.
- H. P. Hratchian, P. V. Parandekar, K. Raghavachari, M. J. Frisch and T. Vreven, J. Chem. Phys., 2008, 128, 034107 CrossRef.
- D. Presti, F. Labat, A. Pedone, M. J. Frisch, H. P. Hratchian, I. Ciofini, M. C. Menziani and C. Adamo, J. Chem. Theory Comput., 2014, 10, 5577–5585 CrossRef CAS.
- D. Presti, L. Wilbraham, C. Targa, F. Labat, A. Pedone, M. C. Menziani, I. Ciofini and C. Adamo, J. Phys. Chem. C, 2017, 121, 5747–5752 CrossRef CAS.
- L. Wilbraham, C. Adamo, F. Labat and I. Ciofini, J. Chem. Theory Comput., 2016, 12, 3316–3324 CrossRef CAS.
- C. Curutchet and B. Mennucci, J. Am. Chem. Soc., 2005, 127, 16733–16744 CrossRef CAS PubMed.
- V. Russo, C. Curutchet and B. Mennucci, J. Phys. Chem. B, 2007, 111, 853–863 CrossRef CAS PubMed.
- V. S. Padalkar and S. Seki, Chem. Soc. Rev., 2016, 45, 169–202 RSC.
- V. S. Padalkar and S. Seki, Bull. Korean Chem. Soc., 2013, 34, 465–469 CrossRef.
- M. Dommett, M. Rivera and R. Crespo-Otero, J. Phys. Chem. Lett., 2017, 8, 6148–6153 CrossRef CAS.
- L. Lin, J. Fan, L. Cai and C.-K. Wang, RSC Adv., 2017, 7, 44089–44096 RSC.
- S. Ruiz-Barragan, K. Morokuma and L. Blancafort, J. Chem. Theory Comput., 2015, 11, 1585–1594 CrossRef CAS.
- N. J. Hestand and F. C. Spano, Acc. Chem. Res., 2017, 50, 341–350 CrossRef CAS.
- M. Kasha, H. R. Rawls and A. M. El-Bayoumi, Pure Appl. Chem., 1965, 11, 371–392 CAS.
- W. Li, L. Zhu, Q. Shi, J. Ren, Q. Peng and Z. Shuai, Chem. Phys. Lett., 2017, 683, 507–514 CrossRef CAS.
- B. Wang, X. Wang, W. Wang and F. Liu, J. Phys. Chem. C, 2016, 120, 21850–21857 CrossRef CAS.
- Q. Wu, T. Zhang, Q. Peng, D. Wang and Z. Shuai, Phys. Chem. Chem. Phys., 2014, 16, 5545–5552 RSC.
Footnote |
| † Electronic supplementary information (ESI) available: Choice of the XC functional, selected molecular orbitals; frequencies and HR factors; packing structures in single crystals. See DOI: 10.1039/c8cp04730h |
| This journal is © the Owner Societies 2019 |

