
 Open Access Article
 This Open Access Article is licensed under a Creative Commons Attribution-Non Commercial 3.0 Unported Licence
Understanding water interactions with organic surfaces: environmental molecular beam and molecular dynamics studies of the water–butanol system
Sofia M.
Johansson
 a,
Josip
Lovrić
ab,
Xiangrui
Kong
a,
Erik S.
Thomson
a,
Panos
Papagiannakopoulos
ac,
Stéphane
Briquez
b,
Céline
Toubin
b and
Jan B. C.
Pettersson
*a
a,
Josip
Lovrić
ab,
Xiangrui
Kong
a,
Erik S.
Thomson
a,
Panos
Papagiannakopoulos
ac,
Stéphane
Briquez
b,
Céline
Toubin
b and
Jan B. C.
Pettersson
*a
aDepartment of Chemistry and Molecular Biology, Atmospheric Science, University of Gothenburg, SE-412 96 Gothenburg, Sweden. E-mail: janp@chem.gu.se
bPhLAM Laboratory, UMR CNRS 8523, Université de Lille, Villeneuve d’Ascq, France
cDepartment of Chemistry, Laboratory of Photochemistry and Kinetics, University of Crete, GR-71 003 Heraklion, Greece
First published on 20th December 2018
Abstract
The interactions between water molecules and condensed n-butanol surfaces are investigated at temperatures from 160 to 240 K using the environmental molecular beam experimental method and complementary molecular dynamics (MD) simulations. In the experiments hyperthermal water molecules are directed onto a condensed n-butanol layer and the flux from the surface is detected in different directions. A small fraction of the water molecules scatters inelastically from the surface while losing 60–90% of their initial kinetic energy in collisions, and the angular distributions of these molecules are broad for both solid and liquid surfaces. The majority of the impinging water molecules are thermalized and trapped on the surface, while subsequent desorption is governed by two different processes: one where molecules bind briefly to the surface (residence time τ < 10 μs), and another where the molecules trap for a longer time τ = 0.8–2.0 ms before desorbing. Water molecules trapped on a liquid n-butanol surface are substantially less likely to escape from the surface compared to a solid layer. The MD calculations provide detialed insight into surface melting, adsorption, absorption and desorption processes. Calculated angular distributions and kinetic energy of emitted water molecules agree well with the experimental data. In spite of its hydrophobic tail and enhanced surface organization below the melting temperature, butanol's hydrophilic functional groups are concluded to be surprisingly accessible to adsorbed water molecules; a finding that may be explained by rapid diffusion of water away from hydrophobic surface structures towards more strongly bound conformational structures.
1. Introduction
Aerosols and clouds are known to play important roles in the atmospheric system, but the scientific understanding of the associated processes is incomplete, leading to major uncertainties in climate predictions.1 An important contributor to the poor understanding is a lack of molecular level descriptions of heterogeneous chemical reactions and physical transformations that occur in the atmosphere's complex multiphase environment. Interface phenomena are an area of particular interest because of their central role for the chemistry and physics of the atmosphere.2 Processes on the surfaces of liquid or solid particles influence the atmospheric distribution of reactive gases and thereby affect several atmospheric phenomena. Uptake of water and other trace gases also modifies the physical properties of particles including their size, optical properties, and ability to nucleate cloud droplets and ice. Here, we focus on a molecular-level description of the surface character and processes associated with water impinging on an interface with an organic material.Organic compounds are abundant and undergo oxidation in the atmosphere resulting in the formation of secondary organic aerosols (SOA) and coatings on existing particles.3 Organic surface films can reduce the critical supersaturation required for cloud droplet activation by reducing the droplet surface tension.4 Organic compounds may also present a barrier to gas-aerosol mass transport that reduces uptake of water and other trace gases.5 In addition, surface properties affect heterogeneous chemistry6 and ice nucleation.7 However, we currently lack sufficient knowledge to make reliable predictions for many of these processes in ambient aerosols. This is partly due to the complexity of the organic fraction that potentially involves thousands of compounds, and to missing data from, for example, the phase behavior and surface-bulk partitioning in both model systems and naturally occurring organics.
The detailed conditions at gas–liquid and gas–solid organic interfaces of atmospheric interest are particularly unclear. Earlier studies have highlighted the surface structure and dynamic nature of organic surface layers using experimental techniques including nonlinear Raman spectroscopy,8 sum frequency generation,9 and neutron scattering.10 Molecular dynamics (MD) simulations have been used to study the effect of organic coatings on water uptake by aqueous droplets11,12 and ice,13 and to investigate accommodation of organic compounds on their respective condensed phases.14 A few experimental molecular beam studies have been carried out including investigations of the effect of adsorbed alcohols on water uptake by sulfuric acid.15 Likewise, environmental molecular beam (EMB) studies have provided an improved understanding of water interactions with more volatile organic phases.16–18 Exploratory studies of alcohols, acetic acid and nopinone show limited water uptake on solid phases, but a strong enhancement on liquid phases. Intriguingly, water accommodation on n-butanol changes rapidly with temperature near the melting point, which indicates that the surface layer has unique properties that deviate substantially from the bulk.17
Here we present results from a combined experimental and theoretical study of water interactions with n-butanol surfaces in the temperature interval from 160 to 240 K. The overall aim is to characterize the detailed collision dynamics and processes governing accommodation of water molecules. n-Butanol has a melting point of 184.5 K,19 and the investigations thus include both liquid and solid surfaces at temperatures near the melting point. An updated EMB method with angular resolution is employed, which allows us to investigate the dynamics of surface processes in greater detail compared to an earlier EMB study where measurements were restricted to a single scattering angle.17 Results from earlier EMB experiments are re-analyzed and compared with the present data. In addition, MD simulations are performed to elucidate the mechanisms of the interactions providing a more detailed molecular level understanding of the system. The relevance of the results for the description of water interactions with organic surfaces of environmental interest is discussed.
2. Experimental
2.1 Environmental molecular beam experiments
The EMB technique has been described in detail elsewhere,20,21 and is only briefly presented here. The EMB apparatus consists of a multi-chamber high-vacuum system and the main components of the experimental setup are illustrated in Fig. 1. A low-density flow of molecules is introduced into the vacuum system via a pulsed gas source. The gas consists of a He:D2O mixture with a total pressure of 1.2 × 10⁵ Pa and a partial D2O pressure of 2.3 × 10³ Pa. Deuterium oxide (D2O 99.9%, Sigma-Aldrich Co.) is used instead of H2O to improve the signal to noise ratio in the experiments. The gas is allowed to expand into vacuum and part of the molecular flow is selected in space and time using a skimmer and a rotating chopper that is frequency locked to the 60 Hz beam source.20,21 This generates a pulsed directed low-density flow of D2O molecules with a kinetic energy of 0.29 ± 0.01 eV. The molecular beam flow is directed through a series of high-vacuum chambers and targeted on a temperature-controlled substrate surface situated inside an environmental chamber. A 10 × 10 mm2 grating serves as an interface between the environmental chamber and the surrounding ultra-high vacuum system, and enables the molecular beam to enter and exit the environmental chamber.21 A highly oriented pyrolytic graphite crystal (grade ZYB, 4 × 4 mm2, Advanced Ceramics Corp.) is used as the surface substrate. It is positioned 1.6 mm behind the grating and the beam collides with the substrate at an incident angle of 43° with respect to the surface normal direction. | ||
| Fig. 1 A schematic view of the main components in the EMB apparatus. At the left the molecular beam source, skimmer, and rotating chopper are shown. The environmental chamber is centered, with the grated opening and graphite substrate inside. To the right the QMS is displayed with the ionization source, focusing lenses and quadrupole. Volatile compounds may be introduced through gas inlets in the bottom of the environmental chamber. The incident and reflected molecular beam is marked as a blue dashed line, and the laser beam is visualized as a red dashed line. The entire system is enclosed within a series of differentially pumped UHV chambers. | ||
n-Butanol vapor is introduced into the environmental chamber via a gas inlet and is allowed to condense on the temperature-controlled graphite surface. The experimental setup has been designed to reduce the path length of the molecular beam within the environmental chamber to 4.4 mm, in order to limit attenuating collisions between the beam molecules and the background gas within the chamber.21 The formation and maintenance of a condensed n-butanol layer on the substrate is monitored by probing the surface with a laser (670 nm, 860 μW). The laser is directed at the surface with an incident angle of 3° and a photodiode detects the change in reflected intensity due to constructive and destructive interference caused by reflections from the graphite–butanol and butanol–gas interfaces as the condensed layer grows on the graphite surface.22 A fresh n-butanol layer is produced for each experiment and maintained at a thickness of 1 μm, while between experimental days the substrate is cleaned by heating the surface to 600 K for at least 10 h. The incident molecular beam, as well as the molecular flux escaping from the surface is detected using a rotatable quadrupole mass spectrometer (QMS) positioned outside the environmental chamber. The emitted flux is measured for 10 ms intervals after each molecular beam pulse impacts the experimental surface.
2.2 Analysis of EMB data
In order to quantify the experimental results a nonlinear least-squares fitting procedure is used to quantify the measured time dependent flux. A convolution of velocity distributions is found to arise from inelastic scattering (IS), and thermal desorption (TD) of water molecules. Here we observe that the TD of water molecules is best explained by two different desorption processes. This is in contrast to earlier EMB studies for the same system where velocity distributions for one IS and one TD component were sufficient to describe the data determined in a single scattering direction.17 However, to quantitatively describe the desorbed flux over a wide angular range, as described in Section 3, a combination of two TD components referred to as fast (TDfast) and slow (TDslow) thermal desorption are required.The fraction of molecules that scatter inelastically from the surface is described by a velocity distribution:23
 | (1) |
![[small upsilon, Greek, macron]](https://www.rsc.org/images/entities/i_char_e0d5.gif) is the average velocity. υIS is the velocity of the inelastic scattering component,
is the average velocity. υIS is the velocity of the inelastic scattering component, | (2) |
Fast and slow thermal desorption of D2O molecules are both characterized by the convolution of two decay functions describing the velocity distribution of desorbing molecules and the desorption kinetics. The TD velocity distribution is given by,
 | (3) |
ITD_i = Ci![[thin space (1/6-em)]](https://www.rsc.org/images/entities/char_2009.gif) exp(−kit), exp(−kit), | (4) |
As described later in Section 3, the experimental results are consistent with a TDfast process that is too fast to be resolved in the present experiments and the rate coefficient kfast is therefore set to a fixed value of 105 s−1, which corresponds to the 10 μs resolution in the experimental studies. Assuming any other fixed value in the range 105–109 s−1 does not affect the presented results.
The remaining six parameters Ca, Cfast, Cslow, , TIS, and kslow are used as free fitting parameters in the analysis of experimental data. The first three parameters determine the amplitude of the distributions related to IS, TDfast and TDslow. The TDfast distribution has a fixed shape in the analysis (since kfast is specified), the shape of the TDslow distribution is modified by kslow, while the IS distribution is modified by and TIS. As described in Section 3 the freedom of the parameters is constrained by what they physically represent, which helps to produce numerically robust separation of the three components.
The absolute trapping probability PTD_i can be determined by comparing the integrated intensity of thermally desorbed D2O molecules from the n-butanol surface IBuOHTD_i to desorption from bare graphite IgraphiteTD, which has a known sticking coefficient Sgraphite = 0.73 ± 0.07:24
 | (5) |
 | (6) |
2.3 Molecular dynamics simulations
Complementary MD simulations have been performed to characterize water interactions with solid and liquid n-butanol surfaces. An improved version of the OPLS-AA force field25 was employed to model a n-butanol system. The force field differs from the standard OPLS-AA force field26 in the parameterization of the dihedral interactions that has been adjusted on the basis of ab initio calculations.25 The equations of motion are integrated using the leap-frog algorithm27 with the GROMACS package.28 All bonds are constrained with the LINCS algorithm29 enabling the use of a 2 fs time step. A cut off distance of 1.4 nm is applied for the short-range interactions, and long-range electrostatic interactions are treated using the particle mesh Ewald method.30 Temperature is held at the desired value using the V-rescale algorithm31 with a coupling time of 0.1 ps.The n-butanol crystal lattice is built based on the structure characterized by Raman spectroscopy and X-ray diffraction by Derollez et al.32 An infinite crystal is created by duplicating the unit cell in x, y, and z directions. After minimization with the steepest descent algorithm, the crystal is equilibrated in the NPT ensemble at 150 K for 10 ns. The simulation system consists of ∼15000 atoms placed in triclinic box stretched by a, b, c vectors sized 4.7 × 5.1 × 5.2 nm with angles 79.03°, 75.76° and 78.83° for α, β and γ respectively. Once prepared, the slab is created considering the most energetically favorable structure, thus the crystal is cut between two n-butanol bilayers as further described in Section 3.2. The simulation box is then extended to 2 nm along the z direction on each side to avoid image interactions between the slabs.
The n-butanol slab is gradually heated from 150 K to 240 K by performing simulated annealing in the NVT ensemble over 200 ns. After producing the n-butanol crystal and liquid slab at different temperatures, water interactions with the n-butanol surface are studied at temperatures ranging from 170 to 240 K. Simulations are designed to resemble the experimental conditions. Water is modeled with the SPC/E model,33 where the choice of potential is motivated by previous work on carbohydrate interactions with water.34 Single water molecules are sent towards the surface with an incident kinetic energy equal to 0.29 ± 0.01 eV (1760 ± 270 m s−1) and with an incident angle of 45° with respect to the surface normal direction. Water molecules are decoupled from the thermostat to avoid influencing collision dynamics. The initial x, y positions of water molecules are randomly chosen at a distance of 1 nm from the surface and 5000 trajectories are propagated at each studied surface temperature.
3. Results
3.1 Results from EMB experiments
We have employed the EMB method to study molecular level interactions between D2O and n-butanol surfaces from 160 to 200 K. In Fig. 2 measured time-of-flight (TOF) distributions are presented for the incident D2O beam and for the flux from a solid n-butanol surface at 179 K, for four different scattering angles θs. The beam and the scattered flux travel the same path length to the detector, and thus the distribution for the incident beam corresponds to hypothetical elastic scattering from the butanol surface. As expected the TOF distributions are shifted in time compared to the incident beam, which indicates that molecules lose energy in surface contact. The tail of the TOF distribution is well described by the distributions for a TDslow component representing molecules that are trapped on the surface and subsequently desorb on a millisecond time scale (see eqn (3) and (4)). The remaining reflected flux is well described by an IS and a TDfast component. The results for θs = 53° (Fig. 2d) clearly illustrate that part of the emitted flux results from IS because thermal desorption (TDfast) cannot reproduce the observed TOF data for times ≲0.75 ms. On the other hand, the results for backward scattering (Fig. 2a, θs = −17°) can be completely described by a combination of TDfast and TDslow components, without the need for an IS component. Overall, we observe that a combination of IS and two desorption processes provides the most accurate description of the TOF data, with the fewest assumptions, for all scattering angles. In an earlier EMB study of the D2O/n-butanol system,17 TOF distributions were only measured in the specular scattering direction and fitted using a combination of one IS and a single TD component. The application of a similar two-component fit to the angular resolved data presented here results in unphysical or underdetermined data fitting curves. In particular at times ≲0.75 ms where IS dominates, the three-component solution significantly clarifies the underlying physical processes. | ||
| Fig. 2 TOF intensities of the emitted D2O flux from a solid n-butanol surface at 179 K, for scattering angles θs (a) −17°, (b) 3°, (c) 43°, (d) 53°, in addition to (e) the incident beam profile. Experimental intensities (black circles) are smoothened by a 70 microsecond centered moving average with the calculated non-linear least squares total fit (black line) deconvoluted into its individual IS, TDfast, and TDslow components (blue, red, and grey lines respectively). The D2O beam is targeted at the surface with an incident angle of 43°, and with an incident kinetic energy of 0.29 eV. | ||
The TOF distributions observed for different scattering angles are integrated to calculate the absolute IS, TDfast, and TDslow intensities. Fig. 3 shows the angular resolved intensities for IS, TDfast, and TDslow for the n-butanol surface temperatures 179, 185 and 196 K. The melting temperature of bulk n-butanol is 184.5 K, thus the n-butanol layer is solid at 179 K, liquid at 196 K, and close to its melting temperature at 185 K. The angular distributions of the TDslow and TDfast components are well described by wide cosine-like distributions, confirming that they are related to TD processes where molecules desorb independent of their incident trajectory. The absolute intensity of the two TD components varies with Tsurf, and the TDfast channel decreases slightly as the temperature is increased. The TDslow component also decreases when the temperature is raised from 179 to 185 K and eventually completely disappears at temperatures above 191 K, in agreement with earlier work.17
 | ||
| Fig. 3 Angular distribution and polar plots of the integrated intensities of IS (blue triangles), TDfast, and TDslow components (red and grey dots respectively) of D2O flux from a n-butanol surface at the indicated Tsurf temperatures. The IS component has been multiplied by a factor of 10, 3 and 1 in (a), (b) and (c) respectively to increase trend visibility. Least squares fittings of cosine functions to the modeled desorption (red and grey dashed lines) and similar scaled sinusoid fittings to the modeled IS (blue lines) have been added to illustrate the classic behavior of thermal desorption and scattering. | ||
Inelastically scattered molecules account for a small fraction of the flux from the n-butanol surface, and to enhance visibility in Fig. 3a and b the IS component is multiplied by factors of 10 and 3, respectively. The absolute IS intensity is similar at each of the three temperatures displayed in Fig. 3, but the shape of the angular distribution changes depending on surface temperature and structure. The IS distribution observed for a solid n-butanol layer at 179 K has a relatively wide angular distribution with a maximum around the specular angle (Fig. 3a). The IS distribution becomes narrower at the melting point (Fig. 3b), and the distribution peaks at a slightly larger angle than the angle of specular reflection, with respect to the surface normal. The transition to a liquid surface again results in a broader IS distribution (Fig. 3c), as may be expected for a disordered liquid layer.
The IS component in the TOF distributions is shifted to longer times compared to the incident beam profile (see Fig. 2), which indicates that the scattered molecules lose kinetic energy to surface modes during inelastic collisions with the surface. Fig. 4 shows the fraction of the incident kinetic energy that is retained by inelastically scattered molecules after surface contact. The final kinetic energy is typically 10–40% of the kinetic energy in the incident molecular beam, and the kinetic energy increases with increasing scattering angle. Molecules colliding with a solid surface also appear to leave the surface with more kinetic energy than those colliding with a liquid surface indicating that the detailed surface properties influence the collision dynamics.
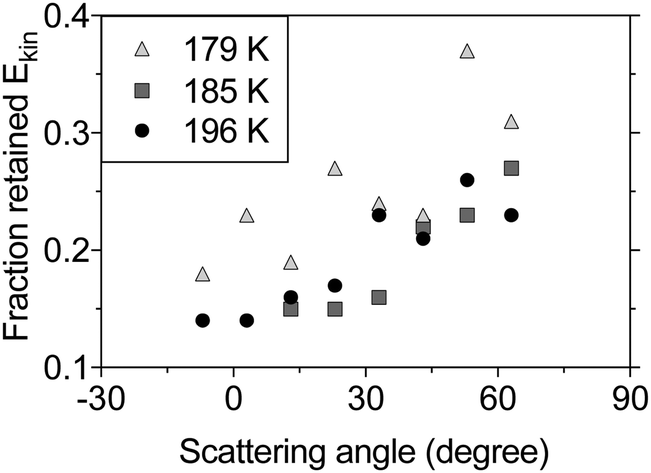 | ||
| Fig. 4 The fraction of retained kinetic energy for inelastically scattered molecules from n-butanol at surface temperatures 179 K (light gray triangles), 185 K (dark gray squares) and 196 K (black circles) as a function of scattering angle. The incident kinetic energy for the beam molecules is 0.29 eV before it collides with the surface at an incident angle of 43° in respect to the surface normal. | ||
The fits of TOF distributions also provide desorption rate coefficients for water desorption from n-butanol. The fast TD process has a desorption rate coefficient k ≥ 105 s−1, which always exceeds the fastest time resolution of the EMB experiments. The rate coefficient for the TDslow process is resolved and increases from 700 to 1300 s−1 with increasing temperature from 160 to 182 K. At higher temperatures the rate coefficient decreases to approximately 500 s−1 before the TDslow component ultimately disappears above 191 K. The observed desorption rate coefficients including the decline in rate coefficient with increasing temperature above 182 K are consistent with results from earlier EMB studies of the D2O/n-butanol system.17
The observed desorption rate coefficients can be used to estimate the activation energies for water on the different n-butanol surfaces by assuming that the thermal desorption process follows Arrhenius behavior, as given by,
 | (7) |
To complement the current study, TOF data from an earlier EMB study17 has been reanalyzed using the three-component fit (IS + TDfast + TDslow) employed here. Fig. 5 summarizes the combined results from the present and the earlier study. The IS component accounts for less than 6 ± 2% of the surface flux and does not vary significantly with surface temperature. Fast desorption (TDfast) is also observed for all temperatures from 160 to 200 K. The intensity of the TDfast component increases with increasing temperature below 170 K, followed by a significant decrease above 175 K as the temperature approaches and crosses the melting point. The effect of temperature on the TDslow component is even more pronounced. The slow desorption dominates for solid n-butanol below 183 K, but rapidly decreases as the layer melts and above 191 K the signal disappears entirely. Above the melting point, a major fraction of the incident water (55–85%) remains on the n-butanol layer beyond the timescale of the experiments (>10 ms).
 | ||
| Fig. 5 The fate of D2O molecules on a n-butanol surface for a range of temperatures. Molecules will undergo surface accommodation (light grey), fast, or slow thermal desorption (red and grey areas, respectively), or inelastic scattering (blue area) with probabilities that vary with temperature. The present experimental results for PTDslow (grey-filled dots), PTDfast (red-filled dots), and PIS (blue triangles) are shown with 95% confidence intervals and superimposed onto the re-analyzed results from the previous study by Papagiannakopoulos et al.17 shown using the shaded regions where the angle of observation was 45°. The bulk melting point is indicated with the black dotted line. | ||
3.2 Results from MD simulations
Classical MD simulations have been used to obtain detailed information about the interactions between water molecules and condensed n-butanol under conditions that mimic the EMB experiments. The crystal is characterized by intermolecular H-bonding between OH– moieties and hydrocarbon chains respectively. Structural changes resulting in substantial disordering were observed during the heating process indicating that melting occurs between 190 and 200 K, in fair agreement with the experimental melting point of 184.5 K.19 Snapshots of equilibrated configurations at three different temperatures and corresponding density profiles of the n-butanol oxygen are shown in Fig. 6. At T = 170 K, the slab has a well-ordered crystalline structure consisting of tilted butanol bilayers where n-butanol OH-groups form relatively strong hydrogen bonds within each bilayer. The interface is dominated by the hydrocarbon tails in the upper-most bilayer and the surface has a hydrophobic character. One can expect that the closed packed structure of the solid n-butanol slab may prevent impinging water molecules from penetrating into the organic film, which results in a trapping–desorption process of water molecules on-top of the surface layer. Upon heating to 200 K, the slab starts to melt, layers are still distinguishable as can be seen in the density profile (Fig. 6b), but broadening of the peaks indicate substantial disordering occurring within the film. At 240 K (Fig. 6c), complete disorder of the n-butanol molecules is achieved, allowing water molecules to rapidly find strongly bound sites either on the surface or within the n-butanol layers. Although 240 K is high compared to the temperatures accessible experimentally, it corresponds to conditions characteristic of a liquid interface. Thus, 170 K, 200 K and 240 K are used in the simulations to model a solid, melting and liquid organic film respectively. | ||
| Fig. 6 Snapshots of the n-butanol crystal with an impinging water molecule (white and red balls) extracted from MD simulations at T = 170, 200 and 240 K from top to bottom, with associated calculated densities of oxygen atoms in the n-butanol molecule for the respective system. | ||
Collisions between water molecules and n-butanol result in IS, rapid TD, and sticking on the 100 ps time scale of the simulations. Fig. 7 displays simulated angular resolved distributions of water desorption and scattering intensities (panels a–c) and the fraction of retained kinetic energy (d–f) by inelastically scattered molecules from a solid (a and d), melting (b and e) and liquid (c and f) butanol surface. The contributions from IS and TD are separated based on the assumptions that the angular-resolved TD intensity can be described by a cosine distribution and IS in the backward direction can be ignored. The total flux shown in grey is fitted with a TD component (cosθs) scaled to the intensity over negative angles. The IS distribution is generated by subtracting the TD component from the total flux. The resulting angular distributions for the IS channels are broad and reaching maxima at angles larger than the angle of specular reflection for the incident beam. This agrees with the EMB experimental results, indicating that independent of the state of the surface (rough solid or disordered liquid) molecules scatter in a wide range of directions. In agreement with the experimental observations, the simulated IS molecules lose between 50 and 90% of their incident kinetic energy in the collisions with the n-butanol surface. The magnitude of the loss depends on scattering direction, with molecules scattered at wide angles retaining more energy than those scattered close to the surface normal direction, which also agrees well with the experimental results.
 | ||
| Fig. 7 The left column displays angular distributions of simulated total flux (grey blocks) exiting from a (a) solid, (b) melting and (c) liquid n-butanol slab. The curves represent TD (red line) and IS (blue line) components fitted to the simulated flux. Plotted in the right column is the simulated total fraction of retained kinetic energy for molecules scattered inelastically from a (d) solid, (e) melting and (f) liquid n-butanol slab. Experimental results for total intensity and kinetic energy of the IS component are displayed as black diamonds. | ||
Fig. 8a shows the residence time of molecules that escape the simulation box by IS or TD during the initial 50 ps of the 100 ps long simulations. The majority of escaping molecules leave within the first 30 ps, and desorption events are thereafter rare. There is a significant shift in residence time for molecules leaving the liquid surface (240 K) compared to the surfaces at lower temperatures. The majority of molecules escape earlier from a liquid surface than from a solid surface. The total fraction of water molecules leaving the surface within 100 ps is 36, 50 and 36% at 170, 200 and 240 K, respectively.
 | ||
| Fig. 8 Normalized probability distributions from MD calculations of (a) the residence time for water molecule in the simulation box and (b) the average binding energy between accommodated water molecules and n-butanol molecules in the slab. The different lines represent probabilities at surface temperatures of 170 K (blue), 200 K (grey), and 240 K (red). | ||
The binding energy of water molecules that remain trapped on the n-butanol slab at the end of the MD simulations provides additional information about the character of the water–surface interactions. Fig. 8b shows the binding energy distribution for water molecules that bind to the surface after 100 ps. At low temperature, the interactions are dominated by binding energies of −40 to −30 kJ mol−1 corresponding to the formation of 1–2 hydrogen bonds between water and the n-butanol film. A broad distribution between −90 and −50 kJ mol−1 are also present, and this signature is more pronounced at high temperatures.
Simulations indicate that water molecules remain in the upper-most layer of a solid slab and bind weakly to two n-butanol molecules, whereas water manages to diffuse deeper into a liquid slab. As a result, water bind more strongly to liquid n-butanol, forming between two and four hydrogen bonds. This is illustrated in Fig. 9, which shows snapshots of the orientation of the water molecule and nearest n-butanol molecules on both a solid and liquid surface. Thus the simulated trend (seen in Fig. 8b) of stronger binding energies with increasing surface temperature are related to surface and bulk melting, whereby water molecules are able to bind more efficiently with liquid-like layers as a consequence of changes in the n-butanol structure that favors diffusion and enhanced kinetics.
 | ||
| Fig. 9 Snapshots of water molecules surrounded by n-butanol molecules extracted from MD simulations for a n-butanol slab kept at (a) 170 K and (b) 240 K. Distances between the oxygen and hydrogen atoms participating in hydrogen bonds are displayed in black with values given in Ångström. | ||
4. Discussion
The experiments and simulations confirm that water collisions with n-butanol surfaces are characterized by efficient energy transfer, and thermal accommodation is a dominant outcome of surface collisions. When hyperthermal molecules collide with the surface, as in the present study (Ekin,initial = 0.29 ± 0.01 eV), a minor fraction is scattered inelastically, and thus the experimental results provide information about the detailed gas–surface interactions and surface properties of the condensed phase. Water molecules that scatter from the surface are observed to leave with 10–40% of their incident kinetic energy, a result that agrees well with MD simulations and with earlier EMB studies of water interactions with organic surfaces.16–18,36Angular distributions of the scattered intensity and kinetic energy provide additional information about the water–surface interactions. The angular distributions for IS are broad for both liquid and solid n-butanol, while the results are consistent with a smoother surface near the melting point. Earlier EMB experiments using n-butanol surfaces indicate that the surface properties change gradually in a 10 K interval straddling the melting point,17 and the present results further emphasize the unique conditions in this temperature range. The dissipated kinetic energy changes as a function of scattering angle, and shows that energy transfer is substantial both normal and parallel to the surface plane, which confirms that water molecules encounter surfaces with a relatively rough or disordered character. MD simulations are consistent with the EMB results and show that a minor fraction of the incident water molecules either scatter inelastically or desorb within tens of picoseconds from a weakly bound state on top of the hydrophobic surface layer.
The angular resolved TOF measurements also allow us to elucidate the desorption kinetics in greater detail, and compared with a more limited earlier study where the flux from the surface was measured at a single scattering angle.17 The angular resolved results are well described by two types of trapping–desorption processes; one resulting in rapid desorption, and a second desorption process where water remains on the n-butanol surface on the millisecond time scale. The desorption rate coefficient for the fast desorption process cannot be resolved, but the results are consistent with the rapid desorption on the picosecond timescale observed in MD simulations. Rapid desorption competes with surface and bulk diffusion of water to more strongly bound states. The MD simulations show that a large fraction of the adsorbed water molecules are able to find strongly bound sites on the time scale of tens of picoseconds. On solid n-butanol, a large fraction of these more strongly bound water molecules remains in the surface layer and may desorb on the millisecond timescale. In contrast, water molecules on liquid n-butanol are more mobile and remain trapped in the condensed phase, a picture that is consistent with the disappearance of the slow desorption mode at high temperatures. The tendency for water to find more strongly bound states with increasing surface temperature is clearly manifest in the MD results and supports the interpretation of the experimental results.
The water/n-butanol system illustrates several key aspects of gas uptake on condensed organic phases. Organic surfaces often have a hydrophobic character with very weak binding sites for water and thus a fraction of adsorbed water molecules may rapidly desorb. However, even at low temperatures such as those investigated here, hydrophilic functional groups are surprisingly accessible for approaching water molecules. This is due to the weak water interactions with hydrophobic groups in the condensed phase combined with the mobility of the organic structure, which allow water molecules to rapidly diffuse to form hydrogen bonds with OH-groups. On solid surfaces, bulk diffusion is slow and water uptake can be expected to be reversible, while liquid surfaces allow for faster bulk diffusion and more extensive water uptake.
A related MD study on water accommodation on n-butanol coated ice reported that the adsorbed water molecules rapidly diffuse through the n-butanol monolayer and reach the ice surface.13 About 20% of impinging water molecules were scattered directly, while the rest was thermalized. Such molecules diffuse rapidly on the n-butanol surface with a diffusion coefficient of 10−9 m2 s−1, which allows the water molecules to find suitable sites to penetrate the monolayer by some subtle attractive force from the n-butanol hydroxyl groups. Once reaching the ice surface underneath the n-butanol monolayer, the water molecules are strongly bound by ∼3 hydrogen bonds. Thus, together with the findings of the current study, it seems that the n-butanol molecules in the monolayer above either ice or the n-butanol bulk do not isolate gas molecules to sense the attractive force from the hydroxyl functional groups, and the disordered structure facilitates the water molecules to reach potentially stronger binding sites. This indicates that the water uptake by aerosols made of small organics is strongly driven by the functional groups below the hydrophobic surface, the length of the chain, the packing of the organics and the surface state.
It remains to be explored to what extent the current findings can be generalized and extended to other types of organic compounds. We note that similar conclusions were recently reached for water interactions with nopinone (C9H14O).18 Nopinone is a reaction product formed during oxidation of β-pinene and has been found in both the gas and particle phases of atmospheric aerosol.37 The molecular structure of nopinone is substantially more complex than the n-butanol investigated here, consisting of a double cyclic carbon structure with one carbonyl group that may be accessible for hydrogen bonding of water. Experimental EMB studies of collisions between hyperthermal D2O and solid nopinone at 202 K confirmed that initial trapping of water molecules is efficient, with a small fraction that scatter inelastically after losing 60–80% of their incident kinetic energy. The majority of the trapped molecules rapidly desorbed, but a substantial fraction (0.32 ± 0.09) formed strong bonds with the nopinone surface and remained in the condensed phase for tens of milliseconds or longer. We conclude that, despite the large differences between the water/nopinone and water/n-butanol systems, the collision dynamics and desorption kinetics are qualitatively similar for the two systems. A similar behavior has also been observed for water interactions with solid acetic acid,36 and thus a picture of the detailed molecular-level behavior of water molecules on organic surfaces has begun to emerge.
5. Conclusions
We have carried out EMB experiments and MD calculations in order to investigate the detailed molecular interactions between water and n-butanol surfaces at temperatures between 160 and 240 K. Both experimental and simulation results indicate efficient energy transfer in water collisions with an n-butanol surface. A small fraction of the impinging water molecules scatters inelastically with 10–40% of their incident kinetic energy depending on the scattering direction. The majority of the colliding molecules undergo thermal accommodation and trap on the surface. Water desorption from n-butanol is governed by two different desorption processes. First, water molecules may interact briefly with both solid and liquid surfaces and desorb within less than 10 μs. The MD simulations suggest that this desorption process takes place within tens of picoseconds. This TD process is active for both solid and liquid n-butanol surfaces. Second, adsorbed molecules may diffuse to find more strongly bound states on the n-butanol surface. This later process is partially reversible for solid n-butanol with desorption occurring within a few milliseconds, while slow TD is not observed from liquid n-butanol. MD simulations confirm that accommodated water molecules are able to find strongly bound sites characterized by efficient hydrogen bonding within the n-butanol layer on 100 ps time scales.We conclude that the water/n-butanol system shows qualitatively similar behavior to other recently studied water/organic(s) systems. Hydrophilic functional groups present on organic surfaces are surprisingly accessible to adsorbed water molecules, even at low temperatures. This may potentially be explained by weak water interactions with hydrophobic surface structures, which allow for rapid diffusion of water to form hydrogen bonds with available functional groups. Further work should be carried out to confirm that this is a general feature of water/organic(s) systems of atmospheric relevance.
Conflicts of interest
There are no conflicts to declare.Acknowledgements
This work is supported by the Swedish Research Council. ET is also supported by the Swedish Research Council Formas. The work acknowledge funding from the CaPPA project (Chemical and Physical Properties of the Atmosphere) funded by the French National Research Agency through the Programme d’Investissement d’Avenir under contract ANR-11-LABX-0005-01, the Regional Council Nord Pas de Calais-Picardie and the European Funds for Regional Economic Development (FEDER), and Hauts de France council and European Regional Development Fund (ERDF) through the CPER Climibio. This work was performed using HPC resources from GENCI-TGCC (Grant 2017-A0010806820 and Grant 2018 – A0030806820).References
- Climate Change: The Physical Science Basis, Fifth Assessment Report of the Intergovernmental Panel on Climate Change Cambridge University Press, Cambridge, UK and New York, NY, USA, 2013.
- C. E. Kolb, R. A. Cox, J. P. D. Abbatt, M. Ammann, E. J. Davis and D. J. Donaldson, et al., An overview of current issues in the uptake of atmospheric trace gases by aerosols and clouds, Atmos. Chem. Phys., 2010, 10, 10561–10605 CrossRef CAS.
- M. Hallquist, J. C. Wenger, U. Baltensperger, Y. Rudich, D. Simpson and M. Claeys, et al., The formation, properties and impact of secondary organic aerosol: current and emerging issues, Atmos. Chem. Phys., 2009, 9, 5155–5236 CrossRef CAS.
- R. Sorjamaa and A. Laaksonen, The influence of surfactant properties on critical supersaturations of cloud condensation nuclei, J. Aerosol Sci., 2006, 37, 1730–1736 CrossRef CAS.
- G. T. Barnes, Permeation through monolayers, Colloids Surf., A, 1997, 126, 149–158 CrossRef CAS.
- D. Clifford, T. Bartels-Rausch and D. J. Donaldson, Suppression of aqueous surface hydrolysis by monolayers of short chain organic amphiphiles, Phys. Chem. Chem. Phys., 2007, 9, 1362–1369 CAS.
- C. Hoose and O. Möhler, Heterogeneous ice nucleation on atmospheric aerosols: a review of results from laboratory experiments, Atmos. Chem. Phys., 2012, 12, 9817–9854 CrossRef CAS.
- J. Buajarern, L. Mitchem and J. P. Reid, Characterizing the Formation of Organic Layers on the Surface of Inorganic/Aqueous Aerosols by Raman Spectroscopy, J. Phys. Chem. A, 2007, 111, 11852–11859 CrossRef CAS PubMed.
- C. J. Ebben, M. Shrestha, I. S. Martinez, A. L. Corrigan, A. A. Frossard and W. W. Song, et al., Organic Constituents on the Surfaces of Aerosol Particles from Southern Finland, Amazonia, and California Studied by Vibrational Sum Frequency Generation, J. Phys. Chem. A, 2012, 116, 8271–8290 CrossRef CAS PubMed.
- M. D. King, A. R. Rennie, K. C. Thompson, F. N. Fisher, C. C. Dong and R. K. Thomas, et al., Oxidation of oleic acid at the air–water interface and its potential effects on cloud critical supersaturations, Phys. Chem. Chem. Phys., 2009, 11, 7699–7707 RSC.
- T. Hede, X. Li, C. Leck, Y. Tu and H. Ågren, Model HULIS compounds in nanoaerosol clusters – investigations of surface tension and aggregate formation using molecular dynamics simulations, Atmos. Chem. Phys., 2011, 11, 6549–6557 CrossRef CAS.
- X. Ma, P. Chakraborty, B. J. Henz and M. R. Zachariah, Molecular dynamic simulation of dicarboxylic acid coated aqueous aerosol: structure and processing of water vapor, Phys. Chem. Chem. Phys., 2011, 13, 9374–9384 RSC.
- X. Kong, C. Toubin, A. Habartova, E. Pluharova, M. Roeselova and J. B. C. Pettersson, Rapid Water Transport through Organic Layers on Ice, J. Phys. Chem. A, 2018, 122, 4861–4868 CrossRef CAS PubMed.
- J. Julin, P. M. Winkler, N. M. Donahue, P. E. Wagner and I. Riipinen, Near-Unity Mass Accommodation Coefficient of Organic Molecules of Varying Structure, Environ. Sci. Technol., 2014, 48, 12083–12089 CrossRef CAS PubMed.
- S. C. Park, D. K. Burden and G. M. Nathanson, Surfactant Control of Gas Transport and Reactions at the Surface of Sulfuric Acid, Acc. Chem. Res., 2009, 42, 379–387 CrossRef CAS PubMed.
- X. Kong, E. S. Thomson, P. Papagiannakopoulos, S. M. Johansson and J. B. C. Pettersson, Water Accommodation on Ice and Organic Surfaces: Insight from Environmental Molecular Beam Experiments, J. Phys. Chem. B, 2014, 118, 13378–13386 CrossRef CAS PubMed.
- P. Papagiannakopoulos, X. Kong, E. S. Thomson, N. Marković and J. B. C. Pettersson, Surface Transformation and Water Uptake on Liquid and Solid Butanol near the Melting Temperature, J. Chem. Phys. C, 2013, 117, 6678–6685 CrossRef CAS.
- S. M. Johansson, X. Kong, E. S. Thomson, M. Hallquist and J. B. C. Pettersson, The Dynamics and Kinetics of Water Interactions with a Condensed Nopinone Surface, J. Phys. Chem. A, 2017, 121, 6614–6619 CrossRef CAS PubMed.
- W. M. Haynes, Physical Constants of Organic Compounds in CRC Handbook of Chemistry and Physics, CRC Press, Taylor & Francis Group, Boca Raton, FL, 93rd edn, 2014 Search PubMed.
- X. Kong, P. U. Andersson, N. Marković and J. B. C. Pettersson, Environmental Molecular Beam Studies of Ice Surface Processes, in Physics and Chemistry of Ice 2010, ed. Y. Furukawa, G. Sazaki, T. Uchida and N. Watanabe, Hokkaido University Press, Sapporo, 2011, pp. 79–88 Search PubMed.
- S. M. Johansson, X. R. Kong, P. Papagiannakopoulos, E. S. Thomson and J. B. C. Pettersson, A novel gas–vacuum interface for environmental molecular beam studies, Rev. Sci. Instrum., 2017, 88, 035112 CrossRef PubMed.
- X. Kong, P. U. Andersson, E. S. Thomson and J. B. C. Pettersson, Ice Formation via Deposition Mode Nucleation on Bare and Alcohol-Covered Graphite Surfaces, J. Phys. Chem. C, 2012, 116, 8964–8974 CrossRef CAS.
- C. R. Arumainayagam and R. J. Madix, Molecular Beam Studies of Gas-Surface Collision Dynamics, Prog. Surf. Sci., 1991, 38, 1–102 CrossRef CAS.
- E. S. Thomson, X. Kong, N. Marcović, P. Papagiannakopoulos and J. B. C. Pettersson, Collision dynamics and uptake of water on alcohol-covered ice, Atmos. Chem. Phys., 2013, 13, 2223–2233 CrossRef.
- W. Damm, A. Frontera, J. Tirado-Rives and W. L. Jorgensen, OPLS All-Atom Force Field for Carbohydrates, J. Comput. Chem., 1997, 18, 1955–1970 CrossRef CAS.
- W. L. Jorgensen, D. S. Maxwell and J. Tirado-Rives, Development and Testing of the OPLS All-Atom Force Field on Conformational Energetics and Properties of Organic Liquids, J. Am. Chem. Soc., 1996, 118, 11225–11236 CrossRef CAS.
- L. Verlet, Computer ‘Experiments’ on Classical Fluids. I. Thermodynamical Properties of Lennard-Jones Molecules, Phys. Rev., 1967, 159, 98–103 CrossRef CAS.
- D. Van Der Spoel, E. Lindahl, B. Hess, G. Groenhof, A. E. Mark and H. J. C. Berendsen, GROMACS: Fast, Flexible, and Free, J. Comput. Chem., 2005, 26, 1701–1718 CrossRef CAS PubMed.
- B. Hess, H. Bekker, H. J. C. Berendsen and J. G. E. M. Fraaije, LINCS: A Linear Constraint Solver for Molecular Simulations, J. Comput. Chem., 1997, 18, 1463–1472 CrossRef CAS.
- U. Essmann, L. Perera, M. L. Berkowitz, T. Darden, H. Lee and L. G. Pedersen, A smooth particle mesh Ewald potential, J. Chem. Phys., 1995, 103, 8577–8593 CrossRef CAS.
- G. Bussi, G. Donadio and M. Parrinello, Canonical sampling through velocity rescaling, J. Chem. Phys., 2007, 126, 014101 CrossRef.
- P. Derollez, A. Hédoux, Y. Guinet, F. Danède and L. Paccou, Structure determination of the crystalline phase of n-butanol by powder X-ray diffraction and study of intermolecular associations by Raman spectroscopy, Acta Crystallogr., Sect. B: Struct. Sci., Cryst. Eng. Mater., 2013, 69, 195–202 CrossRef CAS PubMed.
- H. J. C. Berendsen, J. R. Grigera and T. P. Straatsma, The Missing Term in Effective Pair Potentials, J. Phys. Chem., 1987, 91, 6269–6271 CrossRef CAS.
- J. Lovrić, D. Duflot, M. Monnerville, C. Toubin and S. Briquez, Water-Induced Organization of Palmitic Acid at the Surface of a Model Sea Salt Particle: A Molecular Dynamics Study, J. Phys. Chem. A, 2016, 120, 10141–10149 CrossRef PubMed.
- V. N. Kontratev, Chemical Kinetics of Gas Reactions, Pergamon Press, London, 1964 Search PubMed.
- P. Papagiannakopoulos, X. Kong, E. S. Thomson and J. B. C. Pettersson, Water Interactions with Acetic Acid Layers on Ice and Graphite, J. Phys. Chem. B, 2014, 118, 13333–13340 CrossRef CAS PubMed.
- I. G. Kavouras, N. Mihalopoulos and E. G. Stephanou, Formation and gas/particle partitioning of monoterpenes photo-oxidation products over forests, Geophys. Res. Lett., 1999, 26, 55–58 CrossRef CAS.
| This journal is © the Owner Societies 2019 |