
 Open Access Article
 This Open Access Article is licensed under a
 Creative Commons Attribution 3.0 Unported Licence
Interaction of stable aggregates drives the precipitation of calcium phosphate in supersaturated solutions†
R.
Innocenti Malini
 *a,
C.
L. Freeman
b and
J. H.
Harding
b
*a,
C.
L. Freeman
b and
J. H.
Harding
b
aEmpa, Swiss Federal Laboratories for Materials Science and Technology, Laboratory for Biomimetic Membranes and Textiles, Lerchenfeldstrasse 5, St. Gallen 9014, Switzerland. E-mail: Riccardo.innocentimalini@empa.ch
bDepartment of Materials Science and Engineering, University of Sheffield, Mappin Street, Sheffield, S1 3JD, UK
First published on 8th October 2019
Abstract
Calcium phosphate is the main mineral phase within our bodies, but despite many studies there is not yet a consensus on how it nucleates. We have used molecular dynamics simulations to investigate the interactions of ions in solution and the stability of nanoparticles. At high concentrations, we show that calcium and hydrogen phosphate ions associate to form negatively charged clusters that grow further through a combination of ion attachment and particle–particle interactions. Additional analysis of a cluster of 16 ions at experimental concentrations showed that this is (meta)stable in solution and actually densifies during the simulation. Free energy calculations probing the stability of the nanoparticles further demonstrated that they occupy a free energy minimum lower than the free ions or ion pairs in solution suggesting that calcium phosphate nucleation and growth may occur through the aggregation of small negatively charged clusters.
Introduction
Although calcium phosphate minerals have been thoroughly studied, the mechanisms behind their nucleation and growth are still a matter of debate. The most stable phase of this mineral system is hydroxyapatite (HAP). However, frequently the first phase to precipitate is amorphous calcium phosphate (ACP).1–4 Independently of the method used, research groups have suggested that this phase initially precipitates as [Can(HPO4)x]2n−2x or [Can(PO4)x]2n−3x.1 However, it is not clear how the ions in solution associate in order to form this phase, and many different pre-nucleation complexes have been proposed.3,5–10 Understanding the mechanisms behind the formation of this important mineral is essential for a better understanding of biomineralisation and ways to control its formation.Renewed interest in the precipitation of biominerals, has been spurred by claims that stable pre-nucleation complexes are present in calcium carbonate solutions.11 These clusters were then analysed using molecular dynamics; the results suggested the formation of stable dynamically ordered chains composed of a 1![[thin space (1/6-em)]](https://www.rsc.org/images/entities/char_2009.gif) :1 mixture of Ca2+ and CO32− ions.12 The results led to the idea that nucleation of this mineral phase could occur through pathways not envisaged by classical nucleation theory and that a new framework was needed.13 Additional experiments, however, failed to observe these chains under supersaturated conditions and it is not yet clear how this mineral forms.14 Nonetheless, these investigations inspired investigations of other biominerals such as calcium phosphate, where complexes larger than the ion pairs have often been observed.3,9,15,16
:1 mixture of Ca2+ and CO32− ions.12 The results led to the idea that nucleation of this mineral phase could occur through pathways not envisaged by classical nucleation theory and that a new framework was needed.13 Additional experiments, however, failed to observe these chains under supersaturated conditions and it is not yet clear how this mineral forms.14 Nonetheless, these investigations inspired investigations of other biominerals such as calcium phosphate, where complexes larger than the ion pairs have often been observed.3,9,15,16
Posner and Betts were the first to propose a potential building unit for ACP, based on the correlations observed in the reduced pair distribution function (PDF).5 They suggested that the unit cluster would have an average diameter of approximately 9.75 Å and that it could be described by a cluster with the formula Ca9(PO4)6. Structures with sizes matching this cluster, obtained from dynamic light scattering and atomic force microscopy experiments, were reported in the literature.6,15,16 Density functional theory calculations of various calcium phosphate clusters, starting from the one proposed by Posner, reported that the smallest stable unit could be Ca3(PO4)2.7,17 The calculations, however, were done in vacuum and water molecules could have an important impact on cluster stability.10 Posner-like clusters were also recently observed in molecular dynamics simulations of solutions containing Ca2+, PO43− and HPO42− ions.8
Recently Habraken et al. did a full speciation calculation and proposed that ACP formed by densification of [Ca(HPO4)3]4− chains through the incorporation of an additional calcium ion, leading to a final chemical composition of [Ca2(HPO4)3]2−.3 The formation of chains composed of negatively charged primary units is surprising but their solutions contained a large amount of sodium, chloride and TRIS ions that increased the ionic strength and shielded the charges. At lower ionic strength and in the absence of TRIS the formation of negatively charged complexes, [Ca(HPO4)2]2−, was still observed when analysing solutions using Ca K-edge XANES spectra.9 In that study, however, they observed that these negatively charged complexes had only a small impact on the formation of ACP, which instead precipitated through the accumulation of ion pairs. In contrast, by monitoring the pH and the calcium concentration in the solution, Xie et al. found that ACP precipitated as a calcium deficient structure.4 In this case, no specific complex was proposed, but the solution contained much lower amounts of counter ions compared to the work of Habraken et al.3,4 Considering these recent results, it appears that the formation of negatively charged complexes is thermodynamically or kinetically favoured, in both the presence and absence of large concentrations of counter ions or additional buffers. The role of these negatively charged complexes in the precipitation of ACP is much less clear.
Both Xie et al. and Habraken et al. monitored the pH and the calcium concentration in their reaction to investigate the precipitation of calcium phosphate.3,4 Their work revealed that, after the addition of calcium ions, the pH and calcium concentration displayed only minor variations, suggesting that no phase precipitated. Nonetheless, TEM analysis of the solution immediately after the addition of calcium ions (t < 20 min) showed either the formation of inorganic polymeric networks, or the formation of porous particles with a diameter of ∼25 nm. This suggests that the formation of these complexes occurs not by nucleation of a secondary phase, but through association of ions or complexes into larger structures that either do not form a new interface with the solution or have a small interfacial energy. To explain the mechanism, Habraken et al. used a previously proposed modification of classical nucleation theory (CNT), where the interfacial energy is not assumed to be constant but changes as a function of the size of the clusters and leads to an excess free energy that needs to be taken into account when the complexes aggregate.3,18 By using this assumption, the CNT barrier calculated for the precipitation of ACP decreased significantly, and fell below the one for HAP, thereby rationalising its observation.3 In contrast, however, Xie et al., proposed that an amorphous complex forms spontaneously when the calcium and phosphate solutions are mixed which then transforms to a new denser phase by dehydration and aggregation. Pre-critical nuclei then form in this denser phase, leading to the formation of HAP nanodomains.4 To summarise; Habraken et al. propose that the complexes observed before nucleation carry an excess free energy and are thus metastable, while Xie et al. propose that the initial structures that form are lower in energy than the ions in solution.
Here we used molecular dynamics simulations to investigate both the precipitation of calcium phosphate from a supersaturated solution and the stability of a small amorphous nanoparticle at experimental concentrations. The results show that calcium and hydrogen phosphate ions initially associate into negatively charged complexes that then aggregate into larger structures. Therefore, during the simulation, the formation of an amorphous structure occurs through the aggregation of complexes with different sizes rather than through the binding of individual ions. As the complexes aggregate into larger structures, dehydration slowly takes place, leading to the removal of water molecules from the coordination shell of the Ca2+ ions and an increase of their interaction with HPO42− ions. To further verify the stability of calcium and hydrogen phosphate complexes, an eightfold formula unit structure was extracted and solvated at experimental concentrations. In contrast to calcium carbonate aggregates,14 this ionic complex remained stable, and actually condensed further during the simulation. Free energy calculations probing the binding of individual ions, an ion pair, and a cluster to the eight formula unit cluster showed that further growth was exergonic demonstrating that calcium and phosphate ions in aqueous solutions can indeed form stable aggregates larger than the ion pair and small complexes.
Methods
All the simulations were run using LAMMPS and the force field for the calcium and phosphate ions was obtained from Demichelis et al.19,20 This force field was benchmarked against the ion-water interactions calculated from ab initio simulations, the thermodynamics of the calcium phosphate bulk mineral phases, and has been shown to accurately capture the ion pairing free energies.20 The latter values are crucial when studying the association of ions from solution. Free energies calculations with the chosen force field led to an ion pairing free energy of −17.9 kJ mol−1 for the binding of Ca2+ and HPO42−.20 This is close to the experimental value of −15.7 kJ mol−1 determined experimentally.21 In other force fields used in recent investigations of the association of Ca2+ and HPO42− ions, the value is either not known8 or was significantly more exergonic than the experimental value.22The water molecules were modelled using the SPC/F model as suggested in the force field specification.23
The initial configuration for all simulations was obtained using Packmol, a program that packs molecules within specified regions of space.24 To remove the high forces between molecules occurring because of a sub-optimal packing, all systems were simulated for at least 200 ps in the NVT ensemble at 300 K. During this step, the temperature was controlled by using a Nosé–Hoover thermostat with a relaxation time of 1 ps. After this equilibration period, for all the production runs the ensemble was changed to NPT with the temperature set at 300 K and the pressure at 1 atm. This was done using a Nosé–Hoover thermostat and barostat, with a relaxation time of 1 ps and 0.1 ps, respectively. The timestep was set to 1 fs and the long-range interactions were calculated using the particle–particle particle–mesh solver method.
The initial concentration of the ions was set at 0.5 M as recently done in similar simulations.8,14 This concentration is much higher than what is usually used experimentally (∼100 times larger), however the supersaturated conditions guarantee the potential for the ions to aggregate into clusters on a reasonable timescale, a process that would take an unrealistic amount of computer time using experimental concentrations. Therefore 90 Ca2+ ions, 90 HPO42− ions and 10000 water molecules were inserted at random, using the Packmol24 code, into a box whose equilibrated volume was 67.1 × 67.1 × 67.1 Å3. The assumption that only these ions are present implies a solution pH of about nine. This system was simulated for ∼175 ns.
During the initial part of the high concentration simulation, clusters formed with sizes ranging from a few ions to 10 formula units. To verify their stability at experimental concentrations, a cluster comprising eight formula units was extracted, solvated with 45000 water molecules and then simulated for 30 ns at a concentration closer to the experimental one. If all ions present in the clusters were considered as solute, this concentration would be equivalent to about 10 mM for the Ca2+ and HPO42− ions (final system size: 110.1 × 110.1 × 110.1 Å3). However, as no additional ions were inserted in the system, the actual ionic concentration of the solution was zero. The effect of the charge on the stability of the nanoparticle was also investigated. One or two Ca2+ ions were randomly removed from the cluster and the resulting aggregates were simulated for 20–25 ns. In these two cases, the system was charged. To avoid inserting additional ions that might interact with the complexes and change their stability, thereby increasing the complexity of the simulations, the implicit neutralising background (obtained when the k = 0 term in the reciprocal space part of the Ewald summation is omitted) was used. This procedure leads to a uniform real-space shift in the charge density that introduces a charge density uniformly distributed throughout the system. As it is uniform, the background charge does not exert a force on charged particles. Moreover, because the overall charge of the simulated systems was small (either −2e or −4e) and the simulation cells relatively large (1334633.3 Å3), the effect of this correction is negligible for our purposes.
As will be shown in the results section, the clusters described above were amorphous. However, it is possible that this occurs because they were extracted from a highly concentrated solution, and the fast aggregation did not give them time to organise into a crystalline bulk-like structure as previously shown for NaCl.25 Therefore, a system including 3400 water molecules and a monetite (CaHPO4) fragment with the same chemical composition as the neutral cluster described above (Fig. S1a†), was simulated for 20 ns in the NPT ensemble to verify its stability.
To further verify that these clusters occupy a local free energy minimum and that growth can indeed proceed via stable clusters, free energy calculations were performed using umbrella sampling as implemented in Plumed.26 The system was prepared by solvating the neutral eight formula unit cluster described above with 3400 water molecules and either a Ca2+ ion, a HPO42− ion, an ion pair or a second identical cluster.24 High strains in the systems arising from a suboptimal water packing were removed by simulating the system for 100 ps in the NVT ensemble at a temperature of 300 K. After this step, the distance between the centre of mass (COM) of the nanoparticle and the additional species was constrained at different distances in different simulations using a spring with a value of either 10 or 20 kJ mol−1, depending on the local slope of the free energy curve. The distance sampled started from 4 Å and went up to 20 Å. Between 5 and 15 Å a simulation was performed every 0.5 Å, while between 15 and 20 Å the windows were separated by 1 Å. Each window was simulated for between 3 and 8 ns. Additional windows were added where free energy barriers were observed. Therefore, the total simulation times for the free energy curves were between 75 and 160 ns. In all cases, the nanoparticle and the other species were both allowed to rotate freely to enable them to reach the most favourable mutual orientation at a given distance between the nanoparticle COM and the other species. The free energy change as a function of distance was obtained from the weighted histogram analysis method using the code developed by A. Grossfield.27
Relating the change in free energy obtained from the simulations to experimental values requires the calculation of the potential of mean force, ϕ(r), defined as:28
| ΔG(r) = ϕ(r) − kbTln(4πr2) | (1) |
 | (2) |
ln(4πr2) is the configurational entropy of the system, which decays monotonically with increasing distance. Since the nanoparticle is neutral, there is no long-range coulombic term and the van der Waals (vdW) interactions will become negligible beyond a cutoff distance. The convergence of free energy calculations can therefore be verified by the alignment of the simulated free energy curve with the entropic term at long distances. Since the nanoparticle is not spherical and the other species may not be spherical, it is important to allow them to rotate with respect to each other to find the lowest free energy curve as a function of the nanoparticle-species distance. At long distances, however, the effects of mis-orientation will be negligible and the particles may be treated as points. The free energy curves describing the interactions between the neutral nanoparticle and the Ca2+ ion, the HPO42− ion and their ion pair were simulated until their long-range tail aligned. Then the entropic function was shifted along the x-axis to align it with the long-range limit of the free energy curves, thereby ensuring that the right reference point was used to calculate the potential of mean force and the equilibrium constant. In eqn (2), R1 was 15 Å as at that point there were no more discontinuities in the free energy curve. Decreasing R1 to 10 Å or increasing it to 18 Å changed the free energy value by about 1 kJ mol−1, which is below the error of the current calculations.
Results & discussion
a. Aggregation of the ions at high supersaturation
In Fig. 1, the probability of a given Ca2+ or HPO42− being in a cluster of a given size is plotted as a function of the simulation time. During the first 20 ns of simulation time, the number of free Ca2+ and HPO42− ions quickly decreases as they associate into small clusters with a size below 20 ions. After approximately 20 ns there is a sudden decrease in the number of clusters with a size between 10 and 20 ions. This is due to the formation of aggregates with a size of up to 50 ions. At this point, the probability distribution of the ions that are in a cluster of a given size becomes discontinuous, with the appearance of regions where the probability of there being clusters within a particular size range is negligible, suggesting that the growth process is driven not only by the attachment of ions, but also by the aggregation of clusters.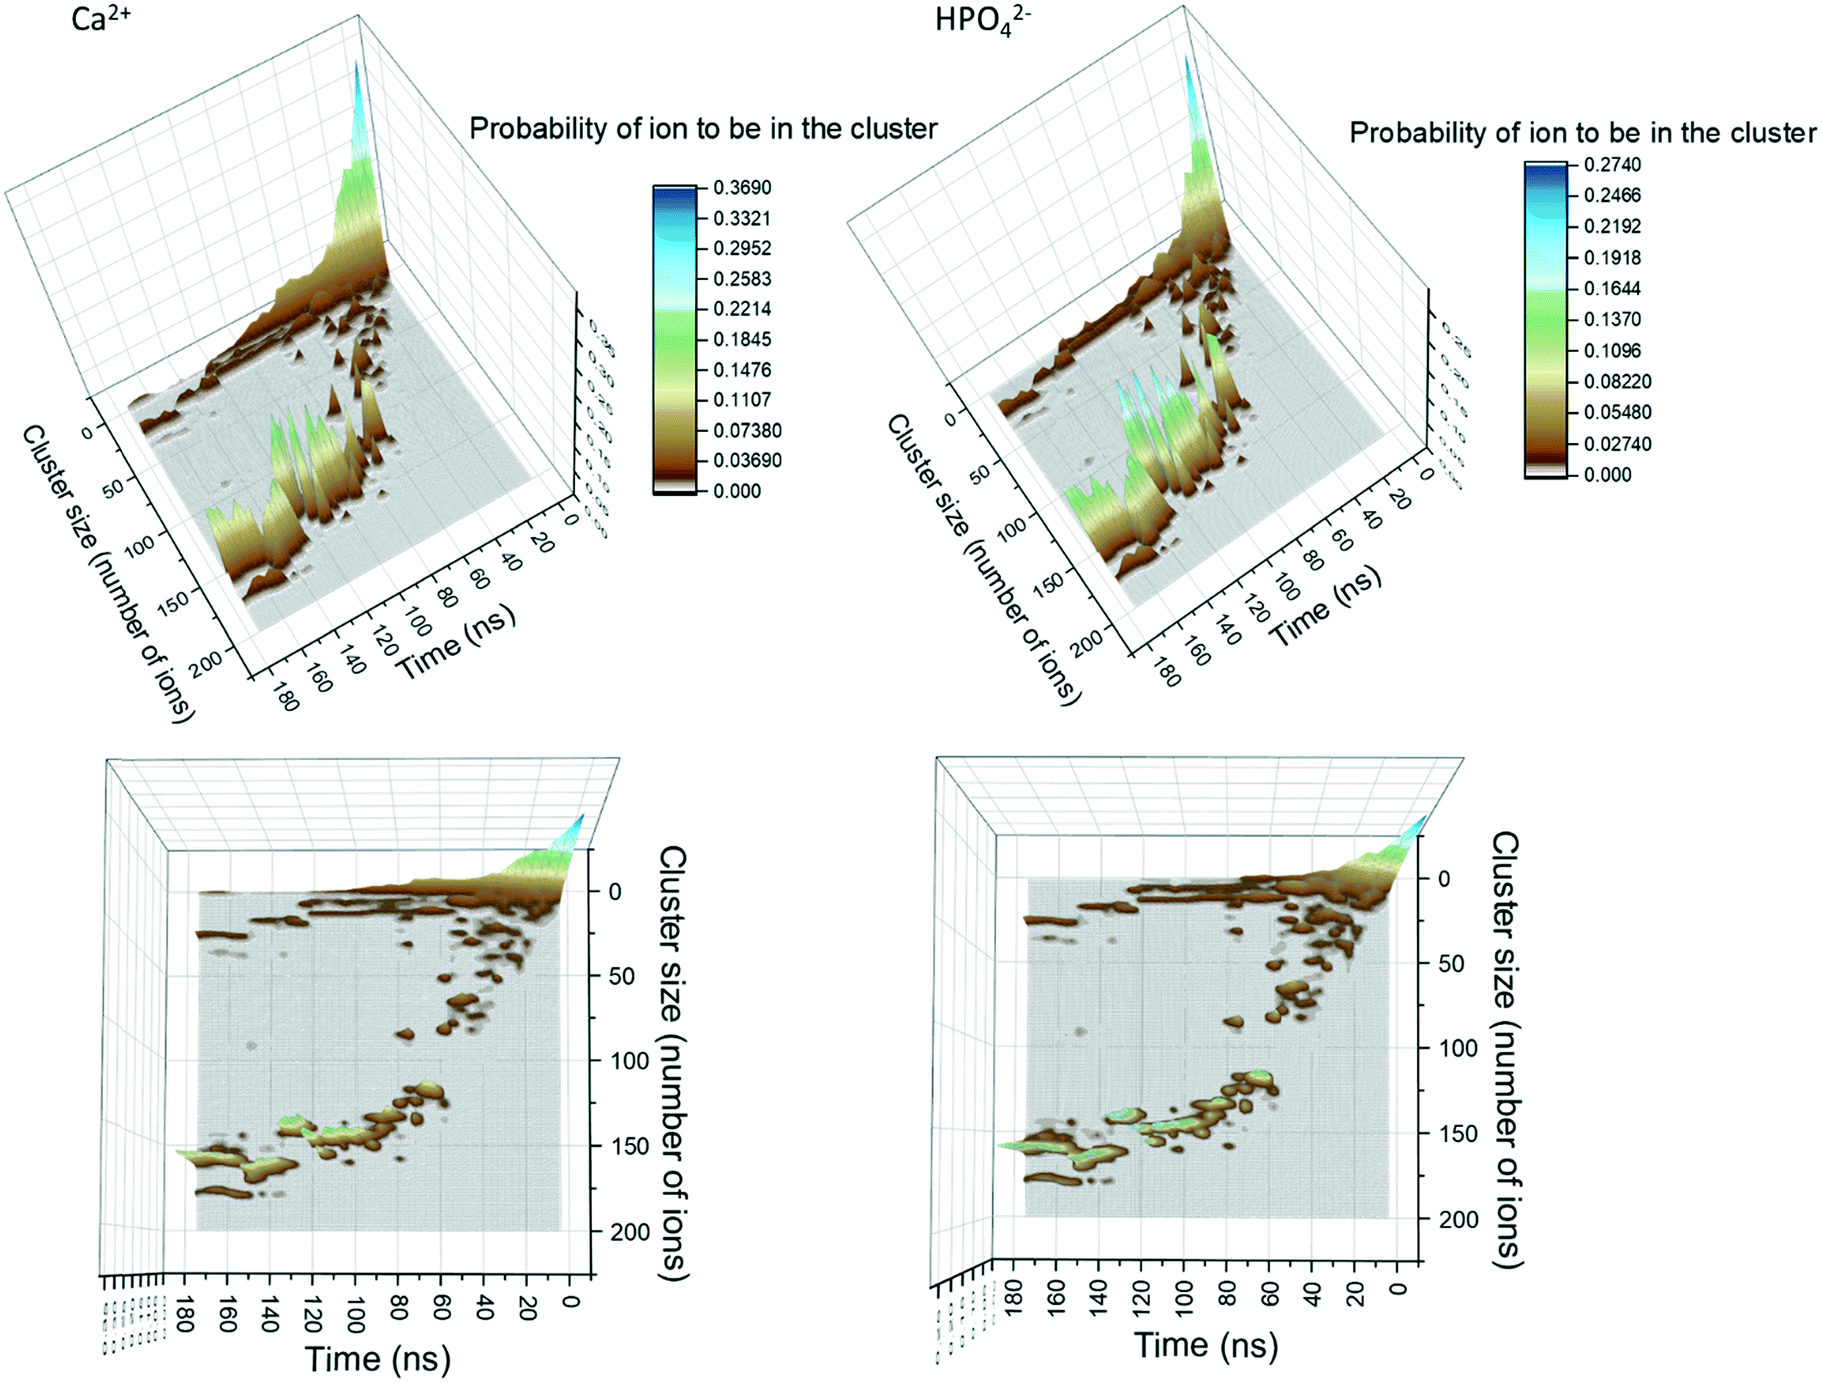 | ||
| Fig. 1 Probability of finding Ca2+ and HPO42− ions within clusters of different size as a function of simulation time. The original data was treated with a Gaussian smoother in order to make it clearer. The panels on the left correspond to Ca2+ while the ones on the right to HPO42−. In all the images, the z-axis corresponds to the probability of finding a given ion in a cluster of given size, which on the image is colour coded as shown on the sidebar. | ||
Growth of clusters through ion attachment and cluster aggregation continues until approximately 40 ns. At ∼40 ns, the probability of finding free Ca2+ and HPO42− ions in the solution reaches a plateau that lasts until ∼70 ns. During this time span, the complexes further aggregate leading to a cluster with a size of ∼125 molecules at ∼60 ns. As shown in the images in Fig. 1, this process occurs through the aggregation of two smaller complexes; one with a size of 85 ions and another one with a size of 50 ions.
Between 70 and 120 ns the size of the largest aggregate increases slowly to 150 ions. This change is accompanied by a decrease in the number of free calcium ions and the complete depletion of HPO42− ions (only 5 remained at ∼65 ns). This suggests that during this part of the process the growth is mainly due to the attachment of Ca2+ ions and small aggregates with a maximum size of 14 ions. By the end of the simulation, three peaks with sizes of 25, 155 and 180 ions are present in Fig. 1. The last peak corresponds to all the ions in the system, indicating that the aggregates of 25 and 155 ions are very close to each other and are separated only by a solvation shell.
b. Changes in Ca/P ratio during aggregation
The Ca/P ratio in clusters as a function of the simulation time is shown in Fig. 2a. At the beginning of the simulation, the Ca2+ and HPO42− ions formed calcium-deficient clusters with a Ca/P ratio starting from 0.75 and increasing to 0.90 after 40 ns. After that, the number of free Ca2+ and HPO42− ions remains stable for 30 ns, so the Ca/P ratio also maintains a value just below 0.90. Then it starts to increase again until it reaches 0.98 after 120 ns of simulation time and remains approximately constant until the end of the simulation.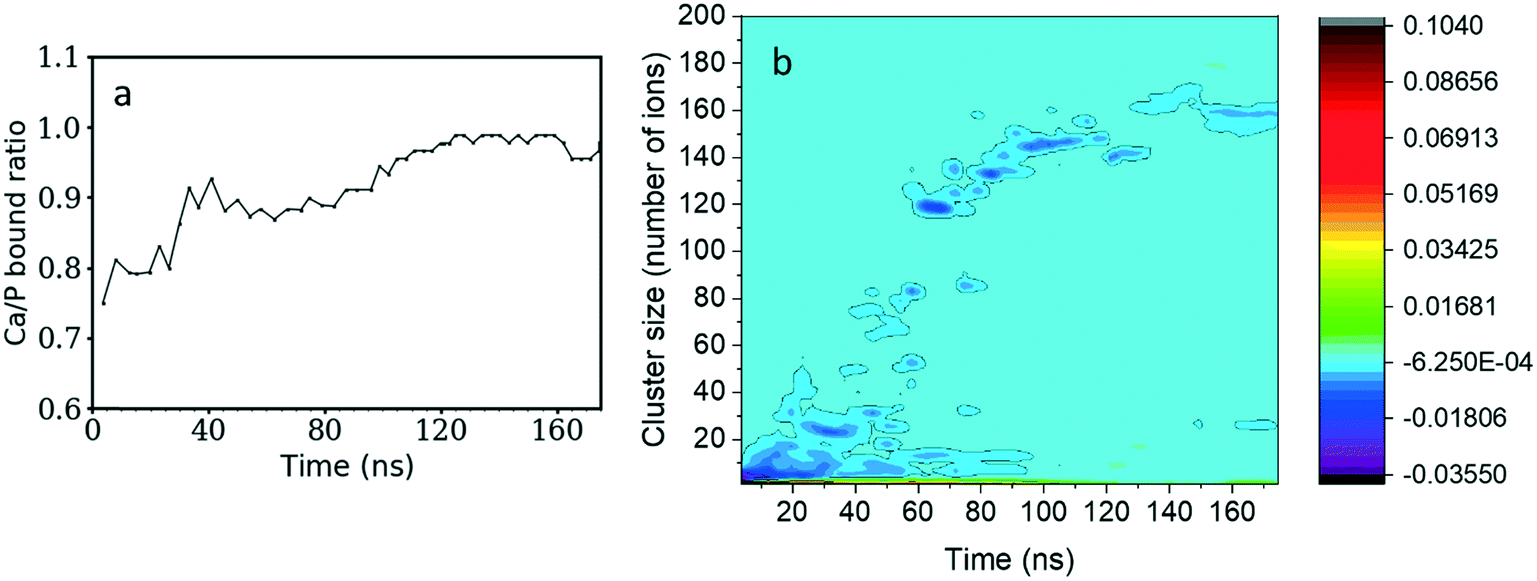 | ||
| Fig. 2 a) Ratio of Ca/P in complexes as a function of simulation time. A ratio below one means that more HPO42− ions are bound than Ca2+ ones. b) Differences in the probability of HPO42− and Ca2+ ions existing in clusters of given sizes as a function of simulation time. Regions in darker blue shades contain higher numbers of HPO42− ions while green and red regions will have more Ca2+ ions. | ||
By subtracting the probability of finding HPO42− ions from the probability of finding Ca2+ ions for a cluster of given size (as presented in Fig. 2b) we can investigate the charge of different clusters as a function of size. During the first 10 ns of simulation time, clusters with less than 5 ions tend to have a larger negative charge. Therefore, there is a preference for negatively charged small clusters. As the simulation evolves and the complexes become larger, the cluster charge slowly equilibrates. Nonetheless, the 120 ions cluster formed after 60 ns displays a small negative charge that remains until the end of the simulation.
c. Structural evolution of the aggregates
Fig. 3 shows the coordination number (CN) evolution for both types of ion as a function of simulation time. The Ca–P CN in the clusters during the first 20 ns of simulation time increases faster than the P–Ca one, suggesting that the Ca2+ ions in general reside in the centre of clusters surrounded by HPO42− ions, and that these clusters are negatively charged as shown also in Fig. 2b above. Initially, these are a mixture of different structures including ion pairs, [CaHPO4], small clusters such as [Ca(HPO4)2]2− or [Ca2(HPO4)2], denser structures like [Ca2(HPO4)3]2−, or chains with different Ca–P and P–Ca CN values (Fig. 5). From then on, the average CNs found for Ca–P and P–Ca evolve approximately together reaching a maximum value slightly above three.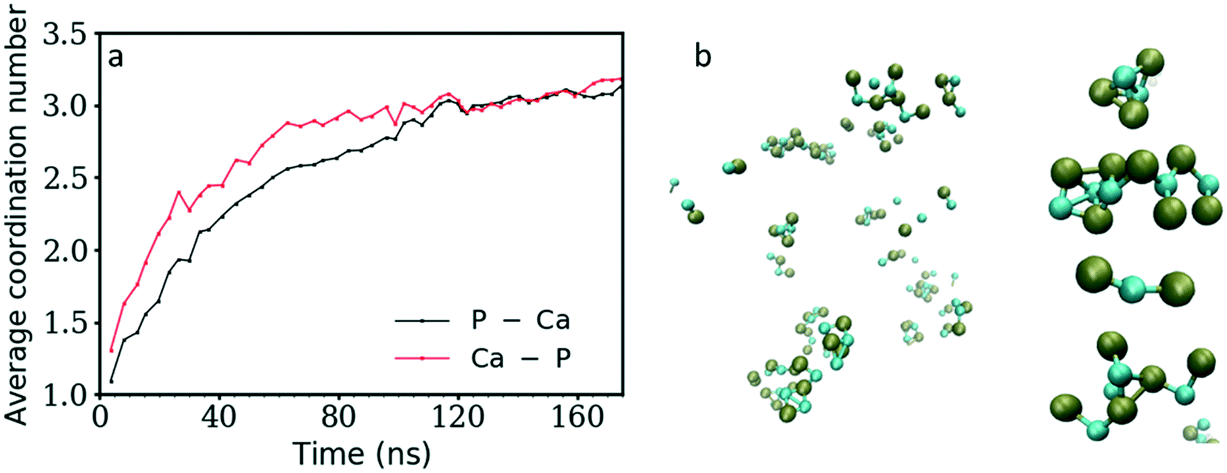 | ||
| Fig. 3 a) Change in the average Ca–P (black) and P–Ca (red) coordination number (CN) as a function of simulation time. b) Snapshot taken 10 ns after the start of the simulation showing only bound ions and examples of complexes observed with a CN of at least 1. In the image, the phosphorus atoms are shown in green while the Ca2+ ions are in turquoise. Water molecules and Op atoms (the oxygen atoms of the HPO42− ion) are not shown for clarity. | ||
Initially, the total number of ions having two, three and even four counter ions in their coordination shell increased steadily while the number of ions having zero or one counter ion quickly decreased (Fig. 4a and b). The number of ions with CN = 2 increased the fastest at the beginning of the simulation, reaching a maximum value within the first 30 ns of simulation time. A CN of 2 indicates the formation of ionic chains, which can be observed in Fig. 3b. After reaching a maximum, the number of ions with CN = 2 decreased to approximately 22% of the total number of ions, while the number of ions with a CN of three increased until a plateau was reached at a value of 43% and 39% of the total ions for the P–Ca and the Ca–P cases, respectively.
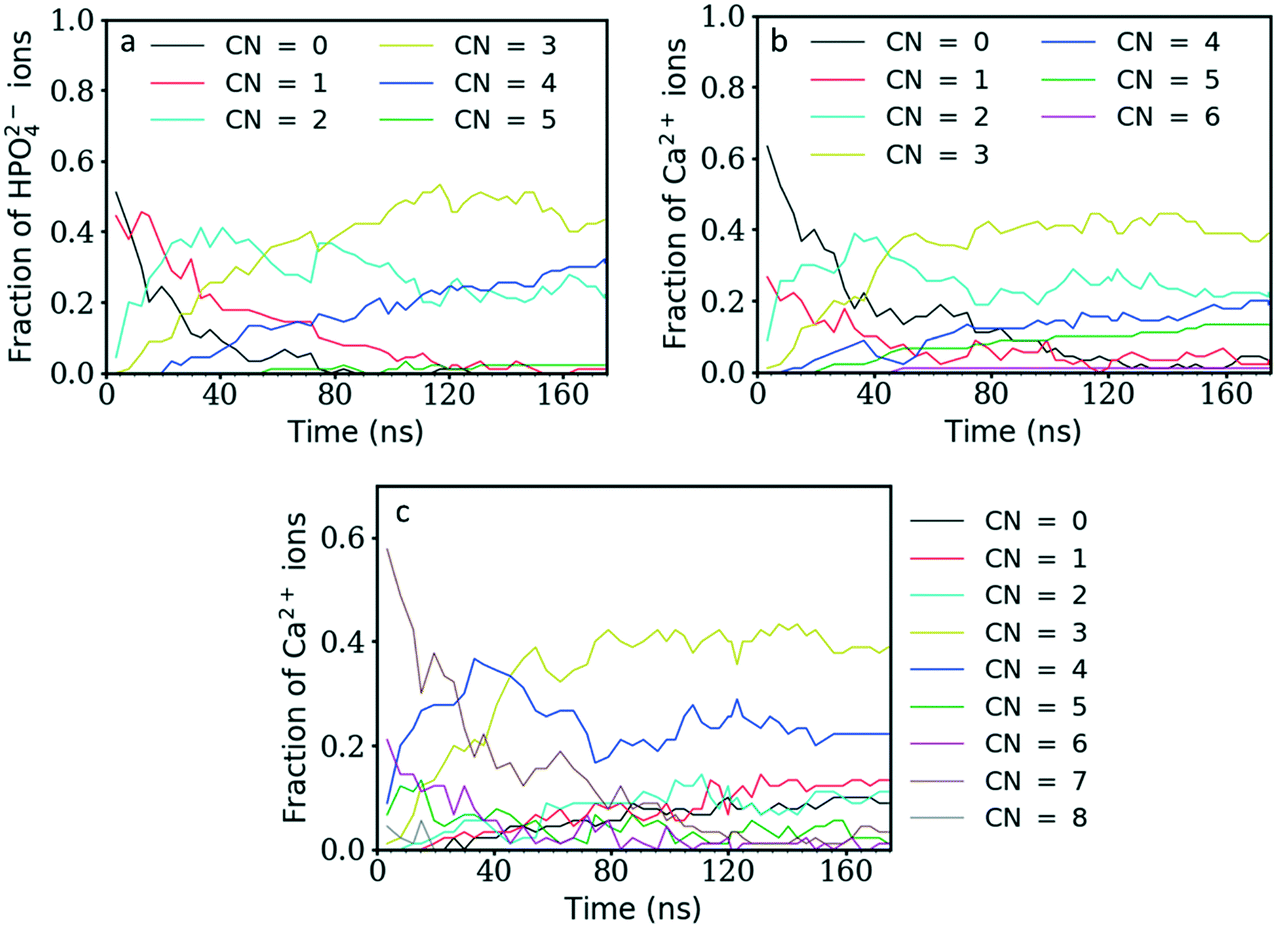 | ||
| Fig. 4 a) Fraction of HPO42− ions with a given number of calcium ions in its coordination shell as a function of time. b) Fraction of Ca2+ ions with a given number of HPO42− ions in its coordination shell as a function of time. c) Fraction of Ca2+ ions with a given number of Ow atoms (oxygen of the water molecules) in the coordination shell as a function of time. | ||
The evolution of these two curves suggests that, after the formation of chains, further ions or clusters attach to their side, increasing the CN of the Ca2+ and HPO42− ions towards three. As they reach a certain size, the chains further aggregate and densify. This step is linked with the increase in the aggregate size (Fig. 1) and a decrease in the number of ions with a CN of two observed at 30 ns for P–Ca, accompanied by an increase in the number of ions with a CN of three and four (Fig. 4a). The P–Ca curve for CN = 4 and the Ca–P curve for CN = 5, displayed in Fig. 4a and b, steadily increase until the end of the simulation suggesting that the largest cluster observed in Fig. 1 is dehydrating and densifying.
This can be verified by looking at the number of Ow atoms (oxygen of the water molecules) around the Ca2+ ions. Fig. 4c shows that the number of Ca2+ ions coordinated by five or more Ow atoms quickly decreases until ∼60 ns of simulation time, while the number of Ca2+ ions coordinated by three or fewer Ow atoms tends to steadily increase. Therefore, until 60 ns the free calcium ions are quickly removed from solution as they form clusters with HPO42− ions. As in the other graphs, one of the curves, in this case that for the number of Ca2+ ions coordinated by four Ow atoms, displays a maximum at approximately 35 ns and then decreases to a constant value. This is the point where the larger aggregates start to form (Fig. 1), leading to an increase in ionic interactions that displaces the water molecules in the Ca2+ ion coordination shell.
By the end of the simulation, ∼33% of the calcium ions have fewer than 3 water molecules in their coordination shell and ∼9% are completely dehydrated. Examples of the dehydrated Ca2+ ions and their coordination shells are shown in Fig. 5. In general, they have distorted trigonal bipyramidal (Fig. 5a) and tetrahedral (Fig. 5b) coordination formed by the surrounding HPO42− ions.
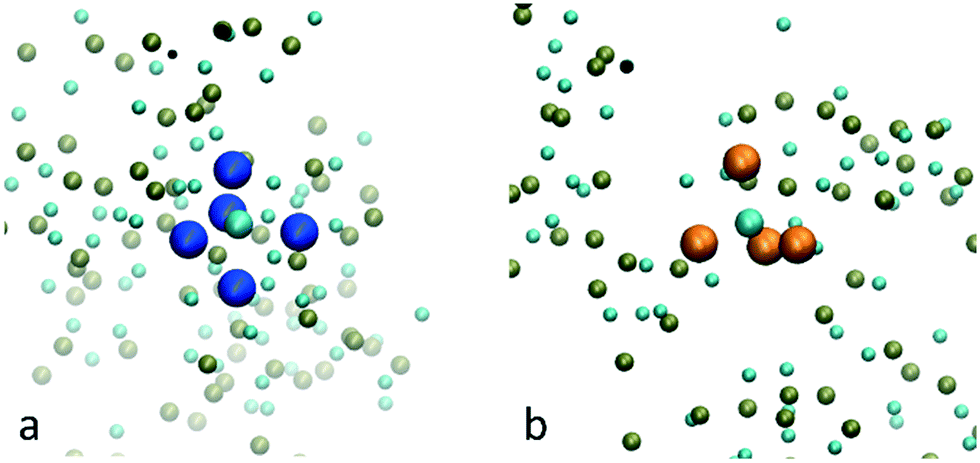 | ||
| Fig. 5 Examples of a Ca2+ ion in a) a bipyramidal site and b) a tetrahedral site formed by the surrounding HPO42− ions. The phosphorus atoms of the HPO42− ions forming the bipyramidal site are coloured in blue while the ones forming the tetrahedral site are coloured in orange. The other phosphorus atoms are shown in green while the Ca2+ ions are shown in turquoise. Water molecules and the oxygen atoms of the HPO42− ions are not shown for clarity. | ||
On the other hand, a large number of the calcium ions in the final structure are coordinated by either three or four Ow atoms. These ions are found at the surface of the aggregate and make up ∼58% of the Ca2+ ions, showing the importance of the interface, which at this size dominates the aggregate. Overall, the final phase that formed by the end of the simulation (175 ns) was amorphous and hydrated with 2.5 water molecules in the coordination shell of the calcium ions.
d. Stability of small clusters
As the current simulations were run under high supersaturation, an aggregate composed of eight formula units that formed during the initial stage of the simulation was extracted and solvated at a concentration of 10 mM to verify its stability. It is important to note that this concentration includes all the ions in the cluster. No additional ion was present in solution, thus the real concentration of solutes in solution is actually zero. Additional simulations were performed on the same aggregate after randomly removing one or two Ca2+ ions to investigate the effect of the charge on the stability of the cluster. Fig. 6a–c display the cluster structure at the end of the simulation, while Fig. 6d–f show the evolution of the Ca–P and Ca–Ca coordination numbers for Fig. 6a–c, respectively. The [Ca8(HPO4)8] and [Ca7(HPO4)8]2− aggregates (Fig. 6a and b) remained stable for all the simulation time; the Ca–P CN even tended to increase slightly (Fig. 6d and e). In contrast, the [Ca6(HPO4)8]4− aggregate split in two, with a Ca(HPO4)22− complex detaching and diffusing away, while the rest of the aggregate remained intact for the rest of the simulation and displayed a tendency to densify with Fig. 6f showing a slight increase in the Ca–Ca CN occurring at the end of the simulation. | ||
| Fig. 6 a)–c) show snapshots of the [Ca8(HPO4)8], [Ca7(HPO4)8]2−, [Ca6(HPO4)8]4− aggregates (in the third case the aggregate breaks into two, a [Ca(HPO4)2]2− and a [Ca5(HPO4)6]2− particle) at the end of the simulation. d)–f) display the average Ca–P and Ca–Ca coordination number during the simulation of a)–c), respectively. In a)–c) the phosphorus atoms are shown in green, the Ca2+ ions in turquoise, the oxygens of the HPO42− ions in red and the oxygens of the water molecules present in the coordination shell of the Ca2+ ion in dark blue. | ||
Whereas previous simulations have shown that metastable nanoparticles of similar size to the ones described above could display significant changes (including dissolution) when simulated at infinite dilution, 30 ns could be too short for certain processes to be seen.14,29 Therefore, umbrella-sampling simulations were used to extract the free energy of attachment as a function of distance of a Ca2+ ion, a HPO42− ion, an ion pair and a cluster to the [Ca8(HPO4)8] neutral cluster described above. The results are presented in Fig. 7a–d. In all cases a (meta)stable state is observed at close distances (displayed graphically in Fig. 8a–d), demonstrating that these nanoparticles are indeed stable and can continue to grow. In Fig. 7a–d, the free energy curve also displays a solvent shared state, which in the case of the HPO42− and Ca2+ ions is separated from the most stable state by a barrier of a few kJ mol−1. There does not seem to be a barrier in the case of attachment of the ion pair and the nanoparticle.
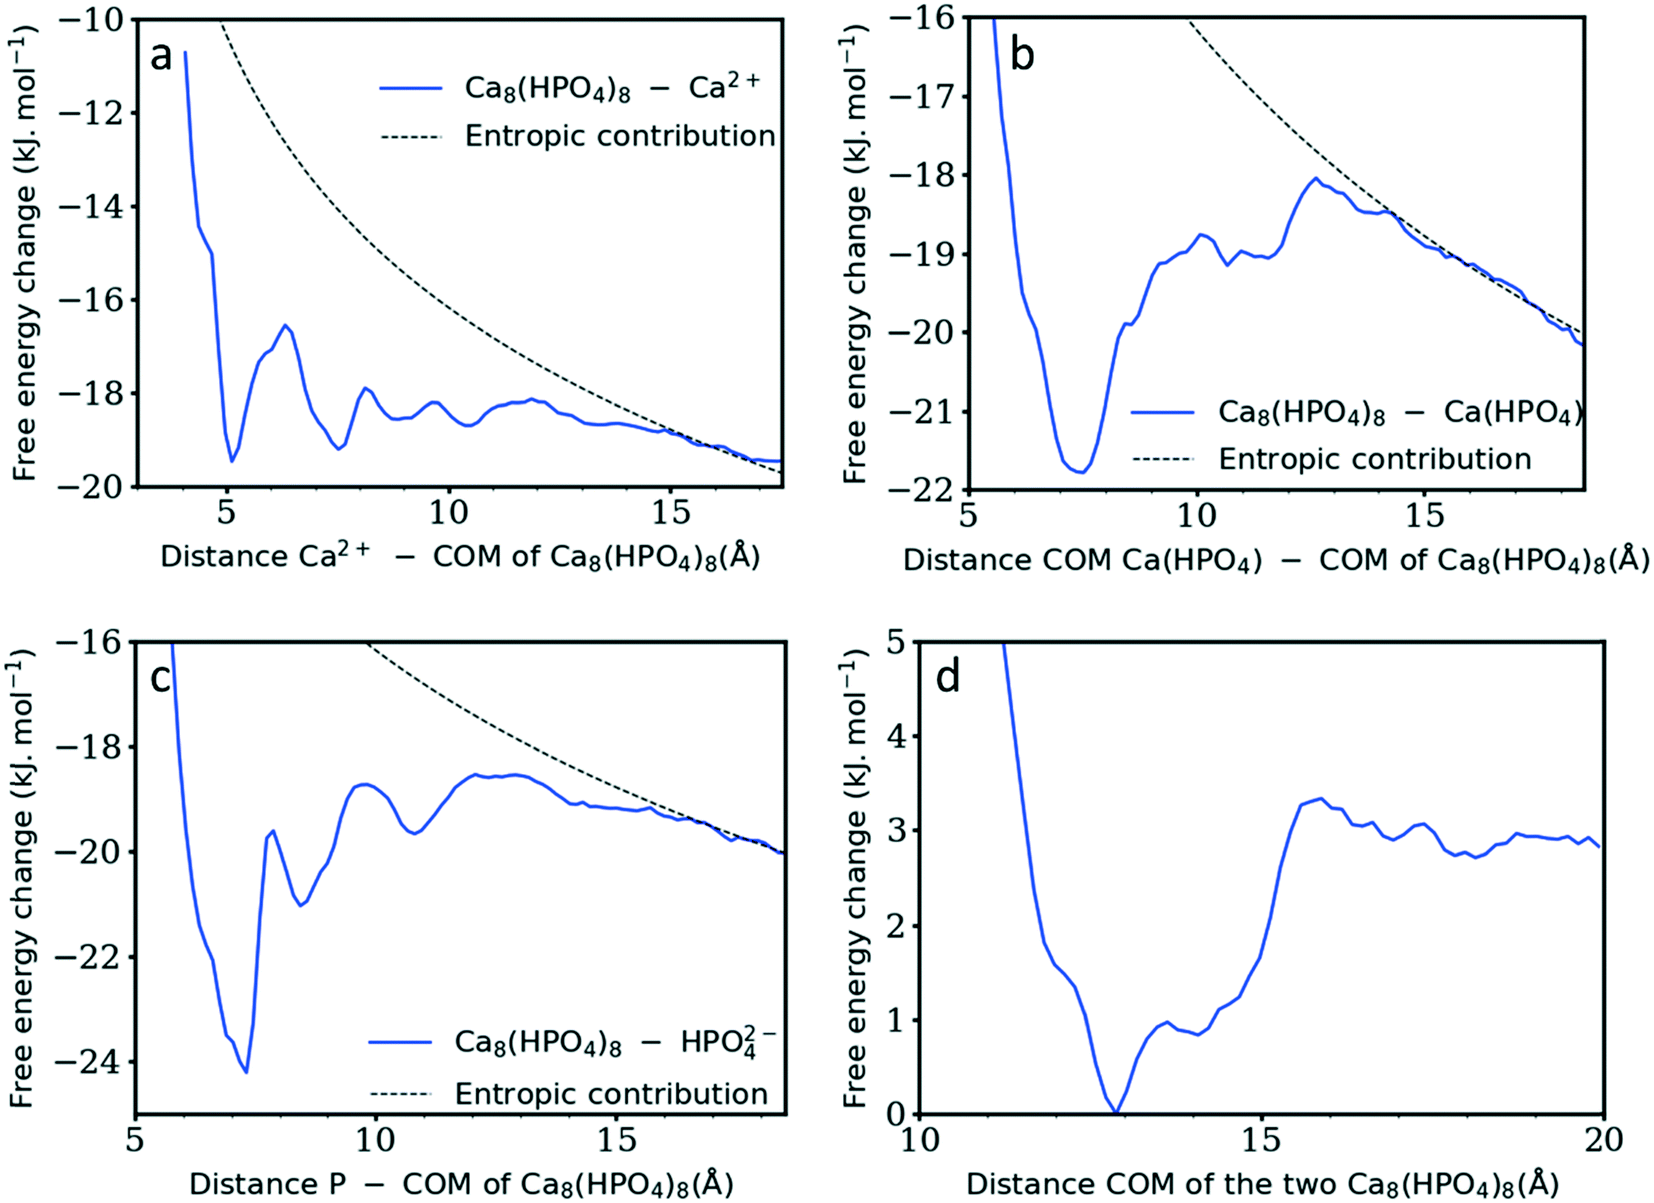 | ||
| Fig. 7 Gibb's free energy change as a function of the distance between the neutral cluster described above [Ca8(HPO4)8] and a) a Ca2+ ion, b) a Ca(HPO4), c) a HPO42− ion and d) [Ca8(HPO4)8]. The dashed black line represents the configurational entropy. In the x-axis title, COM stands for centre of mass. | ||
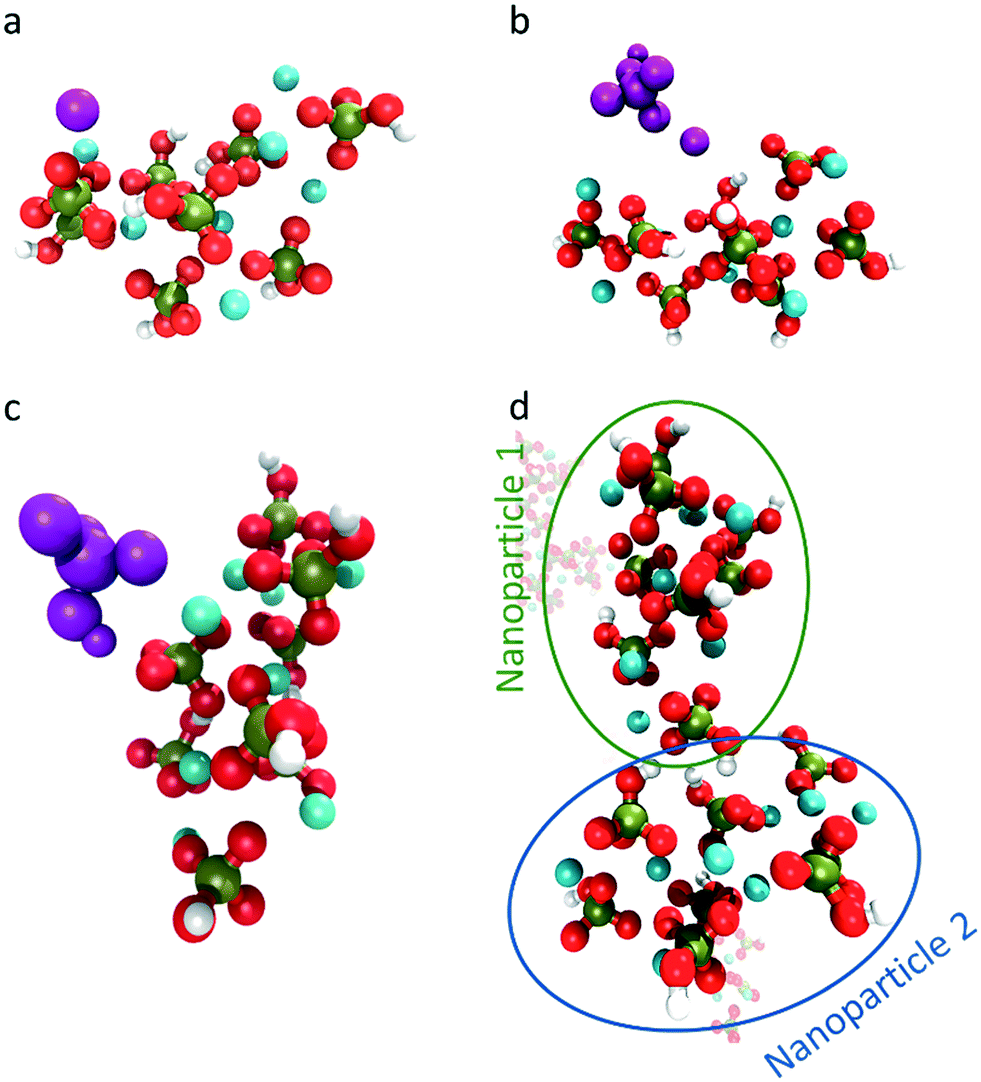 | ||
| Fig. 8 Snapshot of the interactions observed at the minimum in the free energy curve for the interaction between the neutral cluster [Ca8(HPO4)8] and a) a Ca2+ ion, b) a Ca(HPO4), c) a HPO42− ion and d) [Ca8(HPO4)8]. In the image, the Ca2+ is coloured in cyan, phosphorous in green, oxygen in red and hydrogen in white. The interacting Ca2+, HPO42− and Ca(HPO4) have been coloured in purple to differentiate them from the initial cluster. | ||
Table 1 summarises the free energy changes for the different reactions and shows that, thermodynamically, the most favourable process is the attachment of a HPO42− ion, with a change of −10.8 kJ mol−1 between the bound and the solvent separated states. The attachment of a Ca2+ ion and an ion pair is slightly less favourable with a value of −9.1 kJ mol−1. Surprisingly, the attachment of another cluster is also favourable with a free energy change of approximately −3 kJ mol−1. This is a small change however, no barrier is present on the free energy curve for the formation of this larger complex. The minimum in the free energy curve is found at approximately 13 Å. At this distance, the two clusters interact via three hydrogen bonds that form between two hydrogen phosphate groups. This supports the observation of Habraken et al. that the inorganic calcium phosphate chains were seen before the precipitation of amorphous calcium phosphate.3
| Species interacting with Ca8(HPO4)8 | Ca2+ | HPO42+ | Ca(HPO4) | Ca8(HPO4)8 |
|---|---|---|---|---|
| Gibbs free energy (kJ mol−1) | −9.2 | −10.8 | −9.1 | ≈−3 |
Another interesting question for calcium phosphate nanoclusters is whether an amorphous arrangement is more or less stable than one more closely resembling a bulk crystal. To test this possibility, a fragment of monetite ([Ca8(HPO4)8]) was simulated for 20 ns. The structure of this fragment at the beginning of the simulation is presented in Fig. S1a,† where the ordered arrangement of the ions is clearly visible. After 20 ns of simulation this organisation is lost and the ions rearrange into a droplet like structure where the hydrogen of the HPO42− ions forms hydrogen bonds with the water molecules rather than with each other.
Discussion
While the formation of larger complexes in calcium phosphate solution was hypothesized more than 40 years ago, recent experimental investigations have highlighted that their composition might be considerably different from that which was previously believed.3–6,9 Indeed, the high concentration simulation reported above agrees with recent experiments and demonstrates that calcium and phosphate ions initially form calcium-deficient negatively-charged clusters. The Ca/P ratio obtained for the first 30 ns of simulation time, where the average Ca–P coordination number is less than or equal to two, increased from 0.75 to 0.8. Quantitatively and qualitatively, this ratio agrees well with recent experimental observations. Xie et al. and Zhang et al. both proposed that in the pre-nucleation stage the species in solution could be described as [Ca(HPO4)1+x·nH2O]2x− clusters (Zhang et al. suggested that x could be either 1 or 2 while Xie et al. did not report a value).4,9 If we consider the clusters proposed by Zhang et al., and assume that these species exist in approximately the same concentrations, this would give a Ca/P ratio of 0.75, which is within the range of our results reported for the first 30 ns of simulation time. Recently, Habraken et al. proposed that a more negative unit exists in solution, [Ca(HPO4)3]4−, where the Ca/P ratio is 0.33, considerably lower than our current results.3 Their solution, however, contained a higher concentration of counter ions (Na+, Cl− and TRIS+) than those of Xie et al. and Zhang et al. These will have an impact on the association of Ca2+ and HPO42− ions, shielding the large negative charge of the proposed complexes and potentially favouring its formation. Nevertheless, experiments and simulations agree that generally Ca2+ and HPO42− ions interact to form calcium deficient species.After the initial formation of clusters, the further growth of the largest cluster is driven by their aggregation and slow densification. During the first 40 ns of simulation time, the clusters that form have a Ca–P coordination number starting from 1.3 and increasing to 2.5. The clusters share some similarities with the pre-nucleation clusters proposed for calcium carbonate.12 In both cases they form linear chain-like structures, but in the calcium carbonate system, it was proposed that the chains were composed of alternating Ca2+ and CO32− ions, while here the Ca2+ ions can be surrounded by up to three HPO42− ions (Fig. 3) explaining the increase in the number of atoms having a CN of three.
After this initial period, the largest cluster continues to grow by the aggregation of clusters of different sizes. This agrees with recent observations that mineral formation and growth often occur through particle–particle attachment, as also proposed for supersaturated solutions of calcium phosphate.3,4,30,31 In the present simulations, this process leads to an increase in the Ca–P and P–Ca coordination numbers, while that for Ca–Ow slowly decreases. The final structure showed an average of 6.5 oxygen atoms in the shell of the Ca2+ ions. 2.5 of these oxygen atoms come from water molecules and 4 come from the (average of 3) HPO42− ions found in the shell of the Ca2+ ions. These numbers are lower than the ones previously reported from EXAFS analysis of ACP.32,33 Experimentally it was found that Ca2+ was coordinated by eight oxygen atoms. Two of those oxygen atoms were from two water molecules while six come from four phosphate anions.32,33 The difference in the numbers, however, can be reconciled by taking into account that the cluster formed here is composed at most of 90 CaHPO4 units. Therefore, as discussed in the results section, a large number of the ions will sit at the water interface, even for the largest cluster. Nonetheless, already in this structure, the numbers of water molecules and the numbers of hydrogen phosphate anions coordinating calcium cations are similar to the ones observed experimentally. It is likely that in the presence of additional ions or clusters the simulated structure would grow and condense, leading to an increased interaction between the calcium and hydrogen phosphate ions.
The observation that the growth of the largest clusters proceeds by the aggregation of complexes could be completely at odds with classical nucleation theory. However, this need not be the case. A number of recent investigations proposed that the formation of these clusters and their subsequent aggregation could resolve the discrepancies between values for quantities like the critical radius and work of nucleation calculated using classical nucleation theory and the actual experimental measurements.3,18 They hypothesized that the clusters will have a size-dependent interfacial energy that would lead to an excess free energy that should be taken into account when calculating the critical radius and free energy barrier.3 In those cases it was assumed that the cluster energies were higher than the energies of the equivalent number of ions in solution. This disagrees with the description provided by Xie et al., who suggested that the system with ions in solution was higher in energy than the first ACP precipitate.4 The current simulations suggest that small aggregates of calcium and phosphate ions are stable in solution and thus agree with the view of Xie et al.4 After 20–30 ns of simulation at a concentration similar to experiment, the separation of a Ca(HPO4)22− unit from a cluster was observed in only one case – after the removal of two random calcium ions creating a highly negatively charged cluster. In the other cases, the cluster slightly densified during the simulation. These neutral and negatively charged clusters are therefore stable in solution, at least over the time scales probed. Free energy simulations using umbrella sampling showed that these clusters could actually continue to grow in agreement with the mechanism proposed by Xie et al. Attachment of ions, ion pairs and an additional cluster led to a favourable free energy of binding suggesting that these aggregates are indeed more stable than the ions in solution or the ion pairs. Of the different species probed, the attachment of a HPO42− ion was the most favourable, further corroborating the observation that negatively charged particles are thermodynamically preferred over neutral or positively charged clusters.
Over similar timescales and concentrations, 20 to 50 formula units of calcium carbonate aggregate were recently observed to dissolve into ion pairs and small complexes.14 Therefore, that aggregate must be less stable than the aggregate composed of calcium hydrogen phosphate sampled here. This is somewhat surprising given that the free energy of the formation of a CaCO3 ion pair is more exergonic than CaHPO4 with values of −22 kJ mol−1 and −17.9 kJ mol−1, respectively.20,34 A reason for the differences observed might be the geometry of the anion involved. The carbonate has a trigonal planar geometry while the hydrogen phosphate is tetrahedral. This will affect the network that forms in the aggregates; the tetrahedral hydrogen phosphate ions could lead to denser structures and better cluster connectivity. Another possible explanation is the different ways that the ions affect the water structure around the clusters. However, it is difficult to compare the impact of a carbonate or a phosphate ion on the water structure in these aggregates. In the calcium carbonate system, the aggregates are dynamical and unstable, rearranging over the course of the simulation and inclined to dissolve into ion pairs and small complexes.12,14 Comparison of the tetrahedral order parameter of water around a CO32− and a HPO42− ion did not show large differences, even though the first two peaks were closer to the value found for bulk water in the case of HPO42− (Fig. S2†).35 Additionally, in a recent paper, it was found that the organisation of water around the carbonate anion is asymmetrical.36 Water molecules formed a hydrogen bond to all the carbonate oxygens, but along the axis perpendicular to the plane formed by the oxygen atoms there was a significantly lower water density, exhibiting characteristics of a hydrophobic environment.36 This could have an important impact on the surface energy of clusters and influence their stability. In contrast, the hydrogen phosphate anion with its tetrahedral structure can form hydrogen bonds with water molecules on all sides of its structure, and is unlikely to show the same anisotropy as the carbonate ion.
Conclusion
In conclusion the results show that, in solutions supersaturated with calcium and hydrogen phosphate ions, amorphous clusters grow through a combination of ion attachment and the aggregation of negatively charged clusters with different sizes. Aggregation via this mechanism explains the TEM observations of Xie et al., that the nanoparticles imaged at the start of the reaction increased in size even though the concentration of calcium ions remained constant. Additionally, the current simulations showed that small clusters of 16 ions participating in this process are stable at experimental concentrations, and in contrast to calcium carbonate, appear to densify rather than dissolve.14 Free energy calculations demonstrated that these clusters were more stable than free ions. Moreover, also the attachment of an additional cluster displayed a clear minimum indicating that particle by particle growth is possible in calcium phosphate solutions. Depending on the solution properties, the mechanisms leading to the precipitation of calcium phosphate minerals could therefore lie on a pathway that is different from the ones currently envisaged by classical nucleation theory.During the large-scale simulation, the clusters displayed different sizes and compositions, suggesting that trying to define a universal cluster type for this system can be misleading. Depending on the solution concentration, ratio of the ions and the presence of solutes, different clusters types could form. The overall energy landscape of these clusters seems to be composed of many metastable states separated by small barriers, leading to a variety of potential species forming in solution. While their size and composition may change, both experiments and simulations agree that calcium and phosphate ions tend to prefer to aggregate into negatively charged units.
Conflicts of interest
The authors declare no conflict of interests.Acknowledgements
J. H. H., C. L. F., and R. I. M. acknowledge the Engineering and Physical Sciences Research Council (grant numbers EP/I001514/1 and EP/R018820/1) that funds the Materials Interface with Biology (MIB) consortium and the Crystallisation in the Real World consortium respectively. This grant also provided part of the computational resources that were used during the project by giving access to ARCHER. Access to the facilities of ARCHER was also provided through the authors membership of the U.K.’s HPC Materials Chemistry Consortium, which is funded by EPSRC (grant number EP/L000202). ARCHER is the U.K.’s national high-performance computing service, which is funded by the Office of Science and Technology through EPSRC's High End Computing Program. This work was also supported by a grant from the Swiss National Supercomputing Centre (CSCS) under project ID S734 and S871. R. I. M. also thanks an Empa internal grant that is currently funding his work (Project number 5213.00156).References
- S. V. Dorozhkin, Acta Biomater., 2010, 6, 4457–4475 CrossRef CAS PubMed.
- J. Mahamid, A. Sharir, L. Addadi and S. Weiner, Proc. Natl. Acad. Sci. U. S. A., 2008, 105, 12748–12753 CrossRef CAS PubMed.
- W. J. E. M. Habraken, J. Tao, L. J. Brylka, H. Friedrich, L. Bertinetti, A. S. Schenk, A. Verch, V. Dmitrovic, P. H. H. Bomans, P. M. Frederik, J. Laven, P. Van Der Schoot, B. Aichmayer, G. De With, J. J. DeYoreo and N. A. J. M. Sommerdijk, Nat. Commun., 2013, 4, 1507 CrossRef PubMed.
- B. Xie, T. J. Halter, B. M. Borah and G. H. Nancollas, Cryst. Growth Des., 2014, 14, 1659–1665 CrossRef CAS PubMed.
- A. S. Posner and F. Betts, Acc. Chem. Res., 1975, 8, 273–281 CrossRef CAS.
- K. Onuma and A. Ito, Chem. Mater., 1998, 10, 3346–3351 CrossRef CAS.
- G. Treboux, P. Layrolle, N. Kanzaki, K. Onuma and A. Ito, J. Am. Chem. Soc., 2000, 122, 8323–8324 CrossRef CAS.
- G. Mancardi, C. E. Hernandez Tamargo, D. Di Tommaso and N. H. de Leeuw, J. Mater. Chem. B, 2011, 5, 7274–7284 RSC.
- Q. Zhang, Y. Jiang, B. Di Gou, J. Huang, Y. X. Gao, J. T. Zhao, L. Zheng, Y. D. Zhao, T. L. Zhang and K. Wang, Cryst. Growth Des., 2015, 15, 2204–2210 CrossRef CAS.
- T. J. Lin and C. C. Chiu, Phys. Chem. Chem. Phys., 2017, 20, 345–356 RSC.
- D. Gebauer, A. Voelkel and H. Coelfen, Science, 2008, 322, 1819–1822 CrossRef CAS PubMed.
- R. Demichelis, P. Raiteri, J. D. Gale, D. Quigley and D. Gebauer, Nat. Commun., 2011, 2, 591 CrossRef PubMed.
- D. Gebauer, M. Kellermeier, J. D. Gale, L. Bergström and H. Cölfen, Chem. Soc. Rev., 2014, 43, 2348–2371 RSC.
- P. J. M. Smeets, A. R. Finney, W. J. E. M. Habraken, F. Nudelman, H. Friedrich, J. Laven, J. J. De Yoreo, P. M. Rodger and N. A. J. M. Sommerdijk, Proc. Natl. Acad. Sci. U. S. A., 2017, 201700342 Search PubMed.
- N. Kanzaki, G. Treboux, K. Onuma, S. Tsutsumi and A. Ito, Biomaterials, 2001, 22, 2921–2929 CrossRef CAS PubMed.
- L. Wang, S. Li, E. Ruiz-Agudo, C. V. Putnis and A. Putnis, CrystEngComm, 2012, 14, 6252–6256 RSC.
- G. Treboux, P. Layrolle, N. Kanzaki, K. Onuma and A. Ito, J. Phys. Chem. A, 2000, 104, 5111–5114 CrossRef CAS.
- Q. Hu, M. H. Nielsen, C. L. Freeman, L. M. Hamm, J. Tao, J. R. I. Lee, T. Y. J. Han, U. Becker, J. H. Harding, P. M. Dove and J. J. De Yoreo, Faraday Discuss., 2012, 159, 509–523 RSC.
- S. Plimpton, J. Comput. Phys., 1995, 117, 1–19 CrossRef CAS.
- R. Demichelis, N. A. Garcia, P. Raiteri, R. Innocenti Malini, C. L. Freeman, J. H. Harding and J. D. Gale, J. Phys. Chem. B, 2018, 122, 1471–1483 CrossRef CAS PubMed.
- E. Busenberg and L. Niel Plummer, Geochim. Cosmochim. Acta, 1989, 53, 1189–1208 CrossRef CAS.
- X. Yang, M. Wang, Y. Yang, B. Cui, Z. Xu and X. Yang, Phys. Chem. Chem. Phys., 2019, 21, 14530–14540 RSC.
- Y. Wu, H. L. Tepper and G. A. Voth, J. Chem. Phys., 2006, 124, 024503 CrossRef PubMed.
- L. Martinez, R. Andrade, E. G. Birgin and J. M. Martínez, J. Comput. Chem., 2009, 30, 2157–2164 CrossRef CAS PubMed.
- N. E. R. Zimmermann, B. Vorselaars, D. Quigley and B. Peters, J. Am. Chem. Soc., 2015, 137, 13352–13361 CrossRef CAS PubMed.
- G. A. Tribello, M. Bonomi, D. Branduardi, C. Camilloni and G. Bussi, Comput. Phys. Commun., 2014, 185, 604–613 CrossRef CAS.
- A. Grossfield, WHAM: the weighted histogram analysis method, http://membrane.urmc.rochester.edu/content/wham Search PubMed.
- P. Raiteri, R. Demichelis and J. D. Gale, J. Phys. Chem. C, 2015, 119, 24447–24458 CrossRef CAS.
- B. Q. Lu, N. A. Garcia, D. M. Chevrier, P. Zhang, P. Raiteri, J. D. Gale and D. Gebauer, Cryst. Growth Des., 2019, 19, 3030–3038 CrossRef CAS.
- J. J. De Yoreo, P. U. P. A. Gilbert, N. A. J. M. Sommerdijk, R. L. Penn, S. Whitelam, D. Joester, H. Zhang, J. D. Rimer, A. Navrotsky, J. F. Banfield, A. F. Wallace, F. M. Michel, F. C. Meldrum, H. Cölfen and P. M. Dove, Science, 2015, 349 Search PubMed.
- A. Dey, P. H. H. Bomans, F. A. Müller, J. Will, P. M. Frederik, G. De With and N. A. J. M. Sommerdijk, Nat. Mater., 2010, 9, 1010–1014 CrossRef CAS PubMed.
- C. Holt, M. J. J. M. Van Kemenade, L. S. Nelson, D. W. L. Hukins, R. T. Bailey, J. E. Harries, S. S. Hasnain and P. L. De Bruyn, Mater. Res. Bull., 1989, 24, 55–62 CrossRef CAS.
- D. W. L. Hukins, J. Dairy Res., 1989, 56, 411–416 CrossRef.
- P. Raiteri and J. D. Gale, J. Am. Chem. Soc., 2010, 132, 17623–17634 CrossRef CAS PubMed.
- J. R. Errington and P. G. Debenedetti, Nature, 2001, 409, 318–321 CrossRef CAS PubMed.
- S. Yadav and A. Chandra, J. Phys. Chem. B, 2018, 122, 1495–1504 CrossRef CAS PubMed.
Footnote |
| † Electronic supplementary information (ESI) available. See DOI: 10.1039/c9ce00658c |
| This journal is © The Royal Society of Chemistry 2019 |