
 Open Access Article
 This Open Access Article is licensed under a
 Creative Commons Attribution 3.0 Unported Licence
An XRD and NMR crystallographic investigation of the structure of 2,6-lutidinium hydrogen fumarate†
Emily K.
Corlett
a,
Helen
Blade
b,
Leslie P.
Hughes
 b,
Philip J.
Sidebottom
c,
David
Walker
a,
Richard I.
Walton
d and
Steven P.
Brown
*a
b,
Philip J.
Sidebottom
c,
David
Walker
a,
Richard I.
Walton
d and
Steven P.
Brown
*a
aDepartment of Physics, University of Warwick, Coventry, CV4 7AL, UK. E-mail: S.P.Brown@warwick.ac.uk
bPharmaceutical Development, AstraZeneca, Macclesfield, SK10 2NA, UK
cSyngenta, Jealott's Hill, RG42 6EY, UK
dDepartment of Chemistry, University of Warwick, Coventry, CV4 7AL, UK
First published on 14th May 2019
Abstract
Fumarate is a pharmaceutically acceptable counterion often used to modify the biophysical properties of active pharmaceutical ingredients (APIs) through salt formation. With 2,6-lutidine (2,6-dimethylpyridine), fumaric acid forms the salt 2,6-lutidinium hydrogen fumarate. An NMR crystallography approach was employed to investigate the salt structure and the intermolecular interactions involved in its formation and stability. The crystallographic unit cell was determined by both single crystal XRD (SXRD) and synchrotron powder X-ray diffraction (PXRD) to contract at low temperature with a skew in the β angle. Density functional theory (DFT)-based geometry optimisations were found partially to replicate this. A second room temperature structure was also identified which exhibited a similar skew of the β angle as the low temperature structure. DFT calculation was also employed, alongside 2D 1H double-quantum (DQ) magic angle spinning (MAS) and 14N–1H HMQC MAS NMR spectra, to investigate the hydrogen bonding network involved in the structure. DFT-based gauge-including projector-augmented wave (GIPAW) calculations highlighted both strong N+–H⋯O− and O–H⋯O intermolecular hydrogen bonds between the molecules, as well as several weaker CH⋯O hydrogen bonds. Both PXRD and solid-state MAS NMR, supported by thermal gravimetric analysis (TGA) and solution-state NMR analysis, show formation of fumaric acid within samples over time. This was evidenced by the identification of reflections and peaks associated with crystalline fumaric acid in the PXRD pattern and in 1H MAS and 13C cross polarization (CP) MAS solid-state NMR spectra, respectively.
Introduction
The analytical characterisation of the solid-state structures adopted by an active pharmaceutical ingredient (API) or agrochemical ingredient (AI) is an important step in the process of optimising the design and efficacy of products. A key area of research pertains to methods of enhancing an API's and AI's physical properties without detrimentally affecting its bioactivity. Increasingly, the APIs being developed are larger and more insoluble.1,2 Thus, developing approaches to improve their solubility and rate of dissolution are of particular importance. The development of salt forms offers the possibility of altering biophysical properties,3 such as solubility, bioavailability and stability, although other methods for enabling formulation like co-crystallisation and rendering the material amorphous are also employed.2–6 Salts and cocrystals are often distinguished by their ionicity, with cocrystals containing neutral molecules.One formal definition of a cocrystal, according to Dunitz,7 also includes solvates, although they can alternatively be defined separately by the physical distinction that one of the components is liquid at room temperature.4,8 Solvates are intrinsically unstable and generally undergo some form of phase change close to room temperature,8 making both their use and characterisation more challenging. They are still of interest though, as they represent another potential route to additional biologically active forms that may have desirable properties. The characterisation of such systems may also be relevant in cases where an API/AI is liquid at room temperature, but it is preferable to be able to store or administer it in solid form (for cost, convenience and/or ease of use).
Traditionally, X-ray diffraction (XRD) is employed for structure determination of crystalline materials. Single crystal XRD (SXRD) is the gold standard for organic molecules, with powder XRD (PXRD) mainly used to fingerprint or refine the resulting structure. However, where suitable single crystals are not available, structure determination has been achieved from powder patterns.9–14 Distinguishing between salts and cocrystal forms by XRD can be difficult, however, as it is inherently insensitive to low atomic number elements. As a result, it is not always possible to provide accurate proton positions, particularly if the quality of single crystals is poor.6 This limits the ability of XRD to give a detailed representation of the intermolecular interactions present within a system. A more thorough investigation of these interactions can inform how the crystal structure is being held together, aiding in the development of methods to reliably predict the stability of multicomponent solid forms.8
NMR crystallography15–19 is a growing field in which solid-state NMR, under magic-angle spinning (MAS), and calculations of NMR parameters from first principles using density functional theory (DFT), notably the gauge-including projector-augmented wave (GIPAW) method, are combined.20,21 It complements other techniques (generally XRD) to either facilitate structure determination,9,16,22–24 interrogate the nature of both weak and strong intermolecular interactions25–28 or investigate the structure of localised disorder within systems.29 NMR crystallography of organic systems benefits particularly from the intrinsic sensitivity of 1H chemical shifts to local interactions.30
In this work, NMR, XRD and DFT are combined and utilised to investigate the intermolecular interactions and stability of 2,6-lutidinium hydrogen fumarate.31 Fumarate is a pharmaceutically acceptable counterion for salt formation and is already employed to improve the properties of various APIs, including ferrous iron, bisoprolol and tenofovir disoproxil.32 Fumaric acid is a crystalline solid at room temperature and can exist in a variety of crystal forms with different isomers of lutidine, as investigated by Haynes et al.33 Conversely, 2,6-lutidine is liquid at room temperature, which allows the system to be described as either a API/AI-fumarate or as a solvate.
Experimental
Sample preparation
All chemicals were obtained from Sigma Aldrich (UK) at purities of 98% or higher and used without further purification. Purity was verified by 1H solution-state NMR. Fumaric acid was dissolved in isopropanol and 2,6-lutidine was added in a 1![[thin space (1/6-em)]](https://www.rsc.org/images/entities/char_2009.gif) :1 molar ratio. Samples were made on a ∼50 mg scale with 24 mg fumaric acid and 26 μL 2,6-lutidine (with density 0.92 mg L−1). Crystallisation was achieved by slow solvent evaporation over approximately 4 days.
:1 molar ratio. Samples were made on a ∼50 mg scale with 24 mg fumaric acid and 26 μL 2,6-lutidine (with density 0.92 mg L−1). Crystallisation was achieved by slow solvent evaporation over approximately 4 days.
Calculations
Density functional theory (DFT) calculations were performed using CASTEP34 Academic Release version 16.1. All calculations used the Perdew Burke Ernzerhof (PBE) exchange correlation functional,35 a plane-wave basis set with ultrasoft pseudopotentials and a plane-wave cut-off energy of 700 eV. Integrals over the Brillouin zone were taken using a Monkhorst–Pack grid of minimum sample spacing 0.1 × 2π Å−1 (see Fig. S1† for convergence of energy with decreasing spacing). The literature structure,31 which was recorded at 292 K, was downloaded from the Cambridge Crystallographic Data Centre (CCDC),36 CCDC ref.: MIBYEB, no.: 181445. For all structures for which the NMR parameters were calculated, geometry optimisation was performed with the unit cell parameters fixed. Geometry optimisations were also run for each structure allowing the unit cell parameters to vary, with a dispersion correction applied under the scheme proposed by Tkatchenko and Scheffler.37 MOGUL38 searches were performed both before and after geometry optimisation to ensure that the bond lengths, torsion and angles were consistent with the CCDC database. Distances stated in this paper are for the DFT optimised structure calculated with fixed unit cell (unless otherwise stated).NMR parameters were calculated using the GIPAW method and were performed for both the geometry optimised crystal structures as a whole and for each of the isolated molecules in the asymmetric unit. For the isolated molecule calculations, each molecule in the asymmetric unit was extracted from the geometry optimised unit cell and placed in a sufficiently large box such that it could not interact with repeated molecules across periodic boundary conditions28 (unit cell dimensions increased by 10 Å in each direction). As each individual molecule carried a charge, this was specified in the param file.39
The calculated isotropic chemical shifts (δcalciso) were determined from the calculated chemical shieldings (σcalc) by (δcalciso) = σref − σcalc, with σref values of 30.5, 169.7 and −153 ppm for 1H, 13C and 14N, respectively. σref was determined for 1H and 13C by taking the sum of the experimental chemical shift and the GIPAW calculated absolute isotropic chemical shieldings. The resulting y-intercept was taken as σref.40,41 A literature value was used for 14N.42 It is noted that it is common practice to calculate a specific reference shielding for each system43 (see, e.g., Table S8 of ref. 43), though average values over a range of compounds are also available.44 By comparing the parameters in the full crystal structure with those for the isolated molecule, insight is provided into the intermolecular interactions responsible for maintaining the crystal structure.45
XRD
Crystals were initially selected for SXRD using polarised light microscopy with an Olympus SZ61 stereomicroscope. Those that appeared by shape and birefringence to be single crystals were chosen. SXRD was carried out on a Rigaku Oxford Diffraction SuperNova diffractometer under Cu Kα1,2 (1.5418 Å) with an Atlas S2 CCD detector. Crystal screening was conducted at room temperature. CrysAlisPro46 data-collection and processing software was used, allowing crystals to be checked for quality and giving a preliminary unit cell determination by using a short pre-experiment prior to full data collection. This pre-experiment was used to screen a large number of crystals from each crystallisation, with full data collection only run if a discrepancy was identified between the experimental unit cell parameters and those found in the CCDC. Following full data collection, ShelXL47 was used for structure solution and a least-squares refinement was run, using the Olex2 (ref. 48) software. Temperatures down to 100 K were also employed to monitor the contraction of the unit cell.Following screening by SXRD, the most crystalline components of each crystallisation were ground to a fine powder and their structure was checked by PXRD to ensure no changes had occurred, by comparing the experimental powder pattern to the pattern predicted from the crystal structure. In house PXRD was performed on a Panalytical X'Pert Pro MPD equipped with a curved Ge Johansson monochromator, giving pure Cu Kα1 (1.5406 Å) radiation and a solid-state PiXcel detector. The powder was mounted on a zero-background offcut-Si holder, spinning at 30 rpm with a step size of 0.013° and a time per step of ∼750 s. Static transmission PXRD experiments were performed on a Xenocs Xeuss 2.0 SAXS diffractometer under Cu Kα1,2 radiation and a Pilatus 300 K area detector. The powders were loaded into 1.0 mm diameter borosilicate capillaries. High resolution PXRD patterns were collected on beamline I11 at the Diamond Light Source (DLS), UK, using a wavelength of 0.8249 Å. Powders were loaded into 0.7 mm diameter borosilicate capillaries, mounted on the beamline on a spinning brass holder. Diffraction patterns were recorded using both the position sensitive detector (PSD) and multi-analysing crystals (MAC). Half way through the MAC scans (20 min), the position of the capillary in the beam was moved to prevent sample degradation from the beam. PSD scans (∼2 min) were recorded at the starting position on the capillary before and after the MAC scan to check for any change. A comprehensive analysis of the powder patterns was undertaken using TOPAS Academic v6,49 which was used for Le Bail50 and Rietveld51 refinements.
NMR
1D 1H one-pulse, 1D 1H–13C cross-polarisation (CP) MAS and 2D 1H–13C heteronuclear correlation (HETCOR) experiments were performed on a Bruker Avance III spectrometer, operating at 1H and 13C Larmor frequencies of 500.0 MHz and 125.8 MHz, respectively. A 1.3 mm HXY probe in double resonance mode and a 4 mm HX probe was used for single-channel 1H and 1H–13C experiments, respectively. In all cases (except during CP), a 1H nutation frequency of 100 kHz was used corresponding to a 1H 90° pulse duration of 2.5 μs. A 1H one-pulse MAS spectrum was acquired with 16 coadded transients using a recycle delay of 100 s. A 13C CP MAS spectrum was acquired with 32 coadded transients, a CP contact time of 750 μs and a recycle delay of 78 s. A 2D 1H–13C HETCOR spectrum was acquired with 16 transients coadded for each of 72 t1 FIDs using a recycle delay of 78 s, a t1 increment of 80 μs and a CP contact time of 200 μs (corresponding to a total experiment time of 25 h). eDUMBO-122 (ref. 52 and 53) homonuclear decoupling was used with a 32 μs cycle, with 320 divisions of 100 ns each. The scaling factor was determined to be 1.8. In the HETCOR pulse sequence, the following phase cycling was employed: 1H 90° pulse (90° 270°), 13C CP contact pulse (2{0°} 2{180°} 2{90°} 2{270°}), receiver (0° 180° 180° 0° 90° 270° 270° 90°). For both CP MAS and HETCOR 1H–13C experiments, SPINAL64 (ref. 54) 1H heteronuclear decoupling was applied during the acquisition of the 13C FID, with a pulse duration of 5.9 μs at a nutation frequency of 100 kHz, and a 70 to 100% ramp55 on the 1H channel was used for the CP contact time with nutation frequencies of 47.5 and 60 kHz for 13C and 1H, respectively.2D 1H single quantum (SQ) spin-diffusion (NOESY-type), 2D 1H double quantum (DQ) with one rotor period of BaBa recoupling56,57 and 2D 14N–1H HMQC58–61 with R3 recoupling62,63 experiments were performed on a Bruker Avance II+ spectrometer, operating at 1H and 14N Larmor frequencies of 600.0 MHz and 43.4 MHz, respectively, using a 1.3 mm HXY Bruker probe in double resonance mode. They each employed a rotor synchronized t1 increment of 16.67 μs. A spin-diffusion spectrum was acquired with 4 coadded transients for each of 82 t1 FIDs using a recycle delay of 100 s and a spin-diffusion mixing time of 300 ms. A 1H DQ spectrum was acquired with 32 coadded transients for each of 224 t1 FIDs using a recycle delay of 10 s. A HMQC spectrum was acquired with 16 coadded transients for each of 240 t1 FIDs using a recycle delay of 60 s and 133 μs of R3 recoupling. The total experiment times were 9, 20 and 64 h, respectively. In 2D experiments, the States-TPPI method was employed for sign discrimination.64
13C and 1H chemical shifts are referenced with respect to tetramethylsilane (TMS) viaL-alanine at natural abundance as a secondary reference (1.1 ppm for the CH31H resonance and 177.8 ppm for the CO 13C resonance) corresponding to adamantane at 1.85 ppm (1H)65 and 38.5 ppm (13C).6614N shifts are referenced with respect to a saturated NH4Cl aqueous solution via spectra of L-β-aspartyl-L-alanine at natural abundance (−284 ppm for the lower NH resonance at a Larmor frequency of 43.4 MHz) corresponding to liquid CH3NO2 at 0 ppm.60,671H, 13C and 14N shifts can be experimentally determined to an accuracy of ±0.2, ±0.1 and ±5 ppm, respectively.
Solution-state NMR was carried out on a Bruker Avance III spectrometer operating at a 1H Larmor frequency of 400.0 MHz. Samples were dissolved in DMSO-d6 at a concentration of approximately 10 mg mL−1. 1D 1H one-pulse experiments were referenced to TMS via the residual solvent peak.
Results and discussion
XRD
Single crystals of 2,6-lutidinium hydrogen fumarate were successfully obtained by slow evaporation. Crystals exhibited a thin plate morphology and, upon closer inspection with an optical microscope, thicker regions of the specimen could be seen as stacks of multiple thin plates, with some evidence of intergrowths.To ensure that each sample was homogeneous, room temperature SXRD at 293 K was utilised to screen each crystallisation for unit cell variations and polymorphism. Most of the crystals found to be suitable for diffraction refined to the structure, published by Pan et al.31 (CCDC ref.: MIBYEB, no.: 181445, see Fig. 1). The single exception to this is discussed below. During the crystal screening, the unit cell of 181445 was also seen in many other crystals judged unsuitable for full data collection due to poor diffraction.
 | ||
| Fig. 1 Molecular structures of (a) 2,6-lutidinium and (b) hydrogen fumarate molecules with the atomic labels used in this work; (c) asymmetric unit of the DFT-optimised crystal structure of 2,6-lutidinium hydrogen fumarate (left) and stacking of the asymmetric units to form hydrogen-bonded chain structures (right); (d) packing of the unit cell viewed along the c axis. Carbon, oxygen, nitrogen and hydrogen atoms are shown as grey, red, purple/blue and white circles. | ||
For all the plate crystals analysed by SXRD, the (0 1 0) plane constituted the largest face, exhibiting least growth (Fig. S2†). This corresponds to a low drive for aligning the hydrogen-bonded fumarate chains (Fig. 1c) along the b axis. Conversely, the smallest crystal face, corresponding to the most favourable growth, relates to alignment of the chain structures along the a axis forming the (1 0 0) crystal plane. The growth of the chains themselves, that results in the stacks of lutidine molecules (Fig. 1c), is moderate.
Following grinding to a powder, room temperature PXRD patterns were run to ensure no changes had been induced during the grinding process. Fig. 2 shows the result of a Rietveld refinement against a high-resolution synchrotron scan of 2,6-lutidinium hydrogen fumarate carried out under ambient conditions with a Rbragg of 5.59%. As can be seen in Table 1, there is good agreement between the refined unit cell (MAC 300 K) and that of structure 181445 published by Pan et al.,31 with only small differences in the unit cell parameters consistent with the small difference in temperature between data collections. A more detailed comparison of atomic coordinates is presented in Table S1.†
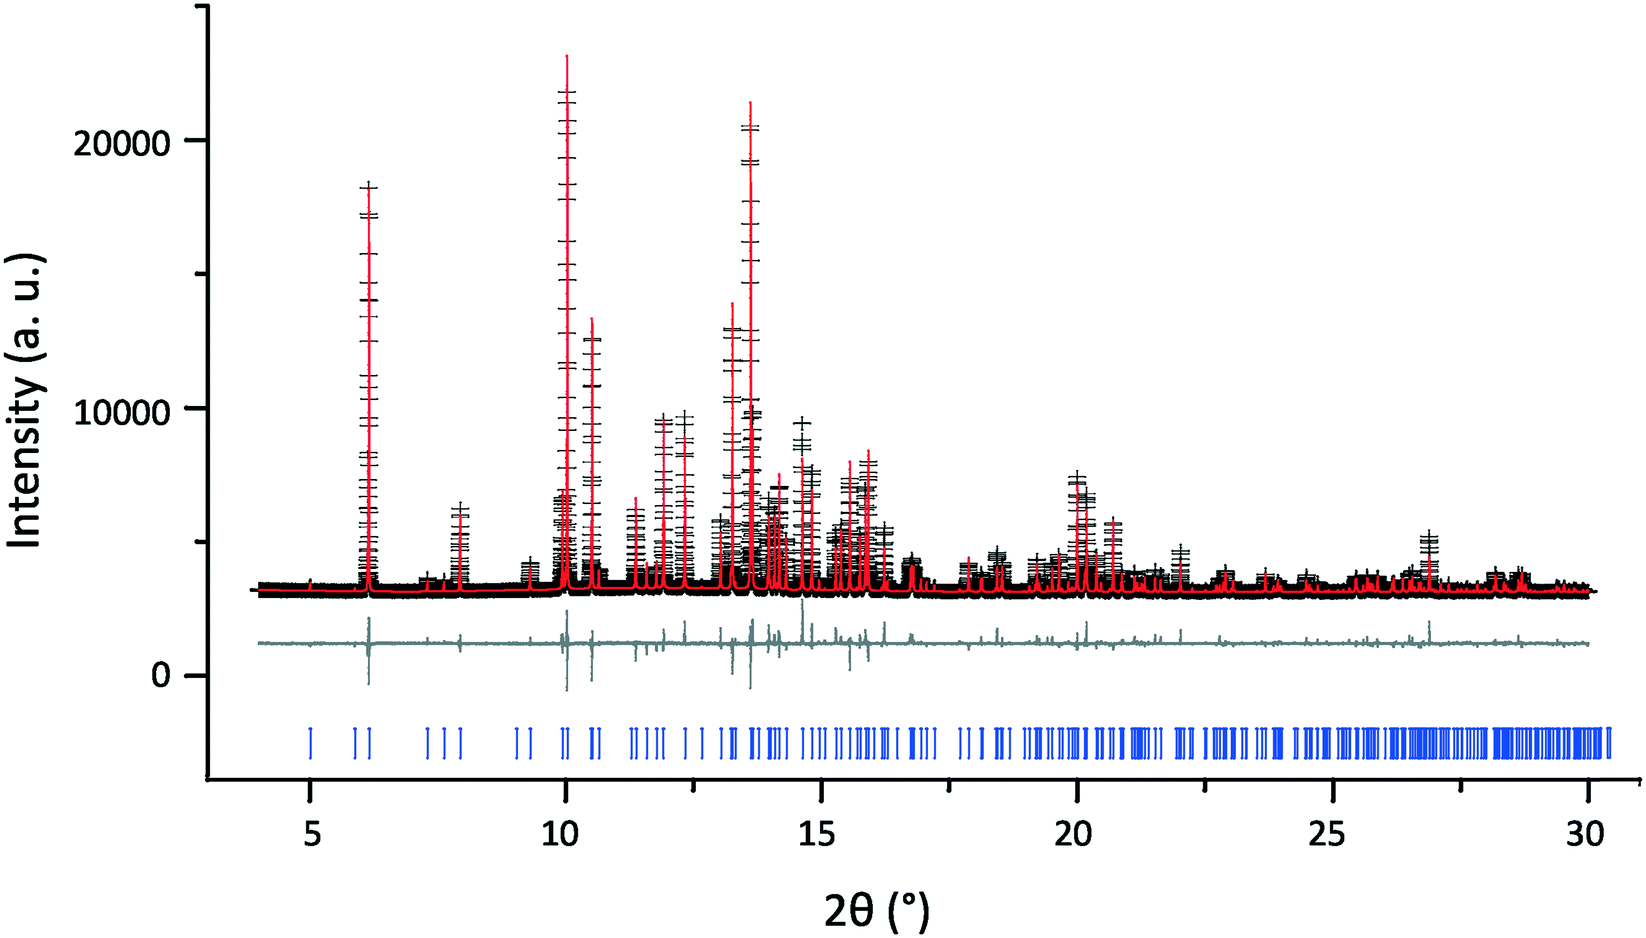 | ||
| Fig. 2 Final Rietveld fit for 2,6-lutidinium hydrogen fumarate at 300 K, λ = 0.8249 Å, showing the experimental (black crosses), calculated (red upper line) and difference (grey lower line) PXRD profiles. Tick marks (bottom) indicate allowed peak positions. For refinement parameters, see Tables 1, S1 and S2.† | ||
| a (Å) | b (Å) | c (Å) | β (°) | Volume (Å3) | Energyf (kJ mol−1) | |
|---|---|---|---|---|---|---|
| a Structure determined by Pan et al.31 (CCDC ref.: MIBYEB, 181445), R1 [I > 2σ(I)] = 4.05%. b Multi-analysing crystals, high resolution synchrotron scan. c R bragg = 5.59%. d R bragg = 4.7%. e Structure determined in this study, R1 [I > 2σ(I)] = 3.73%. f Relative to the structure of lowest energy (DFT 1876100). Note that the stated values correspond to a DFT geometry optimisation in CASTEP allowing atom positions and unit cell parameters to vary. For a geometry optimisation with fixed unit cells, the DFT 181445 structure has a lower energy by 4.1 kJ mol−1. | ||||||
| 181445a (292 K) | 9.898(2) | 15.347(2) | 7.4970(10) | 107.810(10) | 1084.3(3) | — |
| MACb,c (300 K) | 9.906752(18) | 15.35923(3) | 7.501959(12) | 107.78973(12) | 1086.917(4) | — |
| MACd (100 K) | 9.83096(4) | 15.16926(8) | 7.48196(3) | 108.8946(3) | 1055.651(9) | — |
| DFT 181445 | 9.8382 | 15.3210 | 7.4735 | 108.477 | 1068.42 | 0.9 |
| 1876100 (293 K) | 9.8451(3) | 15.1918(4) | 7.4842(2) | 108.573(3) | 1061.07(5) | — |
| DFT 1876100 | 9.8364 | 15.2651 | 7.4771 | 108.936 | 1061.96 | 0.0 |
In the Rietveld refinement all the experimental reflections (as shown by the tick marks) are replicated in the calculated pattern and their 2θ positions are in excellent agreement. Although there was some evidence of differences in peak height and shape between experiment and calculation, as seen in the difference plot in Fig. 2, this can be explained by residual preferred orientation effects. The natural plate morphology of the crystals results in strong preferred orientation effects due to the alignment of crystallites. Minimisation of this by grinding the powder more finely, to allow the collection of better PXRD data, was hindered by breakdown of the crystal structure if the sample was ground for too long (discussed below). Most powders analysed therefore still contained microcrystallites, exacerbating the preferred orientation effects. Taking these effects into account, the Rietveld refinement of the PXRD data were therefore considered sufficient to confirm that no structural change had occurred on grinding and the published structure of 2,6-lutidinium hydrogen fumarate is a suitable model.
NMR
Fig. 3a and b presents 1H one-pulse MAS and 1H–13C CP MAS NMR spectra of 2,6-lutidinium hydrogen fumarate together with stick spectra that represent the 1H and 13C chemical shifts calculated using the GIPAW method for the geometry optimised crystal structure (see Table S6† for full listing). Generally, the level of agreement between experiment and calculation was within the established discrepancy of such calculations of 1% of the chemical shift range.9,27,68–70 The broad peak at 5–9 ppm in the 1H MAS NMR spectrum (Fig. 3a) is in agreement with GIPAW calculation. The peak corresponds to CH protons from both the aromatic ring and the fumarate carbon–carbon double bond backbone. There is a distinct shoulder at 6.3 ppm, as expected for H1 (δcalciso = 6.3 ppm), the CH proton with the lowest calculated chemical shift, and a second shoulder at 7.9 ppm, corresponding to H3 and H11 (δcalciso = 7.9 ppm and δcalciso = 8.0 ppm, respectively). The single methyl (Me) peak in both experiment and calculation shows the similarity in the local environments of the two Me groups due to the symmetry of the 2,6-lutidinium molecule and its interaction with the fumarate molecule. The only discrepancy between experiment and calculation is the occurrence of two distinct peaks at high chemical shift rather than one, as discussed below.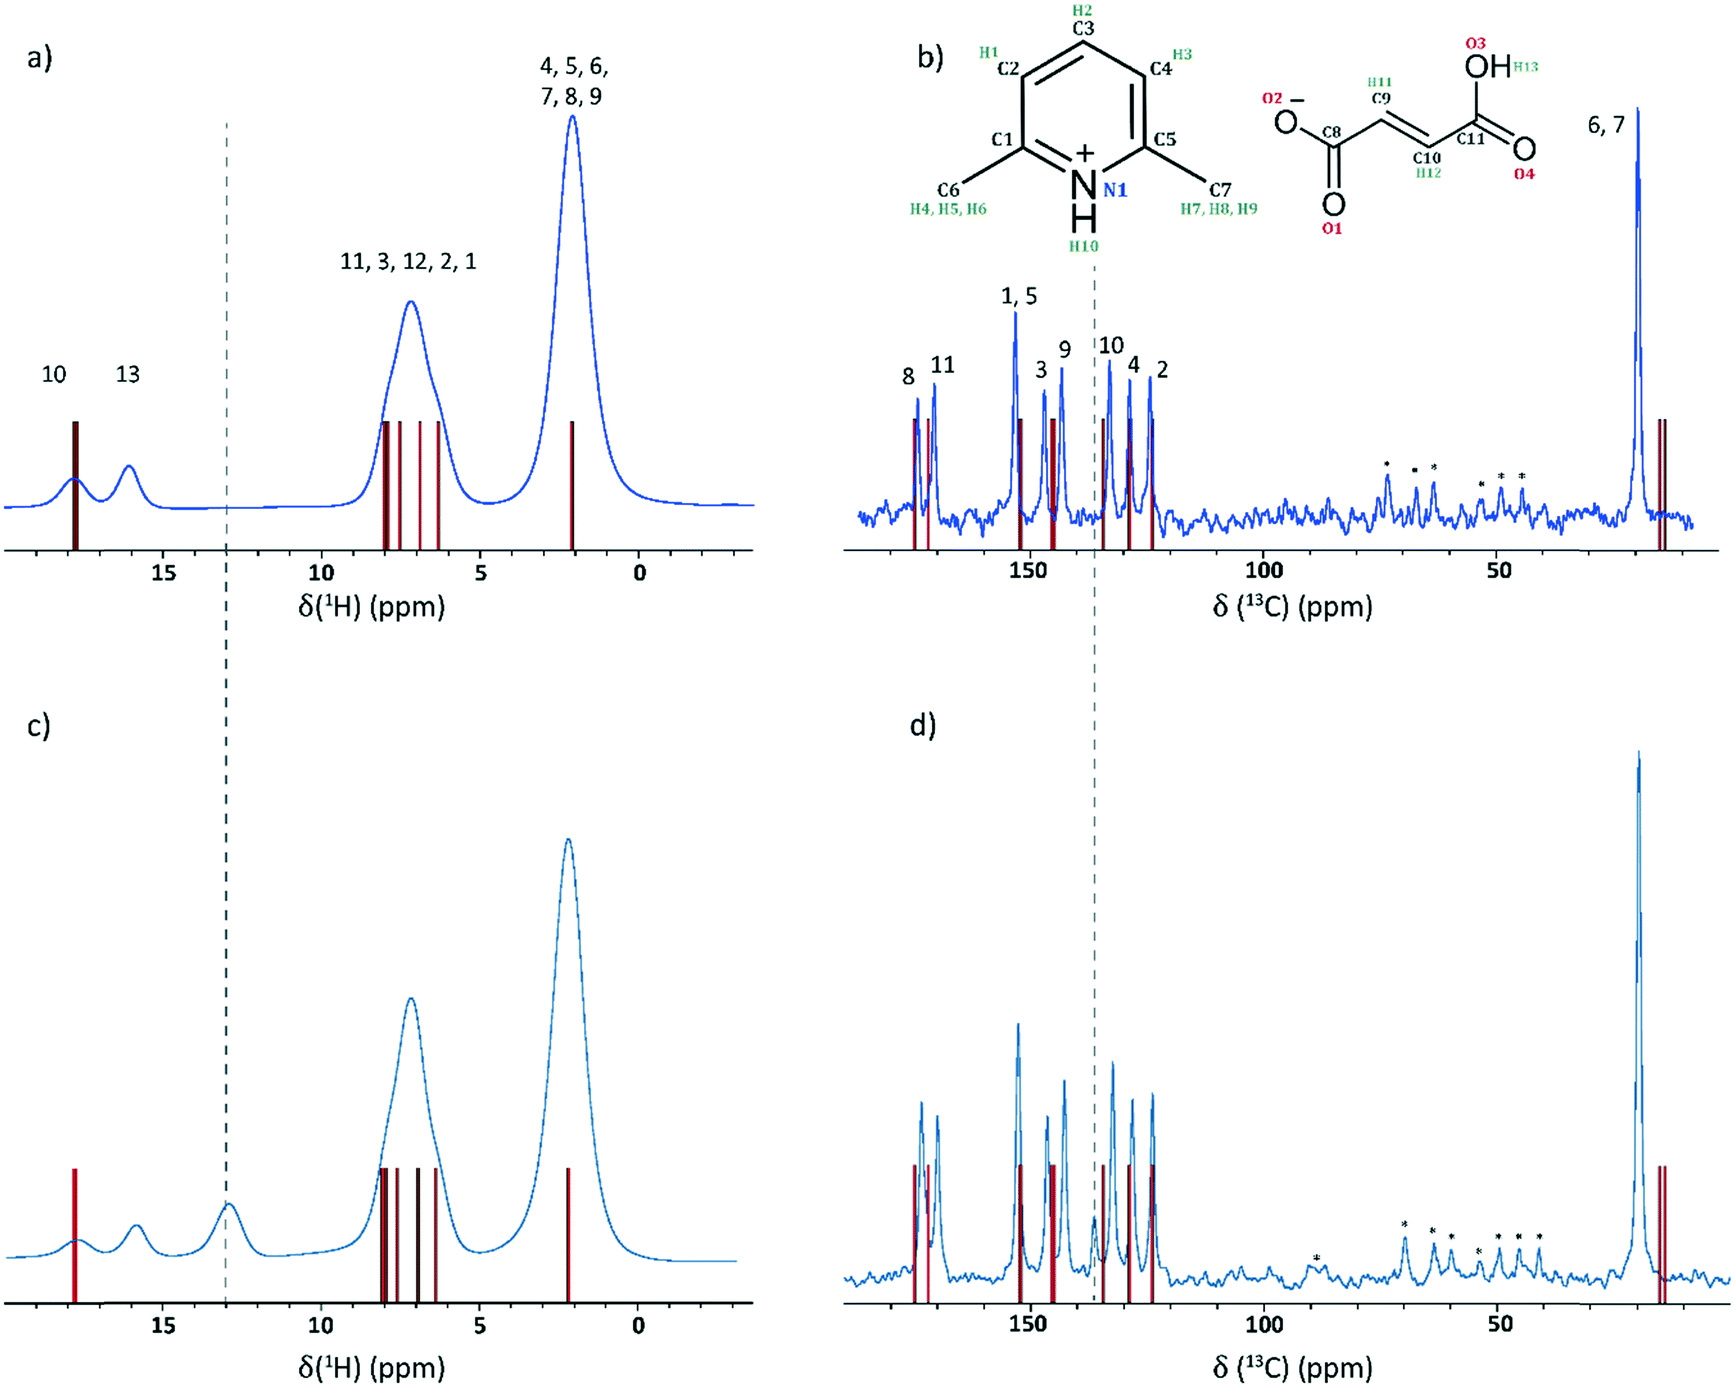 | ||
| Fig. 3 (a and c) 1H (600 MHz) one-pulse MAS (60 kHz) NMR spectra and (b and d) 1H (500 MHz)–13C CP MAS (12.5 kHz) NMR spectra of 2,6-lutidinium hydrogen fumarate with stick spectra corresponding to GIPAW calculated chemical shifts shown as vertical bars (red). Spectra obtained initially for the pure crystalline powder are shown at the top (a and b) while spectra obtained later after the formation of fumaric acid (see discussion in text) are shown below (c and d). The positions of the anomalous peaks that developed over time are indicated by vertical dashed lines. Asterisks denote spinning sidebands. | ||
In the 1H–13C CP MAS NMR spectrum (Fig. 3b), there is also good agreement between experimental and GIPAW calculated chemical shifts, with only small discrepancies. One of the most noticeable differences is the clear separation of C3 and C9 resonances, which are calculated as being only 0.5 ppm apart (145.8 and 145.3 ppm, respectively). By comparison, two peaks are evident in the experimental spectrum, at 142.7 and 146.4 ppm. Owing to their closeness in the calculated values, it was unclear how they should be assigned on the basis of a 1D spectrum alone.
A 2D 1H–13C HETCOR MAS NMR spectrum of 2,6-lutidinium hydrogen fumarate, whereby CP was used to transfer magnetisation via through space dipolar couplings, is shown in Fig. 4. This was recorded using a CP contact time of 200 μs, such that cross peaks for longer-range C⋯H proximities are apparent as well as direct one-bond C–H connectivities. The 1H–13C HETCOR spectrum is shown together with crosses that represent the GIPAW calculated chemical shifts for the C–H dipolar correlations up to 2.8 Å (see Table S3†). This allows an upper distance to be assigned to the observed experimental correlations by comparison to the interatomic distances extracted from the 2,6-lutidinium hydrogen fumarate crystal structure. For the zoomed region in the inset of Fig. 4, crosses for GIPAW calculated chemical shifts correspond to the directly bonded CH moieties (∼1.1 Å). The 2D correlation peaks show good agreement between experiment and GIPAW calculation, with only very few of the expected peaks missing, all of which are at a separation of more than 2.2 Å in the 2,6-lutidinium hydrogen fumarate crystal structure. For example, no experimental cross peak is seen for the correlations of C8 with either H13 or H10, which correspond to distances of 2.38 and 2.53 Å, respectively.
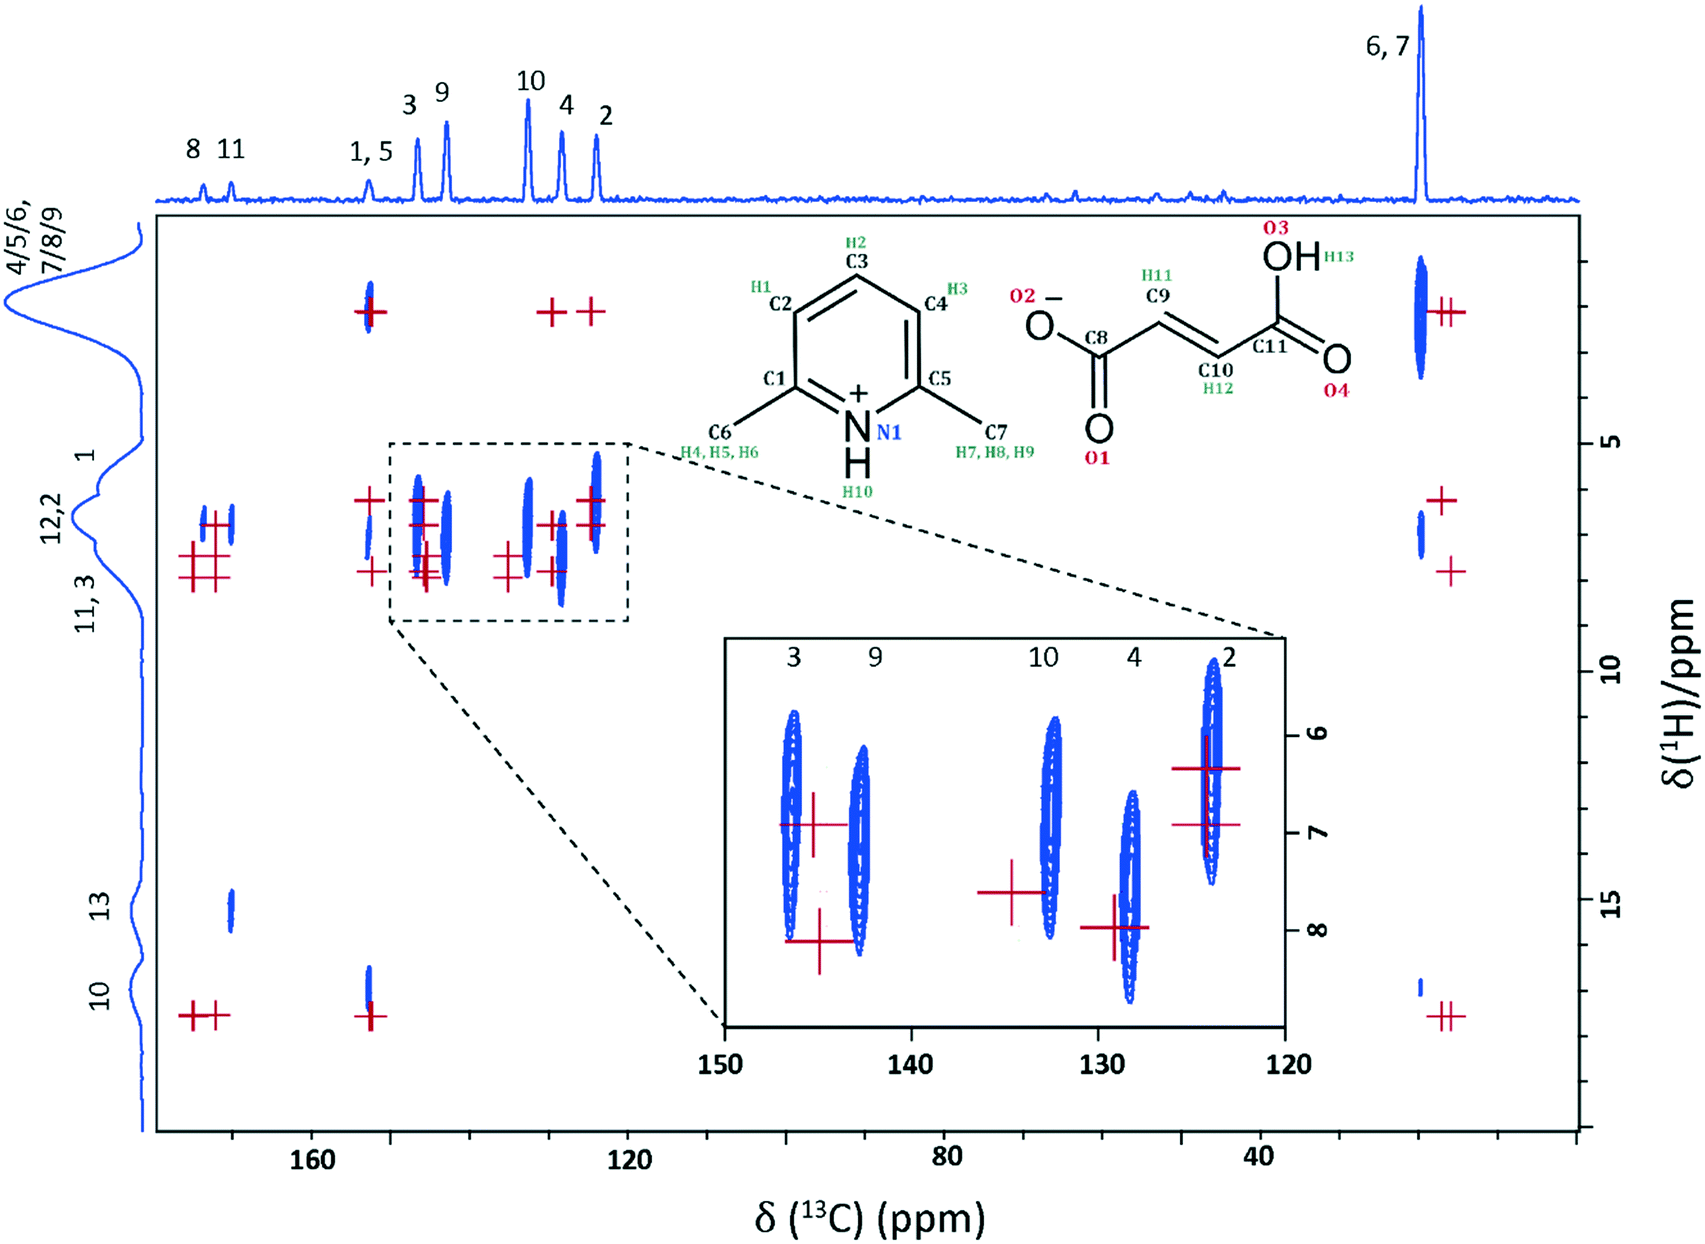 | ||
| Fig. 4 A 1H (500 MHz)–13C CP (200 μs) HETCOR MAS (12.5 kHz) NMR spectrum of 2,6-lutidinium hydrogen fumarate with calculated (GIPAW) chemical shifts shown as red crosses, for CH proximities out to 2.8 Å and for directly bonded CH connectivities (∼1.1 Å) in the zoomed-in region shown as an inset. Proximities for the quaternary carbons are listed in Table S3.† The base contour level is at 7.5% of the maximum peak height. | ||
The small difference in experimental correlations apparent in the zoomed in region in Fig. 4 supports assigning C3 to the 13C resonance at 146.4 ppm, the higher chemical shift as per the GIPAW calculation, as its cross peak corresponds to a slightly lower proton chemical shift value than that of the resonance at 142.7 ppm. As can be seen from the GIPAW calculated chemical shifts for the directly bonded C–H moieties, this is expected as C3 (δexpiso = 146.4 ppm) is directly bonded to H2 (δcalciso = 6.9 ppm) and C9 (δexpiso = 142.7 ppm) is directly bonded to H11 (δcalciso = 8.0 ppm). C3 also has a proximity of 2.17 Å to H1 (the lowest of the CH proton resonances, as stated above) as well as its directly bonded H2. C9 does not share this correlation to H1 so its cross peak with the CH region is expected to be at a higher 1H chemical shift, as observed. The discrepancy between experiment and GIPAW calculation for these 13C chemical shifts is −2.6 and 0.6 ppm for C9 and C3, respectively. For C3, this is well within the established discrepancy compared to experiment for such calculations of 1% of the chemical shift range (∼2 ppm for 13C chemical shifts) although, with a difference of −2.6 ppm, the discrepancy for C9 is slightly larger than would be expected. The only peaks that fall well outside this usual discrepancy range are the 13C peaks for the Me groups, which fall ∼5 ppm higher than calculated. This is a consequence of the known deviation from negative one in the gradient of a plot of experimental chemical shift against calculated chemical shielding (see, e.g., Fig. 4b in ref. 40);71 an alternative approach would be to use different reference shieldings for different parts of the spectrum.70
As noted above, two peaks are observed above 10 ppm in the 1H MAS NMR spectrum (Fig. 3a) whereas, as can be seen from the stick spectra, the GIPAW calculated chemical shifts predict that both H13 and H10 (the OH and NH protons, respectively) are at the same value of 17.7 ppm. In the 2D 1H–13C HETCOR spectrum, the absence of cross peaks between the 17.7 ppm proton environment and C11 (δexpiso = 169.9 ppm) suggests that H13 resonates at a lower ppm value compared with calculation and can be assigned to the peak at 15.7 ppm, which correlates with C11. A 2D 14N–1H HMQC spectrum, as shown and discussed later, is also in good agreement with calculation. A single N environment correlates with the highest proton peak (δexpiso = 17.7 ppm), assigned as H10, whereby the low 14N shift, −102 ppm, also indicates that proton transfer to the N has occurred and the structure is sustained by an ionic salt interaction due to its excellent agreement with the calculated 14N shift (δcalc = −102.2 ppm).
In the 2D DQ–SQ 1H–1H MAS NMR spectrum presented in Fig. 5, cross peaks occur in the DQ dimension at the sum of the two SQ resonances for protons close in space (generally accepted as up to a distance of 3.5 Å).30Table 2 lists the H⋯H proximities under 3.5 Å for the NH (H10, δexpiso = 17.7 ppm) and OH (H13, δexpiso = 15.8 ppm) protons of 2,6-lutidinium hydrogen fumarate in the DFT geometry optimised structure. The closest proximities of the OH and NH protons are to the CH3 groups, giving peaks at δDQ = 2.1 + 15.8 = 17.9 ppm and δDQ = 2.1 + 17.7 = 19.8 ppm, respectively. The next closest proximity to the NH, H10, is to H11, which also falls within 3.5 Å of the OH, H13 (see Table 2), corresponding to cross peaks at δDQ = 15.8 + 7.9 = 23.7 ppm (H13–H11) and δDQ = 17.7 + 7.9 = 25.4 ppm (H10–H11). Unlike H10, H13 has a sufficiently close proximity to both H2 and H3 such that cross peaks are also observed at δDQ = 15.8 + 7.0 = 22.8 ppm (H13–H2) as well as at δDQ = 15.8 + 7.9 = 23.7 ppm (H13–H3).
 | ||
| Fig. 5 A 1H (600 MHz) DQ MAS NMR spectrum of 2,6-lutidinium hydrogen fumarate recorded with one rotor period of BaBa recoupling. The base contour level is at 3.3% of the maximum peak height. Blue and green contours correspond to positive and negative intensity respectively. DQ/SQ correlations for the NH (H10) and OH (H13) resonances are listed in Table 2. The dashed diagonal line indicates the δDQ = 2δSQ diagonal, while horizontal lines indicate a DQ peak at the sum of the two SQ peaks for dipolar coupled unlike protons. | ||
| Proton 1 | δ expiso SQ1 (ppm) | Proton 2 | δ expiso SQ2 (ppm) | δ expiso DQ (ppm) | Separationa (Å) |
|---|---|---|---|---|---|
| a H–H distances are taken from the DFT (CASTEP) optimised structure. Intermolecular proximities are denoted using italic font. | |||||
| H13 (OH) | 15.8 | H9 (CH 3 ) | 2.1 | 17.9 | 2.52 |
| H4 (CH 3 ) | 2.1 | 17.9 | 2.87 | ||
| H11 (CH) | 7.9 | 23.7 | 2.88 | ||
| H3 (CH) | 7.9 | 23.7 | 2.97 | ||
| H2 (CH) | 7.0 | 22.8 | 3.04 | ||
| H2 (CH) | 7.0 | 22.8 | 3.26 | ||
| H5 (CH 3 ) | 2.1 | 17.9 | 3.41 | ||
| H11 (CH) | 7.9 | 23.7 | 3.47 | ||
| H10 (NH) | 17.7 | H5 (CH3) | 2.1 | 19.8 | 2.37 |
| H8 (CH3) | 2.1 | 19.8 | 2.51 | ||
| H11 (CH) | 7.9 | 25.4 | 2.57 | ||
| H7 (CH3) | 2.1 | 19.8 | 2.71 | ||
| H4 (CH3) | 2.1 | 19.8 | 2.92 | ||
| H4 (CH 3 ) | 2.1 | 19.8 | 3.04 | ||
| H11 (CH) | 7.9 | 25.4 | 3.27 | ||
| H5 (CH 3 ) | 2.1 | 19.8 | 3.28 | ||
GIPAW calculations of NMR chemical shifts for isolated molecules
A comparison of the chemical shifts calculated for the full crystal structure of 2,6-lutidinium hydrogen fumarate to those calculated for individual isolated molecules, as extracted from the geometry optimised crystal structure, can provide additional insight into the crystal packing.27,28,45,72–74 The difference between the crystal and isolated molecule chemical shifts (Table 3) indicates the presence of intermolecular interactions, with changes of more than 1 ppm being considered significant. Positive values of ΔδCrystal−Molecule are attributed to the presence of hydrogen bonding, while negative values arise due to ring currents from C–H⋯π interactions.27,72,75,76| Atom | δ Expt | δ Crystal | δ Molecule | ΔδCrystal−Molecule |
|---|---|---|---|---|
| H13 | 15.8 | 17.7 | 6.4 | 11.3 |
| H10 | 17.7 | 17.7 | 10.5 | 7.1 |
| H12 | 7.0 | 7.5 | 6.1 | 1.4 |
| H11 | 7.9 | 8.0 | 6.8 | 1.2 |
| H3 | 7.9 | 7.9 | 7.3 | 0.6 |
| H4/H5/H6 | 2.1 | 2.1 | 2.4 | −0.3 |
| H7/H8/H9 | 2.1 | 2.1 | 2.4 | −0.3 |
| H1 | 6.3 | 6.3 | 7.3 | −1.0 |
| H2 | 7.0 | 6.9 | 7.9 | −1.0 |
Isolated molecule calculations were performed on CCDC 181445 following geometry optimisation. In these calculations, δcalciso of the OH and NH (H13 and H10, respectively) are significantly higher for the crystal structure than for the isolated molecules, with both being calculated at 17.7 ppm in the crystal rather than 6.4 and 10.5 ppm, respectively, for the isolated molecules. The hydroxyl H13 shows the largest change in chemical shift between the crystal structure and isolated molecule calculations, corresponding to the strong hydrogen bonding between adjacent hydrogen fumarate molecules to form the chains of asymmetric units seen in the geometry optimised 181445 structure (see Fig. 1; the O⋯O and O⋯H distances are 2.54 and 1.48 Å, respectively, with a 175° OHO angle). The NH (H10) also shows evidence in isolated molecule calculations of a strong H bond to O2 as expected (the N⋯O and O⋯H distances are 2.64 and 1.55 Å, respectively, with a 169° NHO angle), with the smaller ΔδCrystal−Molecule corresponding to the slightly larger distance and an angle further from the ideal 180° compared to the case for H13. A further difference is that H10 corresponds to a charged NH+ moiety while H13 is in a neutral COOH group. Two CH protons, H11 and H12, also show some indication of a weak hydrogen bonding interaction28,75 as they exhibit a change in chemical shift of 1.2 and 1.4 ppm, respectively. H11 is weakly bonded to O2 in the stacked chain (C⋯O distance of 3.43 Å, CH⋯O distance of 2.38 Å and CHO angle 161°) and H12 is weakly bonded to O4 in the adjacent fumarate chain (C⋯O distance of 3.50 Å, CH⋯O distance of 2.45 Å and CHO angle 161°).
H1 and H2 exhibit weak ring current effects (−1.0 ppm), possibly due to the stacking of the pyridine rings within the crystal structure, although it is interesting to note that this effect seems to be offset for H3 which instead shows a very slight positive change (0.6 ppm). This is due to weaker effects from ring currents, as the stacking is slightly misaligned (Fig. 1d, bottom right), placing it further out from the π–π stack.
Skewed cell contraction
Fig. 6 shows a Rietveld refinement against a PXRD high resolution synchrotron scan that was collected at 100 K. As with the room temperature high resolution scan shown in Fig. 2, residual preferred orientation effects prevent accurate refinement of atomic positions, but the tick marks, corresponding to 2θ values of the reflections expected for the refined structure, are in excellent agreement with those recorded experimentally. As can be seen in Table 1, this Rietveld refinement showed a contraction accompanied by an increase in the β angle. This effect was also observed in SXRD crystal screens conducted at a range of temperatures between 100 K and 300 K (Fig. S3†). | ||
| Fig. 6 Final Rietveld fit for 2,6-lutidinium hydrogen fumarate at 100 K, showing the experimental (black crosses), calculated (red upper line) and difference (grey lower line) PXRD profiles. Tick marks indicate allowed peak positions. For refinement parameters, see Tables 1, S4 and S5.† | ||
Compared to 181445, the Rietveld refinement for the 300 K PXRD pattern presented above (Fig. 2) shows a small, but similarly skewed expansion, with a marginal decrease in β angle, alongside increases in cell lengths, consistent with being recorded at a slightly higher temperature than the literature structure (300 K compared to 292 K). The skew in the cell, when going to low temperature during contraction, is also evident in the DFT calculations (also shown in Table 1). Geometry optimisations, performed allowing the unit cell parameters to vary, showed convergence towards the low temperature structure. As no external temperature is included in the calculations, they are effectively performed at 0 K, so it is unsurprising they would exhibit such a tendency.
During the room temperature crystal SXRD screening to check each crystallisation for variations or new polymorphs, one crystal was identified that differed slightly from the previously identified structure. This newly identified structure has been deposited with the CCDC (no. 1876100) and selected crystal data are given in Table 4. Although the molecular packing of the crystal remained unchanged, with only small shifts in relative atomic positions (Fig. 7), the unit cell parameters presented in Table 1 show both a slight contraction in the unit cell lengths (the most significant being a reduction of 0.15 Å on the b axis) and a 0.76° widening of the β angle compared with 181445, which was recorded at 292 K. Intramolecular one-bond atomic distances actually increased by an average of 0.006 Å, with the mean C–C/N one-bond separation in the pyridine ring changing from 1.367 Å in the original structure to 1.373 Å in 1876100. However, intermolecular distances between the atoms of neighbouring molecules decreased by an average of 0.03 Å (where intermolecular distances up to 6 Å were considered), with this value dominated by the distances in the b dimension, with the O⋯O hydrogen bond (aligned with the a dimension) decreasing by 0.01 Å compared to a decrease of 0.06 Å for the O3 to C8 distance between neighbouring hydrogen fumarate molecules (aligned with the b dimension). The form of the contraction and its corresponding skew in the β angle are similar to that exhibited by the contraction at low temperature, although to a lesser extent.
| Chemical formula | C11H13O4N | Temperature (K) | 293(2) |
| Formula weight | 223.22 | μ (mm−1) | 0.900 |
| Crystal system | Monoclinic | Independent reflections | 2076 |
| Space group | P21/n | R int | 0.0232 |
| Z | 4 | R 1 [I > 2σ(I)] | 0.0317 |
 | ||
| Fig. 7 Overlay of the asymmetric unit of the newly identified structure deposited to the CCDC as 1876100 (carbon atoms in green) and of the previously published structure (ref.: 181445, carbon atoms in grey). | ||
A GIPAW calculation for 1876100, following geometry optimisation, showed that the minimal shifts in atom position produced only small changes to the calculated chemical shifts (the largest being 0.2 ppm for 1H and 0.6 ppm for 13C, with mean differences of 0.01 ppm and 0.1 ppm, respectively, see Table S6†). These mean differences are below the experimental error and therefore make the two structures effectively indistinguishable by NMR. This in turn suggests that the skewed contraction produces no significant changes to the chemical environments for the two molecules. However, the unit cell changes, particularly the increase in β angle, are sufficient to visibly change the 2θ positions of reflections in the simulated PXRD pattern with respect to the literature structure (Fig. S4†).
A second example of 1876100 was not identified within any of the single crystal screens, for more than 20 crystals, with all other crystals converging to the 181445 structure of 2,6-lutidinium hydrogen fumarate at room temperature. The observation that no more crystals showing this contraction were identified may be due to the minimal presence of 1876100 or a bias in which single crystals were analysed. A difference in crystal quality, exhibited either by their appearance or quality of diffraction, could create such a bias.
Extensive PXRD analysis failed to provide conclusive evidence for even a minor second structural phase within the powdered compound, suggesting that 1876100 may have been an isolated case. However, in the case of only partially ground powders (so as to as minimise break down of the co-crystal, see below discussion), some of the reflections appeared to show a splitting. Several larger crystallites were observed in static transmission PXRD of these samples, using a 2D detector, that may explain this. They lie slightly off the main powder ring, as predicted due to a small change in β angle (Fig. 8), and might therefore be linked to 1876100. As 1876100 seems to be related to the low temperature contraction, it is unclear how it existed within a room temperature SXRD screen. The energies of 181445 and 1876100, determined by DFT (see Table 1), differed by only 0.9 kJ mol−1 after geometry optimisation (allowing both atom positions and unit cell parameters to vary).
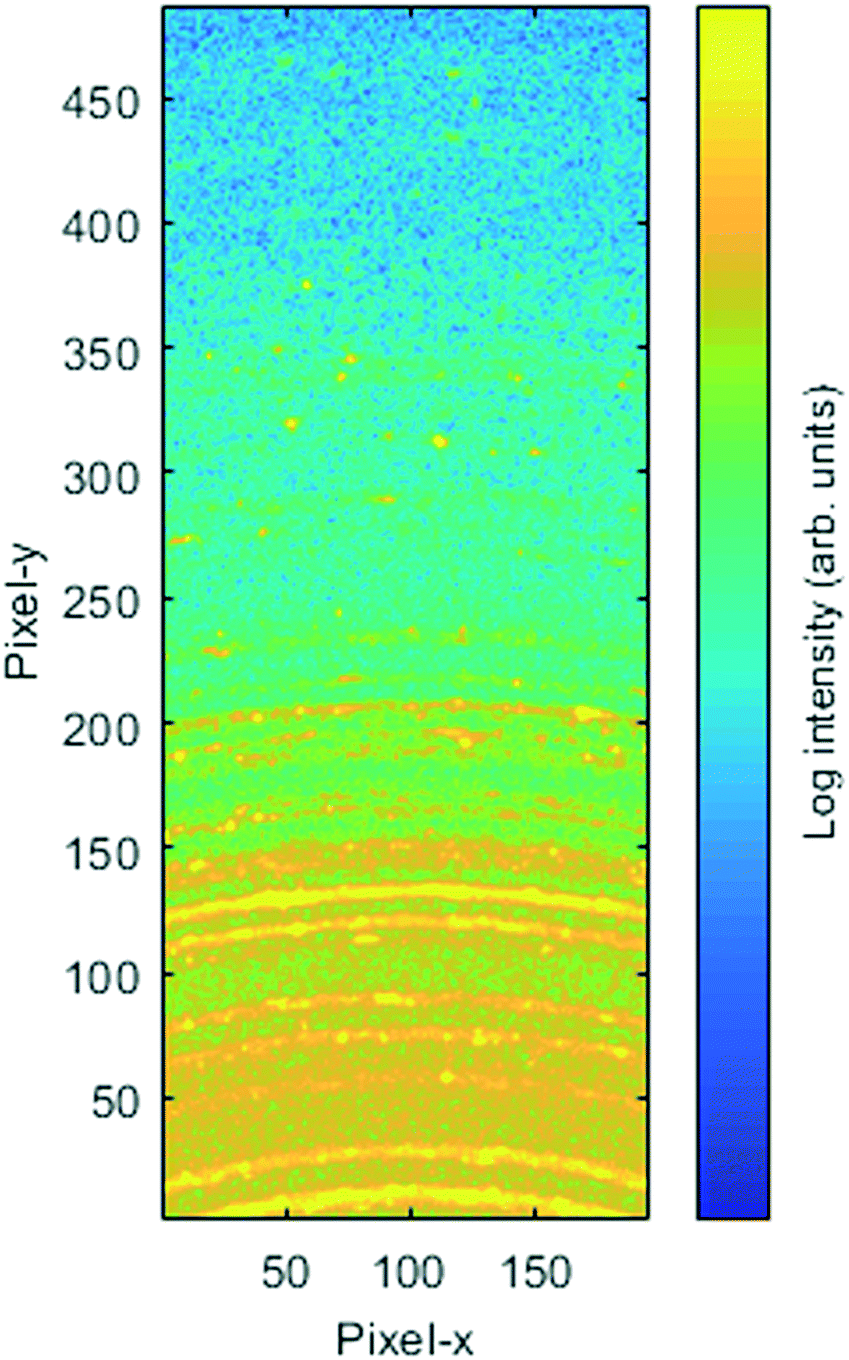 | ||
| Fig. 8 Static transmission PXRD of 2,6-lutidinium hydrogen fumarate with a 2D detector. | ||
Considering Table 1, it is notable that, for the DFT calculations, variable cell geometry optimisations that were started from both the previously published structure and 1876100 converged towards the 100 K structure but neither reached it, with each satisfying the convergence conditions of the DFT calculation with larger volume unit cells than that of the 100 K structure. This discrepancy is probably due to the limitations of the dispersion correction scheme. Although the difference between the two unit cells was smaller following variable cell geometry optimisation, the output of the calculation based on 1876100 was still slightly more contracted than that based on the original CCDC structure, 181445. It can also clearly be seen (Table 1) that despite effectively being at a lower temperature (0 K), the outputs of neither calculation exhibit as significant a contraction as is evident for the 100 K synchrotron case, although the optimisation of 1876100 did produce a similar skew of the β angle.
Formation of fumaric acid
Samples that had been stored for more than a week as powders rather than single crystals showed additional peaks in the 1H MAS and 1H–13C CP MAS NMR spectra, as shown in Fig. 3c and d. The high chemical shift of the new 1H peak, 12.9 ppm, is indicative of strong hydrogen bonding. A 2D 14N–1H HMQC MAS NMR spectrum showed only the peak identified during the initial analysis (Fig. 9b), confirming the presence of a single N environment and therefore indicating that the new 1H resonance likely corresponds to an OH group. A 2D 1H–13C HETCOR MAS NMR spectrum (Fig. S5†) did not show the additional 1H peak, further supporting the assignment as an OH. The extra 13C peak that had been identified in the 1H–13C CP MAS spectrum did correlate with protons in the CH region, however, suggesting a second new 1H resonance lies under the CH region. The closeness in chemical shift of this new 13C resonance to that of C10 hinted that it may correspond to a carbon in the fumarate backbone.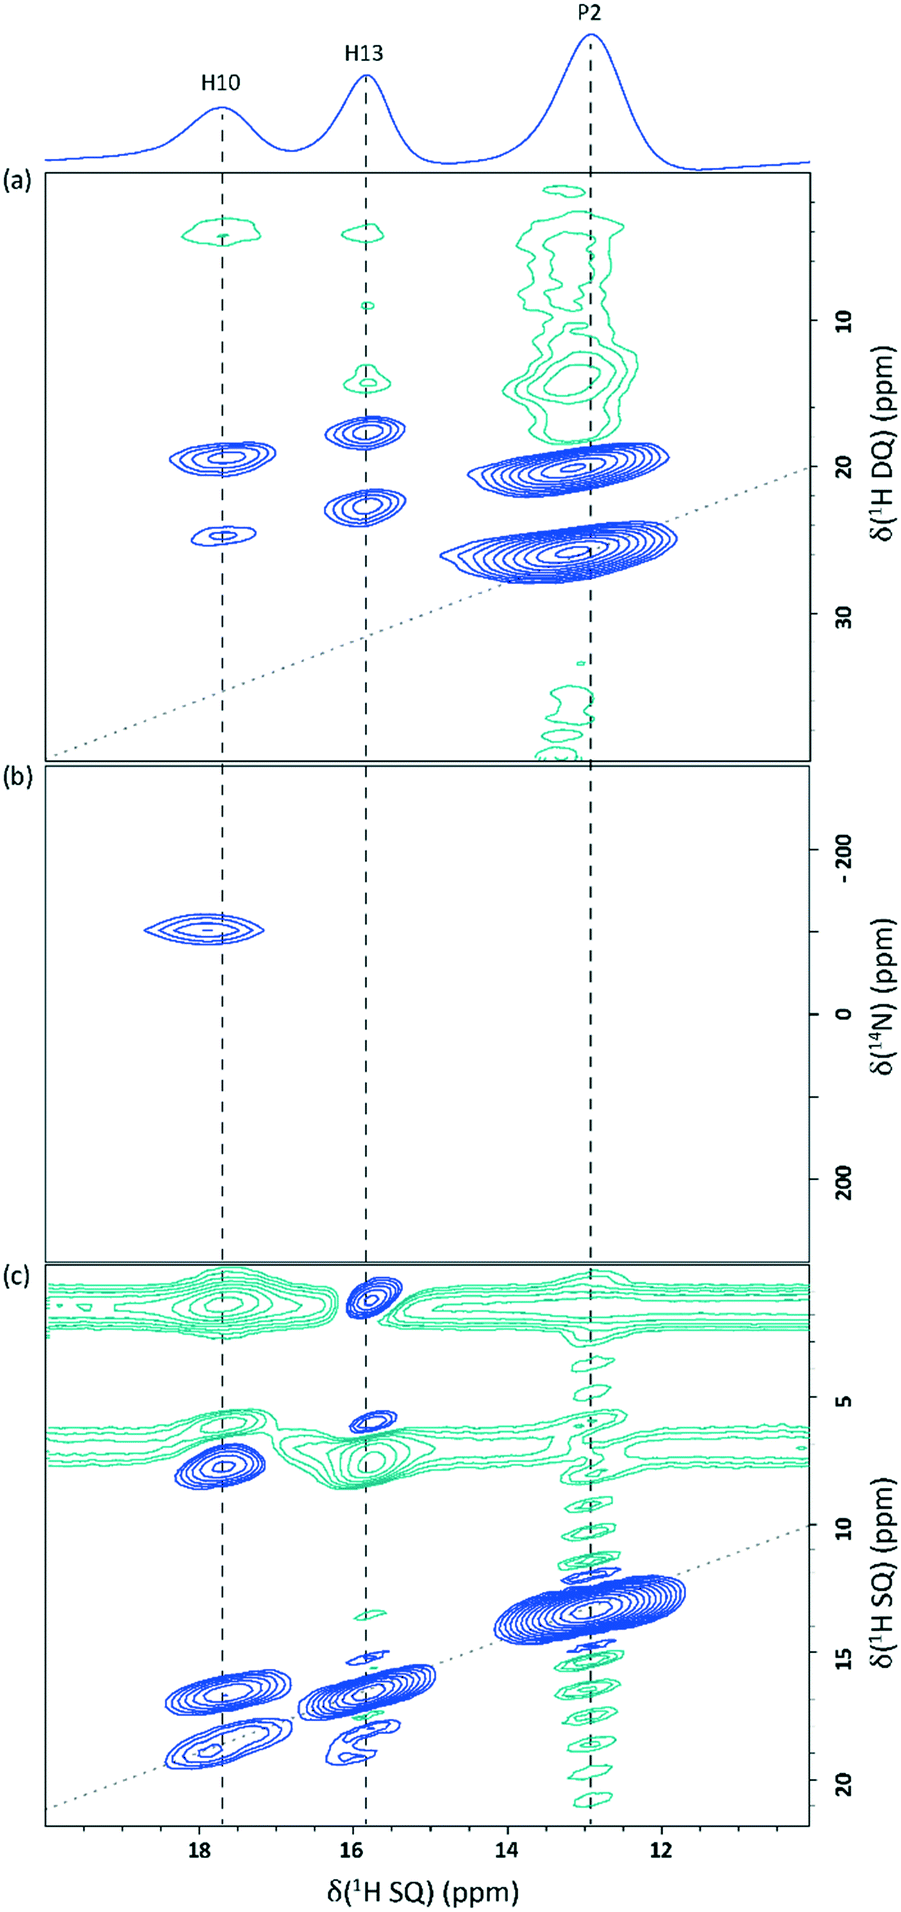 | ||
| Fig. 9 2D MAS (60 kHz) NMR spectra of 2,6-lutidinium hydrogen fumarate sample (not freshly ground into a powder) showing the 10–20 ppm 1H region: (a) a 1H DQ spectrum recorded with one rotor period of BaBa recoupling; (b) a 14N–1H HMQC spectrum with 8 rotor periods of R3 recoupling; and (c) a 1H SQ NOESY spectrum with tmix = 300 ms. All spectra were recorded at a 1H Larmor frequency of 600 MHz. Base contour levels are at 5.3%, 36.2% and 2.3% of the maximum peak height, respectively. Blue and green contours correspond to positive and negative intensity, respectively. The negative intensities seen at the CH3 and CH F1 (vertical axis) SQ frequencies in (c) are due to the much greater intensity of their auto-correlation peaks. The dashed diagonal lines in (a) and (c) indicate the (a) δDQ = 2δSQ and (c) δSQ = δSQ diagonals. | ||
A 2D 1H–1H DQ–SQ MAS NMR spectrum (Fig. 9a) shows that two cross peaks are observed for the newly appearing proton resonance (labelled as P2). These correspond to an auto-correlation (δDQ = 13.0 + 13.0 = 26.0 ppm) and a correlation with the CH region (δDQ = 13.0 + 7.0 = 20.0 ppm), corresponding to the same 1H chemical shift as H11 or H12. A 2D SQ 1H–1H NOESY spectrum (Fig. 9c) clearly shows the presence of two distinct phases. A mixing time of 300 ms was used to allow spin diffusion throughout the entire system which should result in cross peaks between all protons within the same phase.77,78 The absence of cross peaks for the 12.9 ppm resonance with the Me and NH protons in either of the 1H–1H 2D correlation experiments, coupled with the proximity to the CH region shown in the DQ experiment, suggests that the secondary phase does not contain 2,6-lutidine and may correspond to crystalline fumaric acid. This is supported by the correlation between the anomalous C peak with the CH region in the 1H–13C HETCOR spectrum (Fig. S5†), and the OH 1H chemical shift of 13 ppm (ref. 79) and the two 13C chemical shifts of 136.3 ppm and 172.3 ppm (ref. 80) reported in the literature for fumaric acid, with the higher resonance lying beneath the existing C8 peak.
This conclusion is supported by the position of reflections seen in a subsequent PXRD pattern recorded with a Panalytical X'Pert Pro MPD diffractometer (Fig. 10). Samples that had been stored as powders contained reflections that were not present in patterns recorded on freshly ground crystals. Although these new reflections matched well those expected for crystalline fumaric acid,81 a multiphase refinement was not possible. This was due to both the presence of splittings (possibly caused by the presence of larger crystallites of 2,6-lutidinium hydrogen fumarate with different β angles, as shown in Fig. 8), preferred orientation effects and, crucially, significant overlap of many of the fumaric acid reflections with those produced by 2,6-lutidinium hydrogen fumarate.
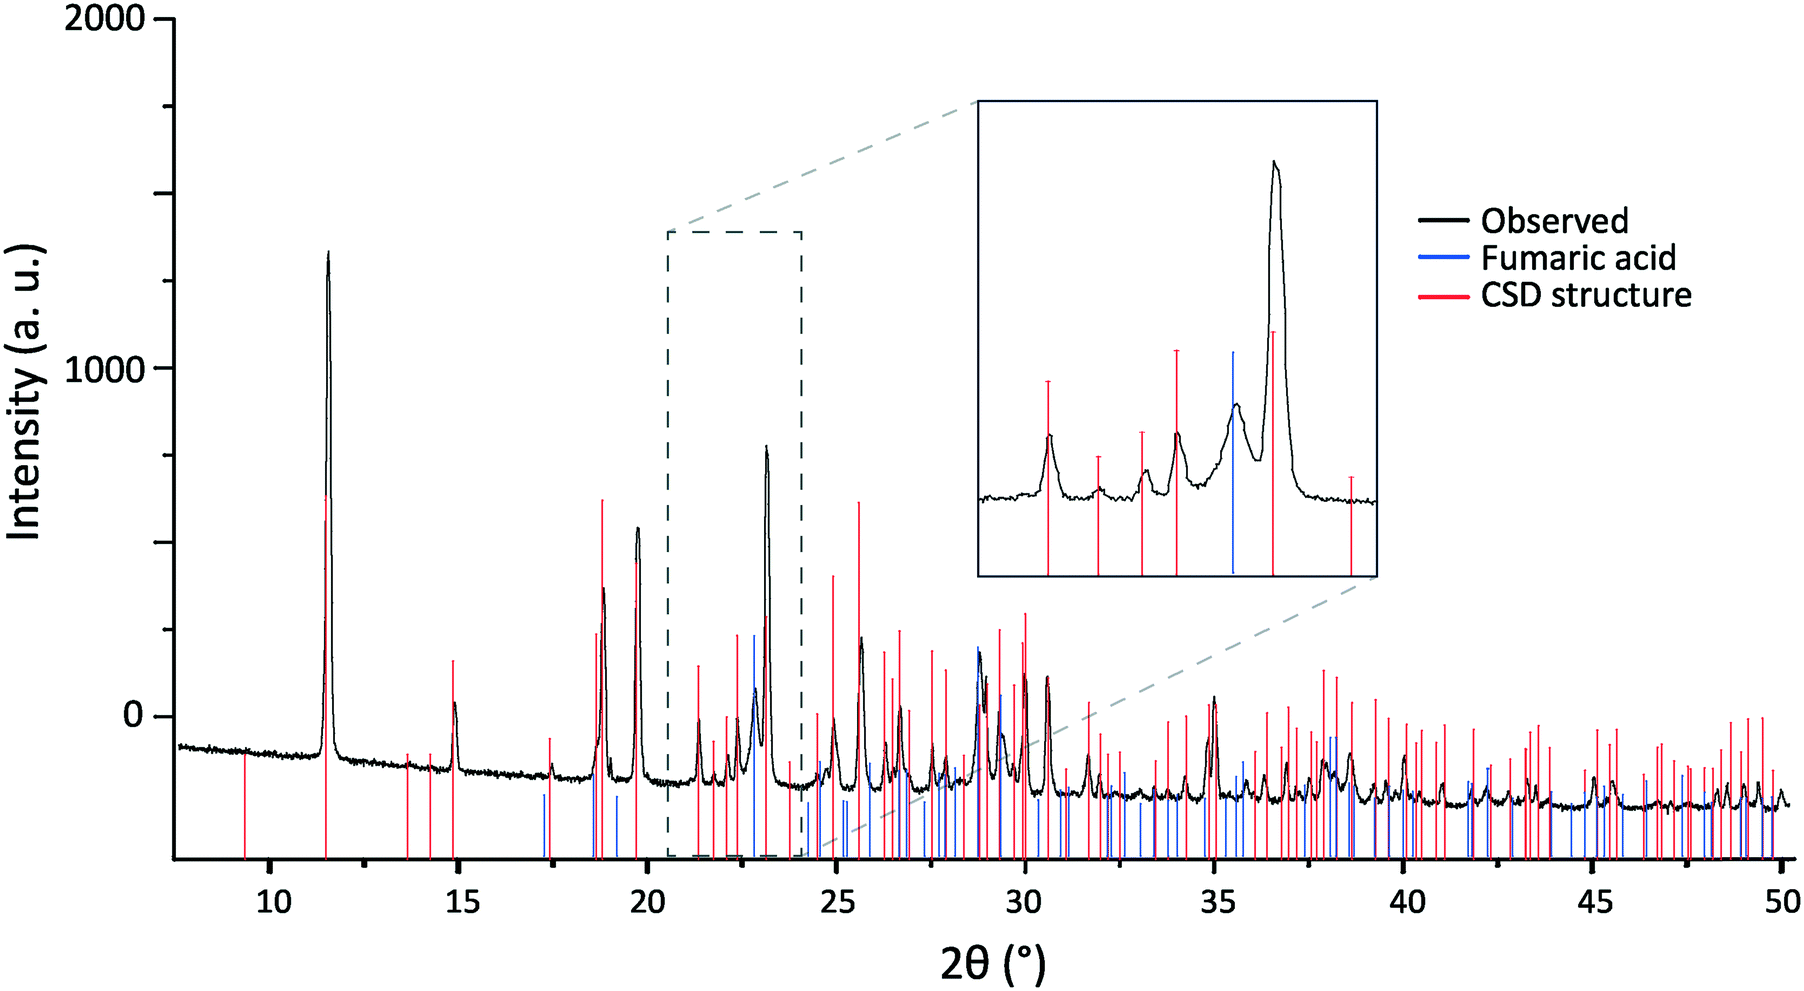 | ||
| Fig. 10 PXRD pattern of 2,6-lutidinium hydrogen fumarate recorded more than a week after first being ground to powder, with tick marks representing the reflection positions simulated for CCDC structure 181445 (red) and crystalline fumaric acid (blue). The zoomed-in region (inset) shows the agreement between the additional experimental reflections and those of fumaric acid. | ||
This formation of fumaric acid can be explained by evaporation of 2,6-lutidine from the structure, suggesting it is appropriate to think of this structure as behaving more like a solvate than a salt. Solution-state 1H NMR of samples that had been stored as powders under ambient conditions showed a small decrease in the ratio of 2,6-lutidine to fumaric acid compared to either a freshly ground powder or a dissolved single crystal (Fig. S6†). Storage as single crystals did not result in measurable degradation of the salt or formation of fumaric acid by XRD or MAS NMR, even over the course of several months. The apparent relative stability of the single crystals compared to powdered samples implies gradual evaporation of the 2,6-lutidine from the crystal surface, negligible at the relatively smaller surface area to volume ratio of single crystals compared to a crystallite within the powder. As 2,6-lutidinium sits in stacks through the structure, we speculate that the loss of 2,6-lutidine through evaporation would leave wide pores in the remaining structure that only contains fumaric acid, resulting in collapse of the structure to the more stable crystalline fumaric acid form. It is unclear at what stage transfer of a proton from 2,6-lutidinium to hydrogen fumarate occurs, as is required for the packing within the crystalline fumaric acid structure of neutral molecules rather than hydrogen fumarate ions.
Differential scanning calorimetry (DSC) data for 2,6-lutidinium hydrogen fumarate showed no evaporation with only a single melting point at 112 °C (Fig. S7†). This falls in between the melting points of lutidine and fumaric acid (−6 and 298 °C, respectively) as expected for a multicomponent structure. As the boiling point of 2,6-lutidine is 143 °C, any evaporation would be expected to be slow and so unlikely to be evident relative to a speed of heating of 10 °C min−1. Thermogravimetric analysis (TGA) of powdered 2,6-lutidinium hydrogen fumarate held at 70 °C for 12 h showed a gradual loss in mass over the first 10 h, which then plateaued (Fig. 11). The loss in mass corresponds to 96.3% of the 2,6-lutidine that was present in the complete crystal structure originally. If the mass loss is due to evaporation of 2,6-lutidine, as proposed, the plateau prior to complete loss suggests that the remaining 3.7% of 2,6-lutidine molecules are trapped in the centre of the crystallites, with insufficient energy at 70 °C to escape. This could be due to the collapse of the majority of the structure preventing evaporation of this residual 3.7% of 2,6-lutidine molecules.
 | ||
| Fig. 11 TGA of 2,6-lutidinium hydrogen fumarate powder recorded on a Mettler Toledo Stare instrument with a ramp of 10 °C min−1 from 25–70 °C. The sample was then held at 70 °C for 12 hours. | ||
Conclusions
A combined NMR and XRD crystallographic investigation of 2,6-lutidinium hydrogen fumarate has been presented together with a computational study based on DFT geometry optimisation and GIPAW calculation of NMR chemical shifts.The use of this combined approach enabled the identification of fumaric acid formation within powder samples over time. Based on a corresponding reduction in the ratio of 2,6-lutidine to fumaric acid (by solution-state NMR) and significant weight loss of a sample at 70 °C (as observed by solution-state NMR and TGA analysis, respectively), it is proposed that this is due to slow evaporation of 2,6-lutidine, which is liquid at room temperature, from the crystal structure. It was not possible to determine the formation of fumaric acid solely by PXRD as both reflection overlap and splittings present in the in-house data prevented a multiphase refinement, making the addition of solid-state NMR analysis crucial to understanding the structure's stability. This highlights both the complementarity of XRD and NMR methods and also the benefits of following a multi-technique crystallographic approach.
2,6-Lutidinium hydrogen fumarate was found to form plate crystals and to undergo a skewed unit cell contraction at low temperatures. A second room temperature structure, CCDC 1876100, was also identified by SXRD. This shows a similar variation in unit cell parameters to the 100 K structure, both in the contraction along a and b axes and in the skew of the β angle. Although it may exist as a minor component within the crystalline powder, it is unlikely to have any significant effect on the physical properties as the changes in the relative atomic positions compared to the previously published structure are so small. This results in only very small changes in the GIPAW calculated chemical shifts, suggesting it is invisible to solid-state NMR.
With the increasing development of APIs and AIs that require formulation into more complex multicomponent forms, an improved understanding of the limitations and complementarities of the individual analytical techniques used to characterise them is of great importance.
Conflicts of interest
There are no conflicts to declare.Acknowledgements
We thank Dr Guy Clarkson and Dr Steven Huband for their assistance with in house XRD analysis. Crystallographic data were collected using an instrument that received funding from the European Research Council (ERC) under the European Union's Horizon 2020 research and innovation programme (grant agreement No 637313, PI: Adrian Chaplin, Chemistry, University of Warwick). The I11 beamtime was obtained through the Diamond Light Source Block Allocation Group award “Oxford/Warwick Solid State Chemistry BAG to probe composition–structure–property relationships in solids” (EE18786) and we thank Dr Claire Murray, Dr Mark Senn and Mr Gabriel Clarke for their assistance with measuring the data. Emily Corlett thanks EPSRC, AstraZeneca and Syngenta for a PhD studentship through the EPSRC Centre for Doctoral Training in Molecular Analytical Science, grant number EP/L015307/1.The calculated and experimental data for this study are provided as a supporting data set from WRAP, the Warwick Research Archive Portal at http://wrap.warwick.ac.uk/117210.
References
- L. A. E. Sousa, S. M. Reutzel-Edens, G. A. Stephenson and L. S. Taylor, Mol. Pharmaceutics, 2015, 12, 484–495 CrossRef PubMed.
- R. Thakuria, A. Delori, W. Jones, M. P. Lipert, L. Roy and N. Rodriguez-Hornedo, Int. J. Pharm., 2013, 453, 101–125 CrossRef CAS PubMed.
- P. C. Vioglio, M. R. Chierotti and R. Gobetto, Adv. Drug Delivery Rev., 2017, 117, 86–110 CrossRef PubMed.
- N. Blagden, M. de Matas, P. T. Gavan and P. York, Adv. Drug Delivery Rev., 2007, 59, 617–630 CrossRef CAS PubMed.
- S. Mohamed, D. A. Tocher, M. Vickers, P. G. Karamertzanis and S. L. Price, Cryst. Growth Des., 2009, 9, 2881–2889 CrossRef CAS.
- V. R. Hathwar, R. Pal and T. N. G. Row, Cryst. Growth Des., 2010, 10, 3306–3310 CrossRef CAS.
- J. D. Dunitz, CrystEngComm, 2003, 5, 506–506 RSC.
- D. J. Berry and J. W. Steed, Adv. Drug Delivery Rev., 2017, 117, 3–24 CrossRef CAS PubMed.
- D. V. Dudenko, P. A. Williams, C. E. Hughes, O. N. Antzutkin, S. P. Velaga, S. P. Brown and K. D. M. Harris, J. Phys. Chem. C, 2013, 117, 12258–12265 CrossRef CAS PubMed.
- D. Ludeker and G. Brunklaus, Solid State Nucl. Magn. Reson., 2015, 65, 29–40 CrossRef PubMed.
- E. Tedesco, S. S. Dhillon, K. D. M. Harris, R. L. Johnston, G. W. Turner, B. M. Kariuki, R. Delhez and E. J. Mittemeijer, Mater. Sci. Forum, 2001, 378–383, 784–788 Search PubMed.
- K. D. M. Harris, R. L. Johnston, B. M. Kariuki, E. Tedesco, G. W. Turner, R. Delhez and E. J. Mittemeijer, Mater. Sci. Forum, 2001, 378–383, 38–46 Search PubMed.
- M. Brunelli, J. P. Wright, G. R. M. Vaughan, A. J. Mora and A. N. Fitch, Angew. Chem., Int. Ed., 2003, 42, 2029–2032 CrossRef CAS PubMed.
- L. Smrcok, M. Brunelli, M. Boca and M. Kucharik, J. Appl. Crystallogr., 2008, 41, 634–636 CrossRef CAS.
- S. E. Ashbrook and D. McKay, Chem. Commun., 2016, 52, 7186–7204 RSC.
- B. Elena, G. Pintacuda, N. Mifsud and L. Emsley, J. Am. Chem. Soc., 2006, 128, 9555–9560 CrossRef CAS.
- R. K. Harris, Solid State Sci., 2004, 6, 1025–1037 CrossRef CAS.
- C. Bonhomme, C. Gervais, F. Babonneau, C. Coelho, F. Pourpoint, T. Azais, S. Ashbrook, J. Griffin, J. Yates, F. Mauri and C. Pickard, Chem. Rev., 2012, 112, 5733–5779 CrossRef CAS.
- T. Charpentier, Solid State Nucl. Magn. Reson., 2011, 40, 1–20 CrossRef CAS.
- C. J. Pickard and F. Mauri, Phys. Rev. B: Condens. Matter Mater. Phys., 2001, 63, 245101 CrossRef.
- J. Yates, C. Pickard and F. Mauri, Phys. Rev. B: Condens. Matter Mater. Phys., 2007, 76, 024401 CrossRef.
- J. K. Harper, R. Iuliucci, M. Gruber and K. Kalakewich, CrystEngComm, 2013, 15, 8693–8704 RSC.
- P. Paluch, T. Pawlak, M. Oszajca, W. Lasocha and M. J. Potrzebowski, Solid State Nucl. Magn. Reson., 2015, 65, 2–11 CrossRef CAS PubMed.
- N. J. Vigilante and M. A. Mehta, Acta Crystallogr., Sect. C: Struct. Chem., 2017, 73, 234–243 CrossRef CAS PubMed.
- D. V. Dudenko, J. R. Yates, K. D. M. Harris and S. P. Brown, CrystEngComm, 2013, 15, 8797–8807 RSC.
- M. R. Chierotti and R. Gobetto, CrystEngComm, 2013, 15, 8599–8612 RSC.
- A. C. Poppler, E. K. Corlett, H. Pearce, M. P. Seymour, M. Reid, M. G. Montgomery and S. P. Brown, Acta Crystallogr., Sect. C: Struct. Chem., 2017, 73, 149–156 CrossRef CAS PubMed.
- J. R. Yates, T. N. Pham, C. J. Pickard, F. Mauri, A. M. Amado, A. Gil and S. P. Brown, J. Am. Chem. Soc., 2005, 127, 10216–10220 CrossRef CAS PubMed.
- P. Florian and D. Massiot, CrystEngComm, 2013, 15, 8623–8626 RSC.
- S. P. Brown, Solid State Nucl. Magn. Reson., 2012, 41, 1–27 CrossRef CAS PubMed.
- Y. J. Pan, Z. M. Jin, C. R. Sun and C. W. Jiang, Chem. Lett., 2001, 30, 1008–1009 CrossRef.
- British National Formulary, The National Institute for Health and Care Excellence (NICE), http://bnf.nice.org.uk/, 2018 Search PubMed.
- D. A. Haynes, W. Jones and W. D. S. Motherwell, CrystEngComm, 2006, 8, 830–840 RSC.
- S. J. Clark, M. D. Segall, C. J. Pickard, P. J. Hasnip, M. J. Probert, K. Refson and M. C. Payne, Z. Kristallogr., 2005, 220, 567–570 CAS.
- J. P. Perdew, K. Burke and M. Ernzerhof, Phys. Rev. Lett., 1996, 77, 3865–3868 CrossRef CAS PubMed.
- C. R. Groom, I. J. Bruno, M. P. Lightfoot and S. C. Ward, Acta Crystallogr., Sect. B: Struct. Sci., Cryst. Eng. Mater., 2016, 72, 171–179 CrossRef CAS PubMed.
- A. Tkatchenko and M. Scheffler, Phys. Rev. Lett., 2009, 102, 073005 CrossRef PubMed.
- I. J. Bruno, J. C. Cole, M. Kessler, J. Luo, W. D. S. Motherwell, L. H. Purkis, B. R. Smith, R. Taylor, R. I. Cooper, S. E. Harris and A. G. Orpen, J. Chem. Inf. Comput. Sci., 2004, 44, 2133–2144 CrossRef CAS PubMed.
- A. C. Poppler, D. Walker and S. P. Brown, CrystEngComm, 2017, 19, 224–236 RSC.
- G. N. M. Reddy, D. S. Cook, D. Iuga, R. I. Walton, A. Marsh and S. P. Brown, Solid State Nucl. Magn. Reson., 2015, 65, 41–48 CrossRef CAS PubMed.
- R. K. Harris, P. Hodgkinson, C. J. Pickard, J. R. Yates and V. Zorin, Magn. Reson. Chem., 2007, 45, S174–S186 CrossRef CAS PubMed.
- T. Venâncio, L. M. Oliveira, J. Ellena, N. Boechat and S. P. Brown, Solid State Nucl. Magn. Reson., 2017, 87, 73–79 CrossRef PubMed.
- F. M. Paruzzo, A. Hofstetter, F. Musil, S. De, M. Ceriotti and L. Emsley, Nat. Commun., 2018, 9, 4501 CrossRef PubMed.
- J. D. Hartman, R. A. Kudla, G. M. Day, L. J. Mueller and G. J. O. Beran, Phys. Chem. Chem. Phys., 2016, 18, 21686–21709 RSC.
- M. Zilka, S. Sturniolo, S. P. Brown and J. R. Yates, J. Chem. Phys., 2017, 147, 144203 CrossRef PubMed.
- Agilent, CrysAlisPRO, Agilent Technologies Ltd., 2014 Search PubMed.
- G. M. Sheldrick, Acta Crystallogr., Sect. A: Found. Crystallogr., 2008, 64, 112–122 CrossRef CAS PubMed.
- O. V. Dolomanov, L. J. Bourhis, R. J. Gildea, J. A. K. Howard and H. Puschmann, J. Appl. Crystallogr., 2009, 42, 339–341 CrossRef CAS.
- A. A. Coehlo, TOPAS-Academic V6, Coelho Software, 2016 Search PubMed.
- A. Le Bail, H. Duroy and J. L. Fourquet, Mater. Res. Bull., 1988, 23, 447–452 CrossRef CAS.
- H. M. Rietveld, J. Appl. Crystallogr., 1969, 2, 65–71 CrossRef CAS.
- D. Sakellariou, A. Lesage, P. Hodgkinson and L. Emsley, Chem. Phys. Lett., 2000, 319, 253–260 CrossRef CAS.
- B. Elena, G. de Paepe and L. Emsley, Chem. Phys. Lett., 2004, 398, 532–538 CrossRef CAS.
- B. M. Fung, A. K. Khitrin and K. Ermolaev, J. Magn. Reson., 2000, 142, 97–101 CrossRef CAS PubMed.
- G. Metz, X. L. Wu and S. O. Smith, J. Magn. Reson., Ser. A, 1994, 110, 219–227 CrossRef CAS.
- W. Sommer, J. Gottwald, D. E. Demco and H. W. Spiess, J. Magn. Reson., Ser. A, 1995, 113, 131–134 CrossRef CAS.
- I. Schnell, A. Lupulescu, S. Hafner, D. E. Demco and H. W. Spiess, J. Magn. Reson., 1998, 133, 61–69 CrossRef CAS PubMed.
- S. Cavadini, S. Antonijevic, A. Lupulescu and G. Bodenhausen, J. Magn. Reson., 2006, 182, 168–172 CrossRef CAS PubMed.
- S. Cavadini, Prog. Nucl. Magn. Reson. Spectrosc., 2010, 56, 46–77 CrossRef CAS PubMed.
- A. S. Tatton, J. P. Bradley, D. Iuga and S. P. Brown, Z. Phys. Chem., 2012, 226, 1187–1203 CrossRef CAS.
- Z. H. Gan, J. P. Amoureux and J. Trebosc, Chem. Phys. Lett., 2007, 435, 163–169 CrossRef CAS.
- M. H. Levitt, T. G. Oas and R. G. Griffin, Isr. J. Chem., 1988, 28, 271–282 CrossRef.
- T. G. Oas, R. G. Griffin and M. H. Levitt, J. Chem. Phys., 1988, 89, 692–695 CrossRef CAS.
- D. Marion, M. Ikura, R. Tschudin and A. Bax, J. Magn. Reson., 1989, 85, 393–399 CAS.
- S. Hayashi and K. Hayamizu, Bull. Chem. Soc. Jpn., 1991, 64, 685–687 CrossRef CAS.
- C. R. Morcombe and K. W. Zilm, J. Magn. Reson., 2003, 162, 479–486 CrossRef CAS PubMed.
- S. Hayashi and K. Hayamizu, Bull. Chem. Soc. Jpn., 1991, 64, 688–690 CrossRef CAS.
- R. K. Harris, P. Y. Ghi, H. Puschmann, D. C. Apperley, U. J. Griesser, R. B. Hammond, C. Y. Ma, K. J. Roberts, G. J. Pearce, J. R. Yates and C. J. Pickard, Org. Process Res. Dev., 2005, 9, 902–910 CrossRef CAS.
- J. R. Yates, S. E. Dobbins, C. J. Pickard, F. Mauri, P. Y. Ghi and R. K. Harris, Phys. Chem. Chem. Phys., 2005, 7, 1402–1407 RSC.
- A. L. Webber, L. Emsley, R. M. Claramunt and S. P. Brown, J. Phys. Chem. A, 2010, 114, 10435–10442 CrossRef CAS PubMed.
- X. Li, L. Tapmeyer, M. Bolte and J. van de Streek, ChemPhysChem, 2016, 17, 2496–2502 CrossRef CAS PubMed.
- L. Mafra, S. M. Santos, R. Siegel, I. Alves, F. A. A. Paz, D. Dudenko and H. W. Spiess, J. Am. Chem. Soc., 2012, 134, 71–74 CrossRef CAS PubMed.
- J. Schmidt, A. Hoffmann, H. W. Spiess and D. Sebastiani, J. Phys. Chem. B, 2006, 110, 23204–23210 CrossRef CAS PubMed.
- C. Gervais, M. Profeta, V. Lafond, C. Bonhomme, T. Azaïs, H. Mutin, C. J. Pickard, F. Mauri and F. Babonneau, Magn. Reson. Chem., 2004, 42, 445–452 CrossRef CAS PubMed.
- A. C. Uldry, J. M. Griffin, J. R. Yates, M. Perez-Torralba, M. D. Maria, A. L. Webber, M. L. L. Beaumont, A. Samoson, R. M. Claramunt, C. J. Pickard and S. P. Brown, J. Am. Chem. Soc., 2008, 130, 945–954 CrossRef CAS PubMed.
- C. M. Gowda, F. Vasconcelos, E. Schwartz, E. R. H. van Eck, M. Marsman, J. J. L. M. Cornelissen, A. E. Rowan, G. A. de Wijs and A. P. M. Kentgens, Phys. Chem. Chem. Phys., 2011, 13, 13082–13095 RSC.
- S. P. Brown, Prog. Nucl. Magn. Reson. Spectrosc., 2007, 50, 199–251 CrossRef CAS.
- S. P. Brown, in Modern Methods in Solid-state NMR: A Practitioner's Guide, ed. P. Hodgkinson, Royal Society of Chemistry, London, 2018, ch. 2, pp. 39–74 Search PubMed.
- R. K. Harris, P. Jackson, L. H. Merwin, B. J. Say and G. Hagele, J. Chem. Soc., Faraday Trans. 1, 1988, 84, 3649–3672 RSC.
- L. H. Merwin and S. D. Ross, Magn. Reson. Chem., 1992, 30, 440–448 CrossRef CAS.
- A. L. Bednowitz and B. Post, Acta Crystallogr., 1966, 21, 566–571 CrossRef CAS.
Footnote |
| † Electronic supplementary information (ESI) available. CCDC 1876100. For ESI and crystallographic data in CIF or other electronic format see DOI: 10.1039/c9ce00633h |
| This journal is © The Royal Society of Chemistry 2019 |